Operator
Good morning and welcome to the first quarter 2026 results presentation for Hillman Solutions Corporation. My name is Carmen and I will be your conference call operator today. Before we begin, I would like to remind our listeners that today's presentation is being recorded and simultaneously webcast. The company's earnings release presentation and 10Q were issued this morning. These documents and a replay of today's presentation can be accessed on Hillman's Investors Relations website at ir.hillmangroup.com. I would now like to turn the call over to Michael Kaler with Hillman. Please proceed.
Thank you, Operator. Good morning, everyone, and thank you for joining us for Hillman's first quarter 2026 results presentation. I am Michael Kaler, Vice President of Corporate Development, Investor Relations, and Treasury. Joining me on today's call are Hillman's President and Chief Executive Officer, John Michael Adinolfi, or JMA as we call him, and our Chief Financial Officer, Rocky Kraft. I would like to remind our audience that certain statements made today may be considered forward looking and are subject to safe harbor provisions of applicable securities laws. These forward looking statements are not guarantees of future performance and are subject to certain risks, uncertainties, assumptions, and other factors, many of which are beyond the company's control and may cause actual results to differ materially from those projected in such statements. Some of the factors that could influence our results are contained in our periodic and annual reports filed with the SEC. For more information regarding these risks and uncertainties, please see slide 2 in our earnings call slide presentation, which is available on our website. In addition on today's call, we will refer to certain non-GAAP financial measures. Information regarding our use of and reconciliations of these measures to our gap results are available in our earnings call slide presentation. JMA will begin today's call by giving some highlights from our first-ever Investor Day last month, which included five-year financial targets. Then he will provide commentary on our quarterly results and guidance, followed by a discussion on the market and our performance by business. Rocky will then give a more detailed walk through our financial results and guidance before turning the call back over to JMA for some closing comments. Then we will open up the call for your questions. It's now my pleasure to turn the call over to our President and CEO, John Michael Adonalfi. JMA?
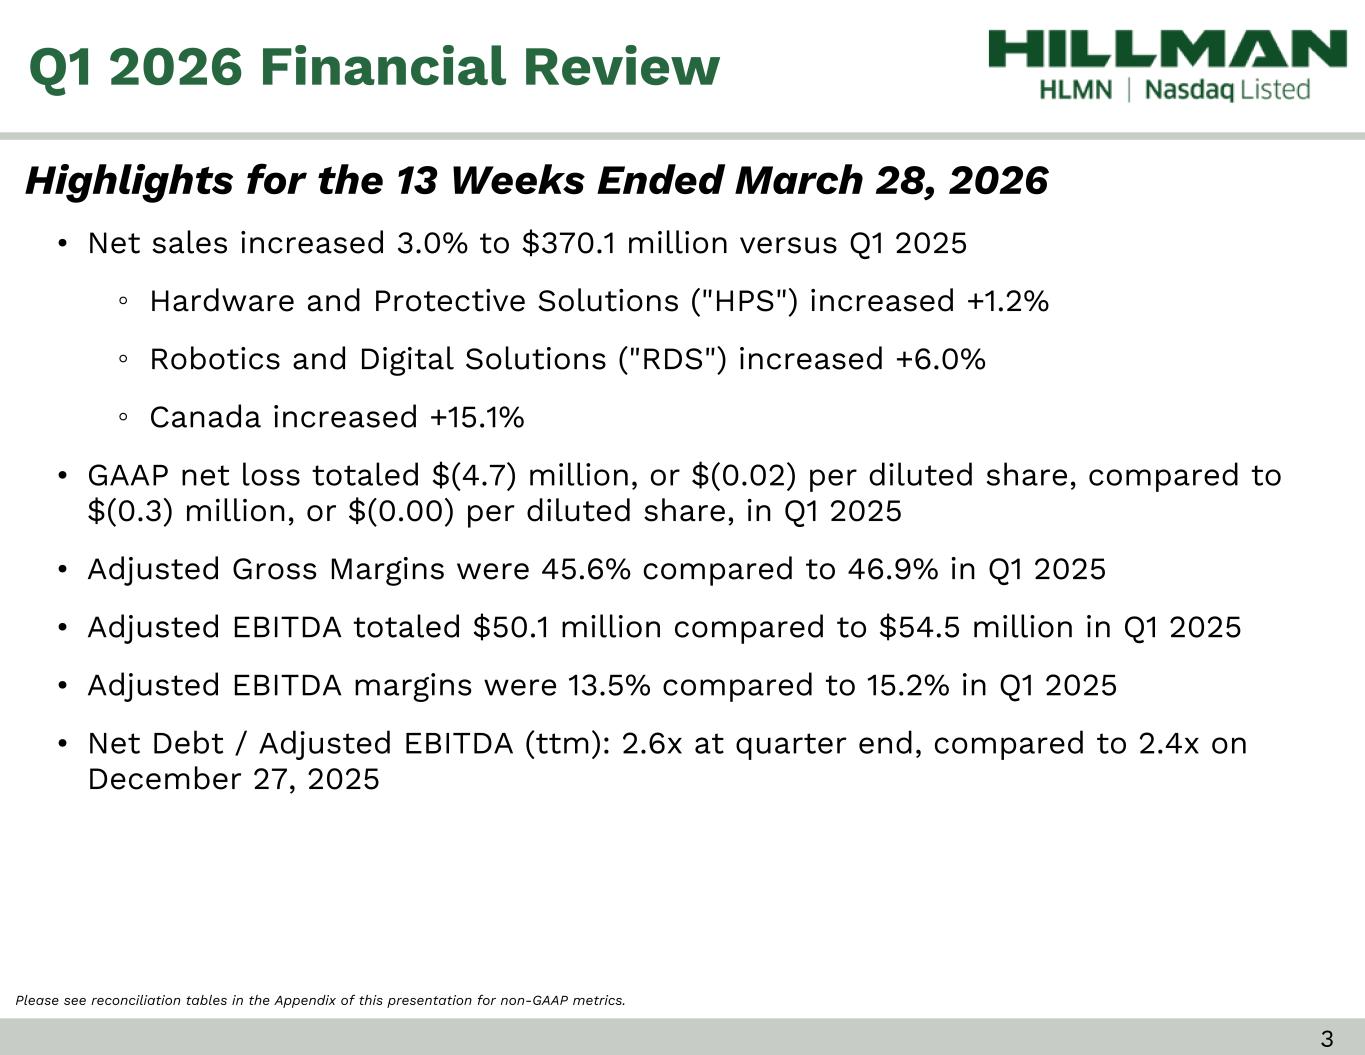
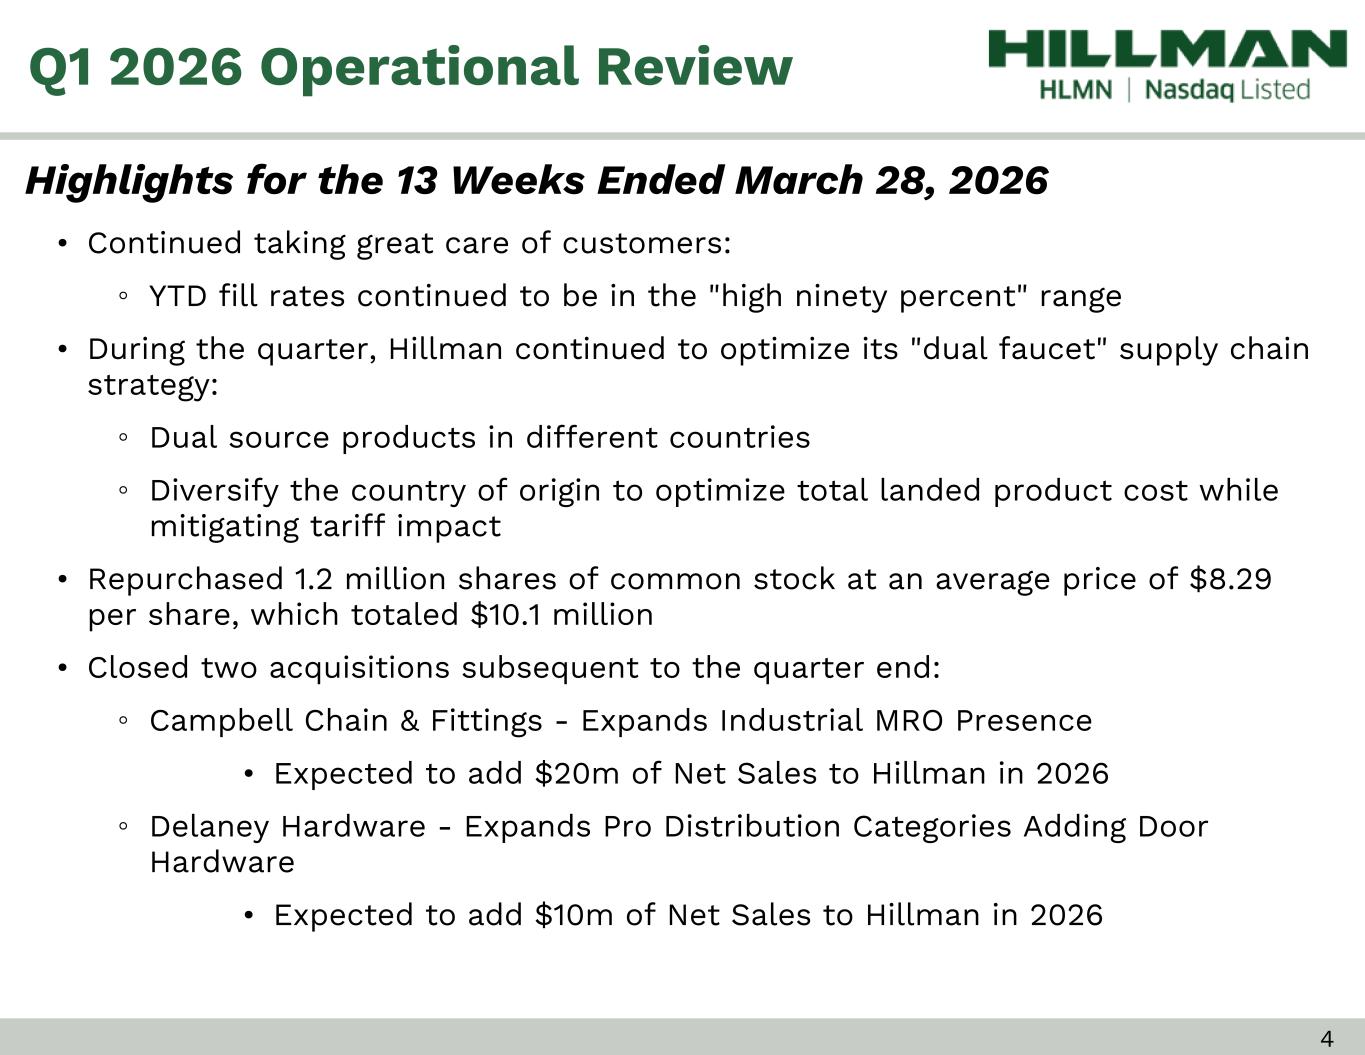
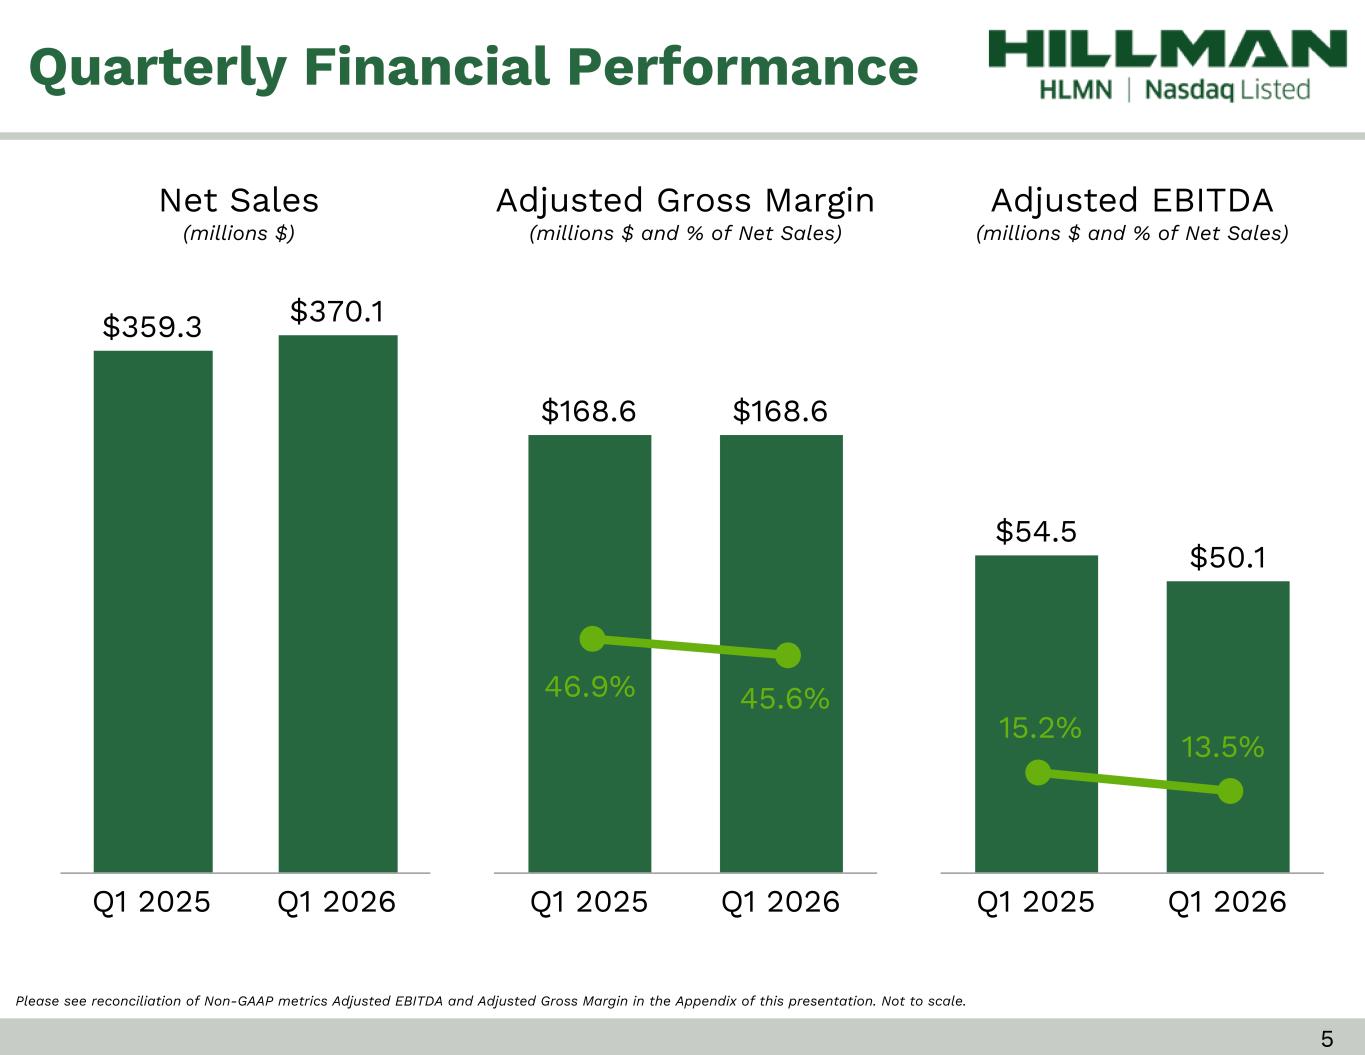
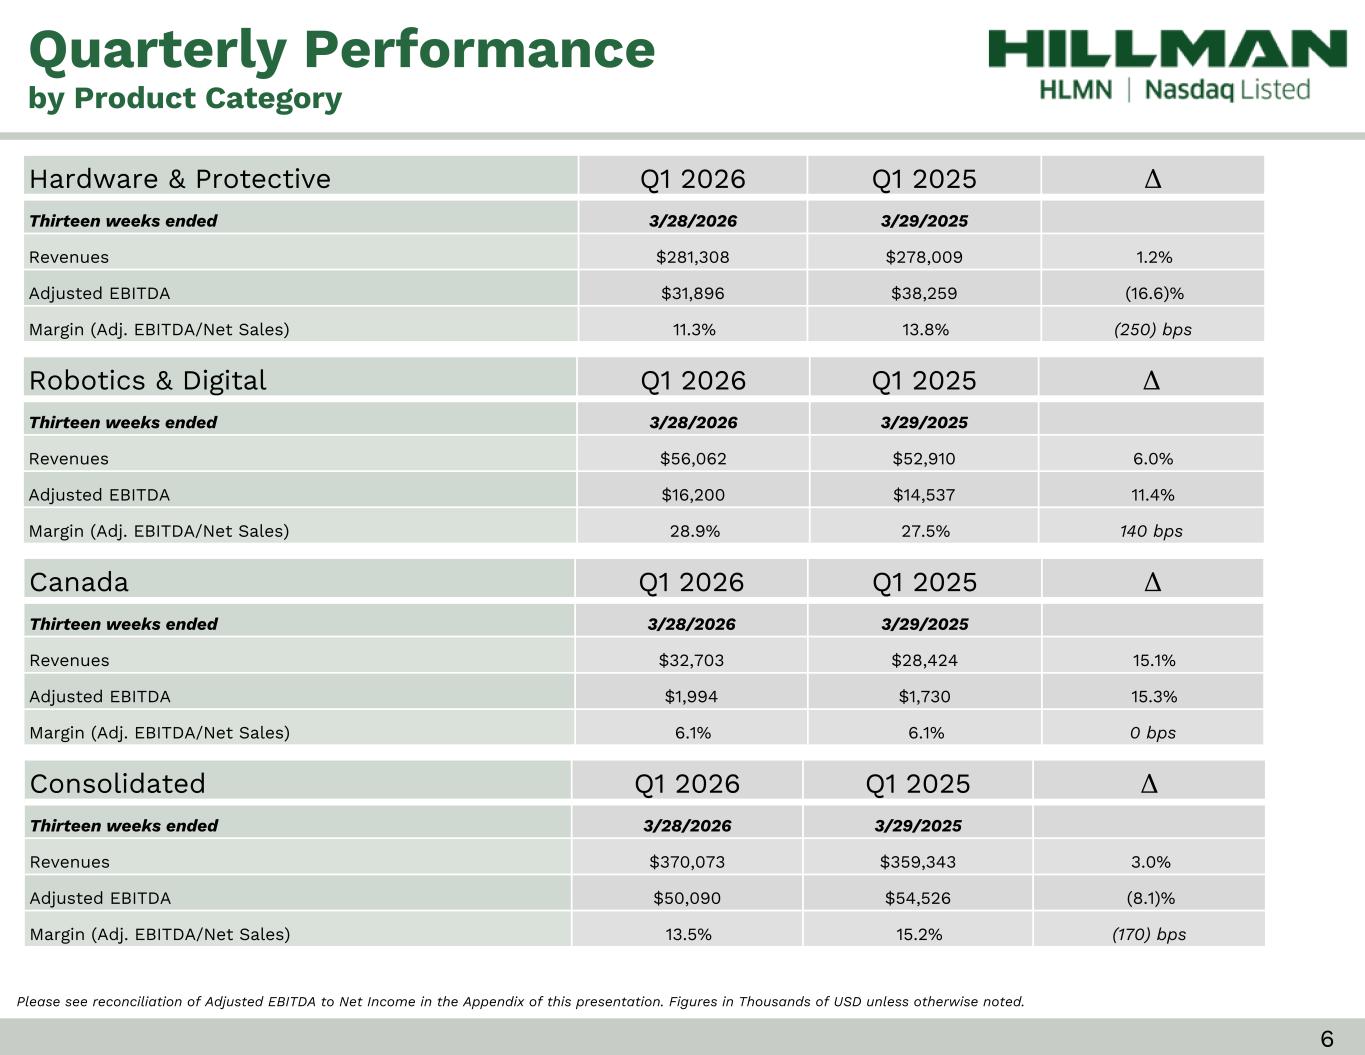
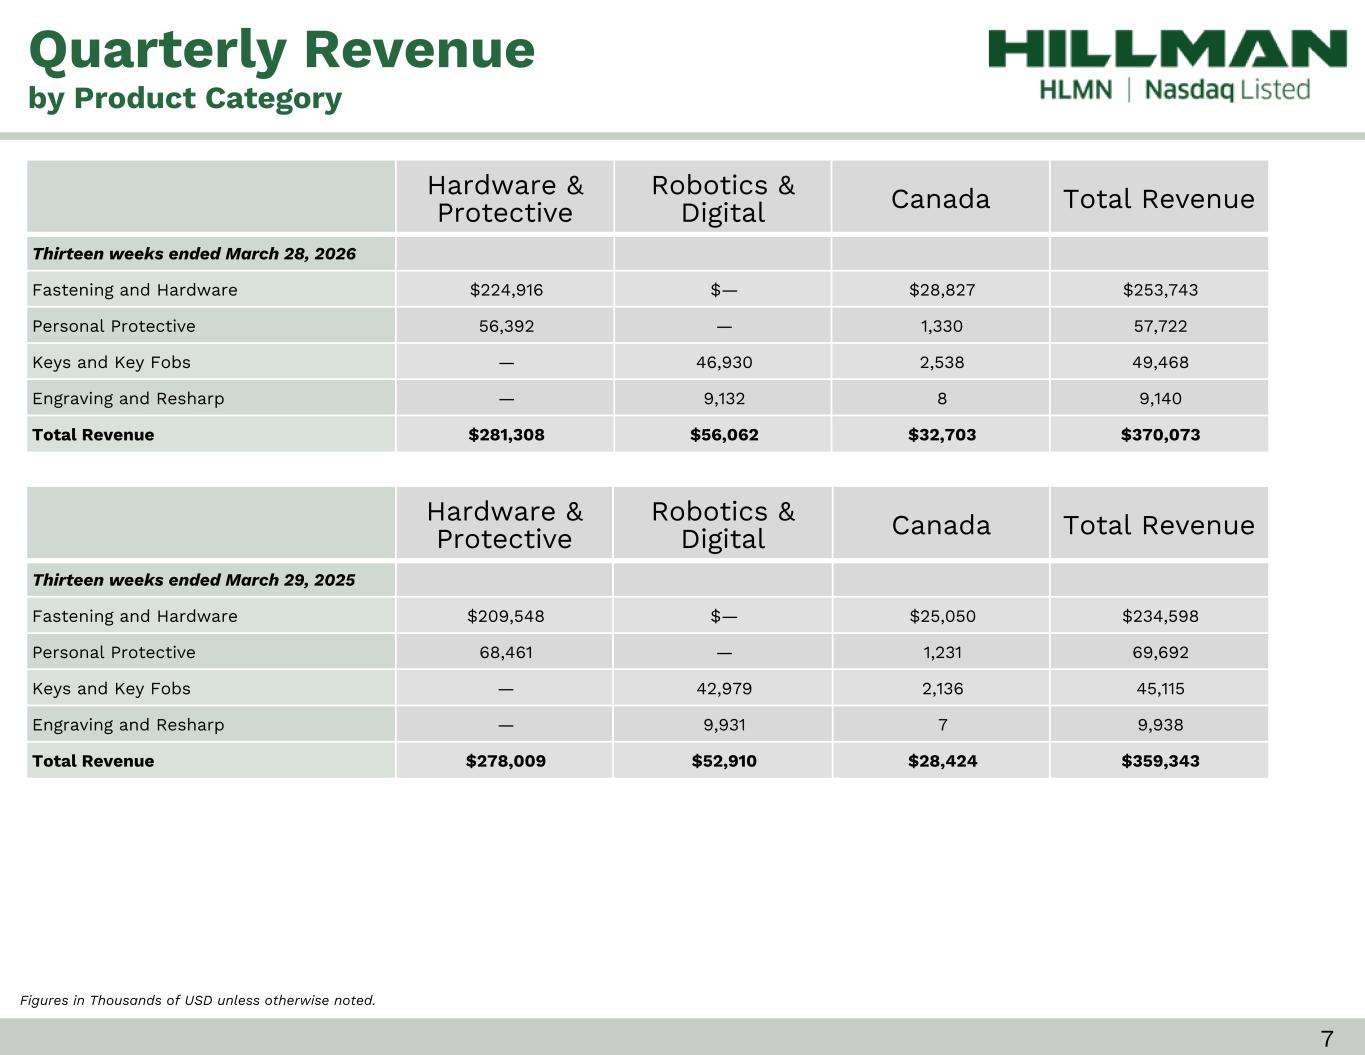
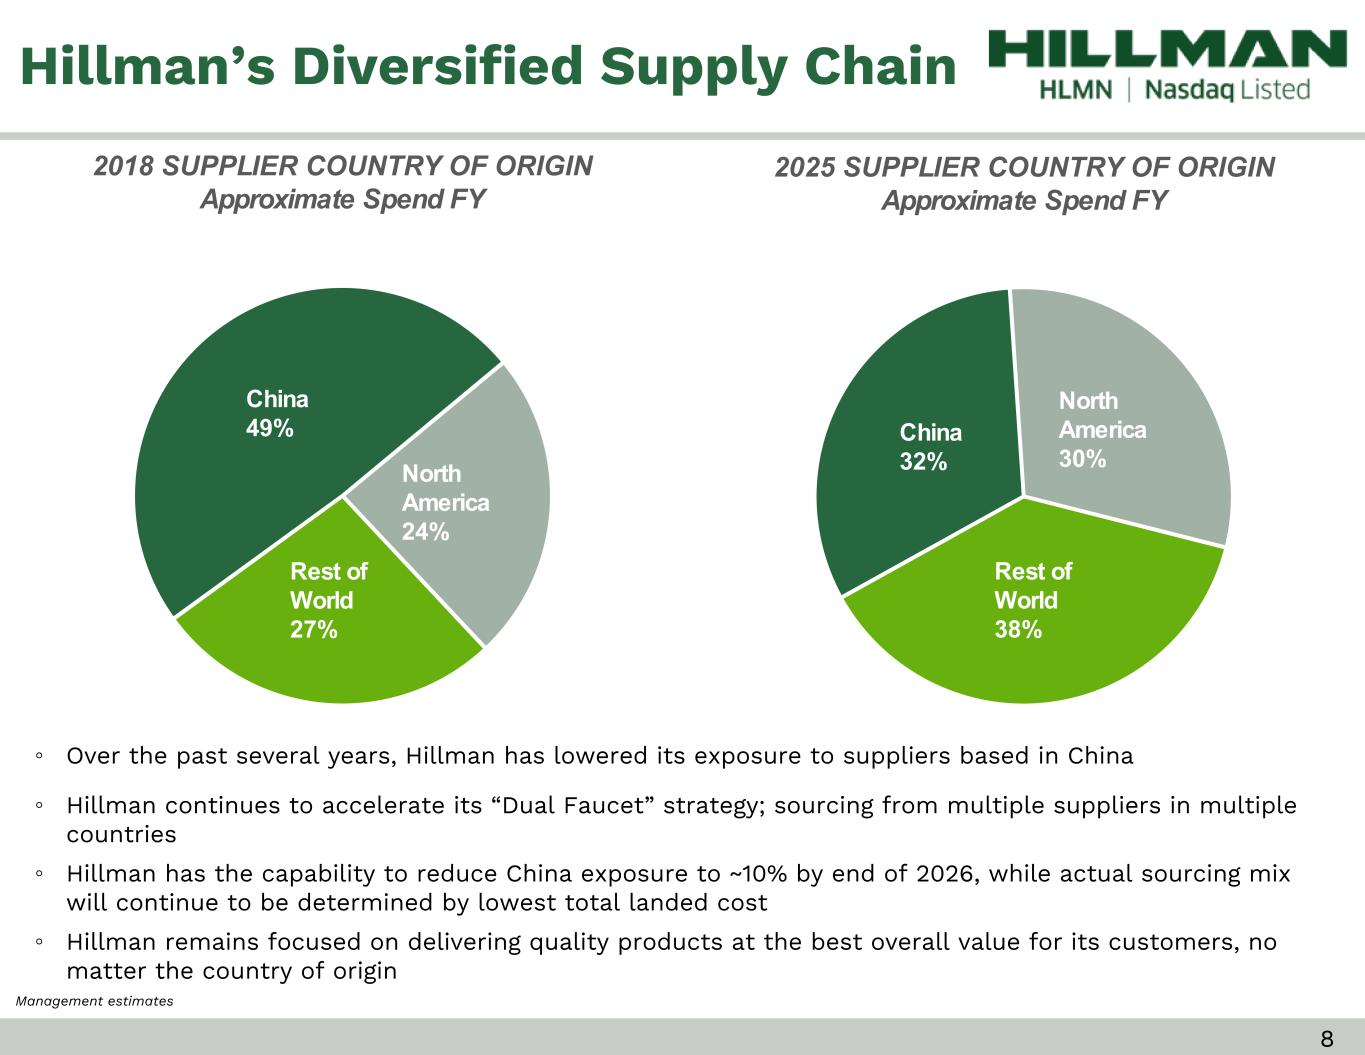
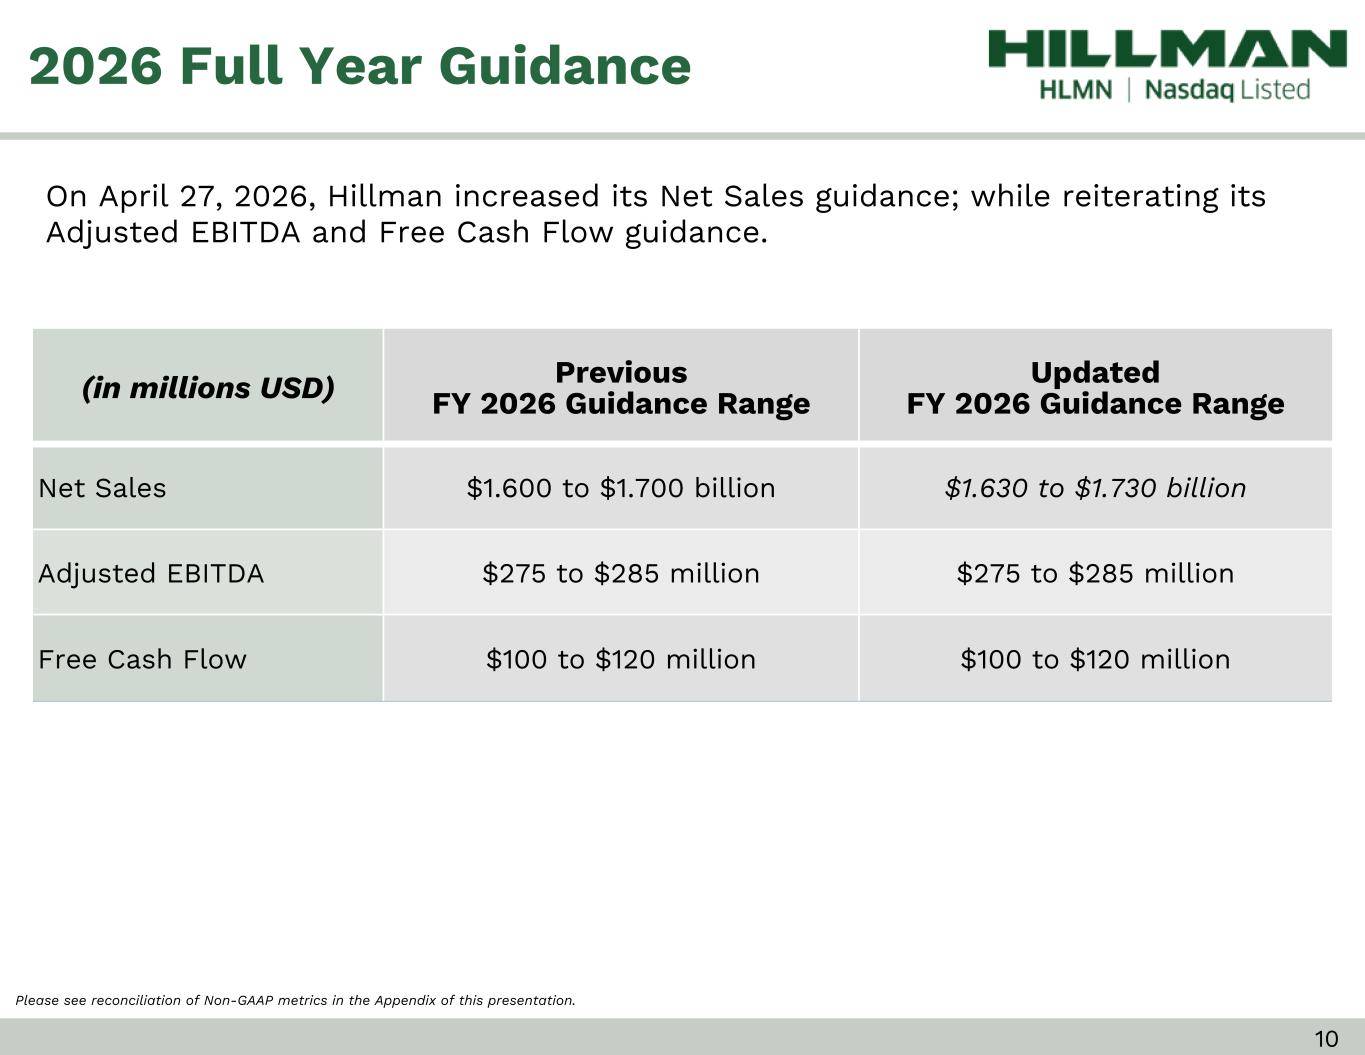
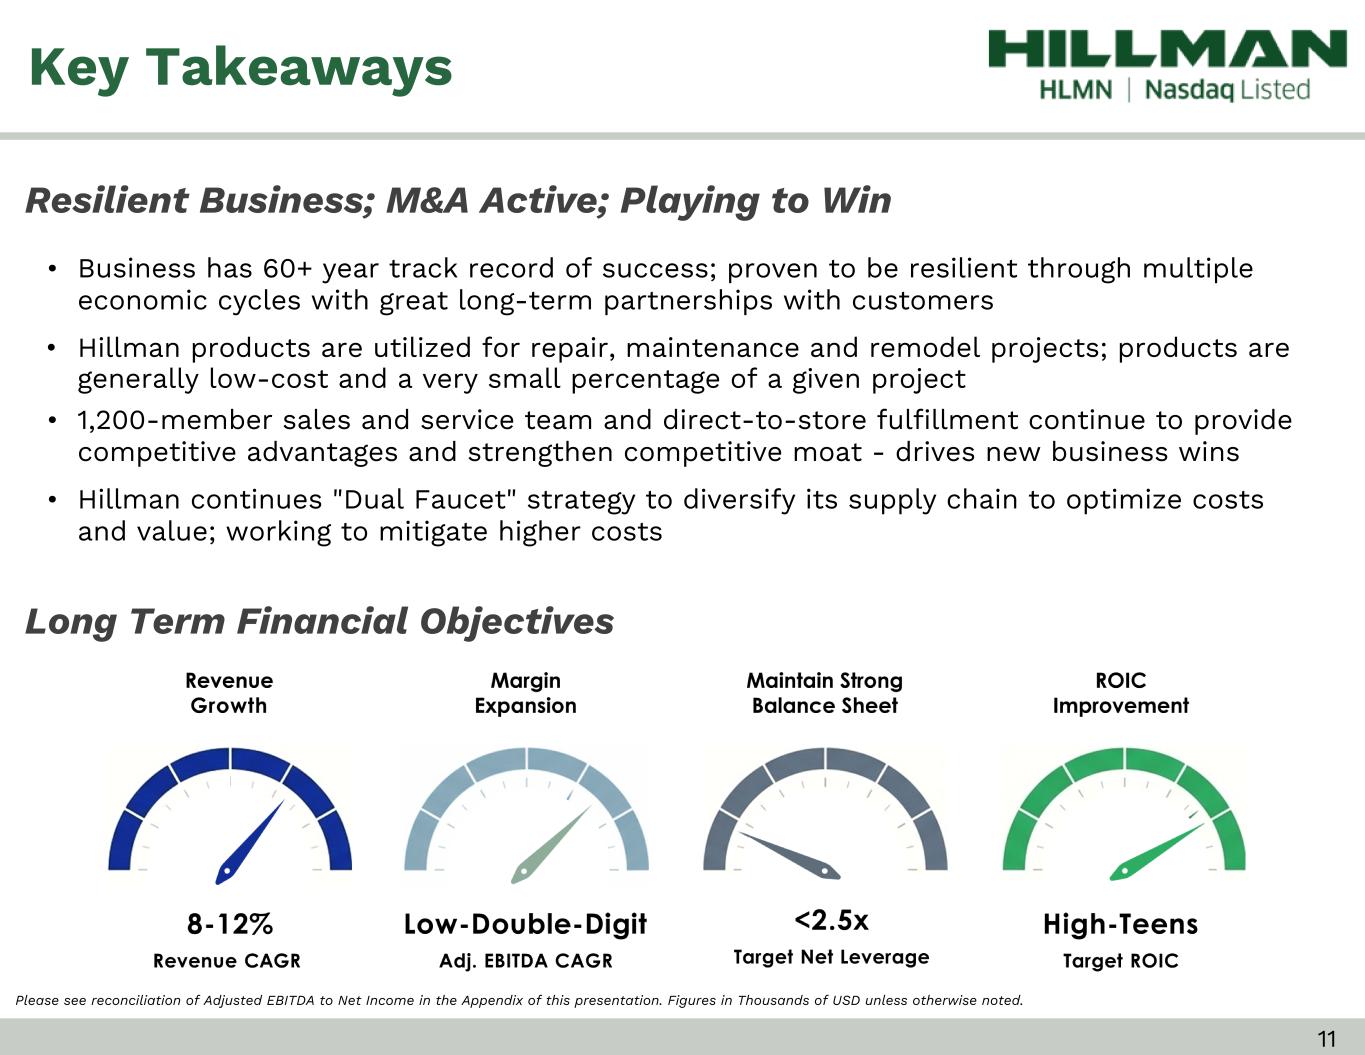
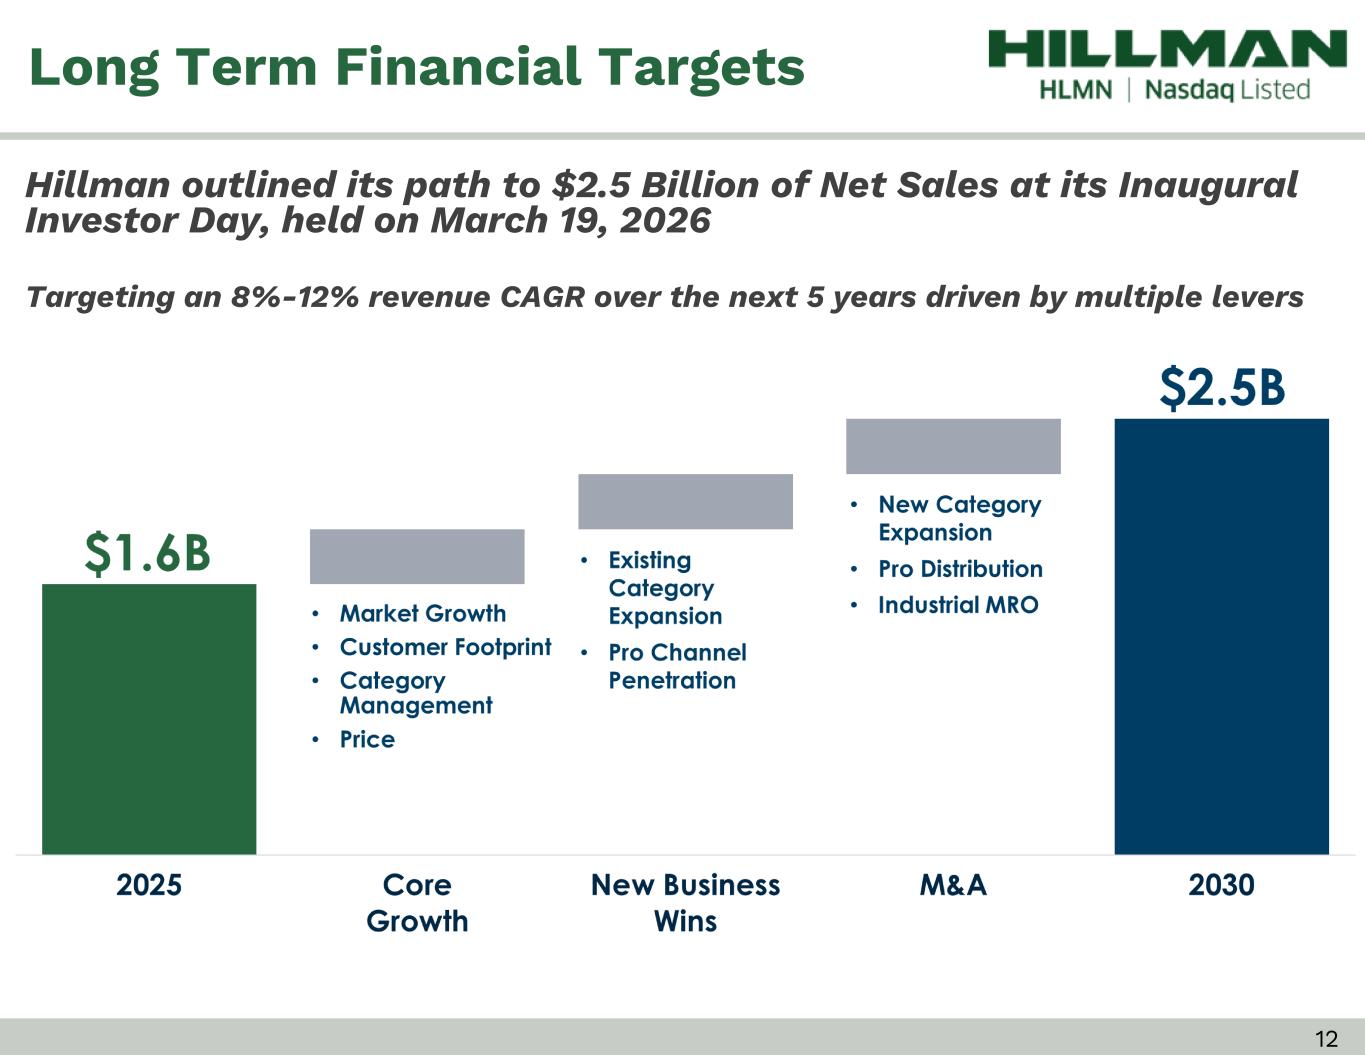
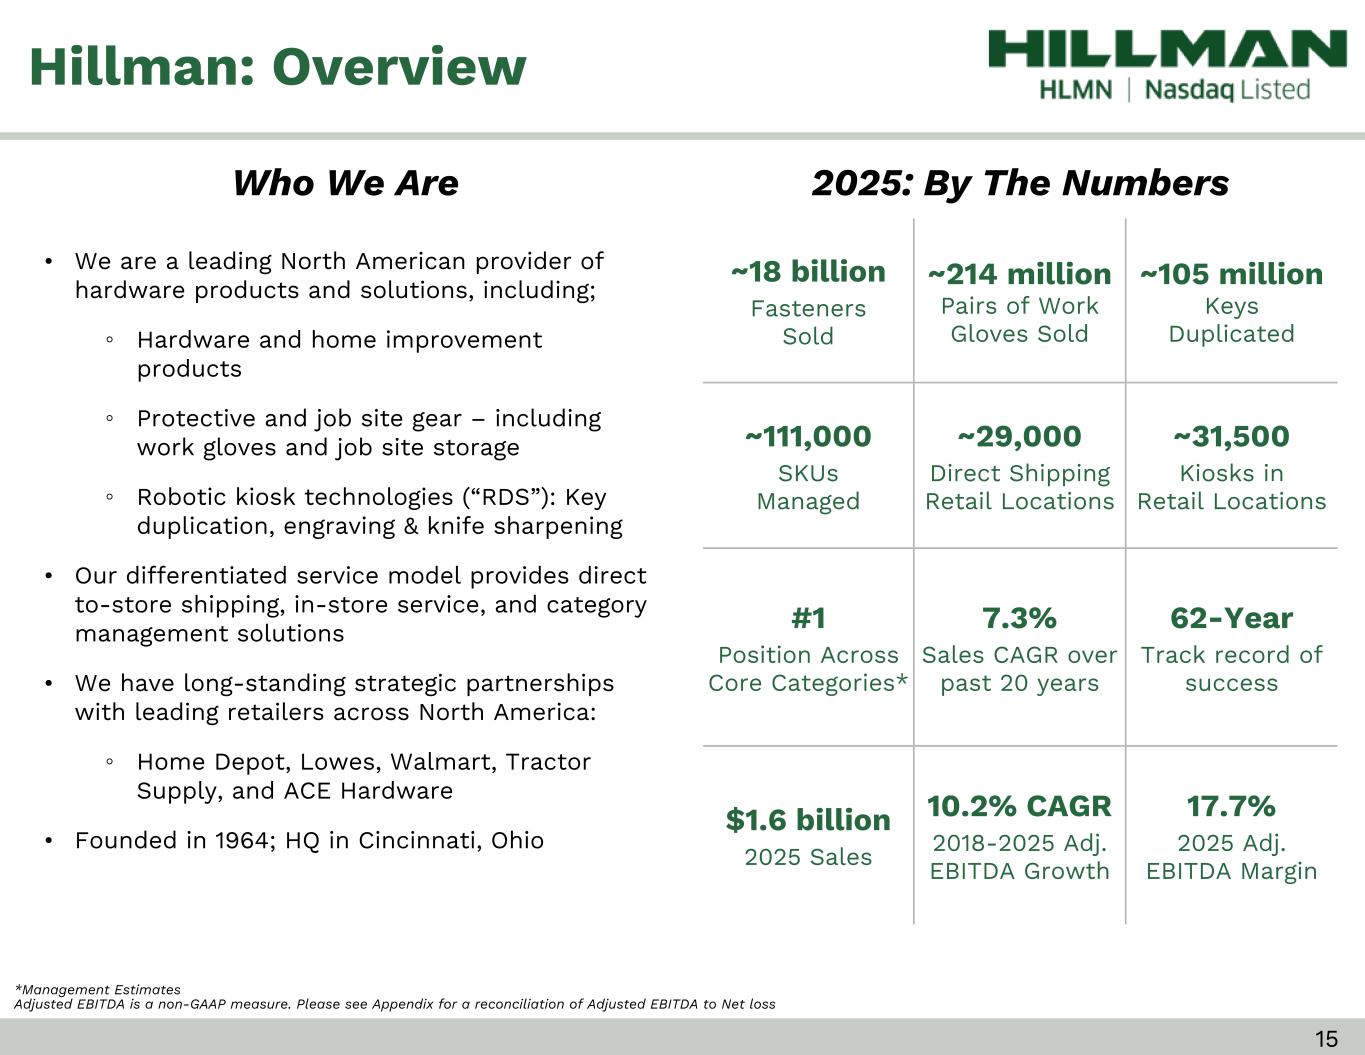
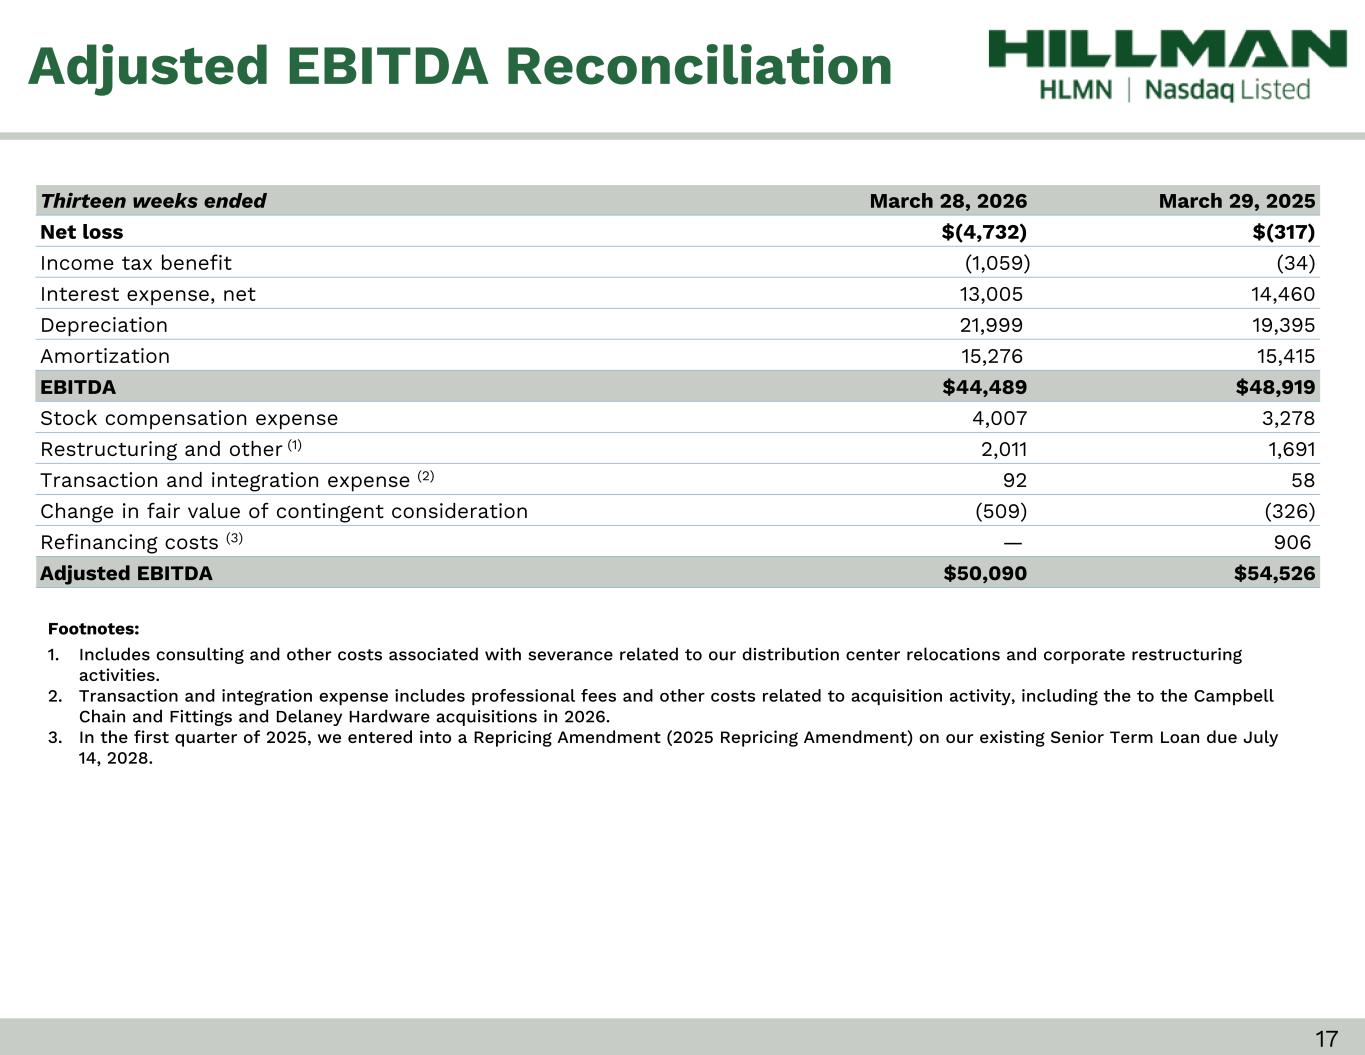
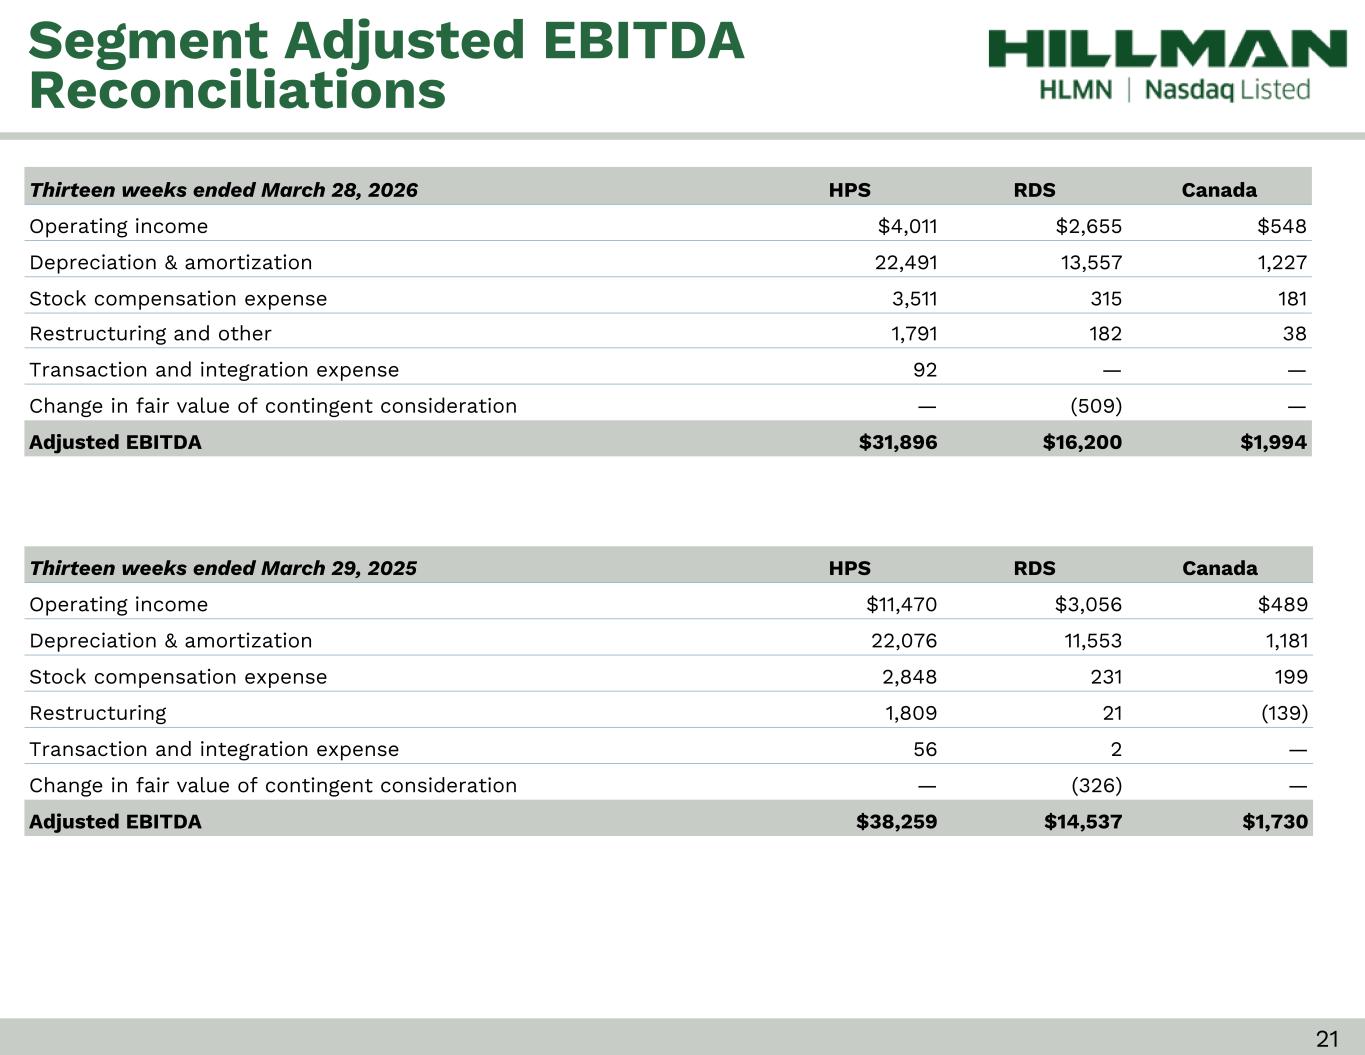
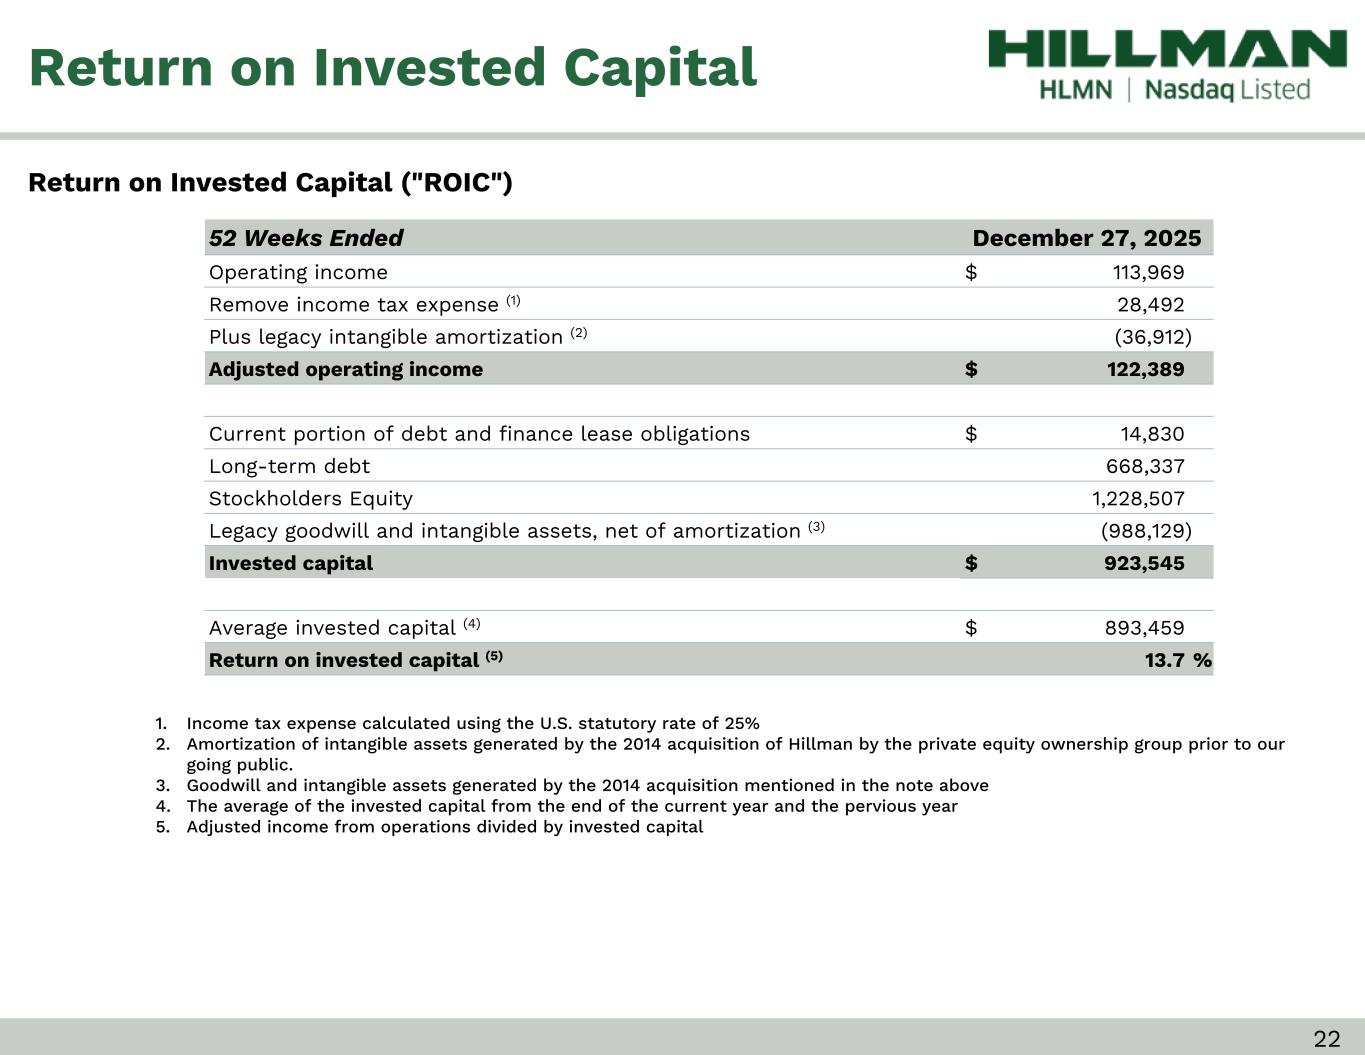
Thanks, Michael. Good morning, everyone, and thank you for joining us. Before we get into our results for the quarter, I wanted to highlight the long-term strategic initiatives we shared during last month during our first ever investor day. During our presentation, we outlined our blueprint and the catalyst for creating long-term shareholder value. During the presentation, we discussed how we win in our core business. We gave a detailed look into how our core hardware and protective solutions business is fortified by unique competitive advantages, including category leadership, product innovation, integrated operations, our 1,200-plus member field sales team, and our diverse product and category offerings. We discussed how we build on Hillman's long history of growth by expanding categories and extending into adjacent aisles with our existing customers through both organic initiatives and acquisitions. We unpacked the near-term opportunities in our robotics and digital solutions business with our Minute T3.5 rollout. We highlighted how our diverse global supply chain provides flexibility and leverage. We talked about how empowering our associates leads to an award-winning culture and efficient operations. We laid the groundwork for how we plan to win the pro and outlined the right to win in this channel. Growing the pro channel is a new critical initiative for Hellman, which provides meaningful new white space to grow and expand our addressable market by $12 billion, bringing our total addressable market to over $18 million. We detailed how we will win an industrial MRO and pro distribution, which includes specialty distribution, LBM, and growing with our existing retail customers as they go after the pro through their internal initiatives as well as the companies they acquire. Over the next five years, we are confident we will grow Hillman's total net sales to $2.5 billion in 2030. To reach this number, we are targeting 8% to 12% growth per year, which will be driven by core performance, new business wins, both at retail and in the pro channel, and M&A. During the same timeline, our goal is to grow adjusted EBITDA at a low double-digit CAGR, maintain a healthy balance sheet while targeting leverage of 2.5 times or below, and drive our return on invested capital into the high teams. with that let's go to our results net sales for the first quarter of 2026 increased three percent the quarter had a strong finish driven by an improvement in sales during march but that was not enough to make up for a slow january and february which were impacted by weather and some customer destocking we also believe the uncertainty consumers are feeling due to the current economic environment impacted our results for the quarter our growth was driven by nearly five percent lift from new business wins and a two percent headwind from our core performance as a reminder our core performance is a combination of market volume customer footprint expansion category management fx product mix and price driving our new business wins for the quarter were the Builders Hardware expansion at a top customer in the U.S., the expansion of specialty fasteners and Builders Hardware at a top customer in Canada, and the launch of a Pro Initiative at a top customer also in Canada. While M&A did not impact our first quarter results, we are pleased that subsequent to the end of the quarter, we close on two acquisitions, Campbell Chain and Fittings and Delaney Hardware. Campbell Chain is a U.S.-based manufacturer of chain and related products, which expands Hillman's chain offering into higher-grade industrial products. The deal strengthens our position in industrial MRO channel and builds on our recent entry into chain category with our acquisition of Cook in 2024. Founded in 1919, Campbell serves a broad range of industrial, commercial, and retail customers and will make a great addition to Hillman. Delaney Hardware expands our pro-distribution channel by adding door hardware to our product categories. Delaney supplies lock steps, deadbolts, and smart locks, and related products to builders, contractors, and distributors, primarily in the Southeast U.S. The acquisition strengthens our pro-distribution strategy and will serve as a platform from which we can expand in the future to serve the pro. We anticipate that Campbell will contribute over $20 million of net sales, and Delaney will contribute over $10 million of net sales to Hillman this year. Therefore, we expect M&A will contribute an additional $30 million of net sales and a very modest amount of bottom-line growth to Hillman during 2026. Both acquisitions will be accretive, fit our strategy, and will provide excellent growth and profitability opportunities for Hillman. Customers are excited about Hillman being the new owners of both Campbell and Delaney, and our early feedback has been very positive. As such, we are raising our full year's net sales guidance range by the same amount. We anticipate that our full year net sales will be between $1.63 billion to $1.73 billion, with a midpoint of $1.68 billion. Our increased net sales midpoint now represents 8% growth over last year, which is in line with our long-term growth target. We are reiterating both our full-year 2026 adjusted EBITDA and free cash flow guidance. We expect our full-year adjusted EBITDA to be between $275 to $285 million and our full-year free cash flow to be between $100 and $120 million. Since our founding over 62 years ago, we have navigated all kinds of economic cycles. in challenging environments. We view today's uncertain times as another challenge that we will manage through. Our top line growth during the quarter demonstrates the resilience of Hillman's model and the ability to navigate this environment as well. As we have seen throughout the last year, changes in Terra policy happen quickly and shift the market rapidly. Our dual faucet supply chain allows us to react to these changes so that we can consistently deliver high quality products to our customers at the best value. Over the past few months, there have been some puts and takes resulting from changing policy and legal rulings. Altogether, the impact on Hillman has not changed materially over the past few quarters. It remains around $150 million annually. The timing of how tariffs have impacted our bottom line have been and will continue to be choppy. As you know, we rolled out price increases during the second half of 2025, yet most of our higher tariff costs just started impacting our P&L the first quarter of 2026. The result was an outsized benefits to earnings, which peaked during Q3 of 2025. On the contrary, there was an outsized impact to our cash flow, as we had to pay for those higher cost goods during 2025 without benefiting from the related higher cash receipts. Our earnings and cash flow during the quarter were fully impacted by higher prices and higher costs resulting from tariffs. Managing tariffs has been a tremendous effort throughout the Hillman organization. Our top priority is always, and especially during this tariff uncertainty, to deliver high-quality products at a good value to our customers with orders delivered on time and in full. Like others, on April 20th, we began the process to initiate IEPA tariff refunds via the Consolidated Administration and Processing of Entries platform. At this point, there are lots of unknowns, including the potential impact to Helmand. And remember, following the ruling that certain IEPA tariffs were deemed illegal, there were quickly new tariffs put in place, so the net impact to Helmand is neutral. More recently, the price of oil has increased. While oil and gas prices have limited impact on our product costs, areas like packaging and freight are directly impacted. Because of the timing of how costs flow through our income statement, we believe the impact of inflation driven by higher oil prices will not be significant during 2026. That said, we are monitoring this headwind closely, and if these amounts do become material, we will price for them as we've done in the past. Despite all this, our team has not lost focus on taking great care of our customers, winning new business, and consistently striving to make our operations more efficient. Now let's turn to our results for the quarter. Net sales in the first quarter of 2026 totaled $370.1 million, which was an increase of 3% versus the first quarter of 2025. For the quarter, adjusted EBITDA decreased 8% to $50.1 million compared to $54.5 million during the year-ago quarter. As expected, and as we said on our last earnings call, we had a high-cost inventory flowing through income statement given the timing of high reciprocal tariffs from last year. This coupled with soft volume and the slower nature of the first quarter weighed on our adjusted EBITDA during the quarter. Our biggest segment, Hardware and Protective Solutions, or HPS, increased 1.2% versus Q1 of 2025. HS performed well for the quarter, up 7%, driven by a 3% lift from new business wins, coupled with a 4% lift in core performance. PS had a tough quarter, down 17% total. Weighing in the results in PS with a decrease in promotional off-shelf activity, de-stocking, and lower sell-through of gloves. We remain committed to working with our PS customers providing merchandising solutions for gloves and work gear, and we expect to see PS improve throughout the year, but it is expected to remain below 2025 levels for the full year. Robotics and Digital Solutions, or RDS, had a great quarter, driving healthy, top-line growth, showing leverage in its bottom-line performance. Net sales were up 6% versus the year-ago quarter, and adjusted EBITDA increased by 11.4% to $16.2 million. We have not seen top-line growth like this in RDS since 2021. Adjusted gross margins and adjusted EBITDA margins were both healthy, totaling 74.7% and 28.9% respectively. driving our performance during the quarter was our mini key 3.5 rollout as this strategy is gaining traction today we have approximately 3,900 mini key 3.5 machines in the field an increase of over 400 since our last earnings call in february we expect to end 2026 with over 5,000 mini key 3.5 machines in the field and are on track to finish these rollouts of these kiosks Turning to Canada, net sales in our Canadian business during the quarter increased 15.1% compared to the prior year quarter. Driving the increase was 15% increase in new business wins with flat core performance. New business was driven by specialty fasteners, builders hardware, and pro wins at a top customer that I mentioned earlier. We are pleased to see Canada return to growth during the quarter. Overall, we navigated the environment well this quarter, and we expect an improvement in our business as we shift from our busy to our busy spring season and summer selling seasons. The Hillman team is focused on operational discipline, consistent execution, and taking great care of our customers. We believe doing so enabled us to generate consistent results no matter the market. With that, let me turn it over to Rocky to talk financials and guidance.
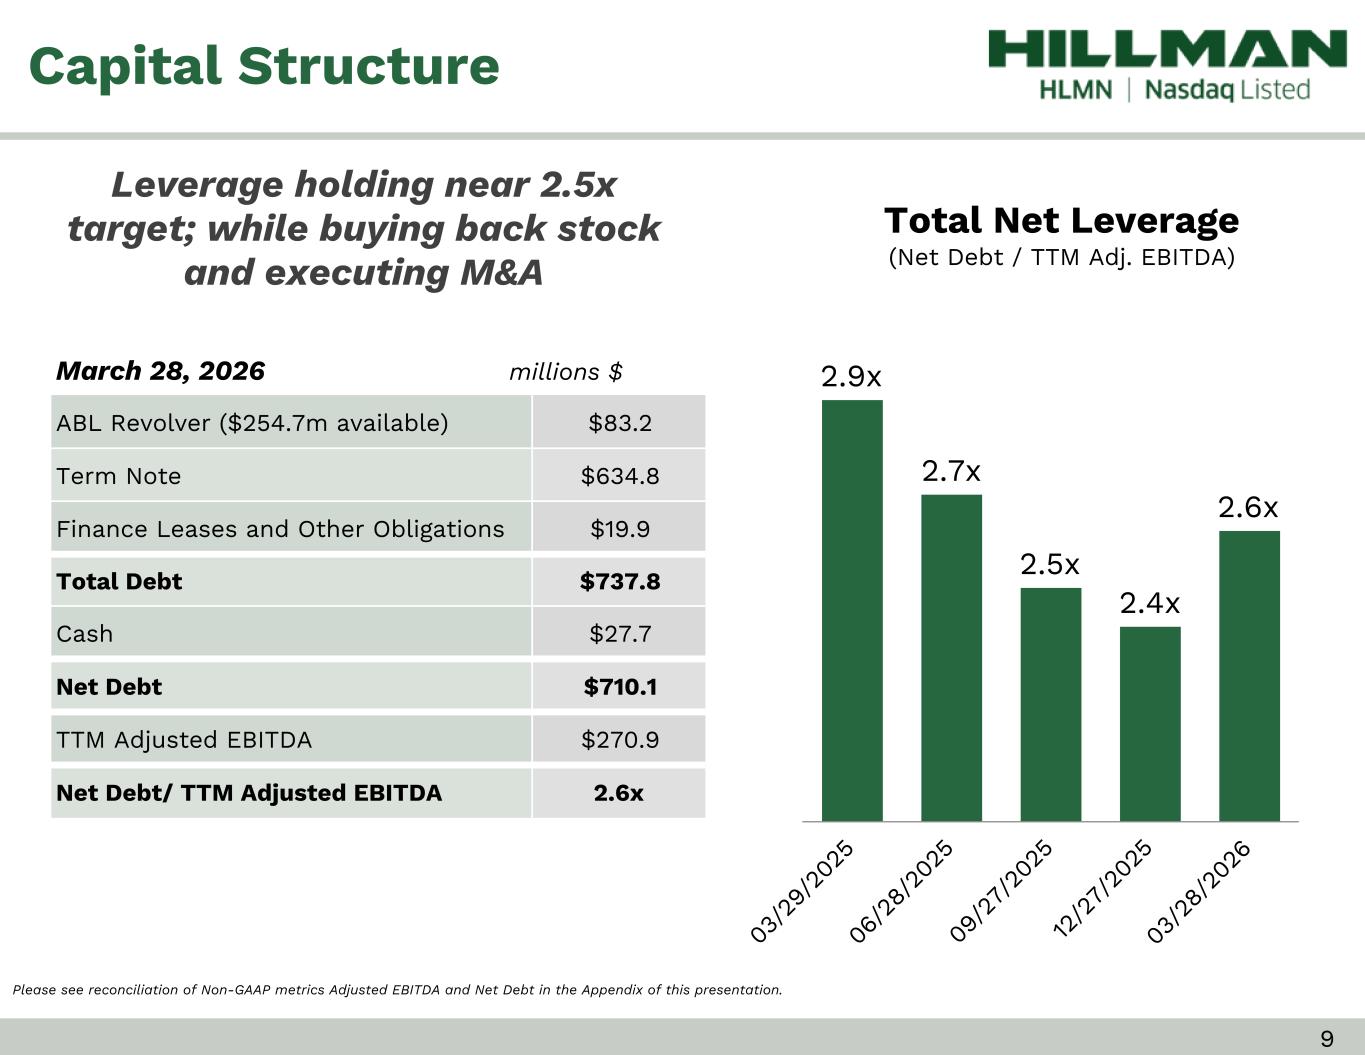
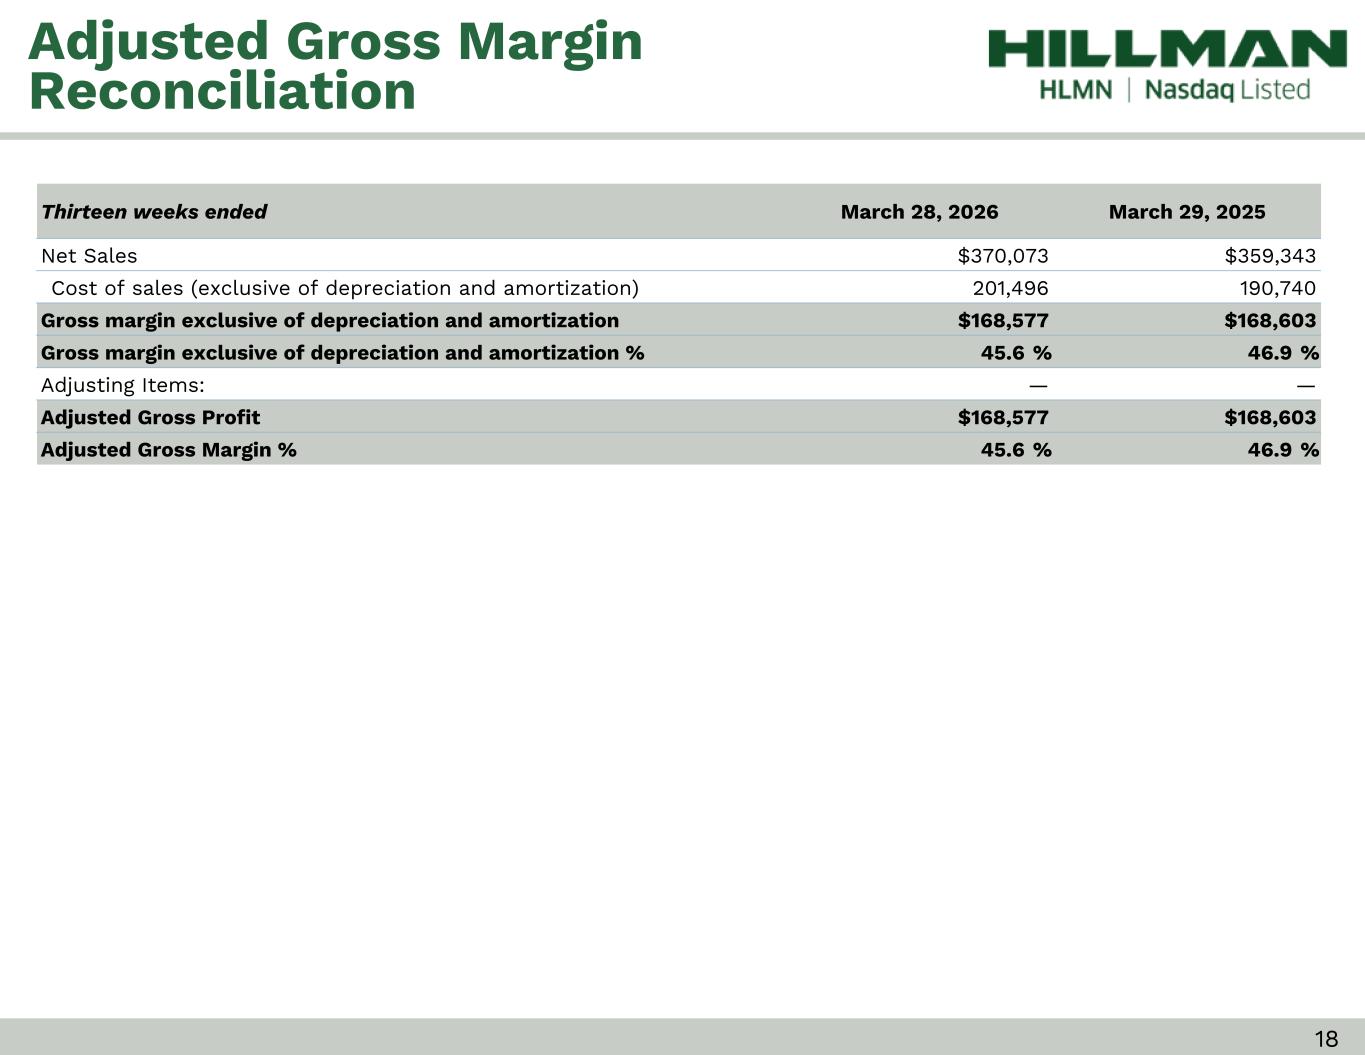
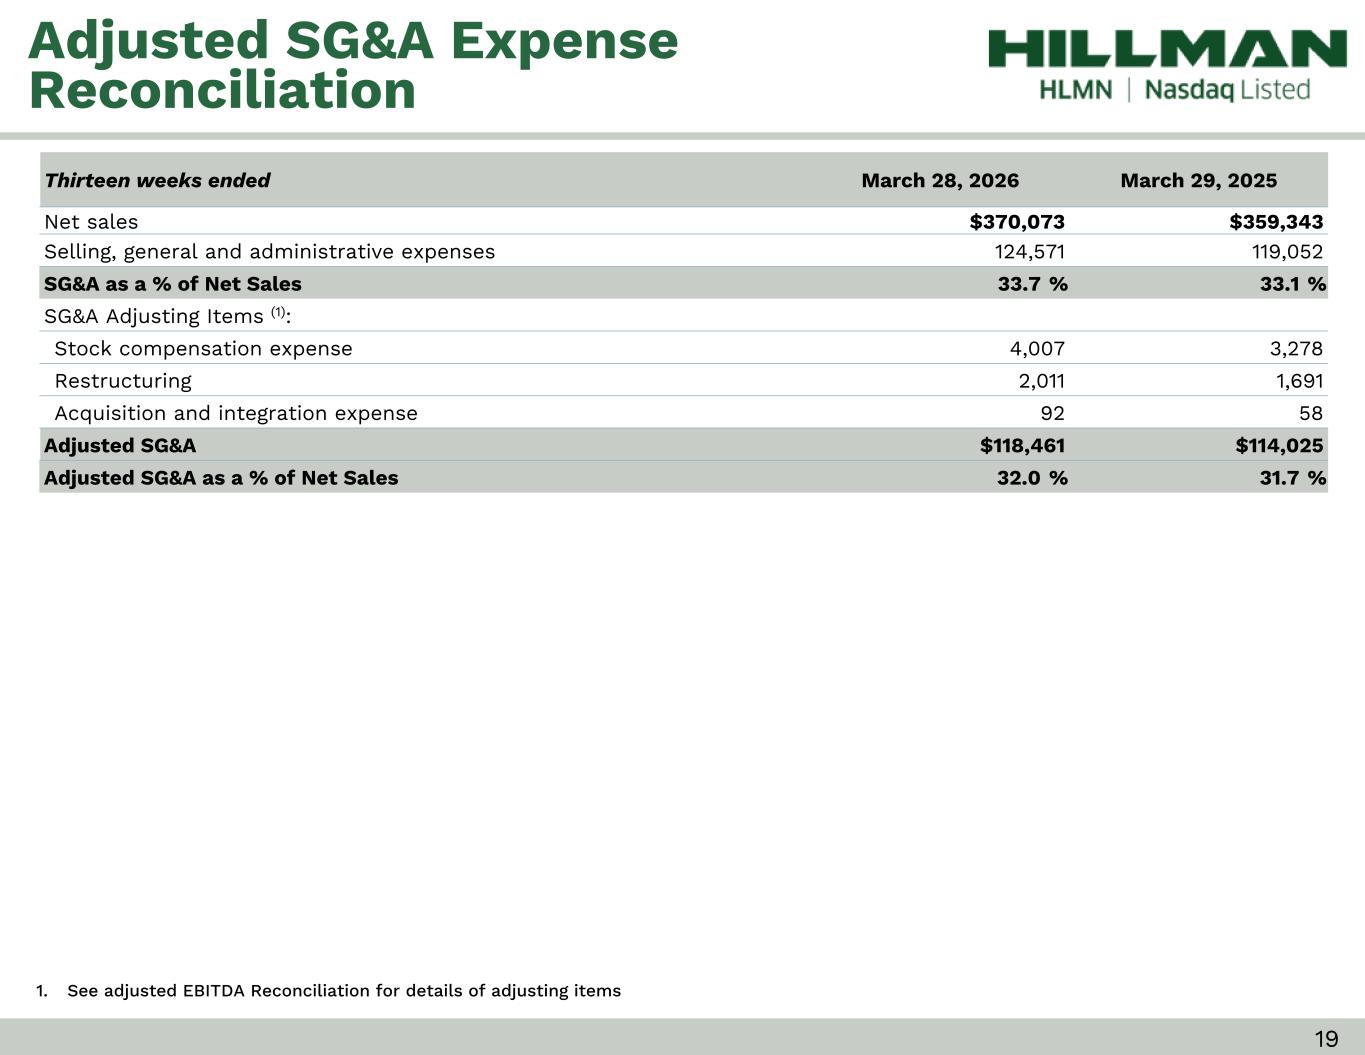
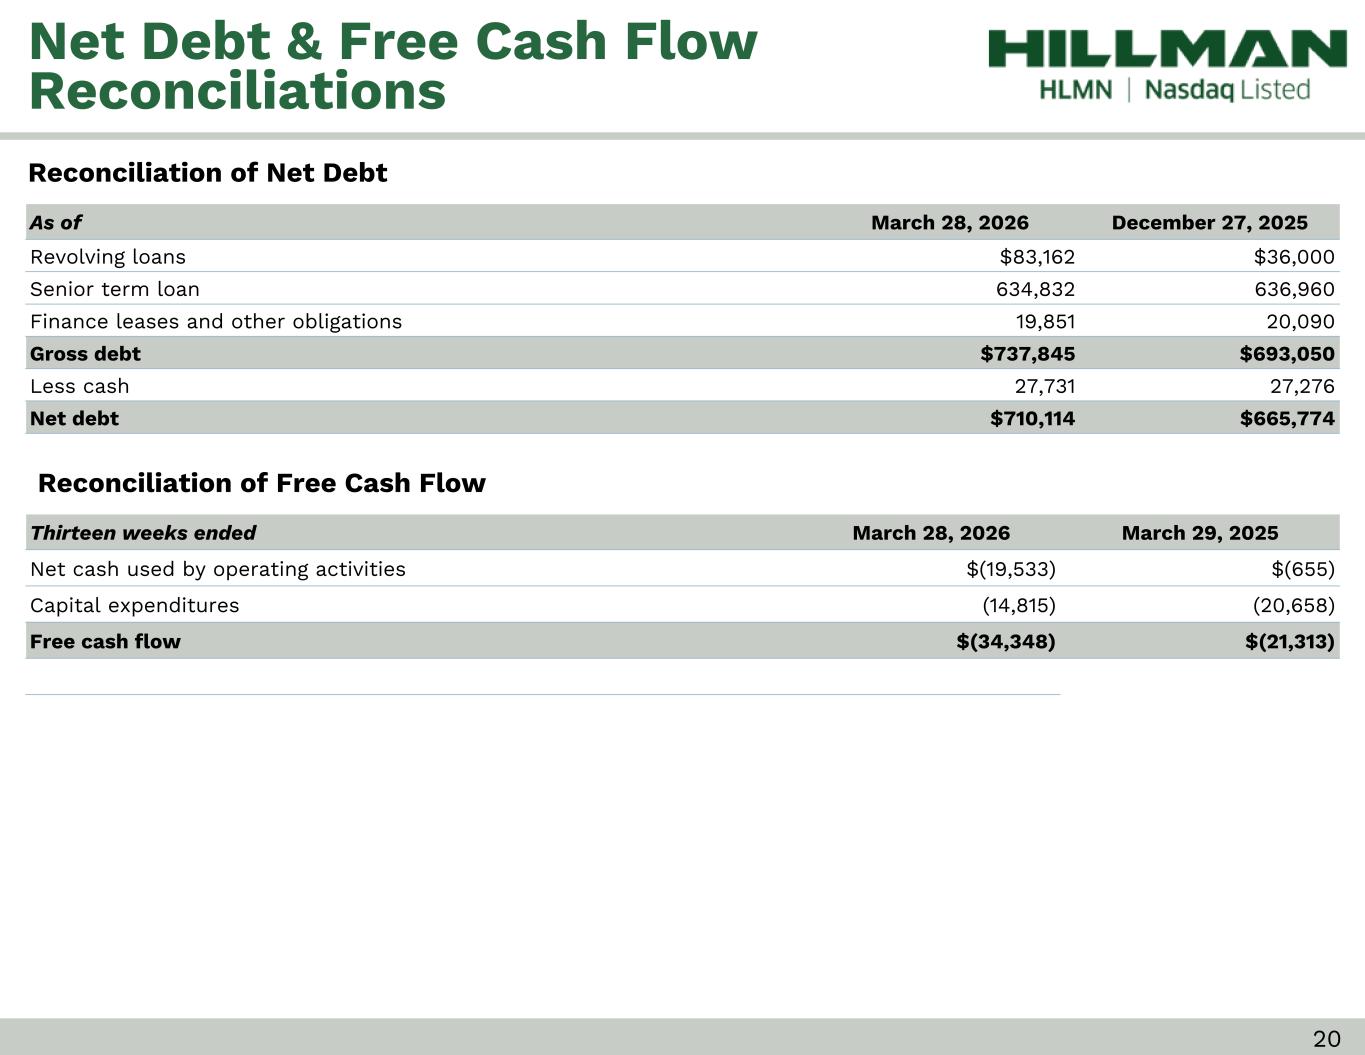
Rocky? Thanks, JMA. Let's get to our results, then we'll review our guidance. Net sales in the first quarter of 2026 totaled $370.1 million, an increase of 3% versus the prior year quarter. First quarter adjusted gross margin decreased by 130 basis points to 45.6% versus the prior year quarter. Adjusted to SG&A as a percentage of sales was 32% during the quarter, which was in line with the year-ago quarter. Adjusted EBITDA in the first quarter told $50.1 million, decreasing 8% versus the year-ago quarter. Adjusted EBITDA to net sales margin during the quarter decreased by 170 basis points from a year ago to 13.5%. As JMA mentioned, and we told you during our last earnings call, because of tariffs and the timing of how costs flow through our income statement, our adjusted gross margin and adjusted EBITDA to net sales margin for Q1 will be the lowest of the year. As 2026 goes on, we expect to see margins improve as we work through high-cost tariff impacted inventory. This, coupled with soft volume and the slower nature of the first quarter, weighed on our results. Let me turn to cash flow. For the quarter, net cash used for operating activities was $19.5 million and free cash flow was negative $34.3 million. Both were in line with our expectations as we prepared for our busy spring and summer selling seasons with an increase of working capital while prudently trimming a modest amount of net inventory. Next, let me turn to leverage in liquidity. We ended the first quarter of 2026 with $710 million of total net debt outstanding, which increased by $44 million from the end of the last year. Liquidity available totaled $282 million, consisting of $255 million of availability on our credit facility and $28 million of cash and equivalents. At quarter end, our net debt to trailing 12-month adjusted EBITDA ratio was 2.6 times versus 2.4 times at the end of 2025. The acquisitions we closed following the end of the quarter will not have a material impact on our liquidity or our leverage ratio. During the quarter, we deployed $10.1 million to buy back 1.2 million shares at an average price of $8.29 per share. Our repurchase activity during the quarter accelerated as we opportunistically bought more stock back given the valuation and share price. Our objective remains to offset dilution resulting from employee equity grants and opportunistically buying stock back if there is a meaningful discount between the value of Hillman and where the stock is trading. We plan to continue buying stock on a regular basis. Now turning to our guidance. As JMA mentioned, we are raising our full year net sales guidance by $30 million, which is the result of the contribution from Campbell and Delaney that closed after the quarter ended. We now anticipate 2026 net sales to be between $1.63 billion to $1.73 billion, with a midpoint of $1.68 billion. We are reiterating both our full year 2026 adjusted EBITDA and free cash flow guidance. We expect our full year 2026 adjusted EBITDA to be between $275 and $285 million, and our full year 2026 free cash flow to be between $100 and $120 million. Adjusted gross margins for the year should be between 46 and 47%, and we expect these margins to improve sequentially throughout the year. We are confident we can continue to navigate this market well. We're well positioned to capitalize on opportunities as they arise and drive long-term value for our shareholders through the rest of this year and beyond. With that, JMA, back to you. Thanks, Rocky.
We are pleased with our performance during the quarter. Operationally, we ran the business well and took great care of our customers. Our hardware business had a solid quarter, growing 7% of the top line. RDS was strong during the quarter, growing 6% of the top line. and we are excited about the momentum we're seeing in the business, and we look forward to the rest of the year. Canada had an excellent quarter of 15%, having executed some meaningful new business wins. And lastly, our pro and industrial teams were both off to a great start, showing strong growth during the quarter. In a period marked by macro uncertainty, shifting policies, and ongoing volatility across the markets, our teams executed well, delivered strong growth and discipline. Before I wrap up, I want to once again thank the entire Hillman team for their hard work during the quarter. We are very excited to welcome the team from Campbell and the team from Delaney to Hillman. These two companies are a great fit in our blueprint for creating long-term value and we can't wait to grow together. Looking ahead, we are staying focused on what we can control, operations, execution, and proper allocation of resources. We We will do this while seeking to strengthen our customer relationships and support their ever-evolving needs in a dynamic environment. Hillman is well-positioned for what's ahead and I'm optimistic about where we will take the business from here. With that, I'll turn it back to the operator for the Q&A portion of the call. Operator, please open the call for questions.
Operator
Thank you. And as a reminder, to ask a question, press star 11 on your telephone and wait for your name to be announced. To remove yourself, press star 1-1 again. Please limit yourself to one question with one follow-up and hop back in the queue. One moment while we compile the Q&A roster. First question comes from Lee Jagoda with CJS Securities. Please proceed. Hi, good morning, guys.
So I guess, JMA, I'll start with just trying to get a little more color on some of your comments around the de-stocking activities that were in the prepared remarks. Um, where are those customers from like an inventory position standpoint and how should we be thinking about this dynamic over the next couple of quarters?
Yeah, I mean, we, you know, when we look at it, Lee, from our business, we really saw de-stocking only in our PS business. We feel, you know, our overall business and our customers have rebalanced throughout 2025 into 2026. So that is a short-term dynamic for us. And we feel like the worst of that is behind us.
And then, um, I guess shifting to some of your analyst day commentary, you know, when you rolled out this pro initiative to the world, and then it sounded like to some extent your sales force was learning on the fly about, you know, what they could sell and, you know, the more tools in their toolbox. What's been the initial feedback from customers, from the sales force, you know, around the pro strategy, and are there any early successes you want to call out?
Yeah, thanks, Lee. You know, we're really excited. Now, just to give everybody some perspective, you know, 30%-ish of our business is pro today. So what we really added was our ResiPro team. So that team has come up to speed quickly, interacted, you know, with a number of our customers. We've already gotten some nice wins, you know, that that team, you know, started working on late last year into this year. That was actually one of the things I referenced up in Canada where we had a large pro win. So we see some great momentum. The customer feedback has been excellent. They know that we can take care of their customers, get them the product they need on the job site or for the job site, and the initial feedback's been great. So, you know, too early to declare victory, you know, my approach to this, that is, we saw a really good solid first quarter. Pro for the overall company is growing faster than DIY. That is the first step in the equation, and certainly a big part of our strategy to get to 2.5 billion. So, we're excited about our initial results, but we got a lot of work to do and a ton of opportunity in front of us.
Great. I'll hop back and queue what others ask.
Thanks. thank you our next question comes from the line of david manthe with baird please proceed hey guys good morning um yeah first first question you sort of touched on it um in terms of the gross margin um are you giving us the impression that um gross margin is normalizing right now in in this quarter, next quarter, can you just talk about how you think about the trajectory of gross margin through 2026?
Yeah, hey, Lee, it's, or sorry, Dave, it's Rocky. The reality is, as we said in our remarks, and we believe Q1 is the low watermark in our gross margin for the year. It was driven by just the timing of the tariff-impacted inventories flowing through the P&L, and so we see margins stepping up throughout the year. And again, as we said in my prepared remarks, we expect to be between 46% and 47% for the full year.
Okay. And so, by the time we reach that level, given that you started at 45.6, maybe you reached the top end of that on a quarterly basis, maybe in the second half of this year?
That'd be a good way to think about it.
I mean, again, I think there's a shot, depending on how the year plays out, that we can be a little bit above that as you get into the second half of the year above the 46 to 47 okay good and then you touched on fuel slash freight I was wondering if you just walk us through the mechanisms within your P&L and your freight in and your your freight out and sort of where it hits your P&L and then what are your mechanisms for offsetting higher prices should they start to impact you yeah I'll start and then I'll like JMA add some color, Dave.
I think as you think about the pieces, you know, packaging clearly is impacted by the price of oil that will go into product cost as you think about the cost of a product. But more importantly, in quicker impacting is obviously ocean freight and the impact on rates there. That while, you know, still delayed as you think about those costs flowing through the inventory, call it, you know, six to eight months after we incur the cost, still, you know, can be an impact. And then quicker even than that would be freight in the United States. We have seen in some instances already where carriers are installing or putting in place fuel surcharges. At this point, we don't believe material to the 2026 results. But as that moves, you know, We always work with our customers to adjust pricing based upon what happens in those markets. David, I have no...
Go ahead. Go ahead, David. Okay, I'll ask a follow-up if that's okay on that. So you outlined product costs and freight in and that sort of thing. What about delivery costs? I mean, you have more than 1,000 people out there visiting store locations. Obviously, they have to fill up at the pump. I don't know how that works. through your P&L in terms of reimbursing those folks? Is that a meaningful number? Just trying to make sure we have all the bases covered as it relates to higher oil prices here.
Dave, you're correct. That is a real cost. I would not call it a meaningful number. That is tracked on our SG&A. We have, you know, certain cars have car, people have cars or car allowances and we do use, you know, outbound freight, of course. So there's fuel does weigh on those charges, but I would not call it a material number as Rocky framed it. We'll just make sure we account for it and adjust if we need to.
Yeah, and to be clear, Dave, on my comments, when I talked about freight in the United States, the quickest impact will be that last mile to our customer. That's a cost that we incur in the period that we're shipping the product. Anything that's happening between DOC and RDCs, again, gets caught up in the inventory and capitalized and gets spread out over time.
Yeah. All right. That's very helpful. Thanks, Dave.
Operator
Thank you. Our next question comes from the line of Matthew Bowley with Barclays. Please proceed.
Hey, morning, everyone. Thank you for taking the questions. I just want on the PS business, you know, it sounded like there was some impact there around promotion timing and destocking, but I think I heard you suggest that it was going to stay below 2025 going forward, and correct me if I'm wrong, but I just wanted to maybe unpack that a little and understand if you think there's anything kind of bigger picture going on from a structural perspective in that business and kind of what's it going to take to sort of turn that business around? Thank you.
Matt, good question. Yeah, it certainly had a challenging period. You know, the overall, I'll say HPS business was strong. You know, PS in particular, you know, we saw really promotional activity was the biggest portion of that drop in Q1, and that will be a pressure point for the full year. So that, you know, given sensitivity at the shelf with rising prices, we did see some pressure in that business. Our team is committed to driving innovation. We've got some great new products that are hitting the market this year. So we still have reason to be optimistic about that business. That said, we're focusing on the truth and that will be the fact that it'll be below 2025 in total. So we don't feel like we have issues beyond a tough Q1, Q2 timeframe. The business will improve as the year goes on, but it certainly is that promotional activity. The core is healthy. That is, to me, the most important part of the underlying, you know, elements of it. And we believe as the markets improve, not that we need that, but we believe as the markets improve, that business will improve as well.
I guess the only thing, Matt, I would add is, you know, as you think about, JMA talked about the promotional activity and the health of the actual business. You know, we believe if you exclude the promotional impact in 2026, that business will be, at worst case, flat to slightly Okay, got it.
Perfect. Thank you for all that color. And then secondly, on the tariff topic, maybe just diving into that a little bit. Number one, if the refunds were, you know, ultimately make their way to you, how would you think about either shareholder return or, you know, other investments you'd be looking to make on the other side of that? But then for the rest of the tariff impact, it sounded like you called out effectively neutral. You know, IEPA kind of went away, and I know, you know, new tariffs are kind of introduced on the other side of that. But I'm just curious why the net impact would still be neutral, because, you know, you would think on balance more went away, but just kind of, you know, was it the Section 232, et cetera? What ended up kind of fully offsetting that benefit?
Matt, good question. It's certainly complex. Yeah, from a big picture perspective, absolutely accurate. You know, IEPA did go away. That did create tailwind for a portion of our business. The problem was, is, you know, 232, you know, full steel content is an impact for us going forward. You know, we're not breaking those numbers out specifically, but also 122 went into place. We know that there's limitations on the timeframe there. You know, we'll see what happens. But as we stand today, when you take the tailwind from the IEPA and then the headwind from 232 and 122, it is nearly a wash in totality. So an immaterial change in our total exposure. So that is really the challenge there. I'll let Rocky, you know, add more color, but on the rebates or on the refunds, we get through it, but our team is filing them. We're going through them, but we did, you know, incur quite a bit of cost in prior periods. But the balance of what we have to pay going forward, we don't see material change. Rocky, anything to add?
No, I don't think there's anything to add to that, Jamie.
Operator
Thank you. Our next question comes from the line of William Carter with Tifo. Please proceed.
Hey, thank you. I wanted to ask on, in terms of, you said improvement through the quarter. So could you get into kind of the magnitude of kind of the differences between March, January, February, just to get an idea of how kind of the slower start impacted and kind of better understand what kind of what the exit rate is to think about for March going into kind of April 2Q rest of the year. Thanks.
Andrew, I'm going to speak in big picture. You know, we saw March start to be, you know, see the spring build. It was normal with our sequential improvement. As far as the month over month differences, we're not going to start breaking that out now. You know, we did see that continue in April. That's the, I'll say the positive that we're seeing at this point, but we certainly saw a tough start to the year. January and February were rough months. You know, we saw in the quarter, you know, new business getting some nice traction. We think overall, you know, we are moving in the right direction, but, you know, you think about down, you know, single digits, uh, and Q, you know, in that first month or so, um, January to February timeframe going positive in March was certainly a step in the right direction. Rocky, anything to add? Nope.
Understood. And then second, second question, um, he will, our, um, sorry, RDS up six, that's in the keys and accessory up nine. You've obviously got the rollout coming in. You're also kind of lapping some unfavorable customer moves there as well at this point like given your rollout kind of given a like for like i mean when would this business peak in terms of sales and then at the investor day you did outline kind of a slower rate of growth for that business more like the mid single digits but how much could this rollout kind of carry that kind of close to the old average how much and how long is that path and and when does it kind of regress thanks yeah great question.
So we feel that momentum on sales and RDS is going to continue throughout 2026. So that statement on, you know, mid-single digits for the five-year period, that's where we are today because we don't have, you know, we don't have, I'll say, a path to what's next beyond. But we're getting some great traction in the, you know, the 3-5 rollout. Really excited about how our teams are coming together in the field, working with store associates, driving the 3-5 rollout, doing blitzes we've been doing blitzes heavily in december january you know all the way through april here and they'll continue but i'm really proud about how the team has come together driving awareness driving the execution and we think that business has got some room to run within our guidance of course but really excited about the performance there i'm proud of what the team did inside the court and we expect that to continue for the balance of the year yeah the only thing i would add andrew is is you think about the headwind from a customer that you spoke about we kind of finalized that direct headwind in the second quarter this year and so you know
we've got a year after that where we should have some favorable comps because we don't have the negative headwind that we've had for quite a period of time thanks i'll pass it on thanks sir thank you our next question comes from the line of reuben garner with benchmark please proceed Thank you.
Good morning, guys. Good morning, Ruben. I wanted to dive into the acquisitions a little bit more. Can you kind of give some color on what exactly they bring to you guys that you didn't already have in each case? And then you raised the revenue guide. I assume the profitability on these is a little lower. Can you just talk about the ways that you think you can improve the profitability on the acquisitions you made?
Absolutely, Ruben. So, yeah, I'll start with Campbell. So Campbell was a great deal. It complemented our cook chain business, brings us manufacturing in both chain and fittings. The exciting part there is it really opens up a whole new set of customers for us. There's a number of customers. We don't do any or if we do, it's a very small amount of business on the industrial side. So the excitement for us was we believe we can own the category, have manufacturing capability, bring some new products that can help us in our retail side of the business. and really, you know, fuel growth in our industrial, which is, you know, we talked about there in our investor day is one of our paths to growth. So that was really the exciting part of it. It's a business that we believe fits better with us than its prior owner. We got a great, exciting team there is really energized to be a part of the Hillman family. There are only three going on four weeks into it. But, you know, we really believe we can take that business and, you know, make it a nice contributor, not only on top line, but also on bottom line. And we think that's why it fits into the portfolio and our overall strategy. On the Delaney side, really interesting business. We're not in lock sets. I know you and everyone knows we're big into keys. Think about how many keys, you know, we not only design the machines and we, you know, distribute and cut the keys out there, but why not have lock sets and really finish out the door, if you will, right? We have hinges, we have different parts. Now we have door locks. We bought that business. We think it's going to fit really nicely in our portfolio. It's pure Resi Pro, so very pro-concentrated. We think, one, we're timing it and buying it in the right time in the market. And two, we believe with our capabilities and what we can do with distribution, sourcing, product development, that we can really move that business forward. And we're excited to have that team on board. We brought in a leader in the field, a leader to run that business, who we're really excited. So we think we're going to put those two pieces together and really grow it as we go forward. So that one we think will show you not only top line, but also profitability in the future. We're also excited about Delaney being a nice fit in the portfolio.
Got it. And then switching gears a little bit, RDS, if I am looking at it correctly, and correct me if I'm wrong, profitability inflected positive year over year from an EBITDA margin standpoint. I think it had been a little while since that happened. And do we feel like we've reached kind of a bottoming on the margin side? Just talk about that portion going forward. You talked about the sales comps and that kind of thing, but what about profitability?
Yeah, we think profitability will be steady throughout the year. I'll turn it to Rocky to add on if there's anything else. But, I mean, the real thing there is we believe we've got the magic happening, if you will, that the machine's working. We're getting some growth in automotive keys, the endless on that one, really the excitement. And as volume goes, that'll help the profitability and really proud of the RDS team and our sales, you know, sales folks out in the field and what they're doing with it. So, Ruben, we have reasons to be, you know, not getting over my skis, but certainly excited about what's in front of us here for 26.
Great. Thanks, guys, and good luck.
Operator
Thank you. Our last question comes from the line of Ryan McNamara with CannaCore Genuity. Please proceed.
Hey, good morning, guys. Thanks for taking the question. Just another one on M&A from me. So you guys weren't kidding with two deals done pretty quickly after Investor Day. It sounds like both were relatively opportunistic. So I'm curious, how does the current deal environment look and how are conversations with potential targets going? Does having those two deals in the bag by mid-April make a third one more likely this year? Thank you.
Brian, yeah, great question. So two things. One is, you know, we are really excited by opening up our M&A pipeline now that we've expanded beyond just the retail business that we love into serving the pro. That was one of the key points of Investor Day. That has definitely opened up the view and certainly opened up the pipeline for potential opportunities for acquisition. So on the pipeline side, we do see some good deal activity. To your point, you know, having two done early in the year, we feel really good about those two. And I would say there's a high probability we'll see another this year. Can't predict anything at this point, but we certainly have some good opportunities in the pipeline that we're excited about.
Excellent. Best of luck, guys. Thank you. Thanks, Brian.
Operator
Thank you. And this concludes the Q&A portion of today's call. I would like to turn the call back to Mr. Adinolfi for some closing comments.
Thanks again, everyone, for joining us this morning. We look forward to continuing updating our progress in the near-term future. With that, we're going to continue to go focusing on taking care of our customers and moving the markets forward. Thanks for all you do, and have a great day.
Operator
Thank you, and you may now disconnect.