Speaker 0
We will make forward-looking statements during this call, which are subject to risks and uncertainties. A summary of these risks can be found in the Risk Factors section of our Form 10-K filing with the SEC dated March 2, 2026. These statements are based on assumptions we believe reasonable as of today, May 11, 2026, and we have no obligation to update them, except as required by law. We will also present both GAAP and non-GAAP financial measures. Reconciliations are included in our earnings press release on our Investor Relations website. This is an audio-only call with no slides. Our updated investor deck is available as a reference on our IR website, along with our new quarterly shareholder letter from our CEO and CFO; the letter goes into additional detail beyond our prepared remarks on this call with the intent to open up more time for Q&A. We will begin with a business update from CEO Lauren Antonoff, then CFO Russell Burke will review financials and outlook, followed by Q&A. Please limit questions to one per participant to start. I will now turn the call over to Lauren.
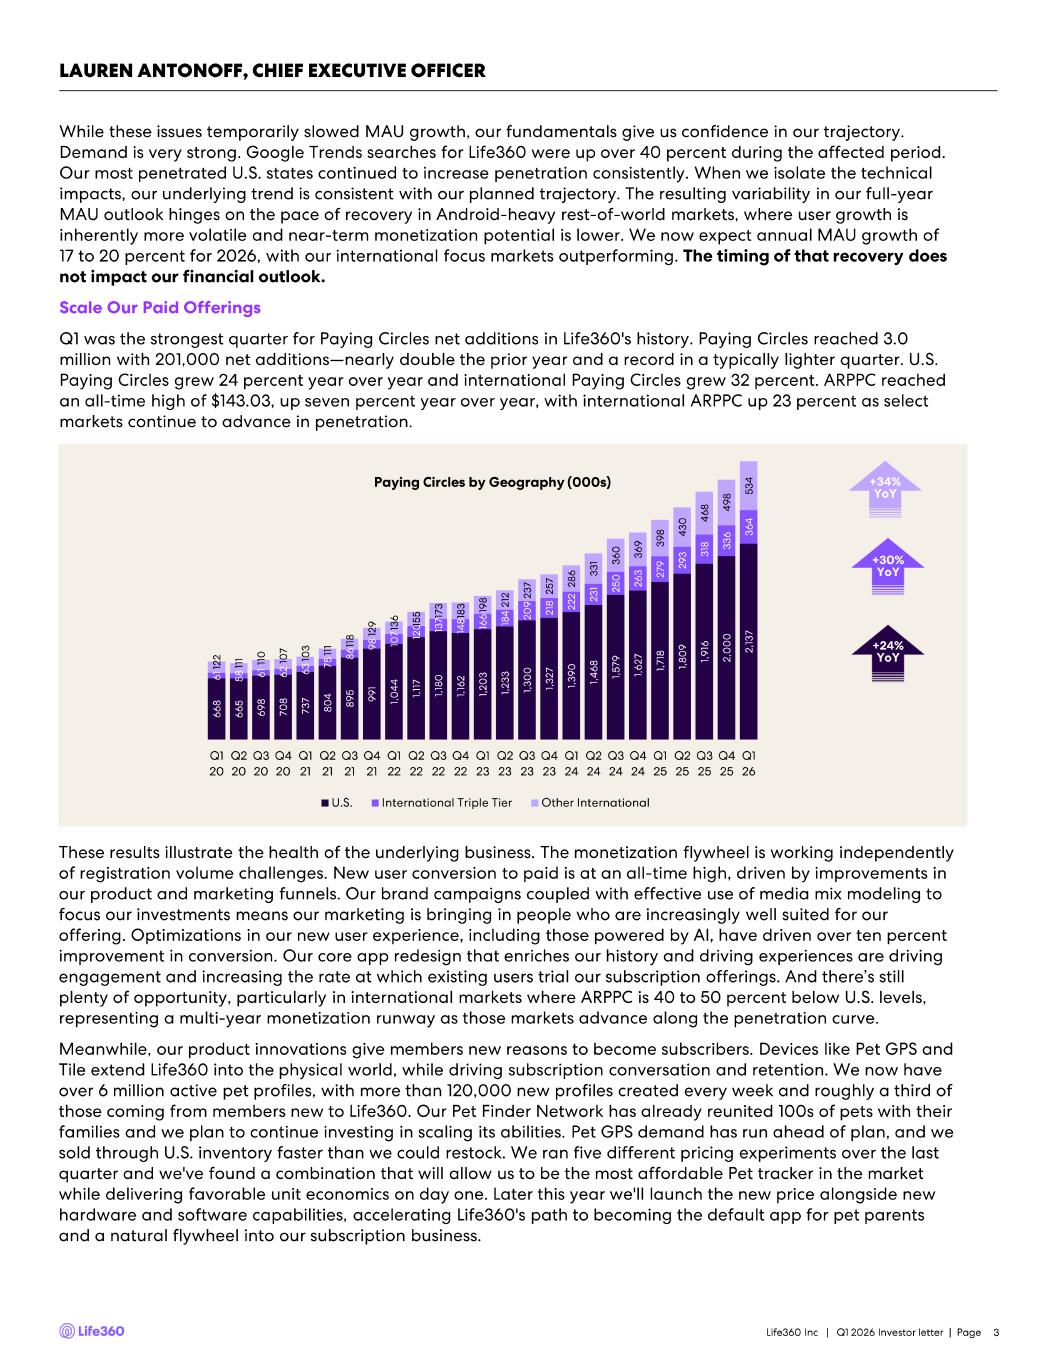
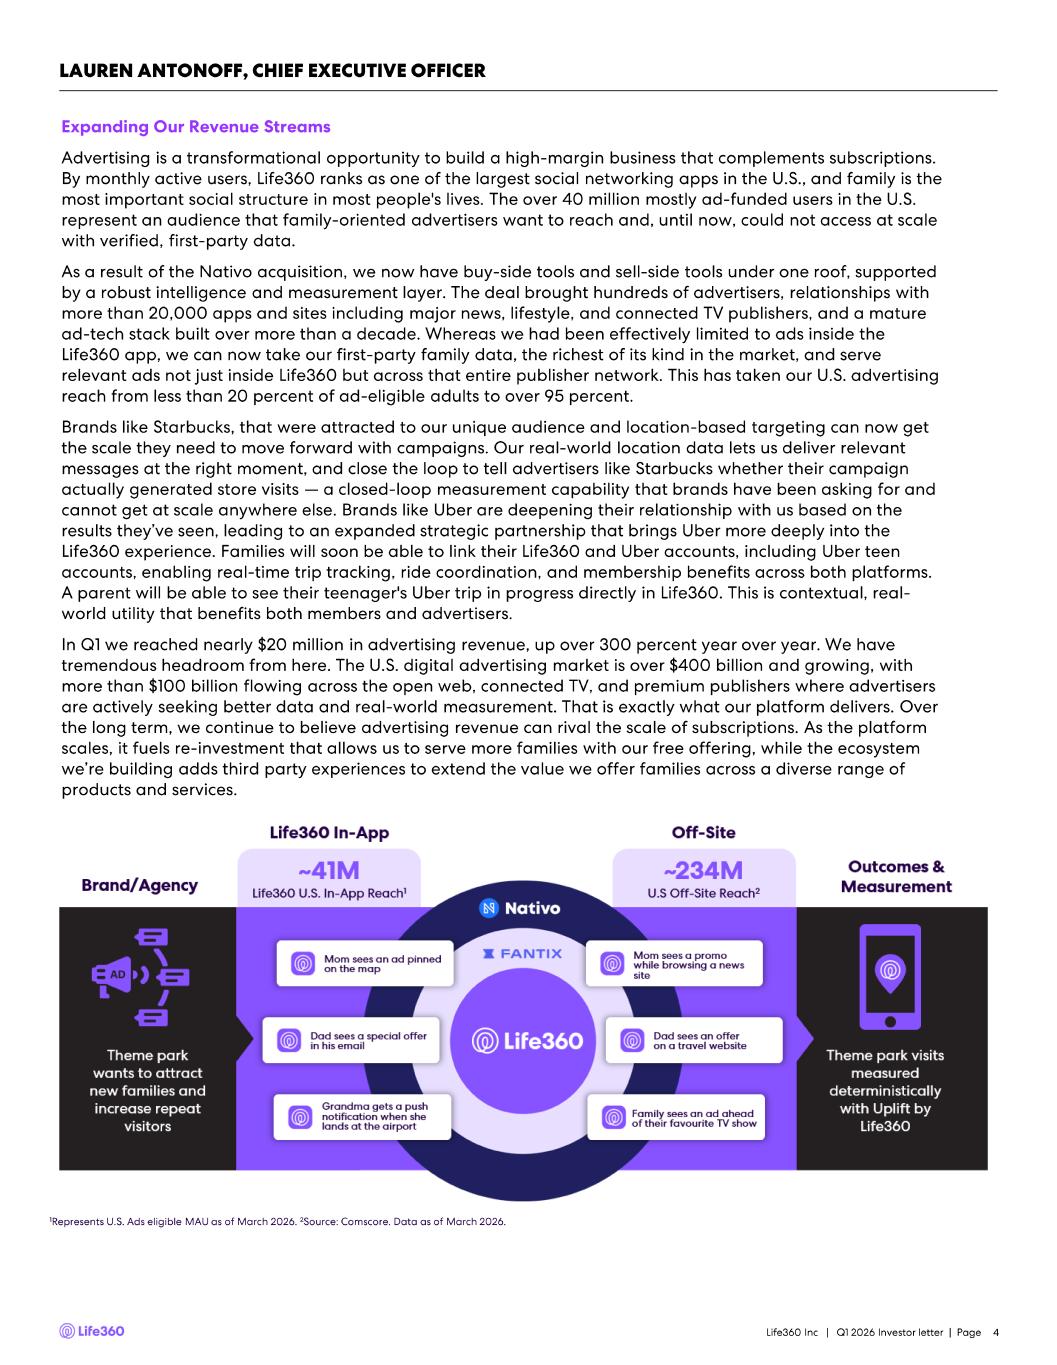
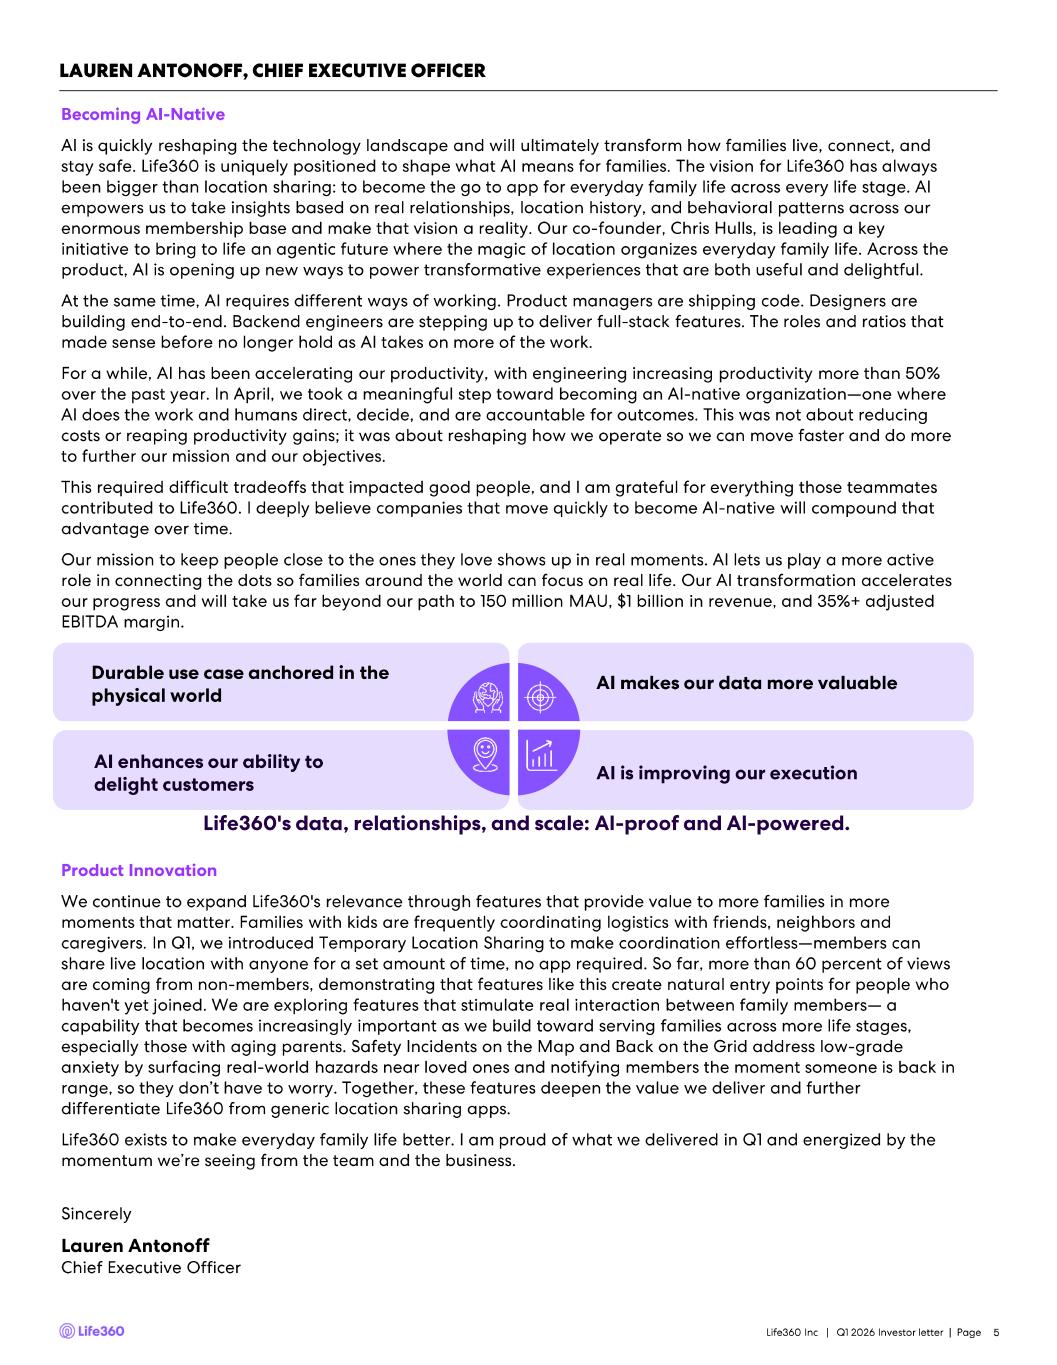
Good afternoon to everyone in the U.S., and good morning to those joining from Australia. Thank you for joining the call. We're doing something a little different this quarter with shorter remarks so we can get to more Q&A. The letter we shared provided a lot of detail. So I want to take a couple of minutes to reinforce a few key points. I want to talk about what's propelling our strong financial results and why I'm confident in our trajectory. I also want to spotlight our Advertising business, which has long been a glimmer in our eye and is finally at a scale where it's becoming a significant part of our business. And I want to touch on our progress and learning on AI. First, our strong revenue growth is a clear reflection of what makes Life360 so special. Life360 is in a rare position. We've become a meaningful part of everyday family life for more than 97 million people who use Life360 to keep their families safe and connected. The trust families are placing in us is a genuinely differentiated asset, one that grows and compounds day after day because of the real value we deliver around safety, coordination and connection. It's the foundation and fuel for every part of our business. The momentum we have in subscriptions, advertising and partnerships all flows from it. Every quarter, we ask ourselves, are we increasing the value we deliver to families? And are we seeing that value compound in our results? The answer to both of those questions in Q1 is yes. This trust and value translated into outstanding Q1 revenue growth of 38% to $143 million. We delivered the most quarterly subscription net adds ever, bringing us to 3 million paying circles. ARPPC is at an all-time high. These aren't one quarter anomalies. They are the result of a flywheel that's continually getting stronger. Better product drives higher conversion and retention, those improved economics fund more investment and more investment makes the product better. The value we deliver to our members powers our monetization engine. Now let me take a moment on monthly active users. Q1 MAU growth came in at 17% year-over-year. That was solid growth, but below where we planned to be due to a series of technical issues that temporarily suppressed registration volume during the peak of Q1 marketing. After fixing a widespread issue that impacted new signups, we uncovered additional Android-specific problems disproportionately affecting lower-end devices. The latter took longer to resolve, but was largely concentrated in populations that don't materially impact revenue today. We've implemented the major fixes, put systems in place to quickly catch problems in that part of the funnel should they ever arise again. And we're still finding opportunities for improvement. Recovery won't happen in this quarter, but even with pressure on registration, our monetization through the funnel has remained strong. What I really want to convey is that demand never faded and engagement continues to deepen. When we look at the underlying data, the story is clear. Google trend searches for Life360 were up over 40% during the effective period. Our most penetrated U.S. states continue to increase their penetration consistent with previous years. Our iOS segments, which drive the vast majority of our revenue, recovered and are growing well. The U.K. is growing at 25%, Canada at 32%, and Australia and New Zealand at 24%, all bolstered by strong and improving member retention. The signals we're seeing now give us confidence that the fixes are taking hold, and we expect to be back on our planned glide slope by Q3. This impact delays but does not fundamentally change our MAU growth trajectory. This brings our expectation for MAU growth to between 17% and 20% for the year. Our topline growth remains strong, and we've raised outlook for revenue. Next, I want to highlight our newly scaled Life360 ads business. What makes our advertising business different isn't just real-time location data. It's not the same trust that families place in Life360 is exactly what advertisers are attracted to. And our real-world first-party family data is unique, impossible to replace with the synthetic model and it's what turns relevant reach into measurable results. With the completion of the Nativo acquisition, advertising revenue has reached critical scale and the promise we've seen for some time has become real. We broke out advertising revenue for the first time with nearly $20 million in Q1, and we expect a steep ramp over the next few quarters as we enter peak advertising season. Over the long term, we continue to expect advertising to rival the scale of our subscription business, powered by our unique audience and real-time real-world data. Now that we've integrated in Nativo, our location data activates not just inside Life360, but across over 20,000 publisher sites in Connected TV, extending our reach from under 20% of U.S. ad eligible adults to over 95%. With world-class buy-side tools, sell-side infrastructure and data intelligence, we can reach relevant audiences in the moments that matter and allow advertisers to clearly see when a campaign drives real-world behavior from store visits to test drives, all while keeping the data private within our walled garden. What that means in practice is that brands like Starbucks can reach families in a real moment near a store on a Saturday morning and then close the loop to see whether that impression drove a visit. Uber likes our results enough to deepen their product integration with us and parents will soon be able to call an Uber for their teen and see the trip live all inside Life360. Brands like these want to work with us because of the trust we built with the families they serve and because we can close the loop between ad targeting and customer behavior, and experiences like these enrich the value that we deliver our members and propel the flywheel that drives member value and monetization. That's where we see so much potential in our ads business. Finally, I want to touch on AI. I want to address this directly because it doesn't yet show up in the financials, but it will shape how we operate and compete for years to come. We see AI as a critical opportunity to accelerate our path and deepen our moat. The vision for Life360 has always been bigger than location sharing. We're working to become the go-to app for everyday family life across every life stage. AI empowers us to take insights based on real relationships, location history and behavioral patterns across our enormous membership base and make that vision a reality. Our real-time continuous data becomes even more valuable in an AI-first world. In April, we restructured our R&D organization as a first step toward becoming an AI-native company, where AI handles more of the execution work and our people direct, decide and are accountable for outcomes. What we see clearly now is that AI doesn't just help work get done faster, it fundamentally changes how work gets done. Becoming AI native demands deeper changes in how roles and organizations are defined and aligned. We believe that companies that go AI-native will compound that advantage over time. We're still early in our AI journey, but strong adoption across our engineering organization has increased developer productivity by over 50% from last year. That velocity lets us do more and unlocks high-value features that would have previously required unrealistic levels of manual effort. As our AI implementation matures, Life360 becomes the easiest way to orchestrate everyday family life, compounding value for our members and our business. Those were the points that I wanted to highlight for Q1. Looking forward, the setup into the back half of the year is strong. Revenue acceleration, margin expansion and MAU growth all point in the same direction. We've got some exciting updates and product innovations in store for H2, including an action-packed back-to-school and the next phase of our push into families and aging parents. We continue on the path to exceed $150 million MAU, $1 billion in revenue and over 35% adjusted EBITDA margins. Q1 reinforced our confidence in that path. The MAU headwind slowed us a bit, but the trajectory remains unchanged. With that, I'll ask Russell to share a bit more detail on our performance and outlook.
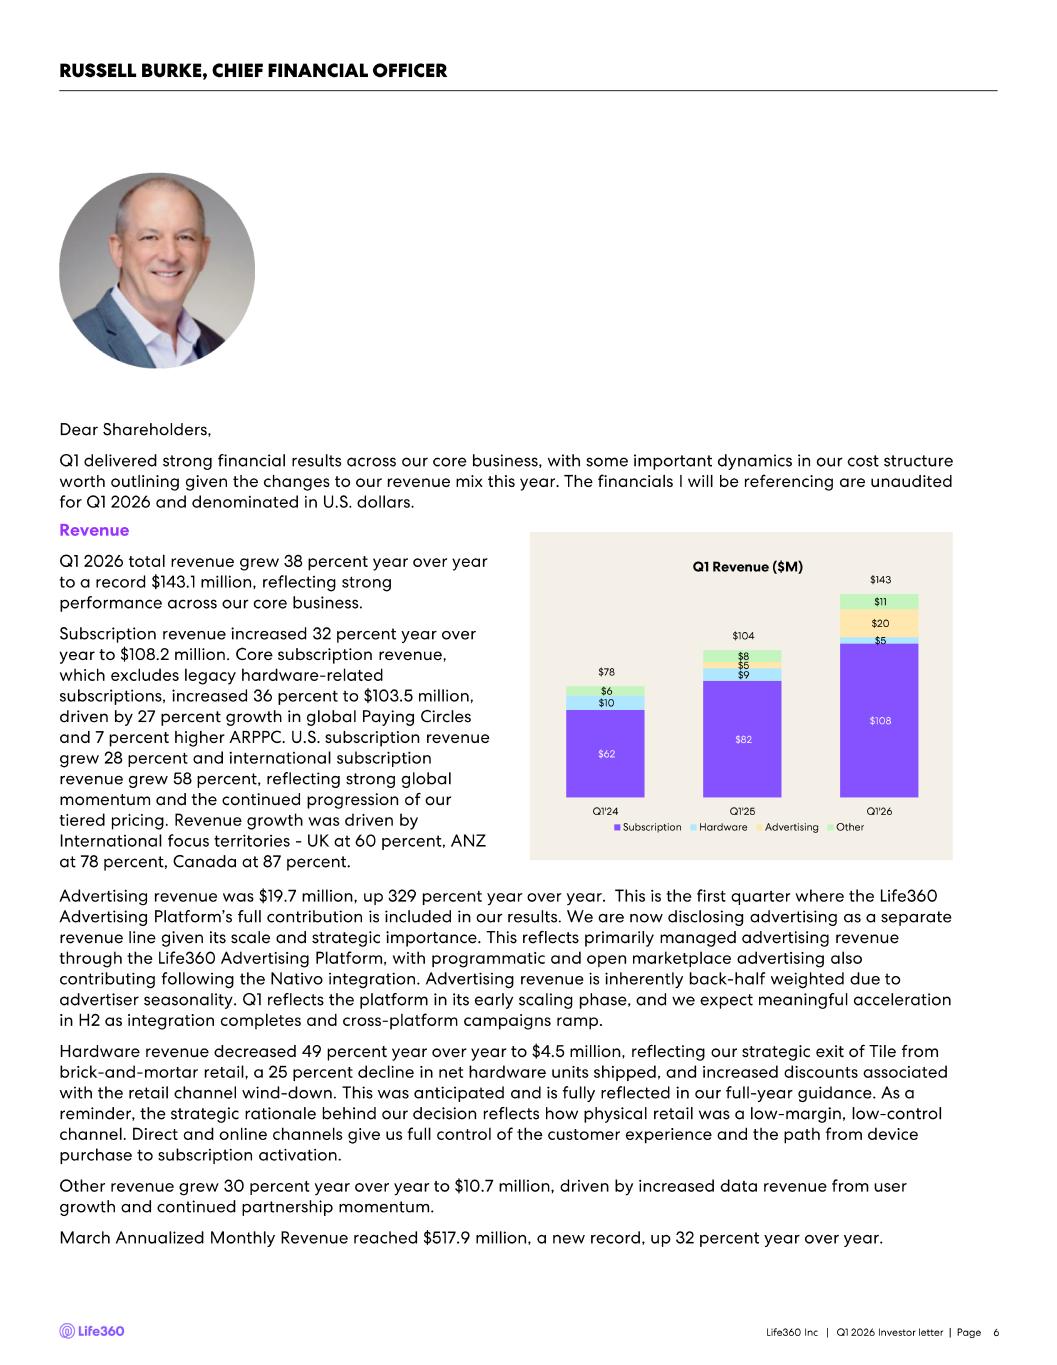
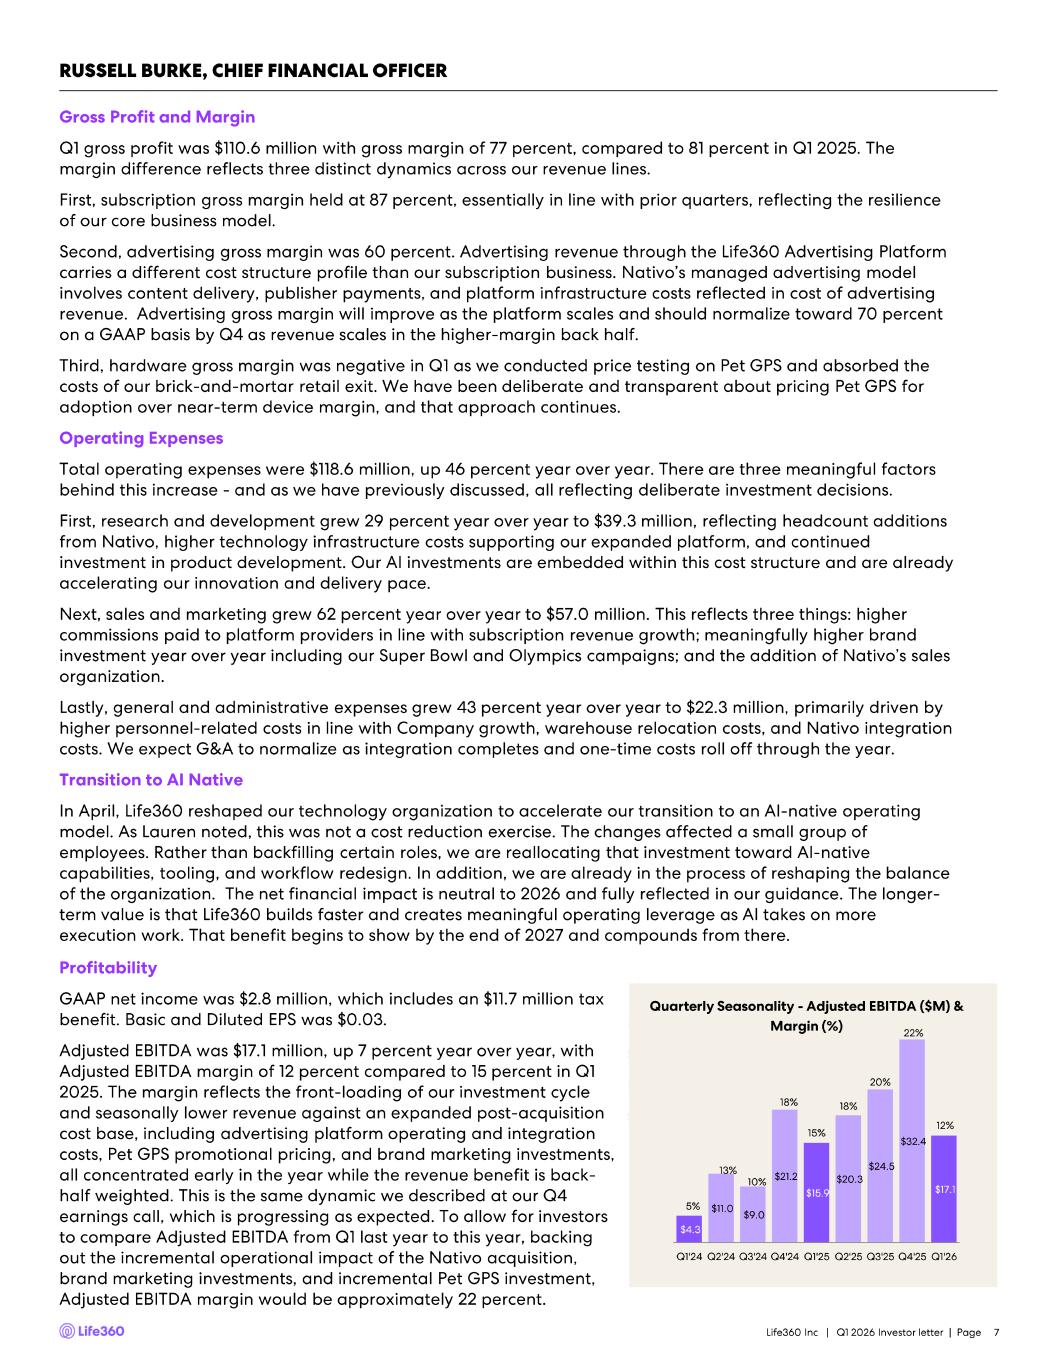
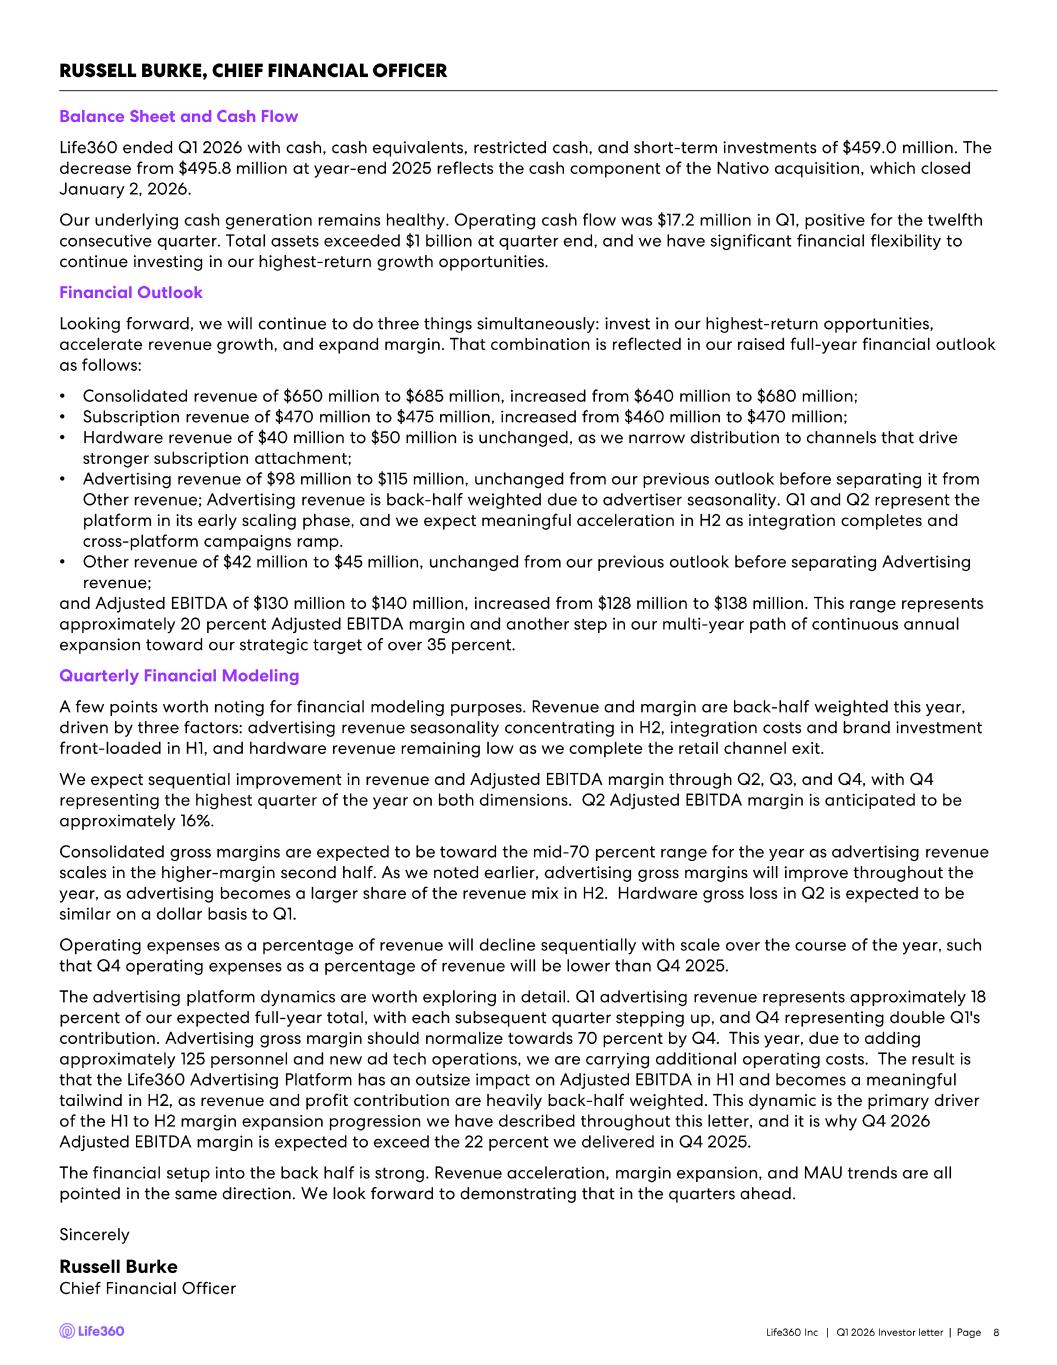
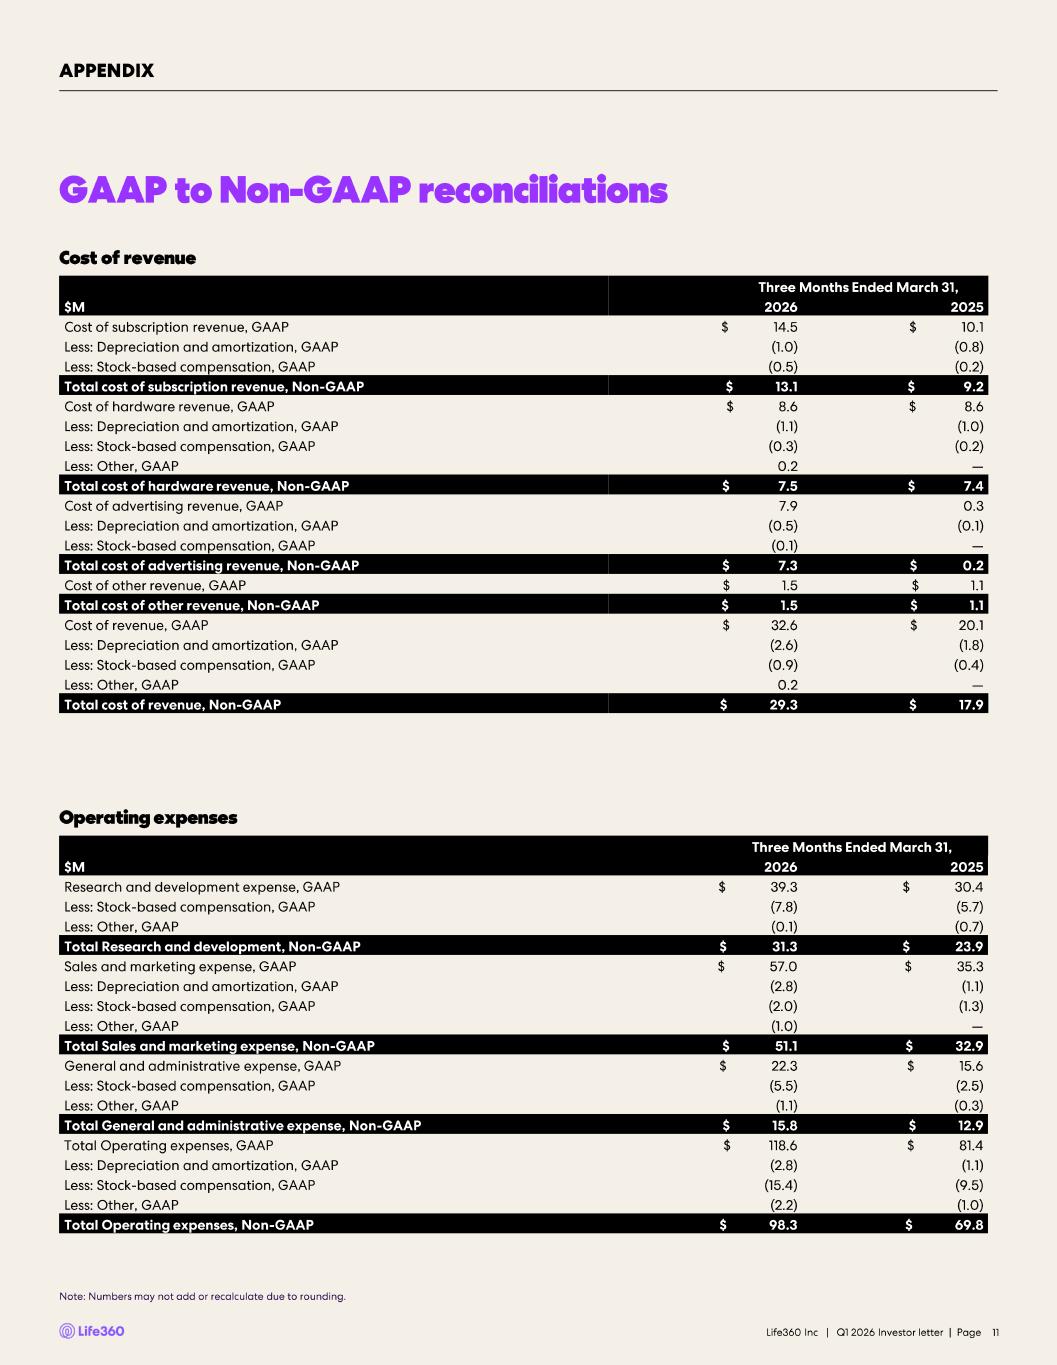
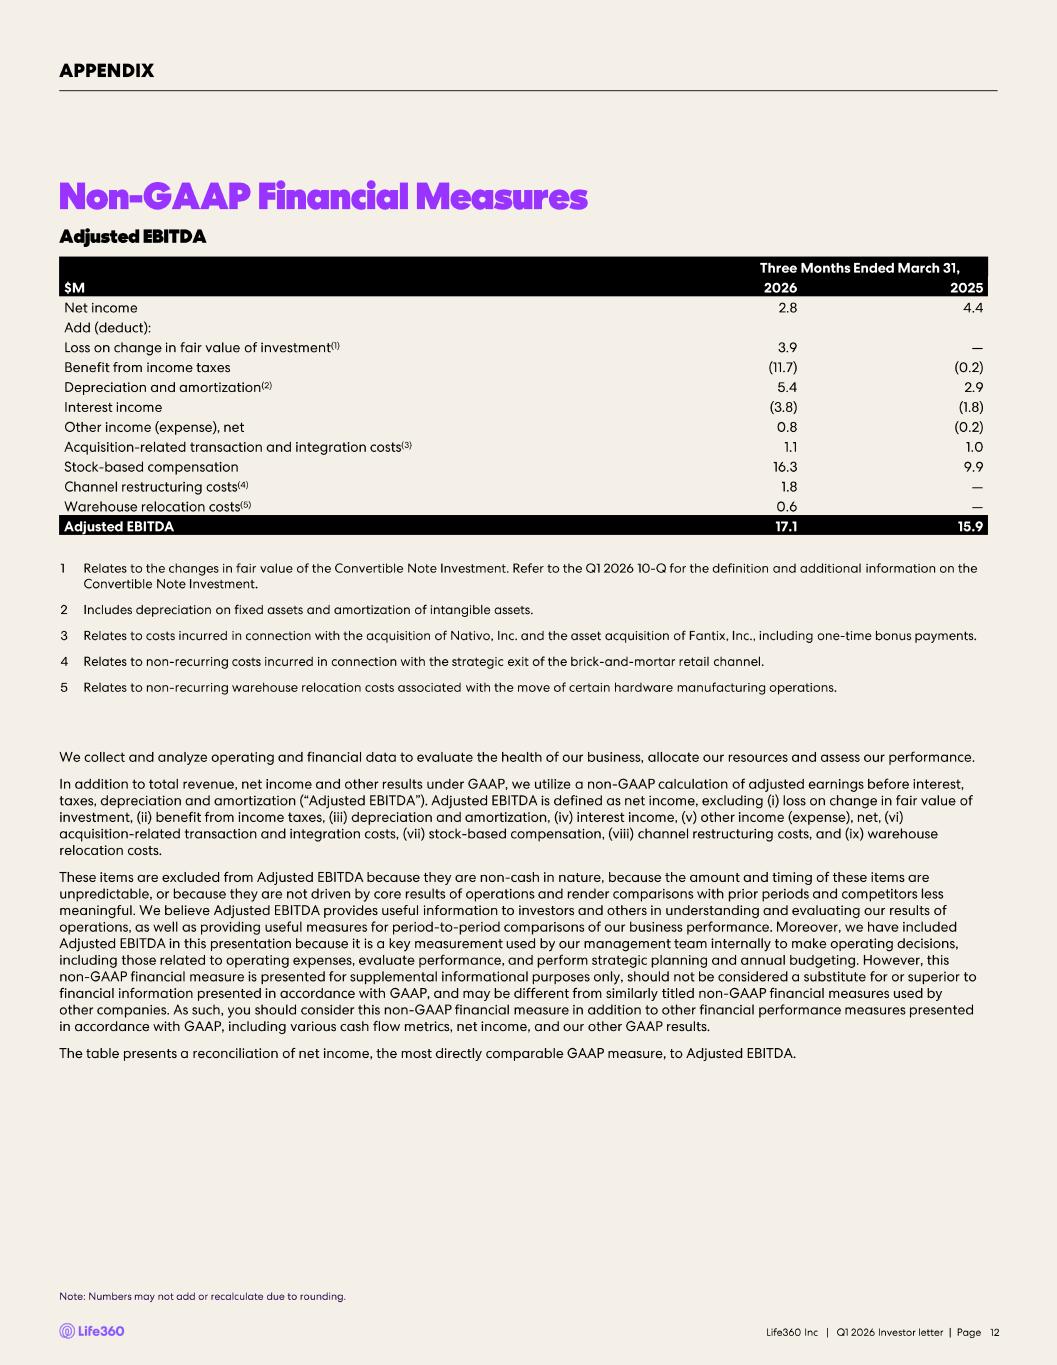
Thanks, Lauren. Q1 delivered strong financial results across our core business, and there are some important cost structure dynamics that are worth walking through. All figures are unaudited and in U.S. dollars. Total revenue grew 38% to a record $143.1 million. Subscription revenue grew 32% to $108.2 million with core subscription up 36%, driven by 27% Paying Circle growth and 7% higher ARPPC. U.S. Subscription revenue grew 28% and International grew 58%. Advertising revenue was $19.7 million, up 329%, boosted by the Nativo acquisition. And this revenue stream is now disclosed as a separate line. Hardware revenue was $4.5 million, down as expected given our strategic exit from brick-and-mortar retail for Tile. Other revenue grew 30% to $10.7 million. March AMR reached a record $517.9 million, up 32% year-over-year. Gross margin was 77% versus 81% in Q1 last year. The difference reflects three distinct dynamics across our revenue lines. Subscription gross margin held at 87%, in line with last quarter. Advertising gross margin was 60%. As the Life360 advertising business broadens following the Nativo acquisition, we're introducing a wider suite of products that carry higher cost than pure digital advertising. Advertising gross margin will improve as the platform scales and should normalize towards 70% as revenue scales in the higher-margin back half. Lastly, hardware margin was negative as we priced Pet GPS for adoption and absorbed brick-and-mortar retail exit costs. Operating expenses were $118.6 million, up 46%. R&D grew 29%, reflecting Nativo headcount and platform investments as well as AI investments that are already accelerating our delivery pace. Sales and marketing grew 62%, driven by the increasing growth media spend, higher app store commissions and personnel costs associated with our newly enlarged sales organization. Our upper funnel investment, such as streaming Super Bowl and Winter Olympics commercials is oriented towards brand awareness, which offers longer-term payoffs. Even with these investments, we expect to resume our march to increasing operating leverage by Q4. The April organizational reshaping affected a small group of employees rather than backfilling certain roles; we're allocating that investment towards AI-native capabilities and workflow redesign. The net financial impact should be neutral to 2026 and is fully reflected in our guidance. We expect operating leverage from AI to then begin to impact and compound thereafter. GAAP net income was $2.8 million with basic and diluted EPS at $0.03. Adjusted EBITDA was $17.1 million at a 12% margin, reflecting the front-loading of our investment cycle as discussed last quarter. Operating cash flow was $17.2 million, positive for the 12th consecutive quarter. We ended the quarter with $459 million in cash, cash equivalents, restricted cash and short-term investments and total assets exceeding $1 billion. On guidance, we're updating our full year financial outlook. We're raising total revenue guidance to $650 million to $685 million, up from $640 million to $680 million. This is driven by subscription revenue, which we now expect to be between $470 million and $475 million, up from $460 million to $470 million. Full year guidance for the rest of the business is unchanged with advertising revenue now disclosed separately and expected to be $98 million to $115 million, hardware revenue of $40 million to $50 million and other revenue of $42 million to $45 million. Finally, we're raising adjusted EBITDA guidance to $130 million to $140 million, up from $128 million to $138 million, representing approximately 20% margin. A few modeling points worth noting for our 2026 outlook. Revenue and margin are back half weighted, driven by advertising seasonality concentrating in the second half, integration costs and brand investment front loaded in the first half and lower hardware revenue as we complete the retail exit. Q1 advertising revenue accounts for approximately 18% of our expected full year total, with Q4 representing approximately double that of Q1. Operating costs for the advertising platform are largely fixed. Beginning in Q1, we took on incremental quarterly operating costs from adding nearly 125 personnel and new ad tech operations related to the acquisition, while revenue and profit contribution are back half weighted. This is the primary driver of first half to second half margin progression. And it's why Q4 2026 adjusted EBITDA margin is expected to exceed the 22% that we delivered in Q4 2025. The financial setup into the back half is strong; revenue acceleration, margin expansion and MAU trends are all pointed in the same direction. We look forward to demonstrating that in the quarters ahead. RJ, back to you for Q&A.
Speaker 0
Thanks, Russell. So we'd like to open up first to Mark Mahaney. Could you unmute your line and ask a question.
Speaker 3
I just want to ask then, I'll start off on advertising. So you laid out some numbers for the full year. Talk a little bit more about the go-to-market strategy and also give us a little bit of color on that Q1 ad revenue number—how much of that was from Nativo so trying to figure out what the organic growth rate was, but a little bit more on how you build up to those numbers that you talked about by the end of the year, approximately $100 million.
The first thing that's important to understand is that we've fully integrated our Nativo team into the Life360 ads team—function as one team and one business. We are pounding the pavement in the ad circuit attending the key conferences and continuing to reach out to both the customer base that Nativo and Life360 had cultivated over time. And we're seeing a lot of enthusiasm for the combined offering. So we're off to a good start.
And Mark, I think—I know you're looking for an organic number. It is difficult because we have combined the businesses from day one, but I think if you look at it broadly for that $20 million of revenue in Q1, roughly half of that was organic.
Speaker 0
Next, we'd like to open it up to Eric Choi.
Speaker 4
My one question would be just on the MAUs. Given you did 1.9 million MAU additions in the first quarter, to get to your 17% to 20% range for the full year it still implies that 1.9 million needs to at least stay, 5 million-ish on average per quarter for the remainder of the year. So my question is I'm just trying to get investors and myself more comfort that you can do that. So maybe could you give us an estimate of what that 1.9 million would have been in the first quarter if you didn't have the technical issues or alternatively you're kind of halfway through second quarter now. So maybe if you can give us a feel if that MAU number has actually already meaningfully accelerated?
Okay. So let me unpack this a little. In Q1, we saw the suppression of the funnel that really impacted certain segments more than others. And that is the Android-heavy markets and, in general, the lower-end devices, and so when we sort of pull apart and look at the performance of our premium devices and—sorry, iOS devices and high-end Android devices, we're already seeing really strong momentum. As we look into Q2 and we see a lot of the problems that we saw in Q1 start to recover, although that's still ongoing through some of Q2 we see a return to similar levels of adds that we've had in previous Q2. So we have improved growth of that premium segment. And I would say, overall, that balances out with a suppressed funnel to give us a similar quantum to previous quarters. And then we expect, as that funnel is fixed and we go into Q3 in the later half of the year, that that trajectory helps us build further momentum across the full user base.
Speaker 4
Super helpful, Lauren. I'm sorry, I'm not being annoying. For avoidance of all doubt, if I look at second Q '25, you did 4.3 million MAUs. So you're sort of saying second Q '26 is already tracking kind of in line with that number and given there's potential for second half acceleration on second Q, that's what gives you the confidence in that full year number. Sorry, is that the right way to think about it?
Yes. And I'll add a couple of things. Even as this has been ongoing, we're seeing increased demand—we're seeing increased user retention. So we're seeing a lot of great signals in the fundamentals. And so the problem that we've been contending with is pretty narrow, and we put fixes in place and new monitoring, and we feel good about getting back on that glide slope by Q3.
And just to emphasize again, Eric, this doesn't have an impact on revenues or financial results in the short term. Certainly, this year, you can see how well the business is performing. So it is very separate from the MAU brand.
Speaker 0
Next, we'd like to open it up to Maria Ripps.
Speaker 5
Great. I just wanted to follow up on the MAU sort of technical issue this quarter. Can you maybe help us understand sort of the timeline of the recovery there? I think you said it will take a couple of quarters by Q3. Are there any sort of certain fixes that still need to be implemented? And I guess, how are you recalibrating your marketing spend over the next couple of quarters as this is happening?
So the issues that we've seen are sort of a cluster of issues. So that first issue that we detected was a broader impact that affected traffic coming into Life360 as a whole. When we repaired that issue, it's when we sort of uncovered that there was remaining issues, particularly in Android—in particular with lower-end devices. There were a few very specific issues that we have fixes in place for, and those fixes went in between late Q1 and Q2. And those are already seeing good progress. The thing that this work has really helped us understand is that very much not all Android is created equally. And there is an opportunity to look at those lower-end devices and continually improve performance among those cohorts. And that will help the business over the long term as we get into markets that are Android heavy and that have a higher propensity of lower-end devices. Russell called out that what we're seeing now is a little bit disconnected—or very disconnected—with what we're seeing in subscriptions. And that's because premium devices are the things that really drive the lion's share of our momentum today. But we believe that Android cohorts and these broader cohorts are important to our long-term health. And so we're making sure to make those investments and those will continue for a longer period of time.
Speaker 0
Next, we'd like to open it up to Laf Sotiriou.
Speaker 6
So can I just quickly follow-up on a previous answer that Russell provided and then ask my question. So Russell did you say that—was it $10 million of the new $20 million advertising revenue disclosure was organic growth. So given roughly $4.6 million PCP. Does that imply Nativo was around $6 million PCP on a like-for-like, so that $10 million is organic? Or if you can just clarify your answer around the $10 million. And my question is in relation to Starbucks and the Uber partnership and the partnerships more broadly in advertising. Is Starbucks new? Have you signed them up as a new advertising partner? Or—it just seems odd to discuss them and not clarify. And with Uber's expanding partnership, are you—is that leading to higher revenue? Is it double the revenue? What's involved with that expanding partnership?
Okay. So let me take the partnership one first, and then Russell will get back to you on his earlier comment. One of the interesting things about the ads business is—and this is something we learned as we started getting in—is that customers want to start kind of small and then grow, and that was a real challenge for us before Nativo because we just didn't have the capacity or frankly, the platform to be able to do these initial tests and get to know partners and sort of prove what our platform can do with them. So now with Nativo, we're able to engage in partnerships and we are starting on that journey with Starbucks and many other partners. And that is helping us get going, and those accounts will build over time. Uber is really a great example of how partnerships grow and blossom over time. That is a bigger deal. We're not disclosing specific numbers, but that relationship is growing both in terms of the value that it provides our members and the economics that it returns to the business.
And Laf what I'd say about the organic growth question is, as I said in my previous answer, because we've combined the businesses really from day one, it's not technically possible to extract a pure organic number. All I'm doing is sort of looking at past history for both businesses and saying roughly half of that first quarter result was organic. Now, in terms of progression, we've also said that what we expect to happen this year is that the revenue will double between Q1 and Q4. So the Q4 level of revenue is likely to be roughly double what we saw in Q1. And that reflects sort of history of both businesses.
Speaker 6
Thanks, Russell. But just to be clear, so that means Nativo was roughly $6 million PCP. So the $10 million is an organic growth on both the existing Life360 advertising and Nativo?
That's a broad enough assumption, yes.
Speaker 0
Next, we'd like to open it up to Mark Kelley.
Speaker 7
Great. I was hoping—I'd love to get just maybe a better understanding of the technical issues that you identified that impacted MAU. I know a lot of nontechnical people on this call, including myself, but maybe just a little bit more color about what caused the issue and how to make sure that those issues don't pop up again in the future would be really helpful.
Yes. I can give you some examples. The first that I mentioned is a technology that we use to make sure that there isn't fraud and traffic coming into Life360. It's very helpful to prevent fraud, but there was a technical change made by the partner that we provide, and it started to catch more legitimate traffic as well as fraudulent traffic. So that was sort of like the first problem that we resolved and fixed. When we did that fix, we saw strong improvement in iOS, and we didn't see the same recovery in Android, and that was really the signal that there was a unique set of problems impacting Android. These particular problems are things that cause problems with people just getting started and onboarding into the app. So it's before they're really using the app, which is why we didn't have as much visibility into the problem early on because they're not fully in the app. They're not sort of daily use customers already. What we've done is put a much, much more robust monitoring on that part of the funnel to make sure we catch those problems. I'll just add one other side effect. When those problems were happening, it's something that Google is able to detect. And when they saw those problems, they actually decreased our ranking in search results in the App Store. And I think that was one of the most significant impacts that we saw because it meant that people who were looking for us didn't necessarily find us.
Speaker 7
Really helpful. So it sounds like a big part of this was not your code, it was a third-party code that kind of made it hard for you to identify and the ranking stuff for Google, that make sense.
Speaker 0
Thanks, Mark. Next, we'd like to open it up to Chris Savage.
Speaker 8
Lauren, this is probably more for you. But to use your term, the monetization through the funnel was obviously very good in Q1. Can you talk us through what particularly drove that? And was it in any way shape or form Pet GPS?
It's a lot of things. I would say it's a combination of new value, including Pet GPS although Pet GPS is still small, and we had limited inventory. So it's not a huge part of it. But that's an example of the kind of new value that we've been adding. I think more importantly, there's a lot of value in our subscriptions that people don't understand. I can't tell you how many paying subscribers today don't even know that they're entitled to roadside assistance. And so we've been using AI to help get the right messages to the right customers, at the right time. And that is just helping to uncover the value that's there and drive a lot of our subscription growth.
Speaker 0
Next, we'd like to open it up to Nitin from Bank of America.
Speaker 9
So on the U.S. user growth side, can you help us understand like which regions or demographic cohorts contributed most meaningfully to the user additions in 1Q. And as we look ahead for the remainder of the year, where do you still see like the largest white space opportunities for growth within the U.S. And what do you believe are the key levers that could drive deeper penetration in those underpenetrated markets?
So growth in Q1 is pretty broad within the U.S. It's not necessarily one segment. But the key thing that we're seeing is that the premium devices are growing much more strongly than the Android devices that were impacted by the technical problems that we had. In terms of opportunities, we see two things. Historically, we've had stronger growth in regions where cars are really important. Our car value props resonate really well. One of the things we've been doing, one of the enhancements that's come out and been increasing in the app over the last couple of quarters is our awareness of other modalities. So riding bikes, walking and student trains. And that is helping us appeal to demographics where we haven't been as popular. So I'm hopeful that we'll see New York come up at some point. When we look at growth within our most penetrated states, the states that are doing well, we do see a real continuation of the momentum that we have there. So this is layering on to strong growth in our best regions, the ability to go after regions where the driving value props aren't as strong. The other opportunity, of course, are the less premium devices, states where Android is more popular where there's a higher propensity of lower-end devices. And we expect, as we improve those things, not only international markets will benefit, but it will also benefit the U.S.
Speaker 0
Next, like to open it up to James Bales.
Speaker 10
I just wanted to come back to the guidance revisions that you've given for the year, it tends to be focused on the subscription part of the business. And you talked about the conversion from MAU to Paying Circle as having better conversion performance. I guess, could you help us understand how that's changed and how much that's changed? And also, has there been any improvement in terms of the take-up of paid subs from free users?
So James, I think what we said is conversion has improved fairly dramatically. And we've been talking for a while about the impact of our marketing efforts and how they've been very successful in really getting to people with a greater propensity to convert to subscription, that's part of it. The member experience that Lauren referred to earlier is definitely part of it. And so that is all building in terms of conversion, and when we look at the MAU growth sort of to connect it to—our growth has not slowed down at all in those higher premium devices that are the ones that are more likely to convert. So all of that is sort of driving a higher conversion and all the way through to the Paying Circle growth that we're seeing.
Yes, that's actually worth double clicking on. Not only has growth in those premium cohorts not slowed down. We're actually seeing the improvement that we expected to see in those cohorts that are not impacted by the technical program.
Speaker 10
Okay. And so I guess the question I had was basically, are you seeing improvement on the new customers added, and that's the big driver, that when they're signing up for the first time, you're getting an uplift in the percentage to convert to paid? Or are you also seeing it in the existing base?
We're seeing a little bit of both. We're definitely seeing new customers with a higher propensity to come in.
Yes. I'd say it's the new customer stream that's driving it primarily, but we're certainly not seeing any falloff in previous cohorts.
Speaker 0
Next, we'd like to open it up to Stephen Ju from UBS.
Speaker 11
So wondering if you can update us on the state of the elderly segment product development. And secondarily, whether there's anything you can share about the type of advertisers who are showing up to your platform, whether they are performance advertisers or more the upper funnel brand advertisers?
Stephen, can you pick one, which one would you prefer?
I want to talk about aging parents. Okay. So on aging parents, I'm incredibly excited about the opportunity that we have to expand to serve more families at more life stages, and we're meaning those foundations with aging parents today, and we're starting to make changes in the core product that make it a better fit for those parents. And we have more work lined up, both in the back half of the year and years to come. The key thing here is that as we expand into things like Pets and Aging Parents, it's really important that we're disciplined and that we're doing it well and that we're seeing it through. And so you'll see us double down on Pets later this year, not just improving Pet GPS, but really looking at the whole pet ecosystem from our free customer to our subscriber customers and partnerships. And so we're making sure that we're following through with that so we can scale a really healthy part of our business and not just move on too quickly. So we are laying the foundation with aging parents, and you will see more this year, but that will build over the next few years.
Speaker 0
Thank you. Next, we'd like to open it up to Annabel Kuhn.
Speaker 12
Maybe just—obviously to get a little bit more detail on how Pets are going, maybe just how you guys are trying to get some more stock to have to sell the amount you guys are selling out, great to see the demand. And maybe if you could also comment on the types of customers who are buying the Pet GPS at the moment in terms of new users coming to Life360 platform, free user conversion and sort of like current gold members buying.
Yes. Great. We're really excited about the momentum that we're seeing in pets. First, on the free side, we're seeing something like 120,000 new customers or new pet profiles created every week. So really great momentum there. And of course, you know that we've sold out—at least in the U.S., we've sold out of our pet trackers pretty quickly. We're now—we've moved that manufacturing to a new location, and we are retooling and getting ready to build up or getting the inventory ready to relaunch in the summer. So we're excited about that progress there. In terms of what we're seeing, one thing that's interesting is that a lot of the customers that are pet customers are pre-teenage families. So there are a lot of them that are earlier in their life cycle than the typical Life360 family. And that's helping us think about how we want to shape those offers. One of the things that we've been doing in Q1 is a lot of price testing. I know a lot of you have observed a lot of different prices and different mechanisms by which we're selling this. But that insight that a lot of these customers are early in the journey means some of the things in the current lineup are more or less appealing to them at different layers of tiering and that's informing how we're going to go to market in Q3.
Speaker 0
Next, we'd like to open it up to Andrew Boone.
Speaker 13
I wanted to ask about marketing campaigns. You guys were lapping a very successful campaign in 2025. And yet it sounds like you're seeing pretty good success in terms of what you're doing in '26. Can you just unpack that? Help us understand what the changes are? How do we think about the lapping of last year's strong campaign? And what's changed this year?
So, it's hard for me to compare exactly one campaign to another. I would say we continue to see really good performance of our advertising—we're very much focused on demand creation, on building what we talk about as building an iconic brand and getting—making it so that more people understand our brand. So, when they encounter us, they're more likely to join and eventually convert. We're really happy with the overall progress in that, and we are teeing up new campaigns. I will say, we are more likely to lean into that after we've sort of gotten through this little wave of the technical suppression on our registration—I feel like it was frustrating to me that during the height of our Q1 marketing, we were facing these technical issues and so as we come out of that we'll lean back into our marketing.
Andrew, we've also talked about—this year, our plan is to spend more in international territories. And again, where we've talked about our sort of focused territories, particularly Brazil and Mexico and Germany. And we're really sort of laying out their campaigns and going to support the go-to-market in those territories.
Speaker 0
Thanks, Andrew. Next, we'd like to open it up to Andrew Gillies. Andrew, can you meet your line and ask a question. Andrew Gillies, Macquarie. Come back to it. Yes. We'll come back to you, Andrew. Rob Sanderson. Rob, are you available? Please meet your line and ask a question.
Speaker 14
Yes. I wanted to talk a little bit about go-to-market on your ads business. So, as we talk to agencies and brands, there's obviously a high degree of interest in real-time location but a very low availability of supply. And difficult to scale and not really worth putting a lot of energy into it, but clearly, high interest. So obviously, Nativo publisher network brings a lot on the supply side. So that's, I think, really good unlock there. But the question is really on scaling the demand side. We're watching OpenAI come to market and they're partnering to get its advertising business off the ground. Just why would a similar strategy that includes demand-side partners, maybe not make sense for Life360 today? And is that something you might consider more in the future?
Yes. We're definitely looking both at supply and demand. Nativo gives us that capacity to be able to work both sides. It's one of the reasons that Nativo is such a great fit for us.
Speaker 14
And then on the demand side in terms of partnerships?
I'm not sure I understood exactly what the question is. We certainly are building our demand and pursuing new partners on that.
Speaker 14
Right. So the question, Lauren. I'll be specific, is engaging with third-party partnerships on the demand side instead of just going on a first-party basis.
Yes, we do look at that. And so we will continue to invest in that. We should probably follow up and get some of our specialists to talk with you about that.
Speaker 0
Next, I'd like to open it up to Siraj Ahmed. Siraj, can you meet your line and ask question. Unfortunately, looks like you are not there. We'll try Roger Samuel. Roger, can you meet your line and ask a question.
Speaker 15
Yes. I've got a question on your stock-based compensation, which has grown substantially—up 64% versus PCP. And I get it is because of Nativo, but I think at the full year results, you were guiding to stock-based compensation to increase by 40%, and I'm just wondering if—yes, yes, things will normalize in the next quarters.
Yes. I think it will normalize to some extent. SBC isn't necessarily something that lays out evenly over the quarters. And to your point, we took on 125 heads with Nativo from the first day of Q1, plus we've had some additional growth ourselves. So, there's a few factors that go into that, and it will tend to normalize over the course of the year.
Speaker 0
Thanks, Roger. Next, we'd like to open it up to Chris Smith. Chris, can you ask your question.
Speaker 16
Look, just one for me. Just interested in your thoughts around the capital allocation framework and what's holding you back from initiating a buyback? Like we've clearly seen the balance sheet strengthen, the business is now generating consistent free cash flow. The conversion rate of Paying Circles in that first quarter, nearly 3x on the previous quarter. You're talking to MAU sort of incrementally doubling in the second quarter. So, what's not giving you the confidence or why not initiate a buyback just to sort of give that confidence that you've clearly got in the business to the market?
So Chris, I'd have to say I agree with all of the points that you made in terms of the strength of the business. That's absolutely true. And we are hearing that from investors and hearing the suggestions for buyback. We absolutely will consider it. And it's part of a—you're looking at a balanced capital management strategy. We also view ourselves still very much as a growth company, as there are multiple opportunities for us to invest in growth in the future. And we want to balance those things out. But it is definitely something that we will look at closely.
Speaker 16
Because I think if you just look at that first quarter conversion rate of Paying Circles from MAUs, it's nearly 10%. And I know you can't look at that in terms of the number of members per Paying Circle or circle, but that strength and that must give you extreme confidence about the outlook.
It really does. The subscription side of the business, the core business is growing incredibly well. The strength of that business is evident in all of those metrics. So yes, I can only agree with you.
Speaker 0
Thanks, Chris. Right. We'd like to go back to Siraj Ahmed. Siraj, can you unmute your line and ask your question. Seems to be working now. Can you hear me okay?
Speaker 17
All right, great. Lauren, just actually maybe a quick clarification on the whole fraud thing that you mentioned. So, have those customers actually come back? Because you said they're in the funnel, but didn't really register. And secondly, just in terms of Paying Circles, pretty strong conversion, but you're flagging with AI benefits. Was that through the course of the quarter? Just wondering whether we can see that continue to improve into the second quarter? And how does this whole family AI initiative link up with Paying Circle conversion?
I think it's about fraud and then the Family AI initiative. I'll let Lauren take the fraud part.
Okay. So the first question was—remind me what the question was... Right, fraud. So the first part: what happens here is when traffic is coming in, we were not getting some of those customers. So those particular customers that may have come in and been turned away—we don't magically get them back. What we do is we repair that—and this part has already been fixed. We sort of repair that problem so that as new traffic is coming in, and hopefully, some of those same people return again. But as new traffic is coming in that part of the funnel performs healthy again. For the Family AI initiative and Paying Circle conversion: I'll separate those two things. Just in general, the Paying Circle conversions, we expect to continue to hold strong and improve over time. The way that AI is really impacting Paying Circle conversion today is more about feature discovery than about those new capabilities. That's the way it's driving Paying Circle conversion and growth today. What we're doing now with AI is starting to weave it into features so that we have—we use more intelligence about what people are doing to make new features that help orchestrate family life. I would like to give the example of carpool, which is one of those crazy times in every parent's life. And what are the things we can do if we know who is nearby and what people's schedules are to inform those kinds of things. So, those kinds of AI capabilities will play out over a long time horizon. But the kinds of ways that we're using AI today to get the right message to the right people are already having a positive impact in the business. There were a lot of questions there, so I hope I answered them.
Speaker 0
We'd like to go to Andrew Gillies. Andrew, if you could unmute your line and ask a question.
Speaker 18
Guys, can you hear me? Perfect. Just a quick question on Nativo and the relationships you've got there. Obviously, that's very core to the business and the growth story. How has the retention dynamics been? Are there any opportunities there and effectively just a bit of an update would be great.
Overall, the Nativo business—or what was the Nativo business—is holding strong, and a lot of people who have long been customers there are looking to do more with us now that we have a broader offering and more capabilities, especially on the measurement side. So, we see a real opportunity to increase performance there. There were maybe one or two customers who were with Nativo that aren't necessarily a great fit—one customer in particular that sees us as competitive. But for the most part, customers have decided to double down and are looking for new ways they can expand their relationship now that we're one company.
Speaker 0
Thanks, Andrew. Next, we'd like to go to Wei-Weng Chen. Wei-Weng, can you unmute your line and ask a question.
Speaker 19
Just a question on the AI initiative or kind of the start-up that Chris is leading within Life360. I guess the nature of start-ups as they generally burn a bunch of cash initially, while the product being developed and then, I guess, a viable product even then isn't necessarily guaranteed. Can you maybe speak to the level of resourcing that's going to be available to the startup? And then also maybe given Chris is the Exec Chair of the startup, I guess what are the governance structures as they relate to this startup? And are these costs factored into guidance?
Yes. So Chris is building a small team within the company. It's not a huge number of headcount. Of course, they're fortified with AI. So, they'll punch above their weight. The nice thing about being a startup within a broader company is that we can start to harness some of the benefits of the work that they're doing sooner, even if some of the work that they're doing takes longer to play out. And they also benefit from learning and progress that we're making in the rest of the company. So, it's not the same as being a fully on-your-own isolated startup. Chris and I have a pretty good relationship around this, where they're really free to push the limits and do whatever it is, I think, is really going to get us to that next level of meeting families' needs. And then we have sort of a way that we evaluate that to decide what goes into production from that based on a couple of gates that we set up. So it's pretty exciting.
And Wei, that small resource that's being allocated there is absolutely considered within our guidance for the year.
Speaker 0
Thanks, all. We've gone through the first question, so we're going to open it up to the last part of the queue. I'd like to go to Chris Savage. Chris, can you unmute your line and ask your question. Chris, do you have a follow-up question?
Speaker 8
No, I'm fine, RJ.
Speaker 0
That's good, Chris. Okay. Thanks, Chris. Next, we'd like to open it back up to Mark Kelley. Mark, can you unmute and ask the question?
Speaker 7
I just wanted to ask you about Paying Circle size over time. Like have you seen the number of MAU within Paying Circles change at all over the last year or so? And I guess, do you have any expectations going forward?
So in general, as circles age, they tend to get bigger. And so as our population ages, the number creeps up a little bit, but that's more about sort of mix shift over time. One of the interesting things about expanding to more life stages and pets in particular, the families that were more likely to become Paying Circles are a little bit larger than our average circle size, but families with pets are often these smaller one- and two-person circles. And so that's figuring into our go-to-market strategy that we're developing for the back half of the year.
Speaker 7
Okay. And maybe a quick follow-up would be, like if we're going to look at average Paying Circle size just for modeling purposes, just to get to like a better penetration rate. Has that been pretty consistent over time?
It has. It's been fairly consistent around the 3.3 level.
Speaker 0
Thanks, Mark. We have one final question. Annabel Kuhn. Annabel, can you unmute your line and ask your question.
Speaker 20
Just a quick modeling question around hardware as a commentary in the note with respect to similar gross profit coming to the second quarter. Maybe just a bit of comment on what's sort of driving that. Should we think about with the pricing initiatives, maybe like a more of a loss leading from pets and sort of how is the Tile exit going? And how should we think about modeling that out for the rest of the year as well?
Yes. No problem. I think we will look to have hardware margins sort of normalize to some extent. But it will remain negative during the course of this year because we're going to support the Pet GPS launch and sort of getting that in the hands of people. I think Q1 was a very high level of negative margin primarily because on top of the Pet GPS testing that we were doing, we also had the brick-and-mortar exit and the exit costs related to that. So it will come back substantially in Q2 and over the balance of the year, but I would still expect call it high-teen negative margins in hardware. And as we've always noted, hardware revenue as a proportion of our total revenue continues to get smaller and smaller.
Speaker 0
Thanks, Annabel. We had Eric Choi requeue. Eric, can you unmute your line and ask a question.
Speaker 4
Thanks, RJ. I wonder if I could do two if I'm the last one. I had a follow-up on the subscription revenue and then a follow-up on the buyback—just on the subscription revenues, sorry, if I stuff up the math, Russell. Just for the full year, nominally, you're guiding to about $104 million of subscription revenue growth which is like in the first quarter, you did about $26 million of normal subscription revenue growth. So if you just annualize that first quarter, you get the full year. Given you had the technical disruptions in the first quarter and Paying Circle growth is typically lower in the first quarter. So the obvious question is, is that conservative? And then the second question, just a follow-on on Chris. I know you said you're considering a buyback, but just like what are the natural consideration points? Like I know you just finished Nativo and you've deployed the cash for that, but are you waiting on any other sort of key milestones before you make a decision on whether to do a buyback or something else?
So in terms of the progression of subscription revenue over the course of the year, we do expect similar levels of growth when you look at it on a period-by-period comparison. As we maintain that sort of percentage revenue growth we're really getting more and more volume there. So, I think it's a fair assumption that we maintain that growth over the year. In terms of the capital management side, there's a few things that we need to consider. We—as you point out—are effectively finalizing the integration of the Nativo acquisition. We're looking at our strategic planning over the next few years. And you're factoring in our very significant growth aspirations there. So, all of those will be factored in as well as the market conditions at the time.
Speaker 0
Thanks, Eric. All right. That concludes our questions. Lauren, I'll turn it over to you to sign off.
Okay. Well, we're pretty excited with the momentum that we're seeing in the core business and excited for what's to come. We've got a lot of great end-user value and good GTM stuff planned for the back half of the year. So, we're excited to talk about that next time we meet with you.