Operator
Good morning. My name is Regina, and I will be your conference operator today. At this time, I would like to welcome everyone to the Orrstown Financial Services, Inc. second quarter 2026 earnings conference call. All lines have been placed on mute to prevent any background noise. After the speaker's remarks, there will be a question and answer session. If you'd like to ask a question during the Q&A session, simply press star followed by the number 1 on your telephone keypad. If you'd like to withdraw your question, press star 1 a second time. I will now turn the call over to Adam Metz, President and Chief Executive Officer of Orstown Financial Services, Inc. and Orstown Bank, who will begin the conference. Mr. Metz, please go ahead.
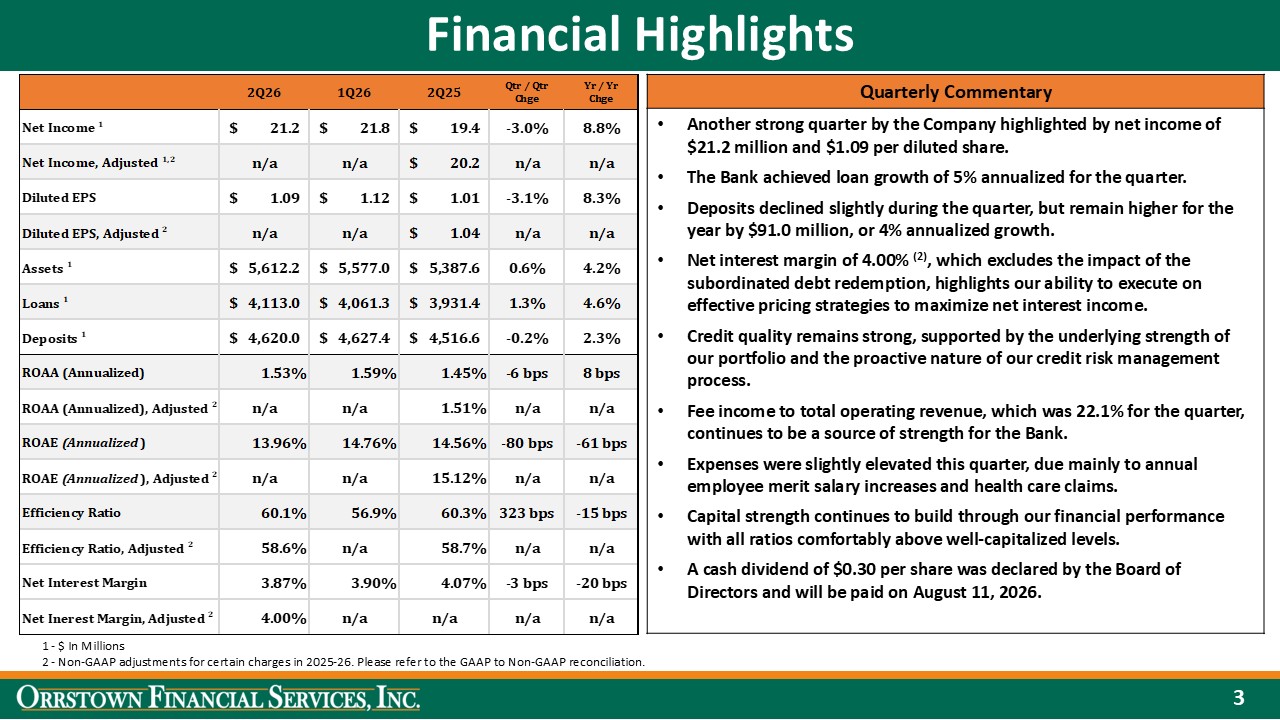
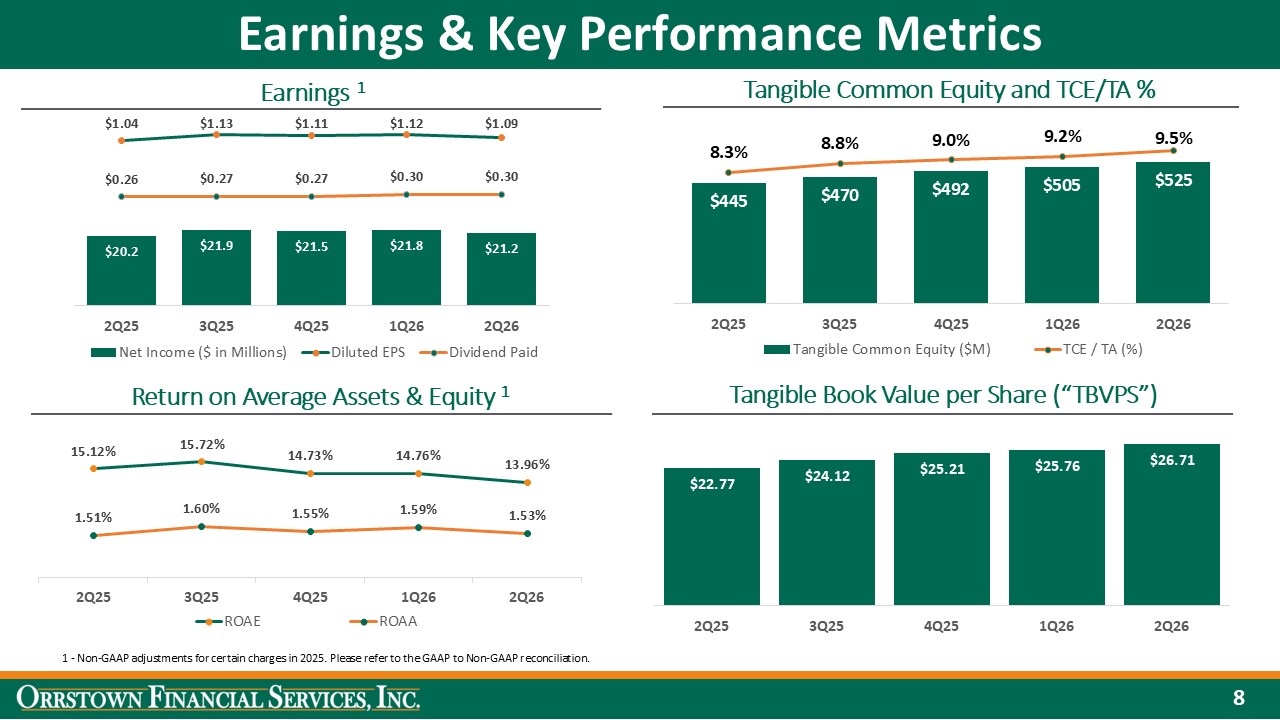
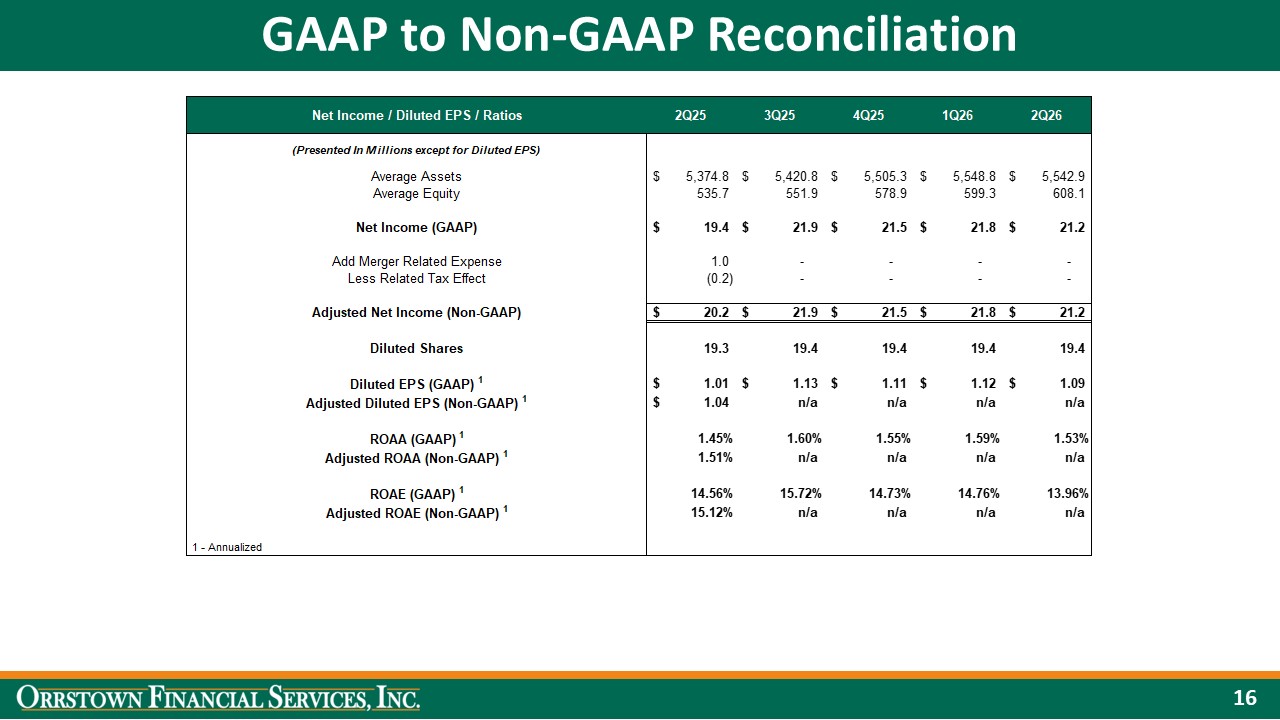
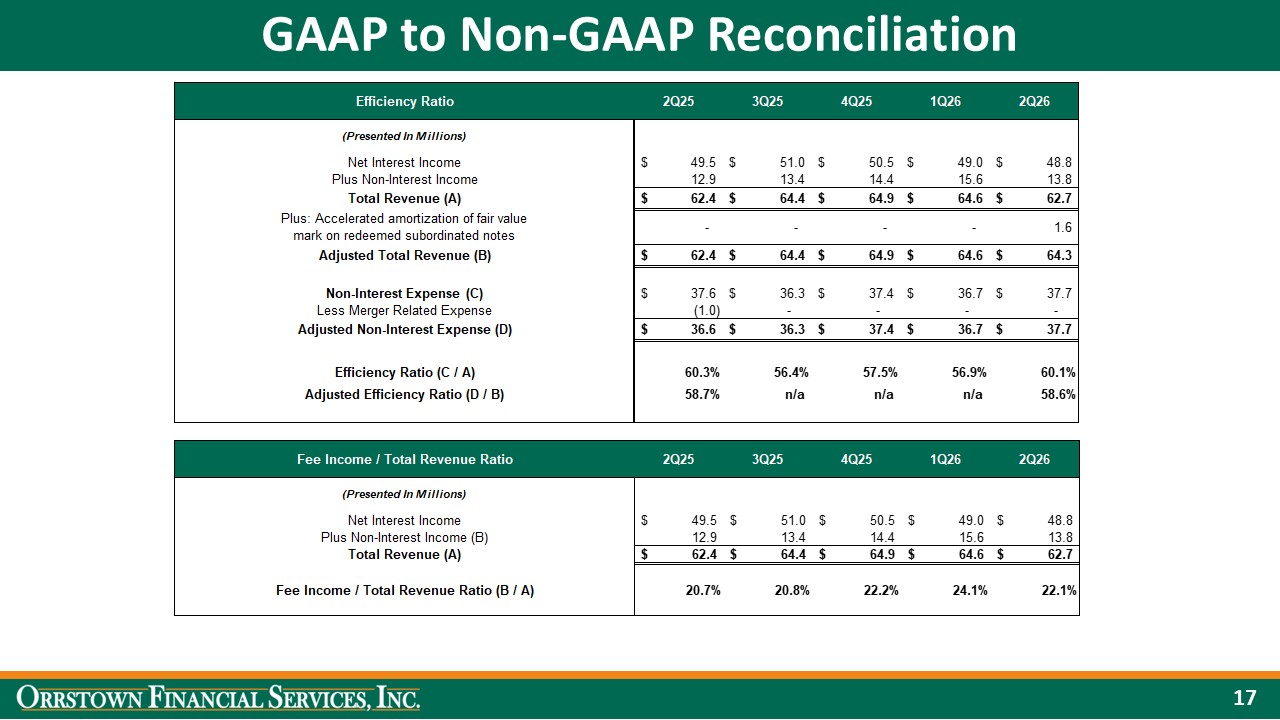
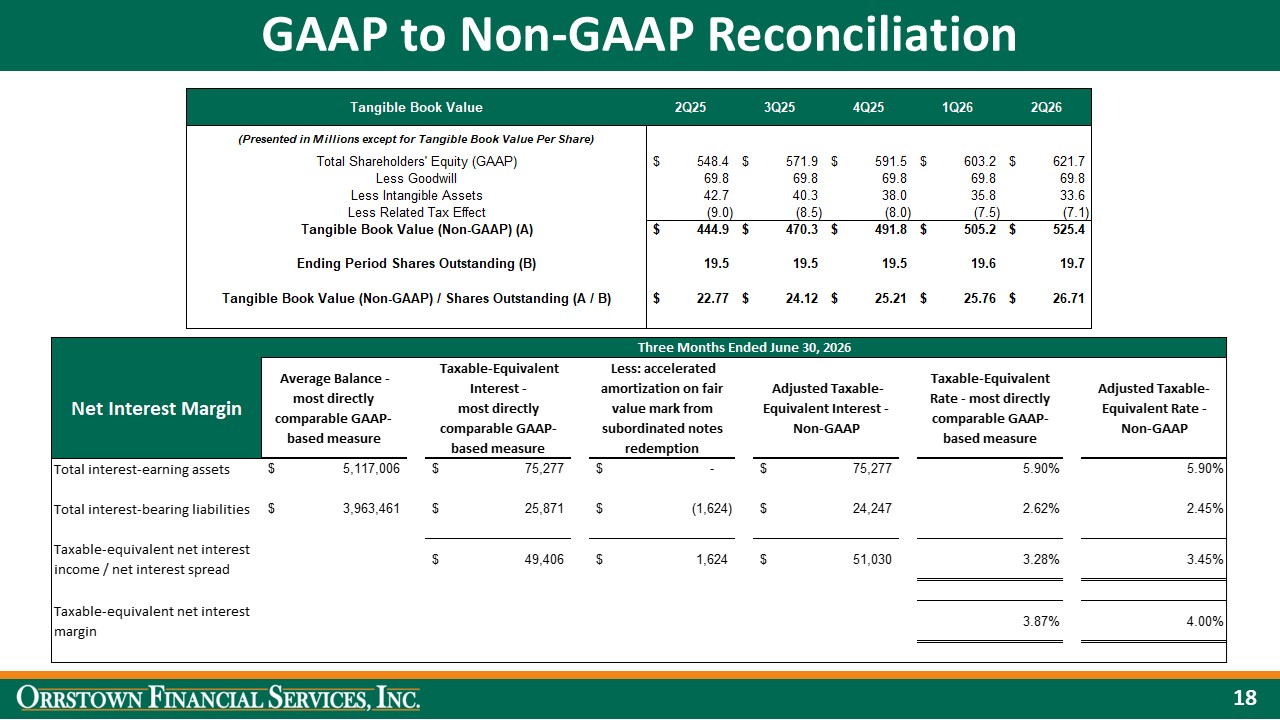
Thank you, Regina, and good morning. I would like to thank everyone for participating in Orstown's second quarter 2026 earnings conference call, both by telephone and through the webcast. If you have not read the earnings release we issued yesterday afternoon, you may access it along with the financial tables and schedules by going to our website, www.orstown.com. Once there, you can click the Investor Relations link and then on the Events and Presentations link. Also, before we start, I would like to mention that today's presentation may contain forward-looking information. Cautionary statements about this information are included in the earnings release, the investor presentation, and our SEC filings. The earnings release investor presentation also include non-GAAP financial measures. The appropriate reconciliations to GAAP are included in those documents. Joining me today on the call is Neil Kalani, Horsetown Chief Financial Officer. Also participating in the discussion are Zach Corey, Chief Revenue Officer, Bob Karate, Chief Risk Officer, and Dave Chikowski, Chief Credit Officer. Orstown produced another strong, outstanding quarter highlighted by strong net income, earnings per share, return on average assets, and return on average equity. Net income was $21.2 million, or $1.09 per diluted share. Return-on-average equity and return-on-average assets continued to exceed peer multiples. Excluding the impact of a one-time charge to interest expense, the net interest margin improved 10 basis points to 4% during the quarter. Fee income of $13.8 million contributed 22.1% of total operating income. Wealth management income continues to be a source of strength for the bank. We redeemed our remaining subordinated notes, which resulted in a charge of $1.6 million, but is expected to enhance go forward results. Despite higher than expected payoffs and paydowns, the bank achieved annualized loan growth of 5% for the quarter, with a meaningful portion of that growth occurring late in the quarter and therefore having a limited impact on second quarter interest income. Credit quality remains strong. Classified loans and non-accrual loans both decrease quarter to quarter. We remain prudent in our lending decisions, but we believe that the credit environment remains sound and without significant signs of stress. We maintain a long-term focus on generating earnings and growth to continually build shareholder value. In support of that, the board declared a quarterly dividend of $0.30 per share payable in August. Neil Kalani, our CFO, will now discuss our quarterly results in more detail.
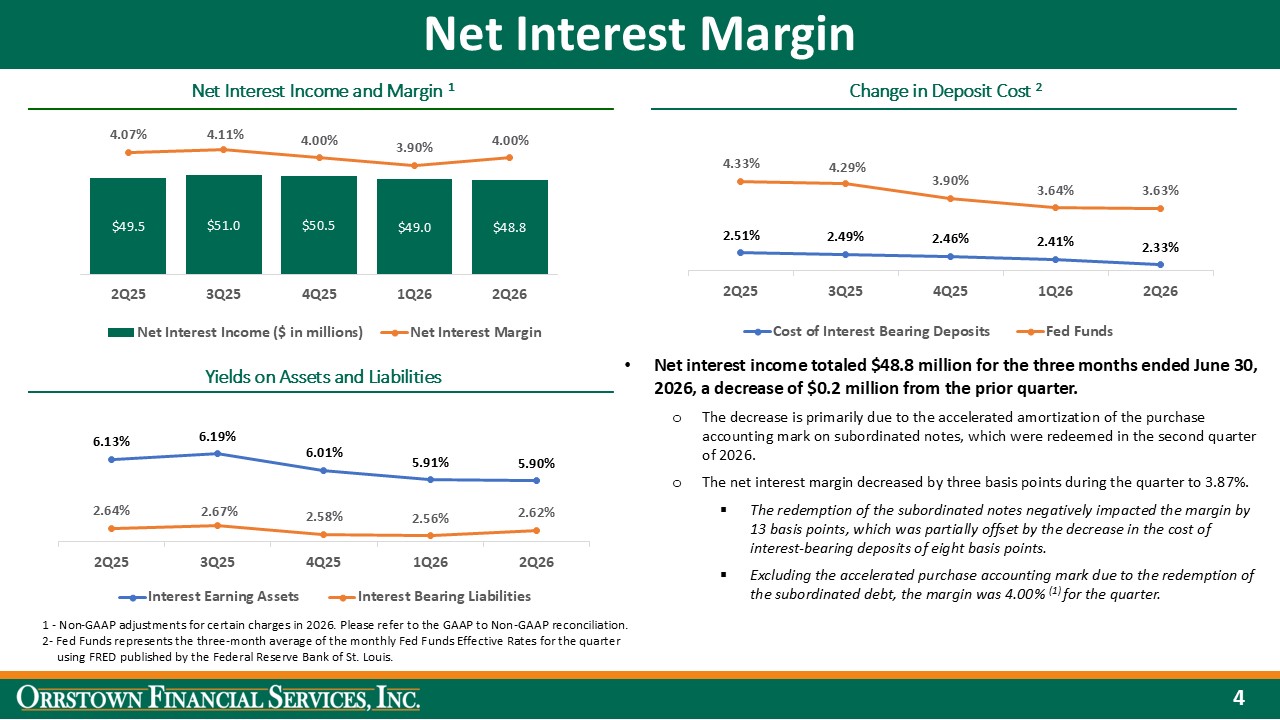
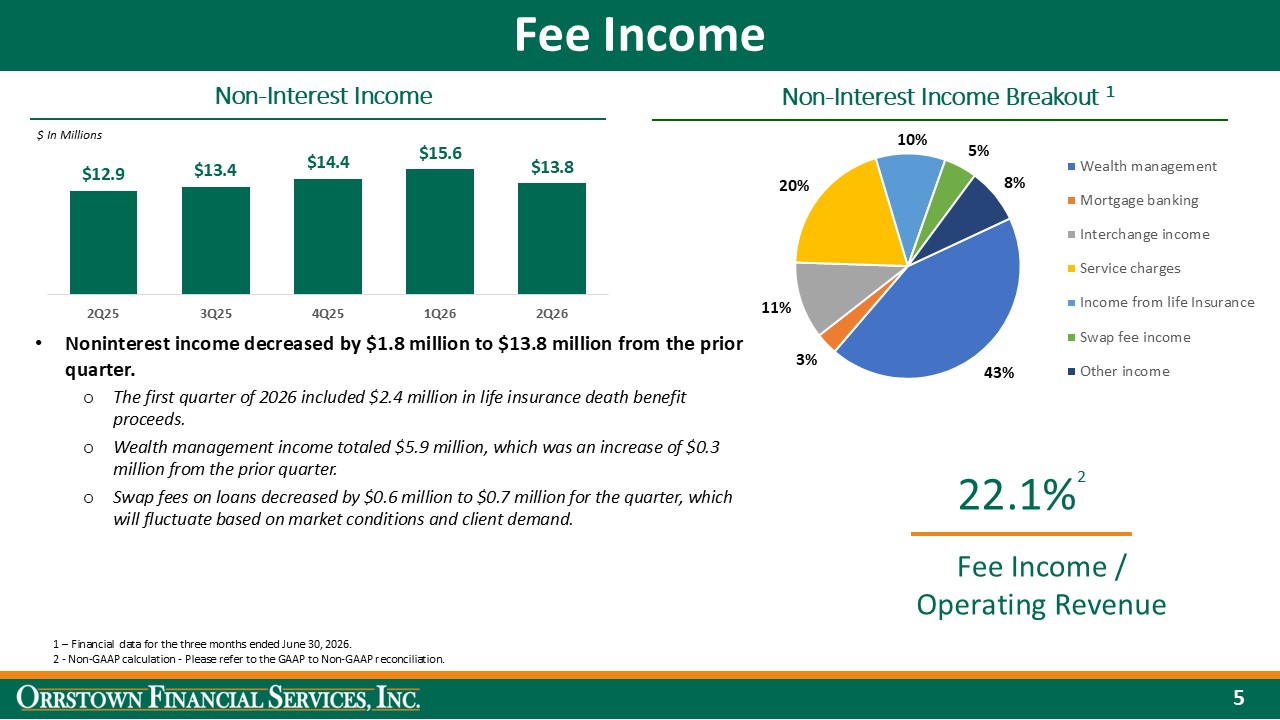
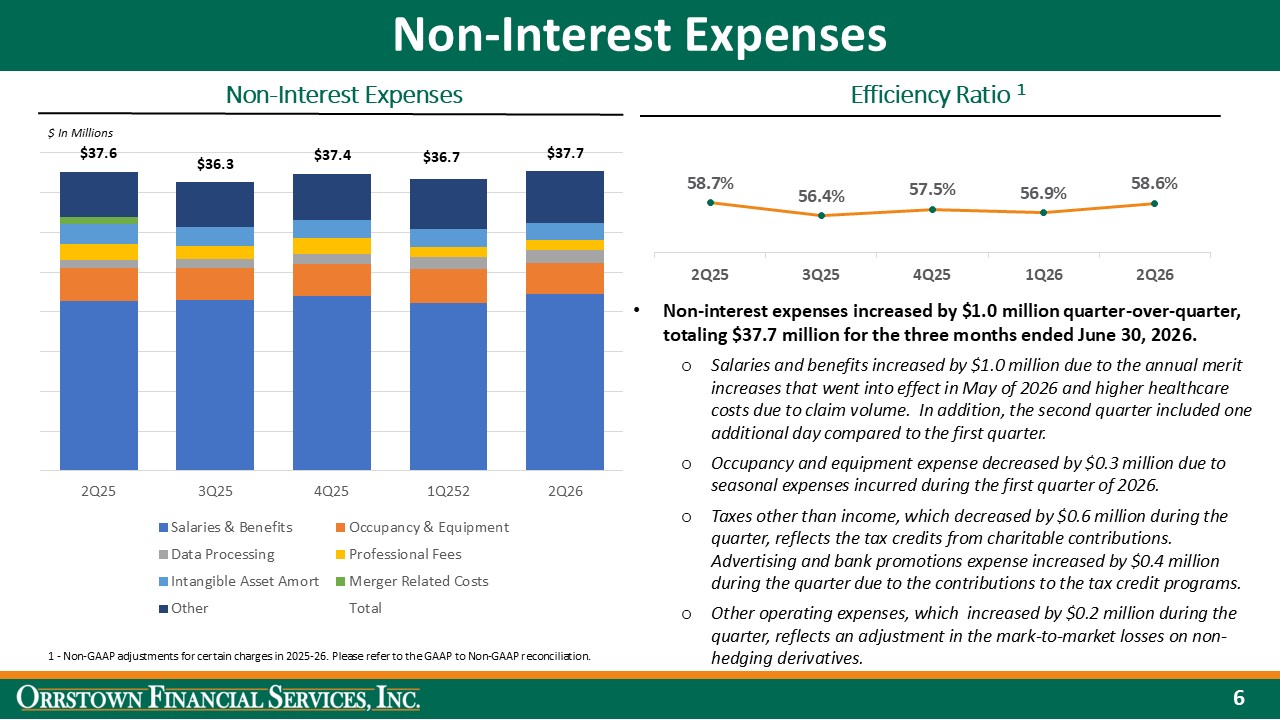
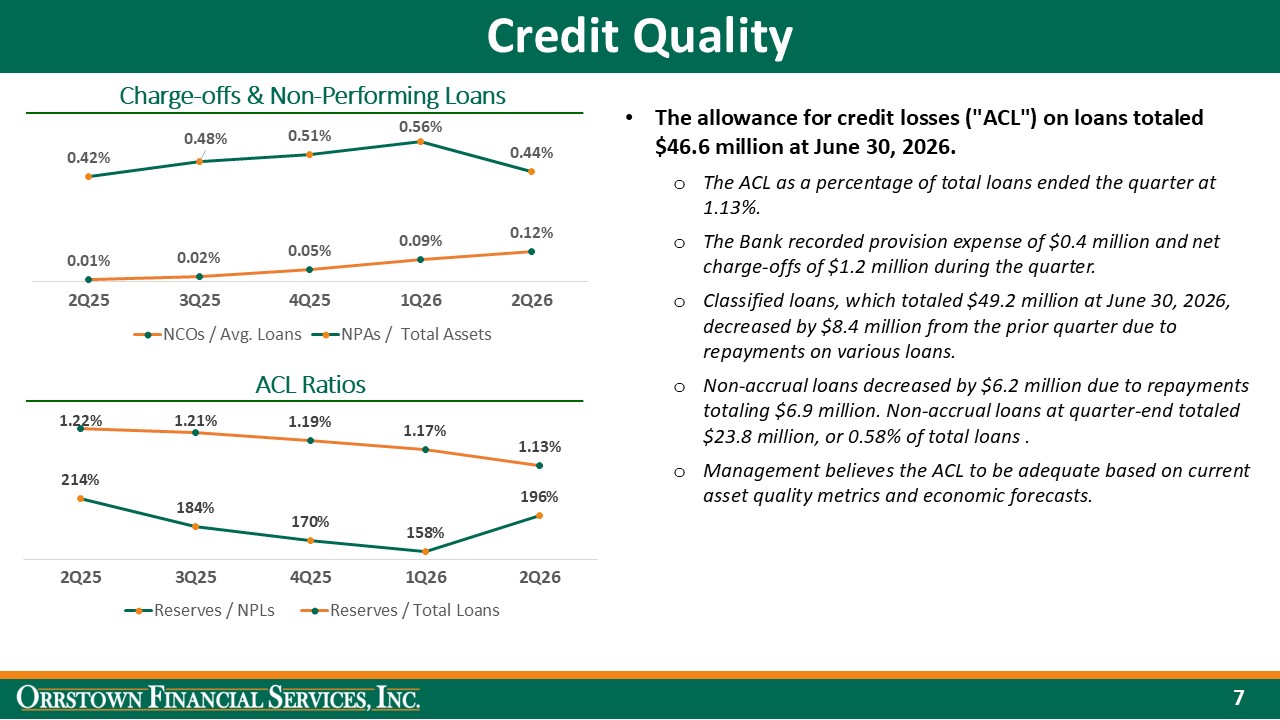
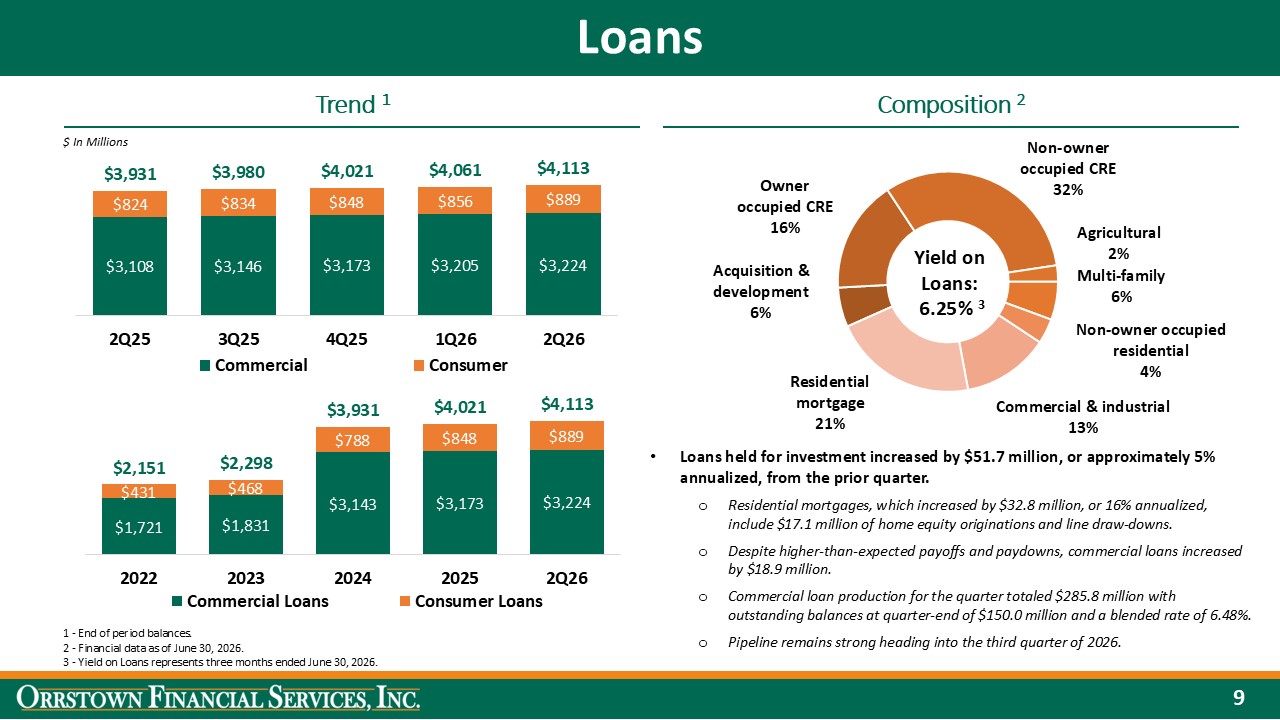
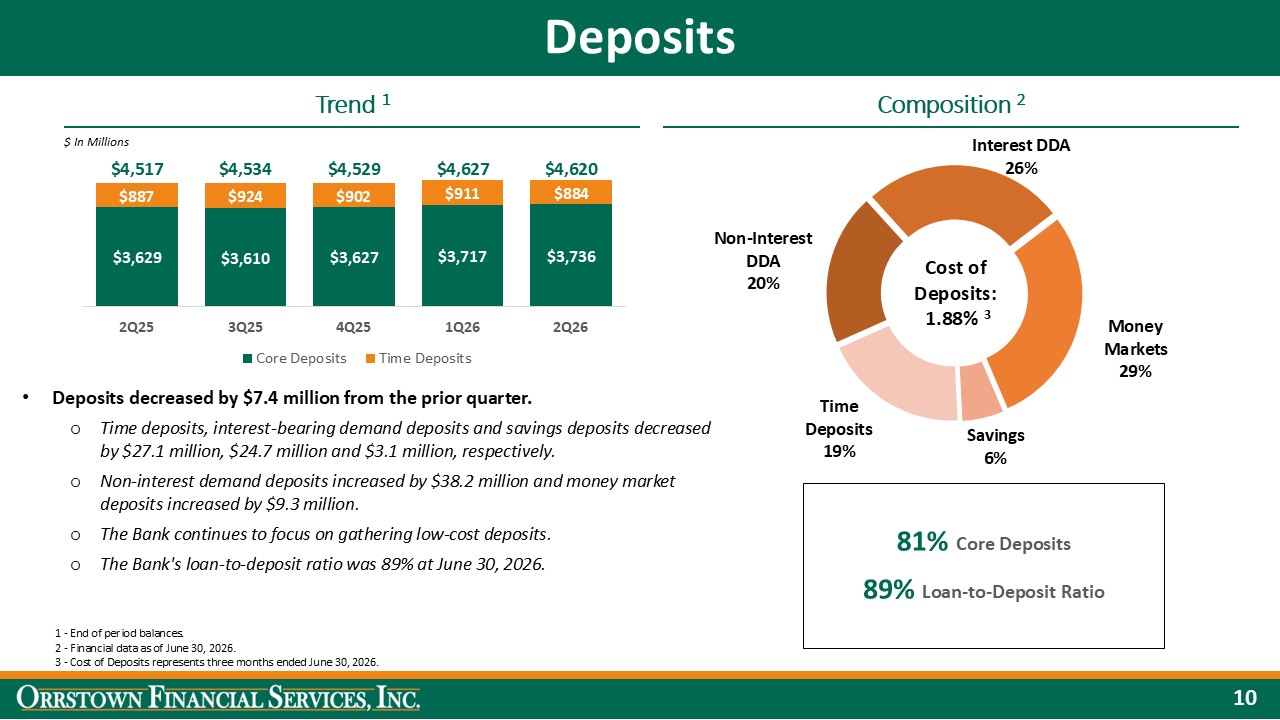
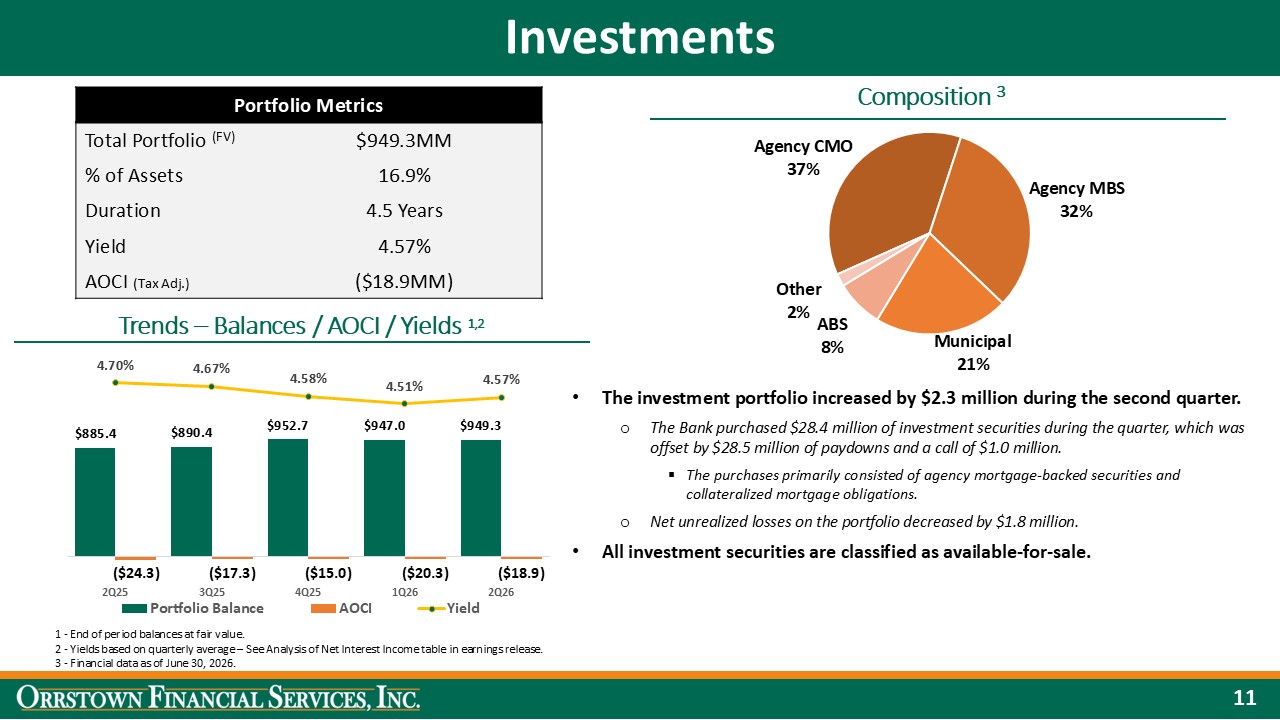
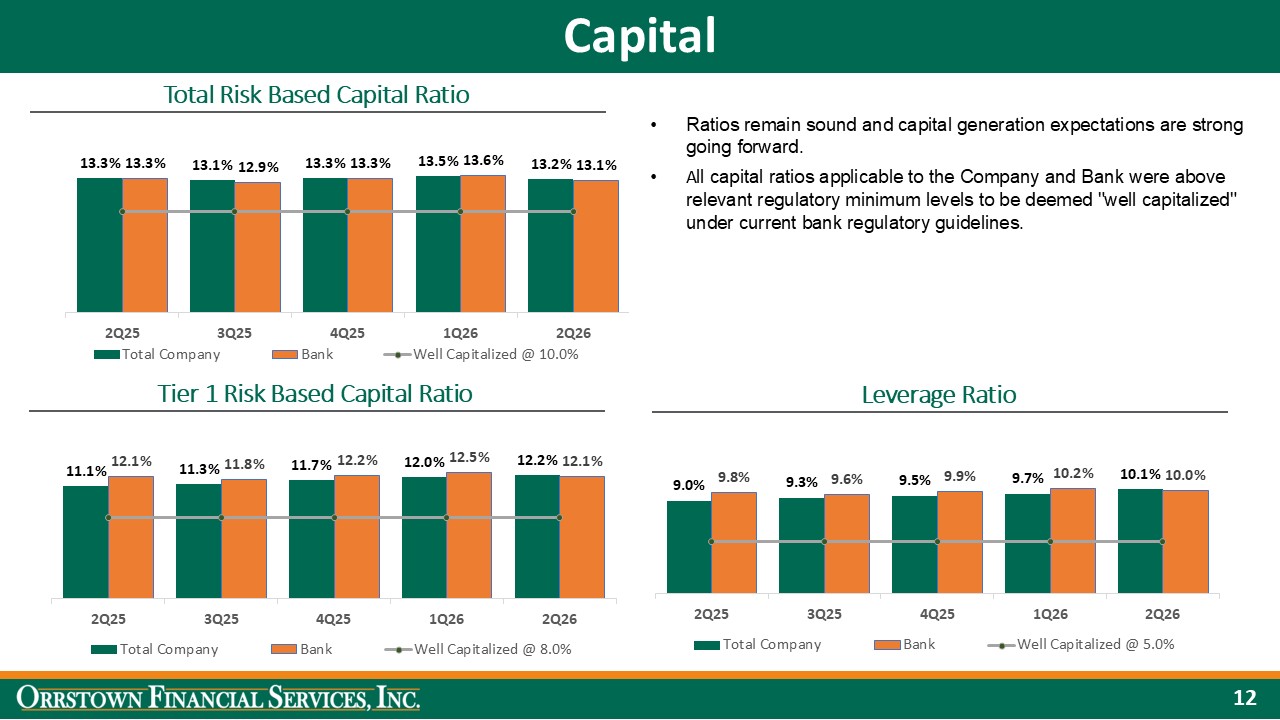
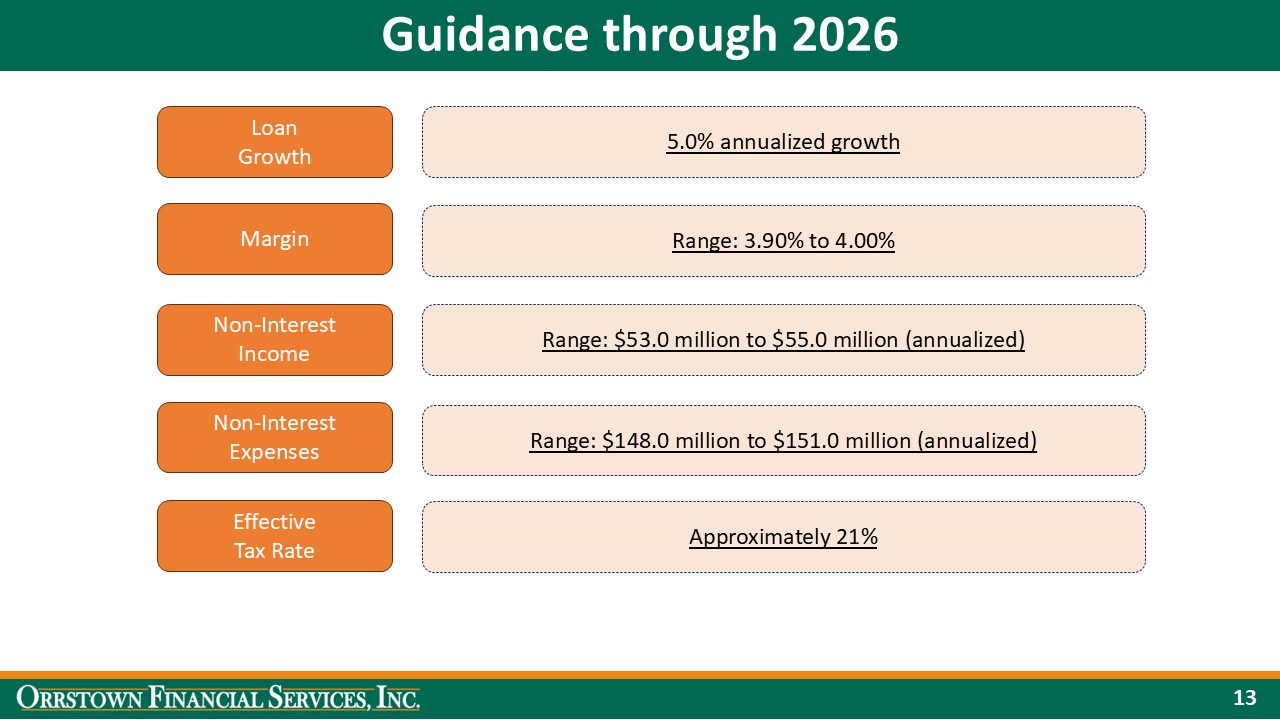
Thank you, Adam. Good morning, everyone. We had an excellent second quarter with net income of $21.2 million, or $1.09 in earnings per diluted share. Return on average assets for the quarter was 153, and return on average equity was 13.96%. Most notable for the quarter was our net interest margin expansion. On slide four of the earnings deck, you see that our reported net interest margin was 387 in the second quarter. But if you exclude the impact of a one-time $1.6 million charge due to the subordinated debt redemption, our margin got back to 4% even, which is where it was in the fourth quarter of 2025. This was accomplished by a combination of actions on the funding side. we made some adjustments on deposit costs early this early this quarter and recognized early in the first quarter sorry and and recognized the full benefit of mid-quarter like back up apologize we recognized the benefit of chain rate adjustments this this quarter and recognized the full benefit of mid-quarter adjustments last quarter also the influx of deposits in the first quarter enabled us to reduce reliance on overnight borrowings i believe our deposit costs have bottomed out at this stage. The previous guidance for net interest margin in the range of 390 to 4% for 2026 remains, and that's excluding the $1.6 million charge. With the deliberate steps we took in the first half of this year and our continued focus on deposit mix, I now expect that we'll be in the higher end of that range for the full year on an adjusted basis. The deposit environment remains very competitive, so there's always risk with future pricing pressures and deposit generation. And on the loan side, many of our fundings were pushed into late June. So the impact of that activity is not fully reflected in net interest income. So overall, I'm pleased with where we're positioned with the margin and its components. On slide five, fee income declined to $13.8 million in the second quarter from $15.6 million in the first quarter of 2026. In the first quarter, $2.4 million of life insurance benefits were recognized, Excluding that item, fee income is approximately $600,000 higher than the previous quarter. In the second quarter, Orstown Financial Advisors, our wealth management team, recorded income of $5.9 million, up from $5.6 million in the prior quarter. This was their highest quarterly income on record. We're very excited about both what that team has accomplished and the opportunities that lie ahead. Swap fees were around $700,000 in the quarter. the balance will continue to fluctuate based on timing but remains a consistent source of solid fee income for us. I expect non-interest income to be in a similar range as the second quarter for the remainder of the year with full year guidance unchanged. Slide six is non-interest expenses. Expenses increased by $938,000 this quarter to $37.7 million. Salaries and benefits drove that increase due to the impact of annual merit increases and higher health care costs. Due to a few one-off items, I would expect this number to come down a little bit in the third quarter. I still expect our expenses will fall into the lower end of the range previously provided for the full year. I provide my usual caveat here that we will not hesitate to make a strategic investment to help us in the future if an opportunity arises. Slide seven covers credit quality. Provision expense was $338,000 for the quarter. We had approximately $1.2 million of net charge-offs. We had a few qualitative factor adjustments in our model due to improvements in certain underlying metrics, which offset some of the charge-off impact. Our allowance coverage ratio was 1.13% at June 30th, and we believe it remains adequately aligned with the risk profile of our loan portfolio. Classified loans have steadily declined for several quarters, which is a very positive trend. Nonaccruals declined by $6.2 million from the first quarter, as our credit team continues to do an excellent job of managing our portfolio. The earnings and performance metrics are on slide eight. All metrics remain strong. TCE has increased to 9.5%, and tangible book value per share continues to grow at a nice rate. Slide nine addresses our loan portfolio. Loans grew by 5% in a quarter with stable loan yields. Growth was strong for consumer loans. We had $286 million of commercial loan production during the second quarter. the net fundings reflected some unexpected payoff activity. We still feel confident about the loan growth guidance as the pipeline remains strong. As shown on slide 10, deposits declined by $7.4 million in the second quarter. There is some seasonality in prior quarter deposit growth, so we feel good about our net deposit activity for the quarter. A specific highlight is a continued change in mix as non-interest-bearing deposits increased by $39 million during the quarter. Our team is actively seeking new low-cost deposit sources. The loan-to-deposit ratio increased a little bit to 89 percent, still in a good position to support balance sheet growth. Cost of total deposits declined to 1.88 percent for the second quarter from 1.96, with this improvement being driven by the actions taken that I referenced earlier. The investment portfolio was discussed on slide 11, the overall portfolio yield, remain strong, and the unrealized losses have declined to $18.9 million. As presented on slide 12, our total risk-based capital ratio declined from the prior quarter. This is the result of the redemption of $31 million of subordinated debt at June 30th, 26, and we expect to recover the capital impact of this redemption within two quarters. The anticipated strength of future earnings is expected to drive further capital generation. We continue to believe we're positioned to take advantage of various capital allocation options. So to summarize the quarter, we have a strong expansion in our net interest margin. Our effective management of funding costs, coupled with the impact of the subordinated debt redemption, will help us maintain the margin at current levels. We took a one-time charge to interest expense associated with the redemption, but the impact was offset with the benefit of a tax credit. Fee income remains a core strength, which also presents many future opportunities for growth. Expenses will continue to be managed closely. All combined are expected to drive us to a strong future earnings generation. So thank you for your time this morning, and I'll now turn it back to Adam Metz for his closing remarks. Thank you, Neil.
As Neil has emphasized, it was another outstanding quarter. As we look ahead, we remain confident in our strategy, our team, and the opportunities in front of us. While the operating environment will undoubtedly continue to evolve, our focus remains unchanged, serving our clients exceptionally well, investing thoughtfully in our people and technology, maintaining strong risk discipline, and allocating capital to create long-term shareholder value finally i'd like to thank our employees for their dedication and our clients and shareholders for the trust they place in us we appreciate your continued support and look forward to updating you on our achievements next quarter we would now like to open the call to questions before we get started regina will briefly review the instructions with me at this time i'd like
Operator
to remind everyone in order to ask a question, press star, then the number one on your telephone keypad. We'll pause for just a moment to compile the Q&A roster. Our first question will come from the line of Tim Switzer with KPW. Please go ahead.
Hey, good morning, guys. Thank you for taking my questions.
First one I have is on the commentary around loan growth really picking up in June, it sounds like. Is there any more color you can provide on, you know, maybe either what drove the slower growth in the first half of the quarter, whether that's some of the macro concerns or something else, and then, you know, the acceleration at the end, what drove that? And, you know, it kind of sounds like it's maybe falling through in the Q3 as well.
I think, you know, the loan growth, particularly the commercial, really was just a timing thing, Tim. And so we did have some unexpected payoffs earlier in the quarter, but the pipeline remains strong and, you know, our clients continue to seek funding opportunities. And so we're very optimistic about our growth going forward. We feel strong about it and the teams are excited.
But there's nothing to answer the other part of your question. there's nothing at a macro level that drove that it's really just client time yeah okay okay that's helpful um and then i mean it sounds like it's kind of similar to last quarter to deposit trend um at the end of the quarter could you maybe help us out with what's the spot min was at the end of the quarter excluding um the debt redemption and you know what are your expectations for the trajectory going forward assuming obviously no more rate cuts but if we don't have any rate hikes it sounds like we can continue to grind a little bit higher probably with uh deposit trends uh potentially once we get the full impact of the sub debt i we were the kind of
we're around that four percent level um for most of the most of the quarter particularly back half um i expect to be around that level going forward there is some opportunity potentially to to improve that a little bit, but I think this is likely we're going to sit. Like I said, I expect this to be excluding sub debt impact at the higher end of the broader range. But as a team, we're constantly focused on what things we can do to help drive that margin higher. I did point to the change. It's been several quarters now. We've seen a good shift in the mix. You see the time deposits coming down non-interest bearing and interest checking are in a good spot which I think non-interest bearing with the growth there so something we're continuing to focus on where we can where we can kind of focus to keep maintain and drive that margin higher okay okay that's helpful um and then another one is on deposit competition right now in your market are there any markets um or deposit categories that have you know seen intensifying competition over the last few months yeah i would say you know not really i mean i wouldn't pick uh pick one particular area
i think uh we feel like we're we're very competitive and like neil said i think we've teams have done a great job of sort of shifting our mix more towards non-interest bearing and those are operating accounts and and whatnot so uh we feel good about where we are okay and can you guys remind us you know what is your positioning if we do get some set of rate hikes what's the impact on the overall um margin um we're now um we're now positioned where we'll be um we're still slightly sensitive but more on the neutral side so let's just continue to focus on on
Okay, nice. That's all for me. I'll get back in the queue. And congratulations to Adam on your first conference call as CEO. Thank you.
Operator
Our next question will come from the line of Ken Kohut with Raymond James. Please go ahead. Ken, you might be on mute. Ken, you might have muted your line. We'll take our next question from the line of Jake Sabella with DA Davidson. Please go ahead.
Hi there. This is Catherine Hubbinger of DA Davidson for Jake Civiello. And we just have two questions for you. We were curious what geographies do your owner-occupied CRE loan growth in this quarter? Where do you believe that will be coming from? And then we were also curious if you believe that the uptick in home equity loans is the start of a new trend. Thank you so much.
Do you mind repeating the first part of your question we missed on that absolutely absolutely yes um we were just curious what geographies are you focusing on for the owner occupied CRE loan growth in this quarter there really wasn't uh any one particular uh geography that that was concentrated in uh it was it was uh within our our core geographic markets um I would say in terms of the concentration uh or the geographic locations of that owner-occupied real estate growth.
To your home equity question, it is a focus of the teams to try to drive that volume. We did see a nice uptick this quarter and started the previous quarter as well. So it's a nice boost to see this quarter and it's something we're going to continue to focus on and versifying our opportunities across the board, particularly with long growth.
Operator
And this concludes the Orstown Financial Services, Inc. second quarter 2026 earnings conference call. You may disconnect your line at this time.
Thank you for participating today. As always, if we can clarify any of the items discussed on this call or in the earnings release, please contact us.