Good evening, and welcome to Raymond James Financial's Fiscal First Quarter 2026 Earnings Call.
This call is being recorded and will be available for replay for 30 days on the company's Investor Relations website. I'm Christy Waugh, Senior Vice President of Investor Relations. Thank you for joining us. With me on the call today, our Chief Executive Officer, Paul Shukri, and Chief Financial Officer, Butch Orlog. The presentation, being reviewed today, is available on our Investor Relations website. Following the prepared remark, the operator will open the line for questions.
Calling your attention to slide two.
Please note that certain statements made during this call may constitute forward-looking statements. These statements include, but are not limited to, information concerning future strategic objectives, business prospects, financial results, industry or market conditions, anticipated timing and benefits of our acquisitions, and our level of success in integrating acquired businesses, anticipated results of litigation and regulatory development, and general economic conditions. In addition, words such as believes, expects, anticipates, intends, plans, estimates, projects, forecasts, and future or conditional verbs such as may, will, could, should, and would, as well as any other statements that necessarily depend on future events, are intended to identify forward-looking statements. Please note that there can be no assurance that actual results will not differ materially from those expressed in these statements. We urge you to consider the risks described in our most recent Form 10-K and subsequent Forms 10-Q and Forms 8-K, which are available on our website. Now, I'm happy to turn the call over to CEO Paul Shugri.
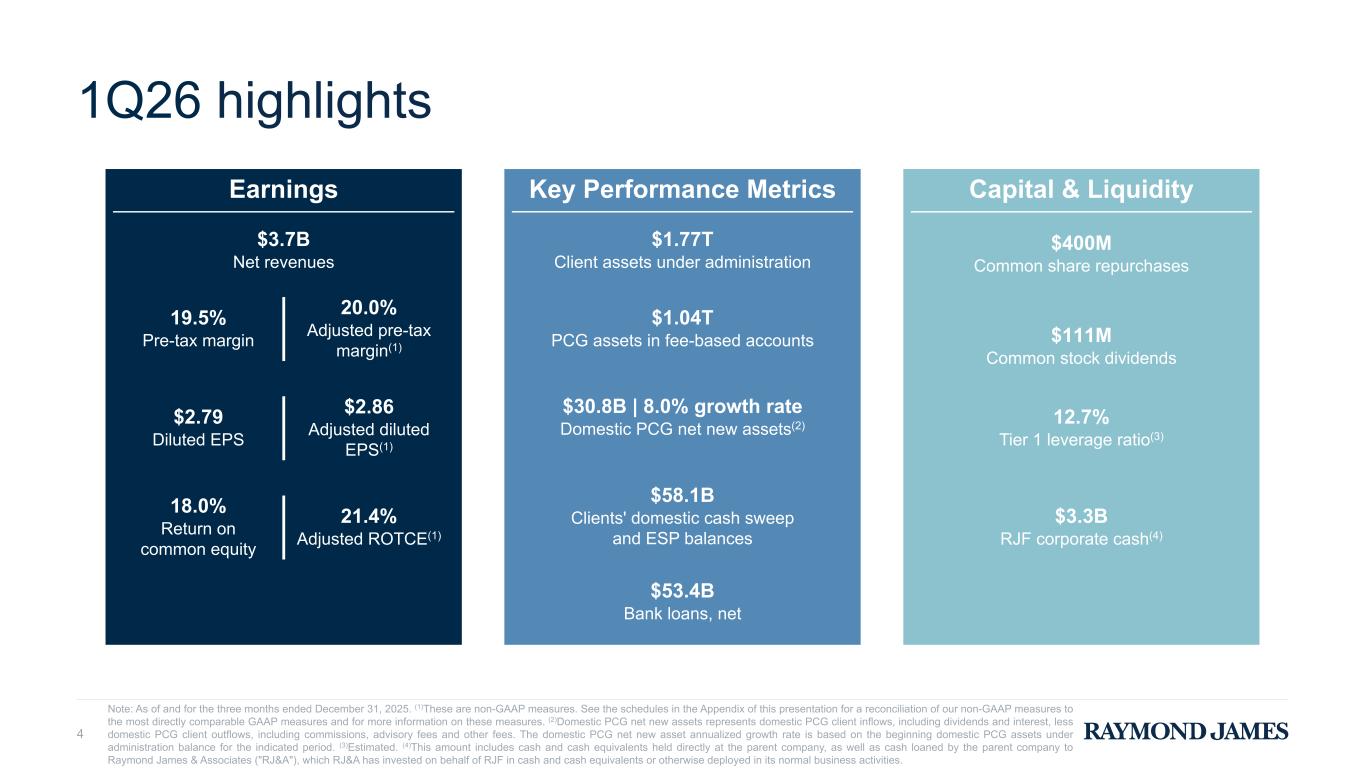
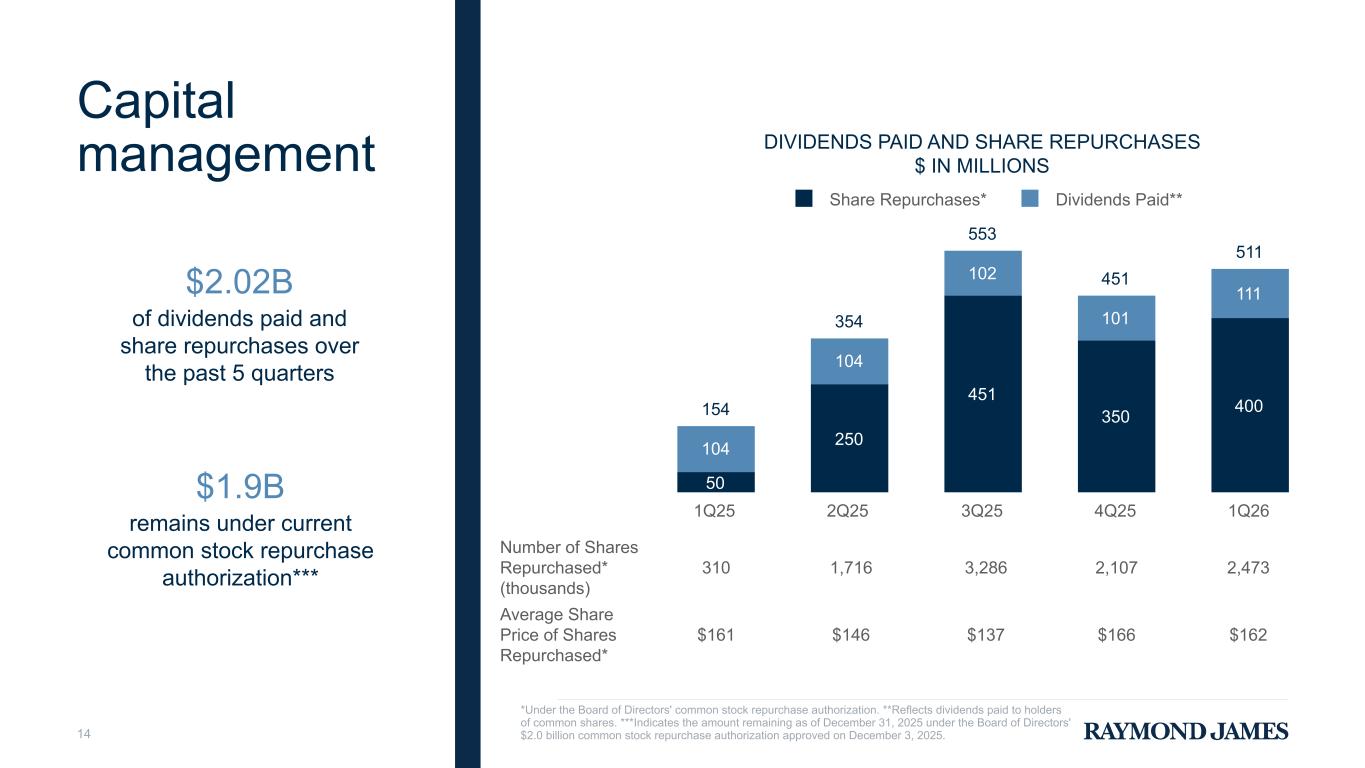
Thank you, Chrissy. Good evening, and thank you for joining us. Before we begin, we recognize that difficult weather conditions are impacting many of you in communities across the U.S. Our thoughts are with everyone affected, and we appreciate the dedication of our teams as they continue to support clients during this time. Our focus on being the absolute best firm for financial professionals and their clients has contributed to strong results this quarter. The strength and consistency of our client-first culture, alongside a robust technology and products platform, coupled with our strong balance sheet, continues to appeal to financial advisors. This is reflected in our solid recruiting momentum and net new asset annualized growth of 8% this quarter. We continue to deploy capital with a focus on the long term. As demonstrated by our robust organic growth, continued investments in our technology and platform, our consistent deployment through dividends, our recently announced acquisitions, as well as share repurchases rates. In the fiscal first quarter, we recruited financial advisors to our domestic independent contractor and employee channels with trailing 12-month production totaling $96 million and approximately $13 billion of client assets at their previous firms, a strong result for a quarter that typically experiences a seasonal slowdown. Over the past 12 months, we recruited financial advisors for twirling 12-month production totaling nearly $460 million and over $63 billion of client assets. Including assets recruited into our RIA and custody service division, we recruited total client assets over the past 12 months of more than $69 billion across all of our platforms. Our optimism about future growth is fueled by our robust advisor recruiting pipeline and strong levels of commitments to join in the coming quarters. We offer a unique combination of an advisor and client-focused culture coupled with leading technology and solutions. This value proposition, coupled with our strong balance sheet and commitment to independence, is proving to be a differentiator for advisors evaluating alternatives. In order to continue retaining and attracting the best advisors, we continue making investments in our platform and offerings. For example, our Private Wealth Advisor Program, an expanded alternative investments platform, supports advisors and focus on high net worth clients. We continue to make investments and implement solutions to automate and streamline processes that provide advisors with incremental time to invest in their client relationships. Highlighting this is our newly launched proprietary digital AI operations agent named Ray, which builds on our service-focused long-term AI strategy. The firm's suite of AI-based tools and technologies is focused on empowering financial advisors and professionals across the firm by applying artificial intelligence to enhance service models and secure, scalable applications. Capital markets results declined this quarter, primarily driven by lower M&A and advice revenues, and also lower debt underwriting and affordable housing investment revenues on a sequential basis. Given the very strong M&A results in the both year-ago and sequential periods, this quarter faced tough comparables. Even so, we enter the second quarter with a robust pipeline that continues to reflect the potential resulting from the strategic investments we have made in this segment over the past few years. We are confident we are well-positioned with motivated buyers and sellers, along with deep expertise across the industries we cover. We remain committed to opportunistically enhancing the platform by broadening and deepening its capabilities, whether through strategic hiring or acquisitions, as evidenced by the announced acquisition of the boutique investment bank Greensledge during the quarter, which we anticipate closing later in the year. In the asset management segment, net inflows into managed fee-based programs and the private client group are strong during the quarter, annualizing at nearly 10% and reflect the complementary impact of being able to offer high-quality investment alternatives to our financial advisors, as well as growth resulting from our successful recruiting efforts. In the bank segment, loans ended the quarter at a record $53.4 billion, primarily reflecting outstanding 28% annual growth in securities-based lending balances and 10% growth in this quarter alone. Yet another synergistic impact from our growing private client business as we are able to deploy our strong balance sheet in support of clients. Importantly, the credit quality of the loan portfolio remains strong. Turning to capital deployment, we continue to deploy capital with a focus on the long term, as evidenced by our robust organic growth, continued investments in our technology and platform, and recently announced acquisitions. In January, we announced the acquisition of Clark Capital Management, a leading asset management firm specializing in wealth-focused solutions to financial advisors and their clients, with expertise across the growing segment of model portfolios and SMA and UMA wrappers. With over $46 billion in combined discretionary assets under management and non-discretionary assets, Clark Capital is recognized as a high-growth firm in the industry and has a track record of strong inflows. We are excited to welcome Clark Capital into the Raymond James family, where it will maintain its independence in brands going forward. We believe their services and capabilities further strengthen Raymond James Investment management's existing investment and wealth planning offerings. This announced acquisition, along with that of Green's Ledge, demonstrates our steadfast pursuit of acquisitions that are a strong cultural fit, a good strategic fit, and valuations that generate attractive returns for our shareholders. As we continue to pursue both organic and inorganic growth opportunities, we also maintain our share repurchase program to effectively manage capital levels. This quarter, we repurchased $400 million of common stock at an average share price of $162. We ended the quarter with a Tier 1 leverage ratio of 12.7%. Now, I'll turn the call over to Butch Orlog to review our financial results in detail. Butch? Thank you, Paul.
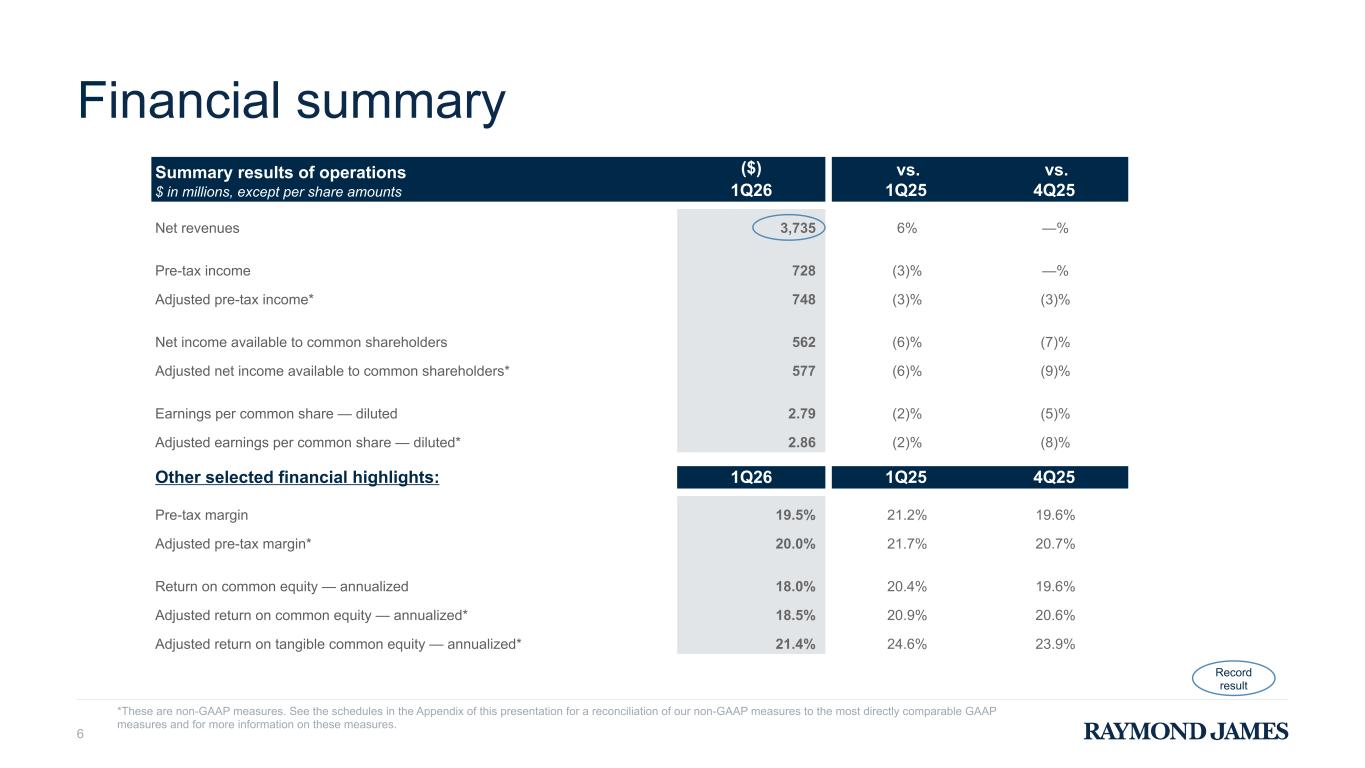
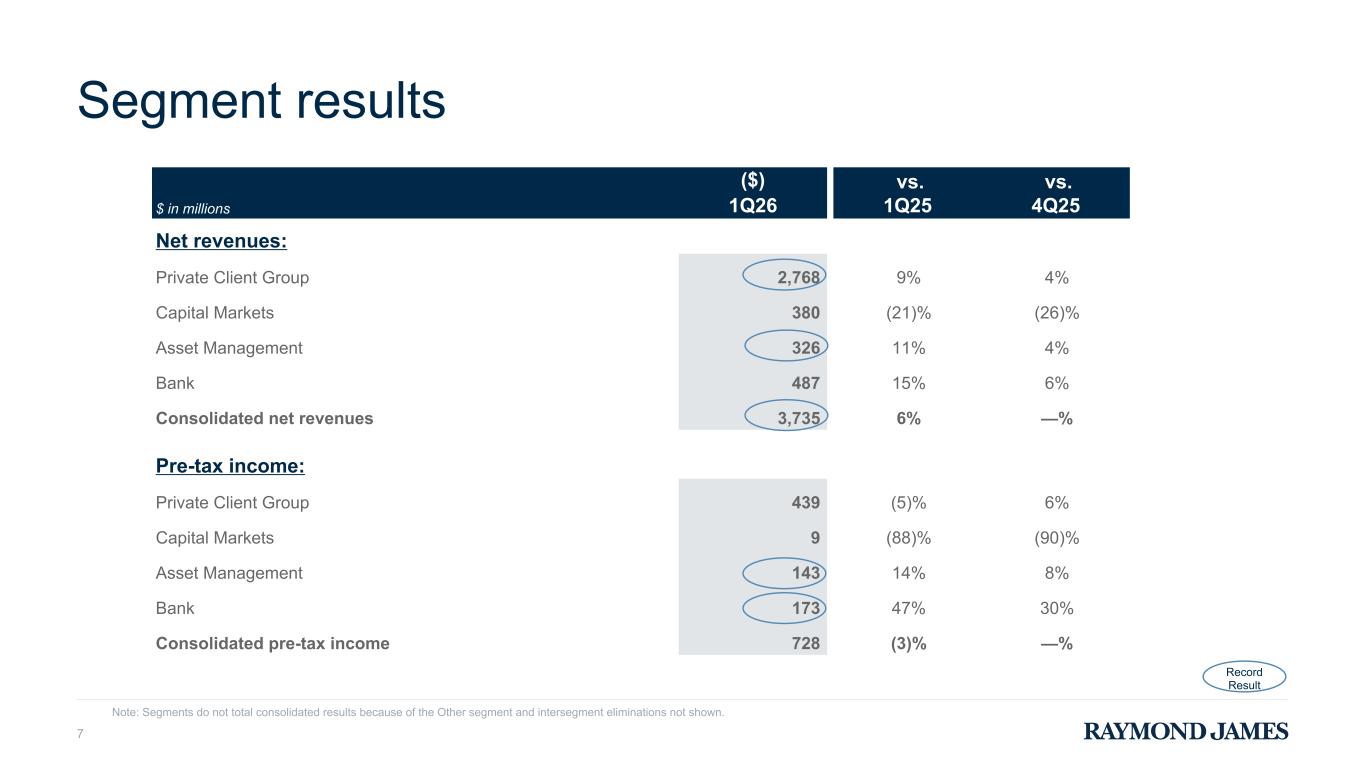
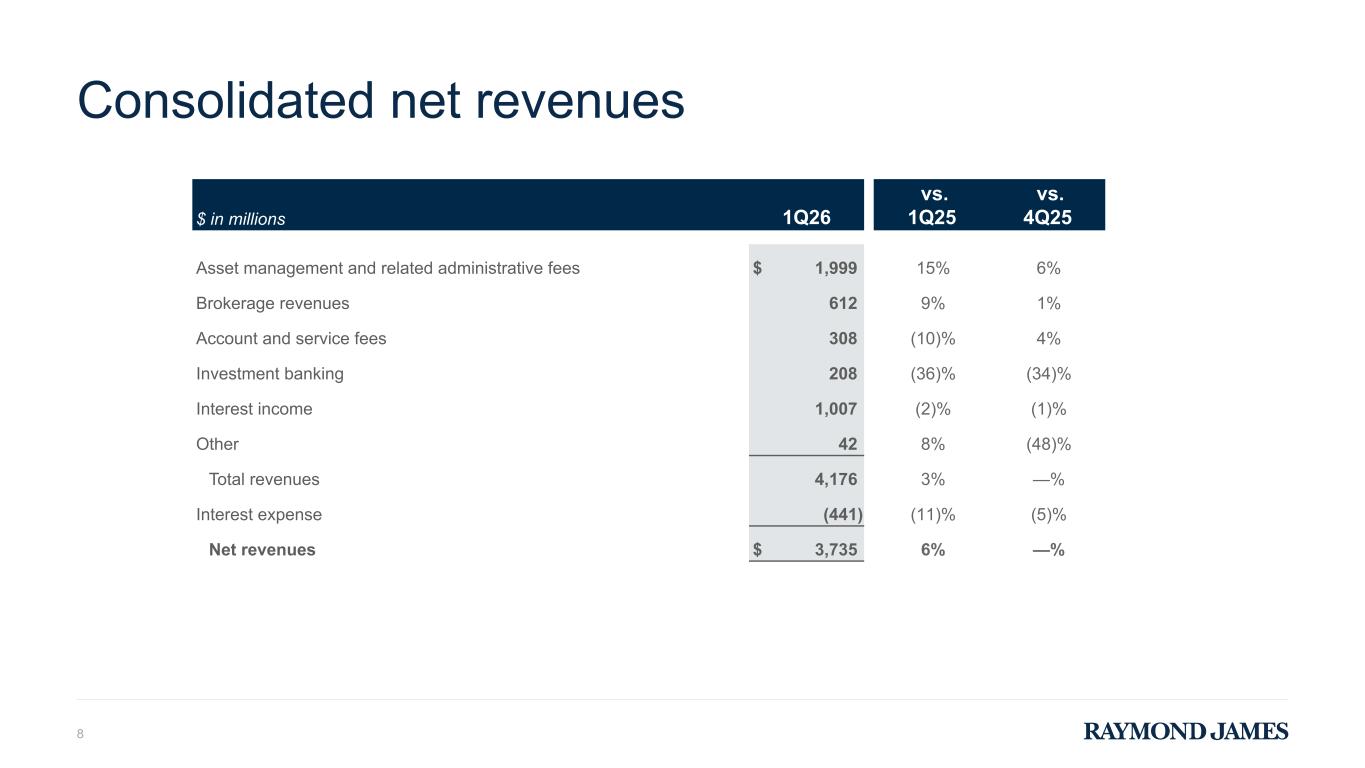
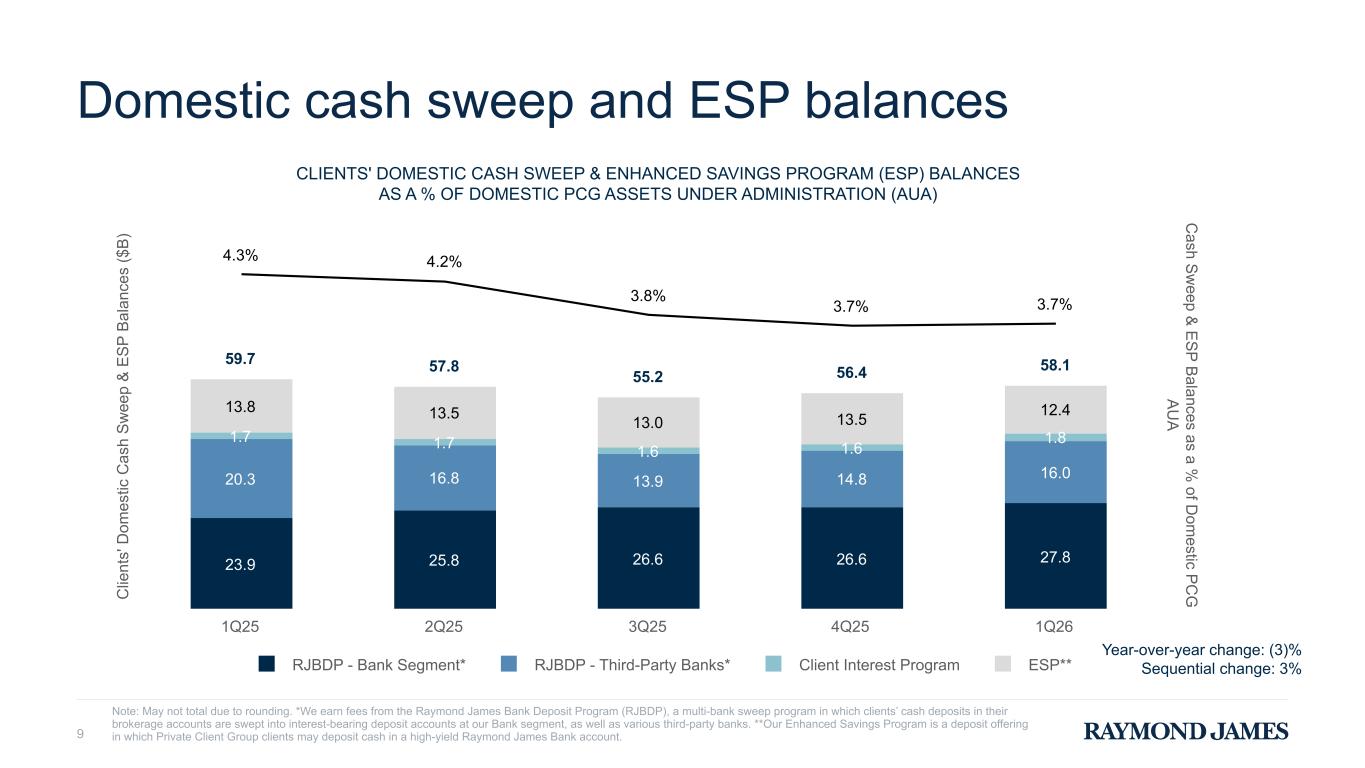
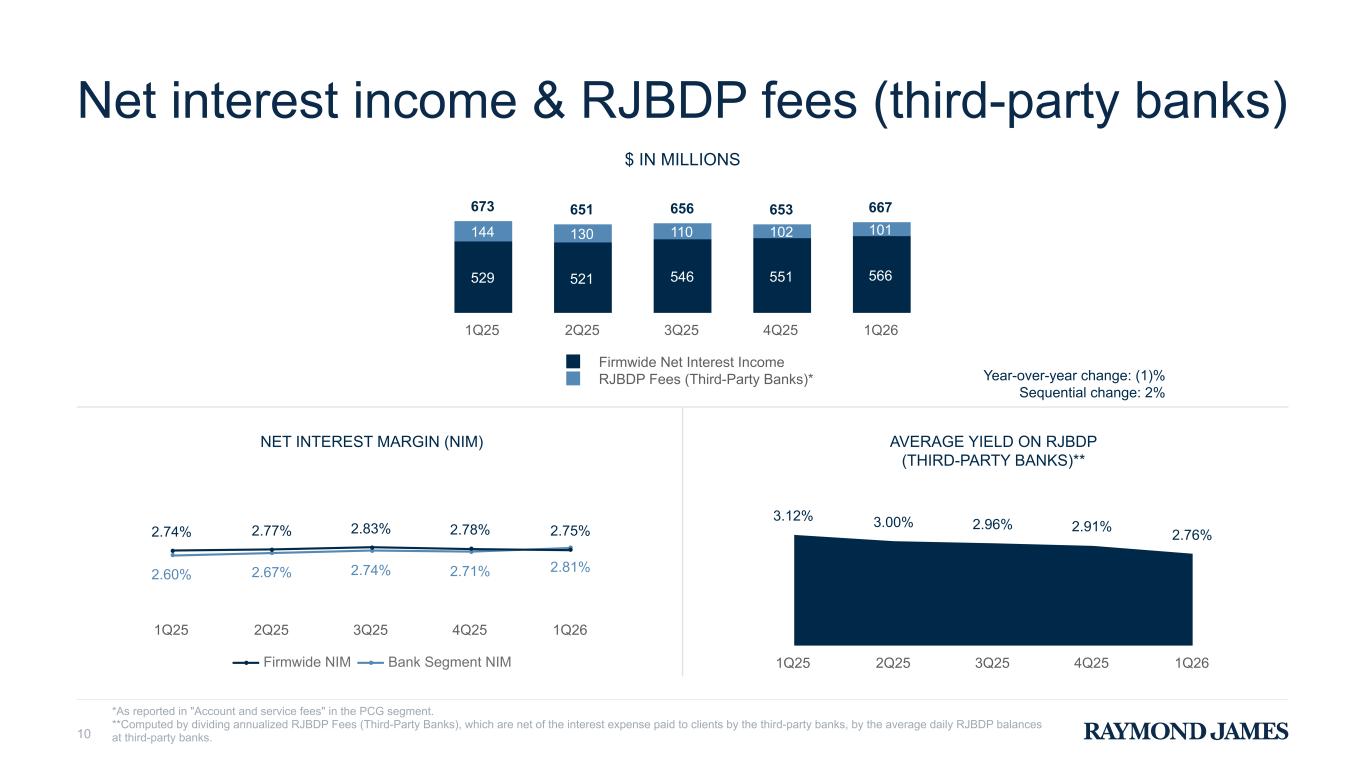
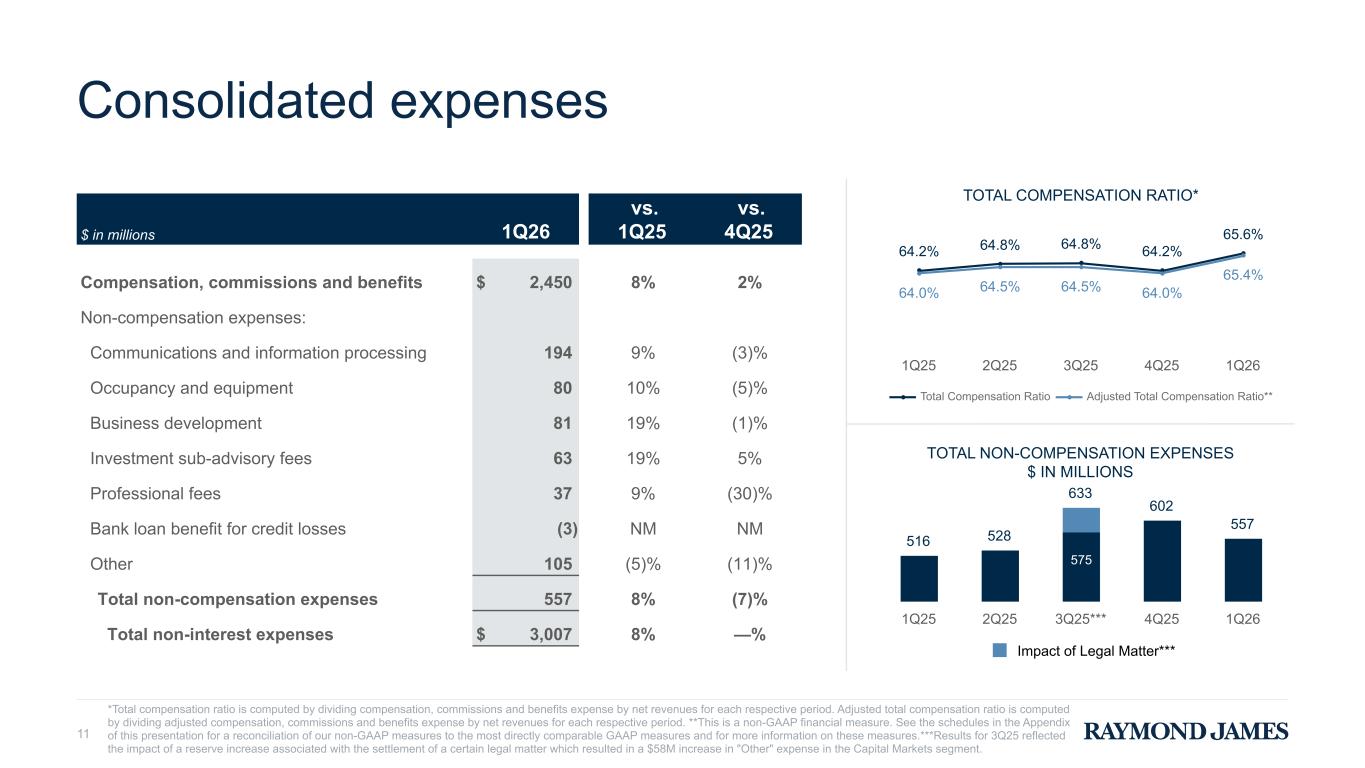
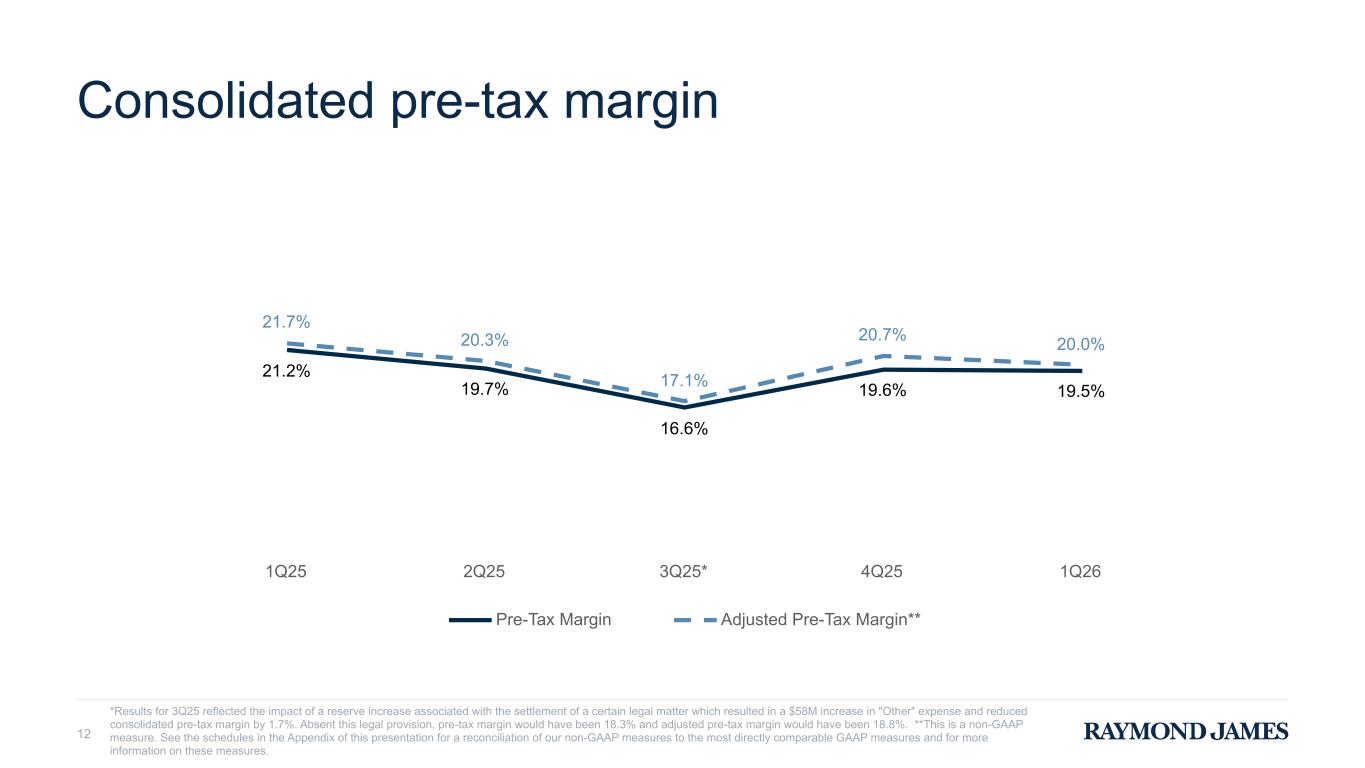
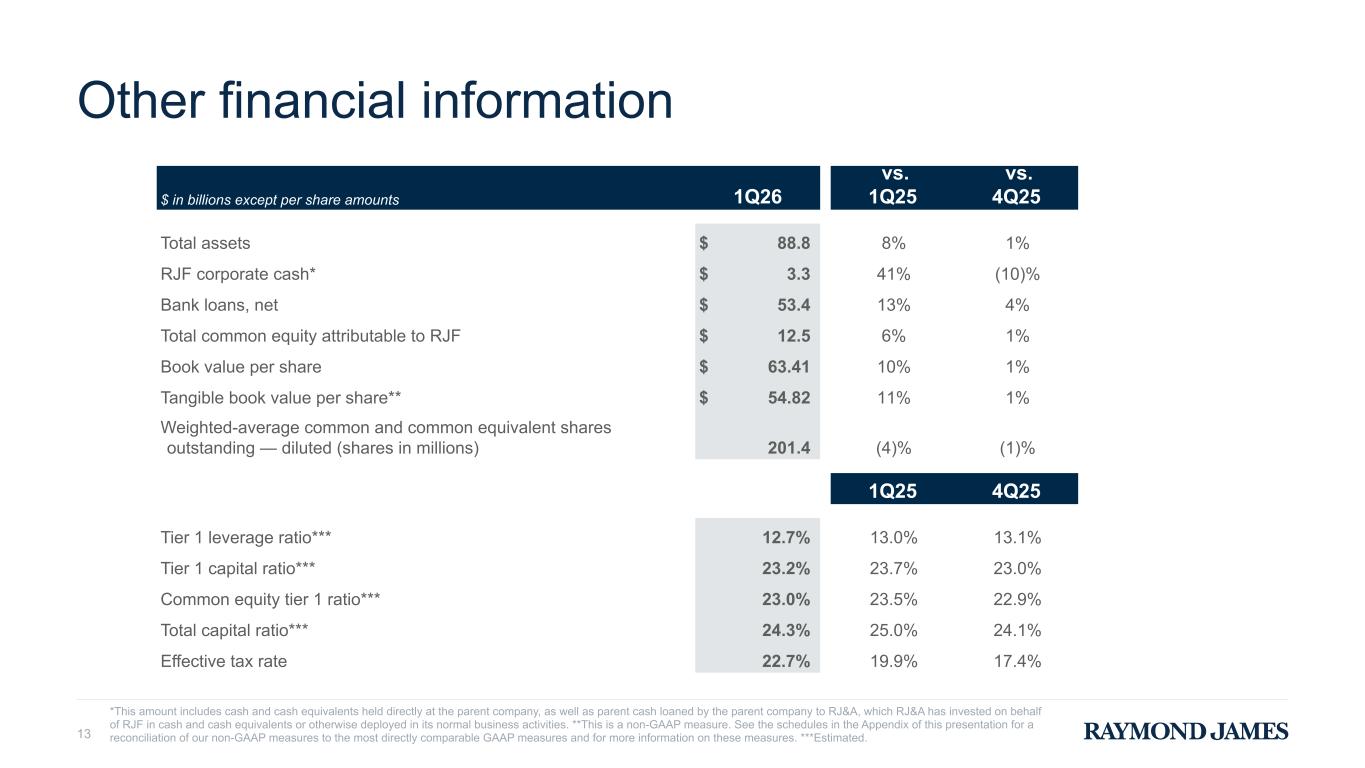
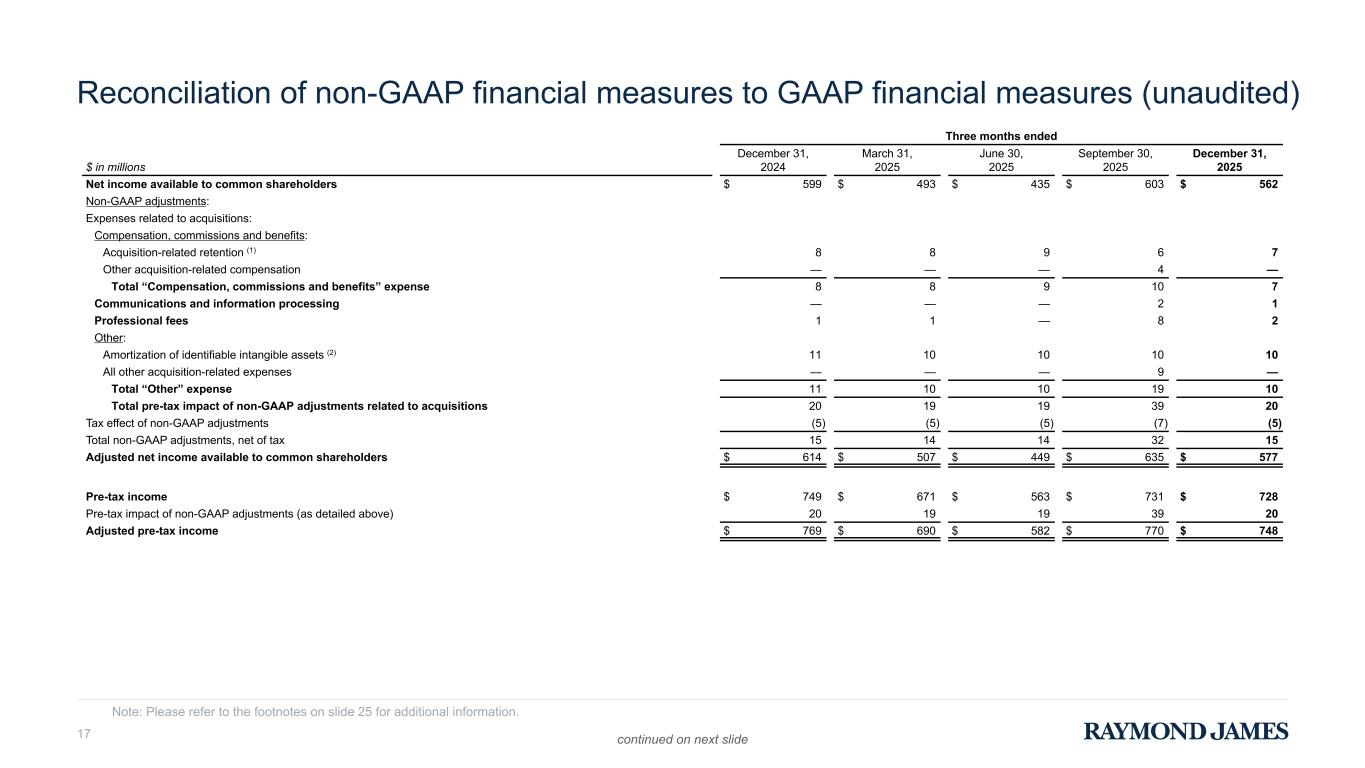
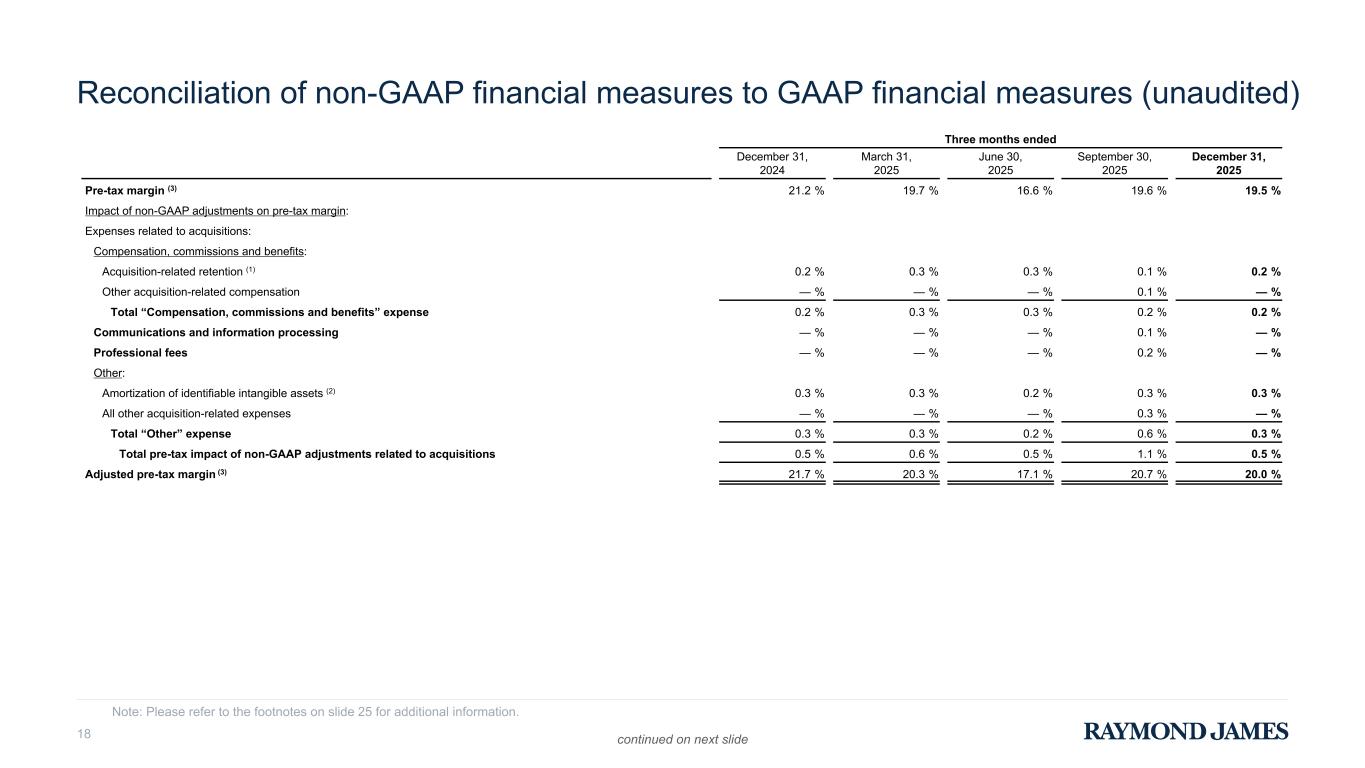
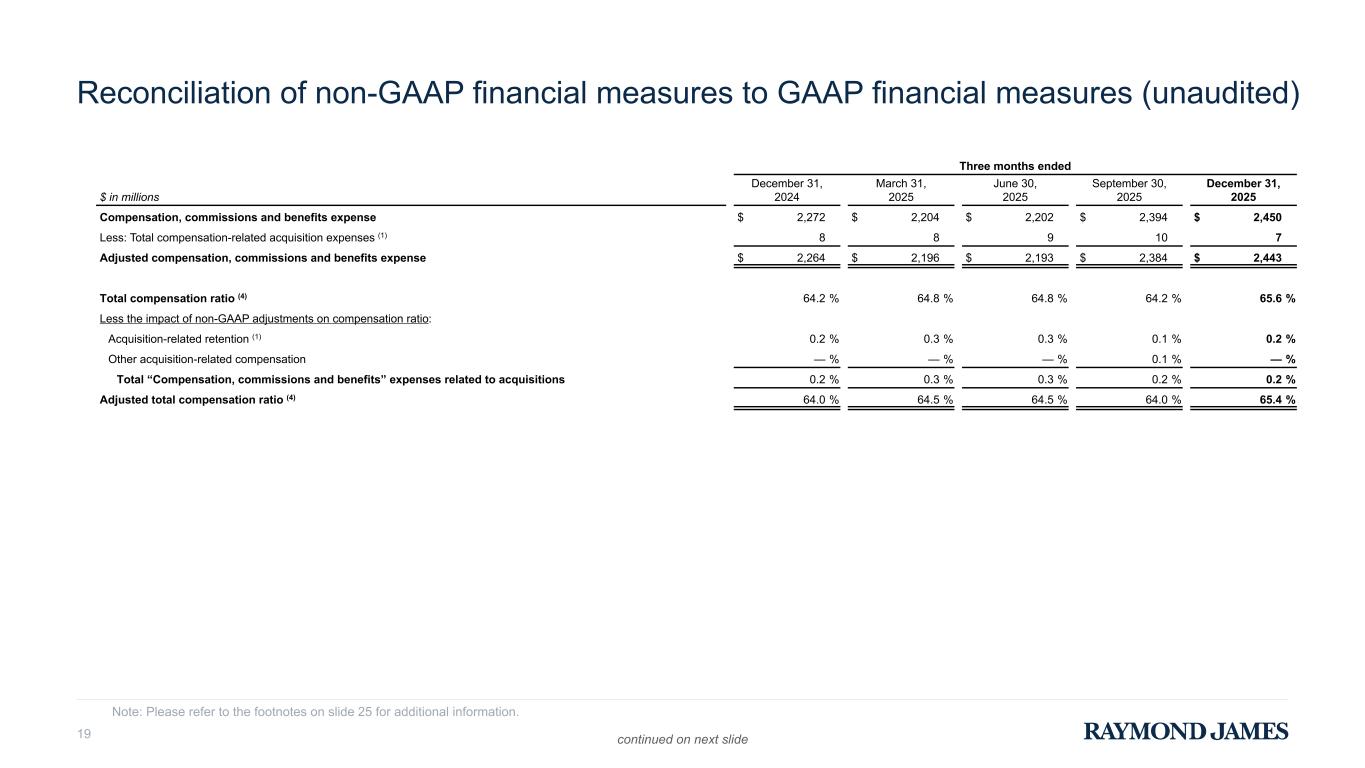
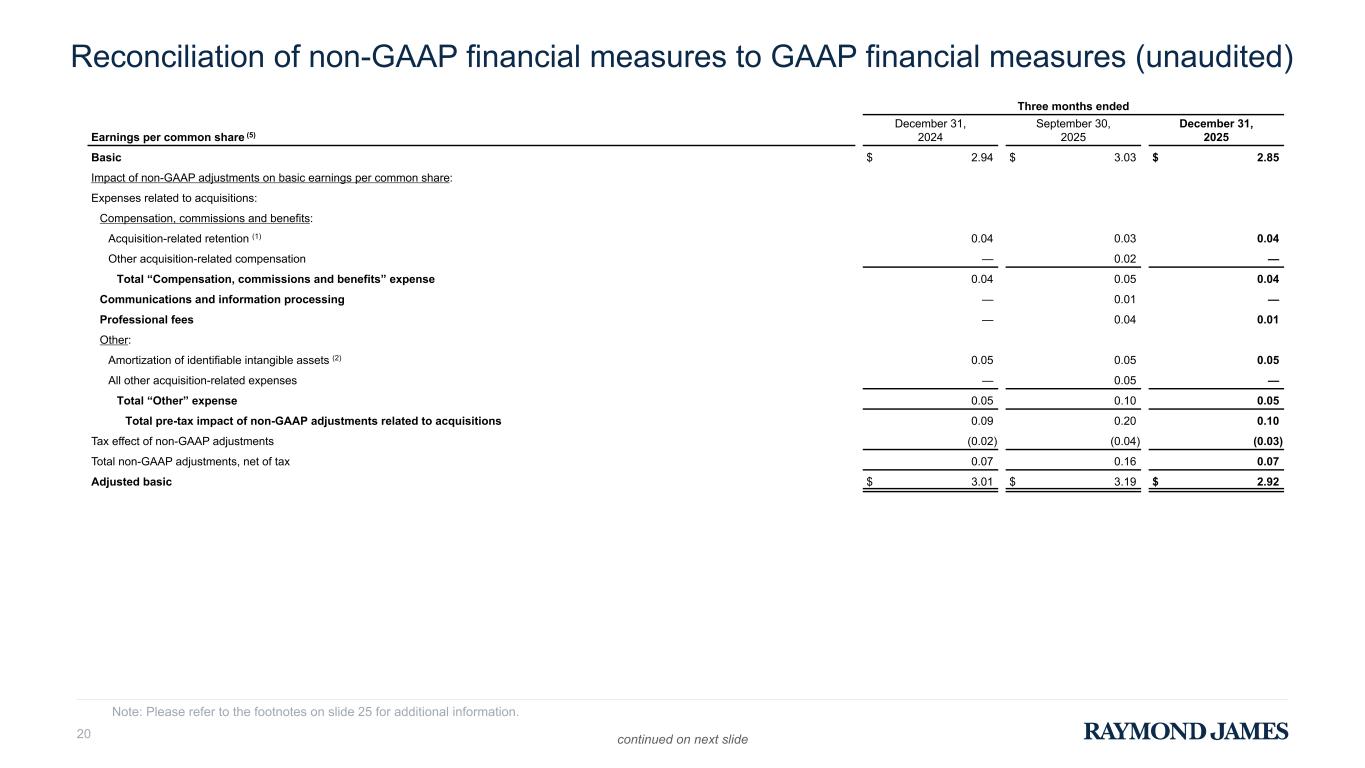
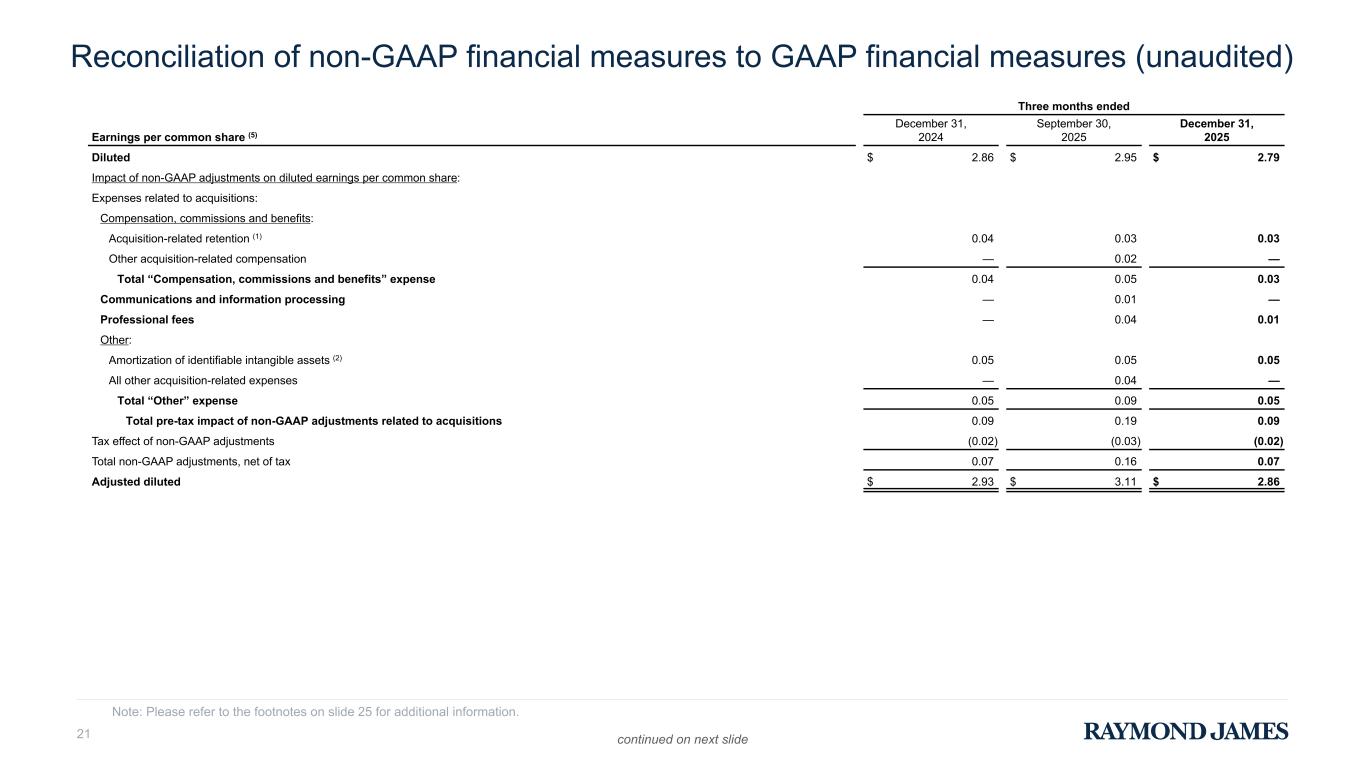
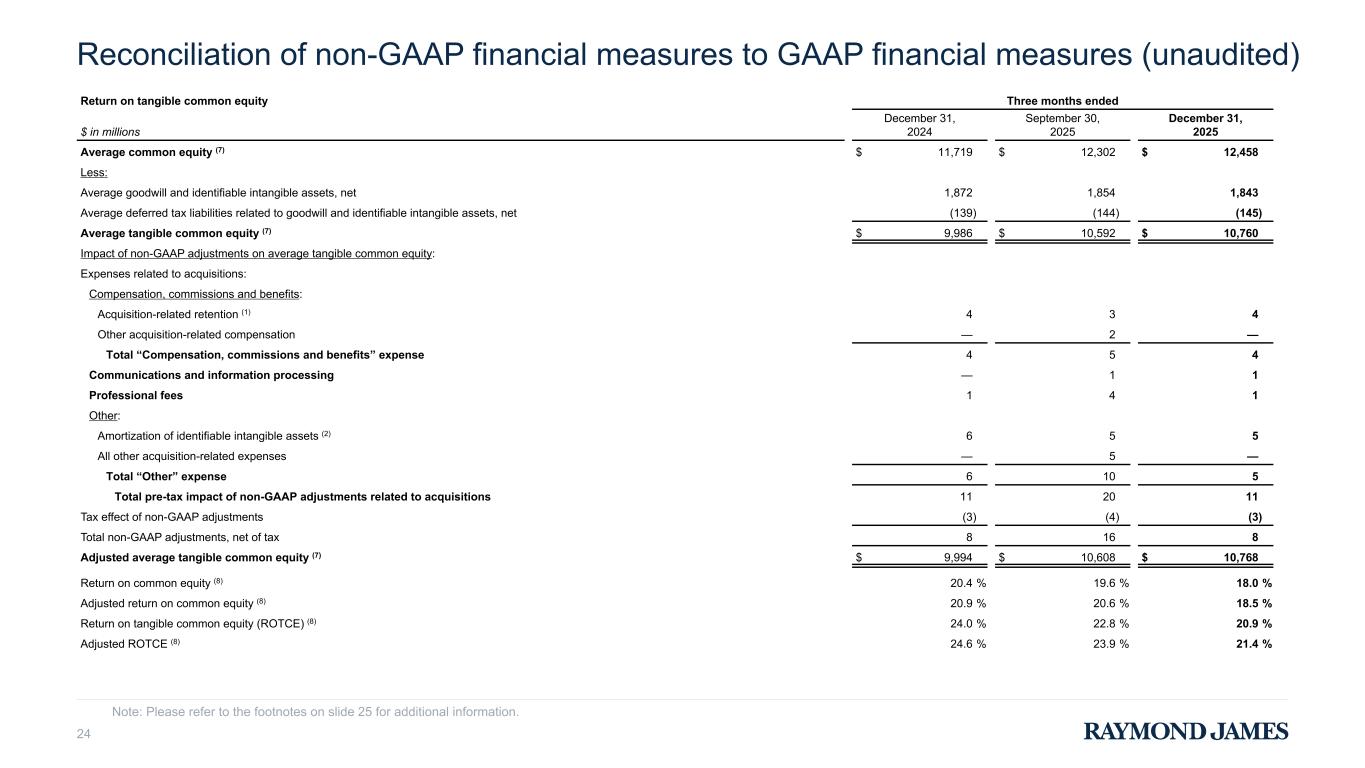
I'll begin on slide 6. The firm reported record net revenues of $3.7 billion for the fiscal first quarter. Net income available to common shareholders was $562 million, with earnings per diluted share of $2.79. Excluding expenses related to acquisitions, adjusted net income available to common shareholders equaled $577 million, resulting in adjusted earnings per diluted share of $2.86. Our pre-tax margin for the quarter was 19.5% and adjusted pre-tax margin was 20%. We generated annualized return on common equity of 18% and annualized adjusted return on tangible common equity of 21.4%. Solid results for the quarter, particularly given our conservative capital base. Turning to slide 7, private client group generated pre-tax income of $439 million on record quarterly net revenues of $2.77 billion. Results were driven by higher PCG assets under administration compared to the previous year, resulting from the impacts of market appreciation, retention, and the consistent addition of net new assets. Pre-tax income declined 5% year-over-year, primarily due to the impact on this segment of interest rate reductions, which reduced our non-compensable revenues. Interest rates have declined 125 basis points since early November 2024. Our capital market segment generated quarterly net revenues of $380 million and a pre-tax income of $9 million. Segment net revenues declined year over year and sequentially due to the factors Paul already mentioned. The asset management segment generated record pre-tax income of $143 million on record net revenues of $326 million. Results were largely attributable to higher financial assets under management compared to the prior year quarter due to the market appreciation over the 12-month period and strong net inflows into PCG fee-based accounts. The bank segment generated net revenues of $487 million and record pre-tax income of $173 million. On a sequential basis, the bank segment net interest income grew 6%, primarily driven by strong loan growth fueled by securities-based loans and lower funding costs driven by the a decline in short-term rates and a favorable mixed shift in deposits. Turning to consolidated revenues on slide 8. Asset management and related administrative fees of nearly $2 billion grew 15% over the prior year and 6% over the preceding quarter. record. Record PCG fee-based assets equaled $1.04 trillion at quarter end, up 19% year-over-year and 3% over the preceding quarter. As we look ahead, we expect fiscal second quarter 2026 asset management and related administrative fees to be higher by approximately 1% over the first quarter level, driven by the impact of two fewer billing days in our second quarter, which partially offsets the impact of the 3% increase in PCG assets in fee-based accounts at quarter end. Moving to slide 9, clients' domestic cash sweep and enhanced savings program balances ended the quarter at $58.1 billion, up 3% over the preceding quarter and representing 3.7% of domestic PCG client assets. Based on January activity to date, domestic cash sweep and enhanced savings program balances have declined as a result of the collection of record quarterly fee billings of $1.8 billion and with further declines due to client reinvestment activity. Turning to slide 10, combined net interest income and RJBDP fees from third-party banks grew 2% over the prior quarter to $667 million. Net interest margin in the bank segment increased 10 basis points to 2.81% for the quarter, driven by the factors I previously mentioned. The average yield on RJBDP balances with third-party banks decreased 15 basis points to 2.76%, primarily due to the impact of the Fed interest rate cuts since mid-September 2025. Based on current interest rates, including the full impact of the October and December rate cuts, and assuming unchanged quarter-end balances, net of the $1.8 billion fiscal second quarter fee billing collection, we would expect the aggregate of NII and RJBDP third quarter to be down from the first quarter level. The decline is largely due to two fewer interest-earning days in the second quarter. as the quarter impact of the recent Fed rate cuts are partially offset by the higher interest earning asset balances as of the beginning of the quarter. Keep in mind, there are many variables which could influence actual results, including any interest rate actions during the upcoming quarter, and factors affecting our balance sheet, including changes in our loan and deposit balances. Turning to consolidated expenses on slide 11, compensation expense was $2.45 billion and the total compensation ratio for the quarter was 65.6%. Excluding acquisition related compensation expenses, the adjusted compensation ratio was 65.4%. Commencing this quarter, we presented recruiting and retention-related compensation expense in the PCG segment for each reporting period to aid the understanding of the impact of such costs on our business. These costs have increased as a direct result of our strong recruiting successes and reflect a component of the execution of our highest capital deployment priority of investing in organic growth. Non-compensation expenses of $557 million increased 8% over the year-ago quarter, but decreased 7% sequentially. For the fiscal year, we expect non-compensation expenses, excluding the bank loan loss provision for credit losses, unexpected legal and regulatory items, and non-GAAP adjustments presented in our non-GAAP financial measures to be approximately $2.3 billion, representing about 8% growth over the same adjusted non-compensation metric for the prior year. Importantly, we will continue to invest to support growth across our businesses while maintaining discipline over controllable expenses. The majority of the projected increase reflects our continued investment in leading technology supporting our financial advisors, as well as our expectations for overall growth in our businesses. This projection, therefore, includes, for example, incremental recruiting-related and transition support costs, which are driven by continued successful recruiting, higher sub-advisory fees, which grow as fee-based client assets increase, and FDIC insurance premiums which grow as the bank's segment balance sheet increases. Slide 12 presents the pre-tax margin trends for the past five quarters. The achievement of our 20% adjusted pre-tax margin target this quarter, despite the headwinds we experienced of lower interest-related and investment banking revenues, highlights the stability and strength of our diversified businesses to consistently generate strong margins. On slide 13, at quarter end, our total assets were $88.8 billion, a 1% sequential increase resulting primarily from loan growth, partially offset by lower corporate cash balances, which declined primarily due to corporate share actions, as well as seasonal funding obligations. Record bank loans of $53.4 billion grew 13% over the year-ago quarter and 4% sequentially with that loan growth largely in support of our clients Securities-based loans and residential mortgages represent 60% of our total loan books reflecting approximately 40% and 20% of the total respectively We continue to have strong levels of liquidity and capital. Our JF corporate cash at the parent ended the quarter at approximately $3.3 billion, providing excess liquidity of $2.1 billion, well above our $1.2 billion target. Our capital levels provide significant flexibility to continue being opportunistic in our pursuit of strategic acquisitions and to invest in organic growth. With a Tier 1 leverage ratio of 12.7% and a total capital ratio of 24.3%, we remain well above regulatory requirements with approximately $2.4 billion of excess capital capacity to deploy before reaching our targeted Tier 1 capital ratio of 10%. The effective tax rate for the quarter was 22.7%, reflecting a seasonal tax benefit arising from share-based compensation that settled during the quarter. Looking ahead, we continue to estimate our effective tax rate for fiscal 2026 to be approximately 24 to 25%. Slide 14 provides a summary of our capital actions over the past five quarters. Through the combination of common dividends paid and share repurchases, we returned $511 million of capital to shareholders during the quarter. In January, the firm opportunistically redeemed all of its outstanding shares of its Series B preferred stock for an aggregate redemption value of $81 million, which reduces Tier 1 capital in the fiscal second quarter. Taking this capital action into consideration, we expect to target approximately $400 million of common share repurchases again in the fiscal second quarter. Over the past 12 months, we have repurchased $1.45 billion of common shares, and including dividends paid, we have returned nearly $1.87 billion of capital to common shareholders, reflecting a combined return of 89% of our earnings. We maintain our long-term commitment to operating our businesses at capital levels consistent with established targets. I'll now turn the call back to Paul for his final remarks.
Thank you, Butch. In summary, we are off to a strong start in fiscal 2026, and I believe we are very well positioned entering the second quarter with record client assets and strong competitive positioning across all of our businesses. Financial advisor recruiting activity remains strong, and the investment banking pipeline is robust. Near term, there are headwinds with lower interest rates and seasonal impacts typical in the second fiscal quarter with fewer billing days in the quarter and payroll taxes resetting at the beginning of the calendar year. However, that doesn't distract us from our focus on generating long-term sustainable growth. While in some ways there is more competition in our space, we are confident that our established approach and focus on the power of personal is setting us apart in our industry more than ever. We are focused on the long term and providing a stable platform for our advisors, bankers, and associates with a foundation of deeply personal relationships. We attract and retain financial advisors with our unique culture, leading service, and robust platform. We value independence to foster an environment where our advisors can provide objective advice to their clients. We are focused on sustainable growth and quality over quantity. We strive to maintain a strong balance sheet with strong levels of capital and liquidity and a conservative amount of leverage. We are confident our longstanding approach will continue to endure in both good times and more challenging times and help us deliver on our vision of being the absolute best firm for financial professionals and their clients. So I want to thank our advisors, bankers, and associates for the great service and advice they provide to their clients in delivering on our firm's mission to help clients achieve their financial objectives. That concludes our prepared remarks. Operator, will you please open the line with questions?
Operator
Thank you. And everyone, if you would like to ask a question today, please press star 1 on your head phone to one question and one follow-up. But once again, that is star one to ask a question. We'll go first to Michael Cho from J.P. Morgan.
Hi, good evening, Paul and Butch. Thanks for taking my question. I just want to start on net new assets. It's been seeing a pretty nice acceleration over the last several quarters at 8% this quarter. I mean, are there areas that saw any particular strength this quarter? And if you look back, maybe over the last four quarters, what segment or tweaks in Raymond James' approach do you think has been supporting that acceleration? And how would you frame that pipeline today relative to the past couple quarters?
Thanks, Michael. Yeah, $31 billion of net new assets in the quarter would be our second best quarter ever, just to put that in perspective. So, as I've been messaging the last few quarters here, the recruiting activity is robust. It's broad-based across our affiliation options, maybe more heavily tilted in the last six months on the independent contractor side of the business. But really, what's resonating now is what's really always resonated. We've kind of consistently been a leading destination for financial advisors in the industry. And more importantly, the retention of our existing advisors remains very strong. Yeah, there are more competitive pressures now with private equity-backed roll-ups and that sort of thing. But really, the retention of our existing advisors, the advisor satisfaction, is the highest it's been since, I think, 2014. team and really having a platform where advisors feel like there's a culture that really respects the independence and their book ownership, the book ownership they have of their clients, and coupling that with the platform, the technology. We're investing close to $1.1 billion this year, the AI to support that, to help them save time, to help them make better decisions, to help them be more efficient in their operations with their clients, and then the products and so having the culture and the products and the platform and the technology is really differentiating us more than ever and the power personal the value proposition that we released with our annual report several weeks ago is increasingly differentiating as well you know other firms are talking about irrs and exit periods in three to five years or funnels and all sorts of impersonal things. And what we're doing in that world of what I call noisy competition is really doubling and tripling down on what we've always done, which is really focusing on the personal relationships with financial advisors and giving them tools and resources to strengthen the personal relationships that they have with their clients. And that's really resonating with advisors, both our existing advisors and prospective advisors, which is driving our a consistently leading recruiting activity.
Great. Thanks for all that color, Paul. If I could just quickly follow up on a modeling question, just on expenses. Sorry if I missed it. Was there anything to call out in terms of comp expense or comp ratio during the quarter? I know it's typically billed seasonally from here. Paul, you mentioned the payroll taxes, but how should we think about modeling in terms of comp ratio, you know, whether, you know, into fiscal second quarter or fiscal 26th, I think?
Yeah, I mean, the comp ratio target that we laid out in the last analyst investor day was 65% or better, and really this quarter is impacted by revenue mix. So private client group business with the independent channel, which has a higher payout. Some firms break that out of compensation. We included in compensation drives a higher mix of compensation relative to the capital markets business, which for us largely due to timing, you know, the investment banking pipeline we still feel very good about. But this quarter, it was a weaker quarter. And so due to the revenue mix, also with lower interest short-term rates, when you look at the mixes of revenue, it ended up being slightly above 65%. But really at 65.4% for the quarter, with lower rates and a very tough quarter for capital markets, again, due to timing, we're really pleased with that result. Great. Thanks, Paul.
Operator
The next question will come from Ben Budish from Barclays.
Hi, good evening, and thank you for taking my question. Maybe just following up on Michael's first question there on NNAs, you know, really solid quarter, but it does seem like from what we're hearing from competitors, from a lot of the media coverage, that the competitive intensity is picking up quite a bit, whether it's manifesting in more incentives, more aggressive retaining of existing advisors. Just curious, you know, is that something you're seeing? You know, how are you thinking about responding? Is it the sort of environment where this quarter, was there anything unusual, or do you think that kind of growth is, you know, sustainable over the next, at least, coming quarters? Just great to get your thoughts there.
Thanks, Ben, and welcome to being one of our covering analysts, I think, just starting this morning. So, yeah, I mean, the environment, though, is competitive. I mean, I think in the last five years, the biggest change has been the entry of these private equity roll-ups. And, you know, we've talked a lot, as you know, in the past around that dynamic. I think this is going to be a really important year for those type of firms. A lot of them have stopped liquidity events and haven't been able to achieve them at the multiples that I think they were targeting. And so, and a lot more will come out, I think, in the next year or two. And that will dictate whether or not they can still afford to pay what they have been paying, which has actually been increasing over the last couple of years. But I call that short-term noise, short-term impact. We obviously have to deal with that from a competitive perspective. But the advisors we're recruiting are not looking for a three- to five-year destination. You know, they're looking for a much longer three to five year destination with another liquidity event that's going to cause another source of disruption for them and their clients. We are kind of a long term stable play for advisors and their clients. We're looking for advisors or really looking for a platform and a home for them, their teams and their clients where they're not going to have to have another disruption in three to five years. They want they're looking at our balance sheet to see how much tangible equity we have, how much leverage we have, how much cash flow we have in capital, because they want a platform and a home that can remain independent. And we're absolutely committed to remaining independent because, again, they don't want to have to make a change again in three to five years. So while the competition has increased in the industry, for us, our differentiation, we feel like we have in some ways less competition than ever because we're focused on the long term, we're focused on the power of personal, the personal relationships, and we're able to invest a billion dollars in technology. A lot of our competitors who also are focused on personal relationships have similar cultures. Their technology investment, for example, is a fraction of ours. That's hard to remain competitive when you can't invest in AI and the tools that you need to help advisors develop more efficiency in their businesses with their clients.
Got it. All very helpful. Maybe for my follow-up, just curious if you could unpack a little bit more of the near-term outlook on the capital market side. It sounds like you're still confident on the pipeline. Obviously, the revenues can swing quite a bit from quarter to quarter. So, anything you can share from a modeling perspective, how we should think about the very near-term. We're about a third of the way through Q1. Anything you can share would be helpful. Thank you very much.
The pipeline remains very strong. There's a lot of pent-up demand in terms of buyers and sellers. You know, buyers with capital, dry powder to deploy, and sellers. Again, the majority of our M&A activity is driven by financial sponsors, either on the buy-in or on the sell side. And there's a lot of holdings and funds that are well beyond their original holding period. And so there's a lot of pent-up demand. We're signing a lot of engagement letters. And so we feel good about the demand, but, you know, you can never predict timing. And so we don't try to guess on when they will close or if they will close. The market conditions have to be conducive, and there have to be buyers and sellers that meet on price and terms.
Okay. Thanks so much for taking my question.
Operator
Next up is Craig Siegendoller from Bank of America.
Hey, good evening, Paul. Hey, Chris. So first, just a big congrats on the 8%. But there actually has been a wide range in recent quarters. We saw 2% a couple quarters ago, 8% this past quarter. So I was wondering if you can comment on the sustainability of the 8%. And in your view as maybe the midpoint, something like 5% to 6%, a better go-forward run rate to model.
Yeah, I mean, 8% did benefit from not only the really strong retention results, recruiting results, but also there's calendar year-end dynamics, which help all firms in the industry with dividends and interest payments and those sorts of things. But with that being said, we're confident that based on our pipelines now and our retention that I spoke about earlier, that we can continue to be a leading grower in wealth management, which we have been on a pretty consistent basis, and doing it in a way that we feel sustainable. We're really focused on quality over quantity, and so we've been really growing assets by bringing on higher quality teams that are focused on higher net worth clients, and so that will, and that enables us to keep a high-touch service model and really reinforce the value proposition of power personal.
Thanks for that, Paul. And then, you know, given the stronger recruiting that we've seen and we're seeing in the results today, but also elevated competition. Could we see the PCG comp ratio creep up in 2026, or does the five to 10-year smoothing really protect the operating margin if recruiting and NAs remain robust?
Yeah, I mean, there's a lot of investment that goes into recruiting. The reason we broke out the retention and transition assistance-related expense for the first time this quarter is because in the last 12 months, we recruited advisors who had $460 million at their prior firm. That's equivalent to a pretty decent-sized acquisition in our space, especially when you look at what is remaining out there. And we'd much rather recruit one by one where we know the advisors are a good cultural fit and 100% of what we pay in transition assistance is going to retention versus the seller. And if we did do an acquisition, that type of expense would typically be non-gapped. So we wanted to at least break it out for you to see, because that is a part of the expense. But so is we pay recruiters, and we have to pay for account transfer fees and other things that support that growth. But again, organic growth is a number one capital priority in terms of capital deployment. So we'll continue to invest in that organic growth. We are confident that generates the best long-term returns for our shareholders. and then growing the top line gives more opportunities for everyone and allows us to reinvest in the platform overall. Thanks, Paul.
Operator
Brandon Hawken from BMO Capital Markets has the next question.
Hey, good evening, Paul and Butch. Thanks for taking my questions. I'm curious, totally hear you on how robust the capital markets pipelines are, for the need for the sponsors to engage and absolutely hear you there. So it sounds like you guys are setting up for solid revenue growth as we come in to the coming year. You know, is that fair or do you think that it's going to take a little bit longer to come to market? The sort of revenue translation there has been a bit long in the tooth, so to speak. And then when you eventually do get some revenue, you know, how should we be thinking about operating leverage on revenue growth? Is there a rubric or an algorithm we can just think about at a high level when we're confirming we're tuning up our forecast correctly?
Yeah, no, we had a really strong quarter in investment banking just last quarter. So if you look at capital markets last quarter, it was over $500 million in revenues. And we certainly don't think that's a ceiling, but you saw how that impacted the operating leverage relative to this quarter. I think the pre-tax margin last quarter was around 17.5% in that segment. So there's a lot of operating leverage with higher levels of revenue in capital markets. We are optimistic about the pipeline. And, you know, we would be disappointed for the rest of the year if the revenue in the capital market segment doesn't improve meaningfully above the $380 million level that it's achieved this quarter. Okay, got it. Thank you.
And then a lot of questions around the outlook for recruiting and whatnot, the certainly robust net new asset growth this quarter. So following up on Craig's question around, because it has been volatile, it's moved around, and also in the marketplace, there's a couple of deals out there that have been very much in focus, which could cause some maybe movement to be a bit more elevated. Did you see that? Did that impact you guys? Were you guys able to capitalize on some of that movement? And how long do you expect such disruption could create opportunity for you?
Yeah, I mean, I hate to speak on any specific M&A or transactions. We have a lot of friendly competitors, and they're doing good jobs keeping the advisors through those transactions. So what I would speak to is just the broad-based strengths. It's not one firm that we're seeing success from. You know, there's a lot of different firms. advisors are coming from, you know, wires, regionals, other independents. And again, that value proposition, we have the largest addressable market across our affiliation options, from employee to independent contractor to the RIA, custody. And we have critical mass and decades of experience in all of them. It's not a new venture for us. It's not something that we're testing out or trying out or seeing how it would work. And so that value proposition, The cultural fit, the platform that I talked about, the multiple affiliation options, it's appealing to advisors from a lot of different firms. Okay, thanks for taking my question.
Operator
Up next, we'll hear from Bill Katz and Katie Cowan.
Okay, thank you very much for taking the question. Just coming back to the M&A, I hear you on organic growth. It seems like the pipeline there is quite good. It's funny if you could unpack maybe the Clark transaction a little bit, how to think about the accretion to that. And then how should we be thinking about where you might be interested in terms of incremental, inorganic opportunities given such a strong balance sheet and maybe trying to understand the path back to a 10% tier one leverage ratio?
Yeah, Clark Capital is really a perfect representation of our M&A priorities. And that's first and foremost a firm that has a good cultural fit. The Clark family who started the firm and the team, the entire team there, are client-focused, long-term focused, and exactly approach the business in a very similar way that we approach it with our values and our culture. And then it's a strategic fit in terms of their focus on treating advisors like clients. We're going to maintain the independence that Clark has, both in terms of brand and the way they interface with their clients, not our clients, but their clients. And so the cultural fit, the strategic fit, and then the financials have to make sense for both us and for the sellers. And so that was the case here as well. And so we are very excited. They're high growth, high organic growth, differentiated product, but really, really deep personal relationships with their clients, which is what was so appealing about Clark Capital. And those are the type of deals we're going to look at across all of our businesses. It's firms that have good cultural fits, strategic fits, and makes financial sense for us and for the sellers. And so we're very active. We have an active corporate development apparatus. We have a lot of capital, and we're confident with our ability to integrate. And so, we're going to continue to look for deals that make sense. But we're not going to force deals just to do deals. They have to make sense for our shareholders over the long term.
Follow-up. Maybe it's a two-par, so I apologize for squeezing it in. Can you talk a little bit about the path to support the interest-earning asset growth from here and how you sort of see the interplay of the sort of liquidity on a third party versus maybe cash coming in the door and net new assets. And then if you could just review what you said in terms of the January numbers, the way it was phrased, I wasn't quite clear if you were down 1.8 for the quarter or down something less than that, inclusive of billings and activity. If you could just clarify that would be helpful.
So, hey, Bill, in terms of where we stand currently in January, Our total combined program sweep and ESP balances are down $2.6 billion, which includes the $1.8 billion fee billing, which have already come out of the account, as we indicated. And what we're seeing for that difference is strong client reinvestment of their balances for the rest of it. But the breakdown between SWE program and ESP balances of that 2.6 is we've seen 2.1 billion of that in the SWE program and about 500 million of that in the ESP program since the quarter imbalance.
So, yeah, we're continuing to see, like others that have reported, a shift of the mix, bigger percentage declines in the enhanced saving program balances as rates come down. You know, those high-yield savings rates are less appealing, especially relative to the market. So, we're seeing more investment in the market versus higher-yielding alternatives, at least over the last couple quarters as rates started really coming down, which lowers the weighted average mix or the weighted average cost of deposit between suites and enhanced savings programs. To answer your question about ongoing long-term growth, I mean, you saw securities-based loans grow. close to $2 billion this quarter alone. And so the growth is attractive. That's the flip side of the lower rates, that the floating rate loans become more attractive, and you sell that this past quarter as well. And we'll fund it with the diversified funding sources that we have, both the sweep cash, we have third-party cash that we could redeploy, but also we have diversified deposit-gathering apparatus, particularly a tri-state capital bank. And so we'll look at all of those levers to fund future growth going forward. Okay, thank you, and thank you for clarifying.
Operator
The next question is from Stephen Chubak from Wolf Research.
Hi, good evening. Thanks for taking my questions. Hey, Stephen. So, hey, Paul. So I wanted to drill down into the M&A results and the outlook, you know, recognizing that the pipeline strength you cited, also acknowledge one quarter does not a trend make. But if I compare for the calendar year, full year 25 versus 24 advisory results, the gap between you and peers was quite substantial. I think you guys were down 20 percent. Peers, big and small, were both up about 20. And I was hoping you could just speak to any IDEO factors that might have weighed disproportionately on your results, whether it's a function of client or sector mix. And just bigger picture, in the past, you talked about this $1 billion target in M&A fees based on your current scale. Do you still view that as a credible target? And what actions are you taking to help narrow that gap?
Yeah, I mean, we're adding a lot of MDs and have been adding a lot of MDs and high-quality MDs and invest in banking across various sectors for the last several years. So, in terms of comparison, really, it's hard to compare apples to apples. Like you mentioned, the bigger firms. Last year was a better year for public company M&A, Bolts Bracket M&A. And that's, as you know, not a space that we really compete or play in. So, when you compare mid-market growth-oriented firms to the public company firms for the year overall last year, the public company M&A, the Bolts Bracket M&A, definitely led the way in the recovery. And that's not atypical if you look at history, where both on the way up and on the way down, it seems like public company M&A sort of leads the way. And then every firm, even on the regional side or the growth-oriented side, has different strengths and sectors. The depository sector, some firms have longstanding deep businesses and depositories, for example, which has really seen a pickup in the new administration approving deals. And you kind of have to go sector by sector. But we feel very confident with our expertise, with the sectors that we are very good in, in our pipelines. And so I hate to compare things quarter to quarter. There's some quarters we do a lot better, and we tell you don't over-index that because it's timing. And I would tell you in this type of quarter where we're doing worse, then I would say don't over-index that either. The investment banking is not a recurring revenue business, as you know, as like the private client group business is. So you really do have to look at long-term trends. And if you look at a long-term trend in growth of investment banking over the last five to seven years, which we'll highlight again on our Analyst Investor Day, it's been very strong and attractive relative to our peers.
Thanks for that. And, Paul, I need to squeeze into what's called more kicky-tack modeling questions. Non-comps have grown double-digit the last three years. The 8% guide is encouraging, reflects the moderation in growth. Just given the commitment to investing, do you feel like you can continue to hold the line and bend the cost curve on non-comps? And I'll just mention the other one now. The N&A growth was impressive. The AUM growth admittedly lagged our expectations given strong organic flows and market appreciation. and was hoping you could speak to why that better NNA flow rate didn't necessarily translate into as strong AUM conversion, which I know can happen from time to time.
Yeah, let me take the last part of the question first, and then I'll have Butch touch on your first part of the question on the cost curve. But it is a good question around AUA because I was comparing our overall AUA and flows to some of the others that I've reported. And I think really where you see that relationship makes sense is if you look at our fee-based assets. And the fee-based assets were up 19%, which if you compare it to the other firms that reported and their net new assets, you would see the relationship that you're expecting. So I would kind of look at that as a proxy for fee-based assets versus overall firm-wide AUA. And I'll have Butch talk about the non-comp trajectory?
Yeah. So with respect to the non-comp expenses, technology and our continued investment and our leading technology in support of financial advisors just continues to be an area of emphasis. So as we continue to manage those non-comp expense levels, we're going to continue to invest in that technology. It's part of our unique culture and our unique value proposition at Raymond James. And so we have to balance continued growth in that expense against continuing to achieve that key objective. So the majority of that increase year over year is for technology. And as a growth company, we still have other expense elements that vary directly with our successful growth, both in terms of NNA, you know, we've mentioned the recruiting expenses and the incremental expenses that come with successful NNA. But we also, as we grow our balance sheet, and we also have growth expenses that come with the growth in the balance sheet. So as we think about the objective, we remain committed to creating, increasing, and improving our operating leverage over time. We believe we continue to have the scale to do that, and so we're focused on our operating margin and continuing to pursue opportunities to grow that operating margin over the long term.
That's a great color, and thanks for accommodating the additional question. Our pleasure.
Operator
We will take the next question today from Alex Blosstein from Goldman Sachs.
Good evening, guys. This is Michael on for Alex. Thanks. Maybe back to the non-com growth that you guys are laying out for 26. So, you mentioned this year will include further investments in tech and supportive recruiting efforts as well. Can you maybe elaborate on what specifically is going into that growth this year? I'll stop there.
I mean, if you look just at our investment in cybersecurity, the growth of AI investments and the development that we're doing with applications across all of our businesses, the infrastructure investment, there's a lot that goes into it. And that's why I was saying earlier, it's just harder and harder for smaller firms to remain independent and competitive without being able to invest a billion dollars a year in technology. We recruited advisors from another great firm, culturally, and they came over and six months later, they said, you know, we didn't realize it until we made the move over, but we were basically on DOS prompt at our prior firm, you know, and they're just not able to necessarily keep up with the technology. And it's nothing inherently wrong with the other firm, it's just you have to have scale and critical mass to make those investments. And so, as Butch said, we're going to continue focusing on technology. I do think long-term, especially with AI, we will find more efficiencies in the cost structure as we deploy AI and automation. We're not going to mention that or even put a timetable on that now because it's still early innings. But we're starting to see some great benefits already. I mean, we just launched Ray. We had a press release that came out. Ray R-A-I, short for kind of Raymond James, a play on that. But it's a natural language sort of Q&A model, if you will, that uses generative AI to answer questions for advisors and their sales assistants and their teams. That way they don't even have to call in. And that's going to create efficiencies for them. That's going to allow our service people to spend their time on higher value problems and solutions and opportunities. So, again, we're not even in the first inning of those opportunities going forward, but it's important that we have the critical mass and the expertise to make the investments to take advantage of those opportunities over the medium term and long term. That's helpful. Thanks.
Maybe one modeling question. When you guys originally increased the kind of cadence of the share repurchases, I think the original range was $400 million to $500 million a quarter. It seems the past couple of quarters has been closer to like $350 to $400 range, including the target for the fiscal second. Can you kind of walk through the rationale? Is that because you guys are allocating capital to other things? Is the target going to remain $4 to $5, or is $400 a better run rate for the rest of the year?
Yeah. So, as you noted, we did repurchase $400 million in this most recent quarter, which was within the guidelines, the guidance that we had provided. And we have indicated an expectation that we'll repurchase at the $400 million levels what we're targeting for this current quarter. And keep in mind that we just had other capital deployment action this quarter where we redeemed $80 million of preferred equity. You know, that has the same effect on Tier 1 capital as a share repurchase. It doesn't have the same, you know, EPS effect as a share repurchase. So I would say we're deploying in capital actions this quarter, you know, targeting $480 million of activity. And going forward, you know, we remain committed to that 400 to 500 quarterly level going forward as we continue to monitor our tier one leverage ratio until such time that, you know, we've deployed it in our other priorities.
Operator
The next question will come from Jim Mitchell, Seaport Global Securities.
Hey, good afternoon. June. Just on the deposit mix, you had ESP balances down a billion dollars, quarter over quarter, another $500 million so far. Is that just demand-driven, or are you actively looking to shrink those deposits and just trying to think through the trajectory of those balances and the mix going forward?
No, Jim, it really was demand-driven because it kind of just had 100% deposit beta, so We haven't been accelerating that to change the demand. If you look at the outflows, the outflows have been pretty consistent. It's really the inflows that have decelerated as rates have started coming in, and I think more clients or funds are getting invested into the markets. I think that's consistent with what you've seen with other firms and their higher-yielding savings products. It's just that rates are coming in, as you would expect, the demand for placing cash there is declining.
Right. Okay, that's fair. And so, when we kind of put it all together with kind of the thoughts on mix from here, deposit mix from here, the forward curve, and your pretty significant loan growth that's picking up at lower rates, how do you think about the combination of NII and RJBDP fees as we go forward for the rest of the year?
Yeah, I mean, I would say it really kind of depends on the rate trajectory from here. So, anywhere, the market's pricing in anywhere from zero to two rate cuts. The lower the rates, I mean, we have pretty good deposit beta on the balances that we have, which provides resiliency on both the NIM and the BDP yield. But in terms of the balances in ESP, I still think clients are price sensitive to what they're earning on their cash balances, even if rates were to be cut a couple more times. It's just the real difficult question to answer is, to what extent does that sensitivity decrease as rates go down? And we really don't know the answer to that, that we would be guessing, but that's what we would have to monitor going forward.
Okay, fair enough. Thanks.
Operator
And our next question comes from Michael Cypress, Morgan Stanley.
Great. Thanks for taking the question. I just wanted to ask about the ALT platform that you've been investing across. I was hoping you could elaborate on how you've been expanding that platform where that stands today relative to where you'd like that to be. And what steps can we expect from Raymond James over the next 12, 24 months with respect to the ALT platform?
Yeah, I mean, with our alt platform, we have a very similar approach that I described with growing the number of advisors that we have. And it's an approach of quality over quantity. You know, we don't want to have every product under the sun, you know, just because it might make a headline or a news story, then there might be some interest that comes in. And we've got to make sure, one, there's critical mass of interest and demand, but most importantly, that the product is well-diligenced from both an operational and an investment perspective. And well-supported on an ongoing basis, which requires ongoing servicing. And that really, to do it well, we really want to make sure that there's critical mass in the products that we do offer. So, we're being deliberate on it. We invest a lot in education. You know, we've seen other firms in the industry use alternative investments as sort of a tool to make it harder for advisors to leave from one firm to the other because they kind of create friction when advisors want to move and or as a profit driver. That's not how we look at any product. First of all, all advisors are free agents and if they want to leave on good standing, we'll help them move to another firm. And we don't want to try to sell any products to them that makes that harder for them and their clients. And secondly, I think it's problematic long term when you start looking at products as profit drivers versus what's most importantly good for clients long term. And so we invest a lot in education and making sure advisors help their clients understand the liquidity impact of investing in private equity. and what portion, what is the appropriate amount of allocation of private equity given the individual client's liquidity needs, which is different among every client, which is why it's so important for the advisor to understand their client's risk tolerance or liquidity needs, where they are in their investment process. And so we have a balanced approach when it comes to offering any product, but particularly private equity, because it is on a relative basis less liquid than the more traditional investments, and it becomes even less liquid when you need the cash, typically, if you look at history. So, we just want to have a balanced approach and a long-term approach there.
Great, thanks. And then just to follow the question on AI, you spoke about automating processes and launching your AI operations agent, Ray. I was hoping you could speak to your aspirations there, how you see this ramping in terms of usage and adoption compared to where that adoption is today. For Ray, what sort of ROI do you anticipate? And then just more broadly, where's their scope to launch additional agents and how you're thinking about potential for an agentic workforce at Raymond James?
No, it's a great question. I mean, I spend a lot of time with our technology leadership asking the same thing. And really, we don't know yet. It's early, it's first inning of opportunities here and deployment. We already have over 10,000 associates that are using AI on a regular basis in one way, shape, or form. So the penetration has been pretty significant. I think over 3 million lines of code are written a month using AI with oversight from the technologists in the group. So we are using AI to a pretty significant extent already, but I still think it's early innings. and the opportunities to expand that as these tools get smarter and more efficient is significant.
Operator
The next question comes from Devin Ryan from Citizens Bank.
Thanks, everyone. I think we've probably covered everything here. Just one maybe to dig in on the securities-based loan growth. I mean, it's just been really off the charts. And so I'm just curious, as we think about kind of the next year here, I get the piece around rates are coming down and that's helpful. But it seems like there's probably a lot of education going on there. And so I'd love to just get a sense of kind of some of the other drivers and then just capacity, because that's a really nice area for you guys. And it would seem like kind of the remixing element of that is quite positive. So I just want to get a sense of, like, how much more room there is to go in terms of penetration of your customers.
Yeah, no, as you said, the growth has been phenomenal. Lower rates have certainly helped that growth. But as you point out, education, technology, the tools to tap into the security space lending product has been significant as well. And also recruiting has driven growth. A lot of the advisors we're recruiting are coming with substantial SBL balances to their clients. So it's really an all-of-the-above approach, and we're optimistic long-term about SBLs continuing to be used by clients because it's a great product for clients relative to other borrowing solutions out there. It's much more flexible, for example, than a home equity loan. And so there's other substitutes out there that are much more mature, that people have much higher awareness of, And as they learn about securities-based loans, there's a lot of clients that are interested in it.
I'll look it there. Thanks a lot, guys.
Operator
Our final question today comes from Dan Fannin from Jefferies.
Great, thanks. Paul, I was just hoping to get some context around the industry and how you're thinking about advisor movement here in 2026 and how that might differ from, you know, say, last year.
I think it's going to be, based on our pipelines, we're optimistic about at least movement to Raymond James. I can't speak to movement to other firms, but we're pretty optimistic about the advisor movement to Raymond James. We're still viewed as a destination of choice. We're still viewed as a leading rower in the wealth space. So we're optimistic about it. And, you know, it's still early in the calendar year, so we'll see what happens. So I think it depends on some of these roll-ups, what happens with them, if anything, over the next year. That will be a potential catalyst as well. So, you know, we don't try to time things. Whether we recruit an advisor this year, next year, or five years from now, you know, we're making decisions over the next five to ten years. So we just want to make sure that we reinforce the unique culture that we have, the power of personal, the personal relationships we're building, in the client-first long-term culture and values that we have as an organization and invest in the platform to make sure that we're competitive along all dimensions, technology and product and support, and making sure that advisor satisfaction and client satisfaction are very high. We won the J.D. Power Award for the most trusted in our industry. Trust is critical in our space as well. And so, and then we know that if we preserve that special combination of facets that make Raymond James so attractive, then we will continue to recruit advisors and retain our existing advisors with the high level of satisfaction that they have. And frankly, I could care less whether that happens this year or next year or five years from now. It's a marathon, not a sprint. And that's why when I hear other firms talk about, oh, we think next quarter we're going to lean into recruiting and put a little bit more money into it, it's like, well, that's not sustainable long-term recruiting. You know, it's a long-term process that requires a lot of investment. And if you dial up recruiting quarter by quarter or dial it down quarter by quarter, then you're not going to get the quality advisors that you want. You're going to get the advisors that are moving or not moving for the highest check. and that's not who we're targeting. We have to have a competitive check, but we want the advisors that want to be here over the long term to make more money and be satisfied here over the rest of their careers.
I think we answered all your questions. Sorry to interrupt, but I think we answered all your questions. I really appreciate your time on behalf of the Raymond James leadership team. We do not take your time or interest in Raymond James for granted and stay warm over the next several days here and look forward to seeing and talking to all of you soon.
Operator
Once again, everyone, that does conclude today's conference. We would like to thank you all for your participation. You may now disconnect.