Operator
Good day, and welcome to the Q3 2025 SEI Earnings Conference Call. At this time, all participants are in a listen-only mode. After the speaker presentation, there will be a question and answer session. To ask a question during the session, you will need to press star 11 on your telephone. You will then hear an automated message advising your hand is raised. To withdraw your question, press star 11 again. Please be advised that today's conference is being recorded. I would now like to hand the conference over to your speaker, Bradley Burke, Head of Investor Relations. Please go ahead.
Thank you, and welcome, everyone. We appreciate you joining us today for SEI's third quarter 2025 earnings call. On the call, we have Ryan Hicke, SEI's Chief Executive Officer, Sean Denham, Chief Financial Officer and Chief Operating Officer, and members of our executive management team including Jay Cipriano, Paul Klauder, Michael Lane, Phil McCabe, Mike Peterson, Sneha Shah, and Sanjay Sharma. Before we begin, I'd like to point out that our earnings press release and the presentation accompanying today's call can be found under the Investor Relations section of our website at seic.com. This call is being webcast live and a replay will be available on the Events and Webcast page of our website. With that, I'll now turn the call over to Ryan. Ryan?
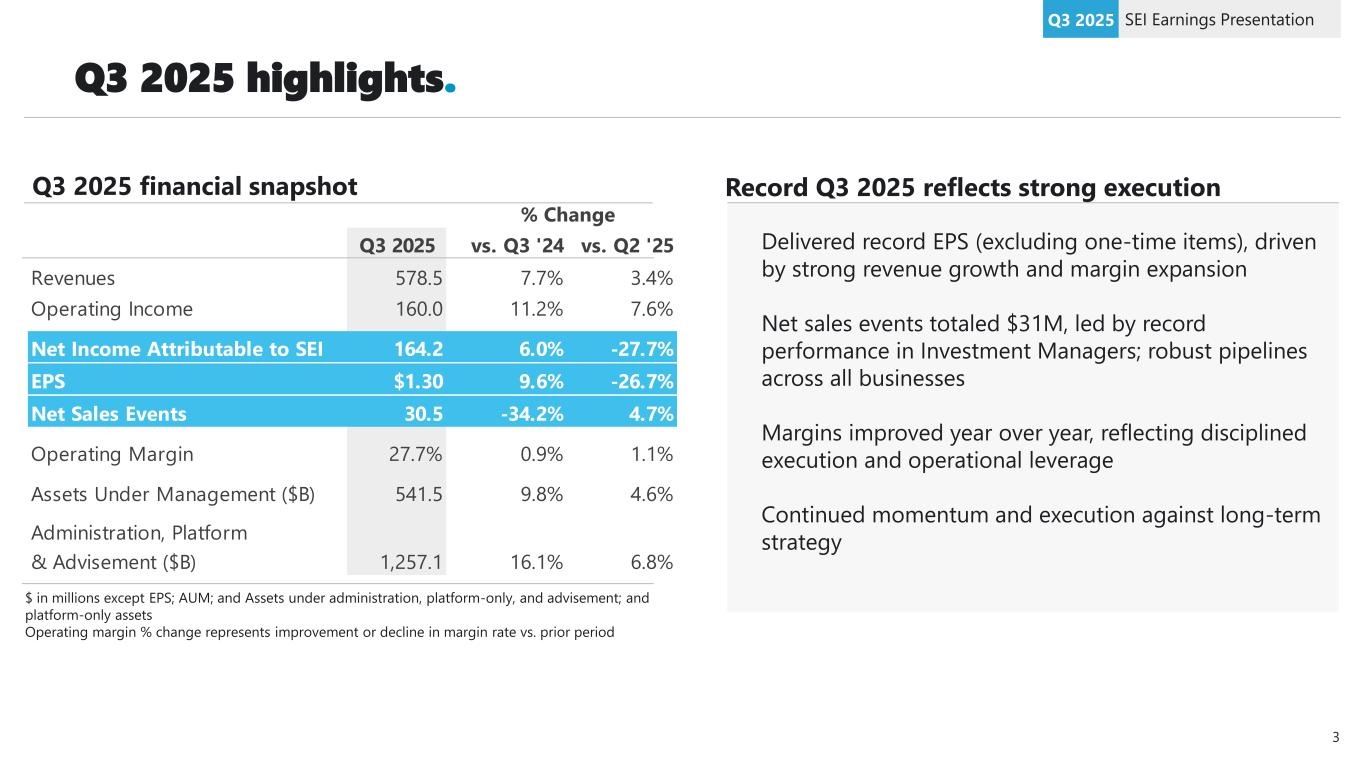
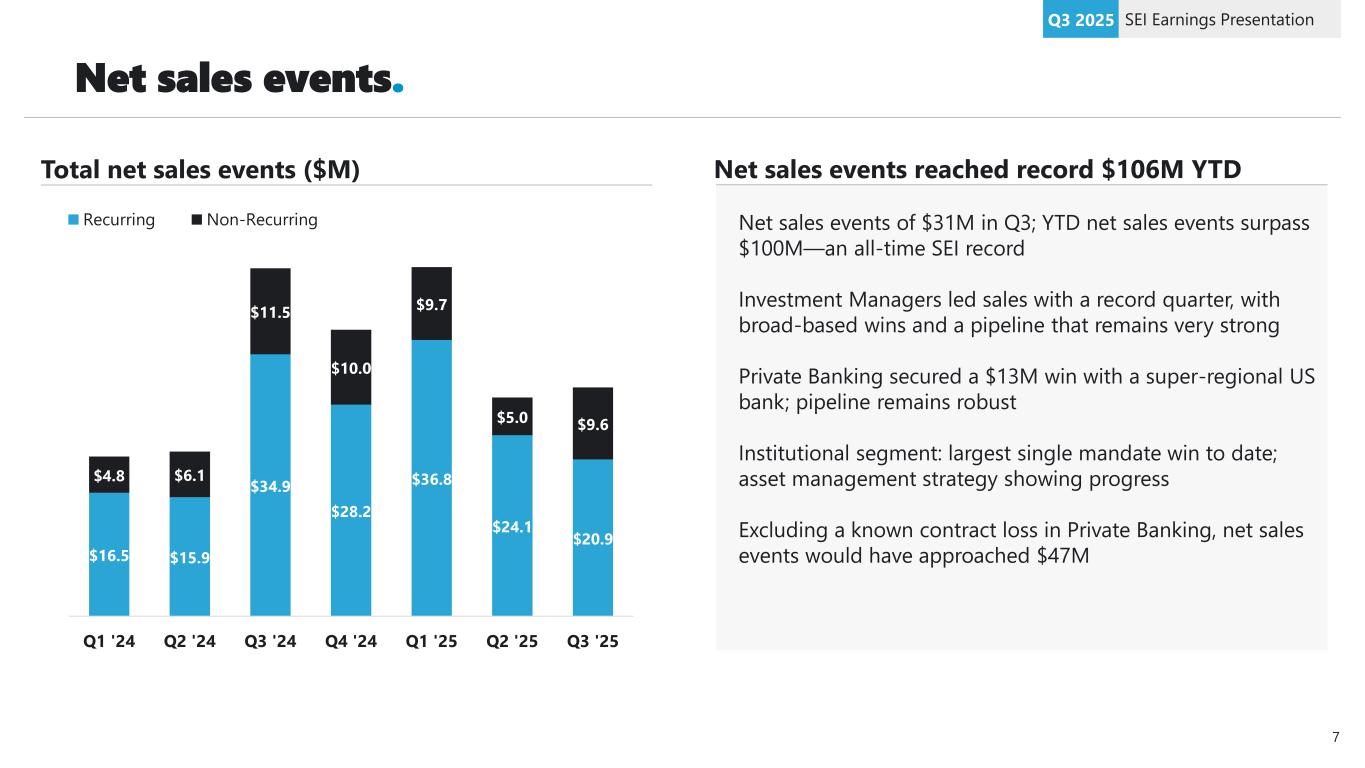
Thank you, Brad, and good afternoon, everyone. We appreciate your time today, especially since we recently spent nearly three hours together during our Investor Day just five weeks ago. First, let me express our gratitude for the overwhelmingly positive feedback we've received since Investor Day. Many of you highlighted the energy, enthusiasm, and clarity of our long-term vision as standout themes. That affirmation reinforces our strategic confidence. We are committed to disciplined execution, transparent communication, and creating long-term value for our clients and shareholders. Turning to the quarter's results, we delivered outstanding performance with EPS reaching 1.3 cents. Excluding one-time items, that's an all-time high for SEI. Earnings growth was robust both sequentially and year over year, driven by strong revenue growth and margin expansion. This is the kind of consistent performance we have been messaging over the past few years. Net sales events totaled $31 million with our investment managers business leading the way. IMS posted a record sales quarter reflecting surging demand for outsourcing and client expansions. This is a testament to the strength of our sector, our competitive position in that sector, and our continued investment in future capabilities. As we said at Investor Day, we believe the growth runway here is exceptional. Congratulations to Phil and his team. IMS sales activity was notable for its broad-based nature, with no single client driving the performance. Approximately two-thirds of our sales events were tied to client expansion, increasing our wallet share. Additionally, two-thirds of the events came from alternative managers. This level of diversification and momentum across client types, both new and existing, reinforces our conviction in the durability of our growth strategy. We also continue to engage with large well-known alternative asset managers who are new to exploring outsourcing fund administration. We believe we are well-positioned in these processes given our best-in-class capabilities, track record of execution, and client reference ability. Due to the size and complexity of these opportunities, the contracting process tends to be longer. And we expect to be able to provide more clarity on the nature of these opportunities in our pipeline in early 2026. Switching units, sales activity in our asset management business was highlighted by the single largest mandate win in our institutional segment to date, a multibillion-dollar fixed income assignment for a state government client. We believe this win reflects the early impact of Michael Lane and the entire team's evolved approach, introduced to this audience last month. We are delivering targeted solutions in areas where SEI has deep expertise while complementing our established OCIO offering. The win also reinforces our ability to compete successfully for specialized mandates and demonstrates our capacity to meet the growing demand for tailored investment strategies from large clients. Private banking secured a $13 million win this quarter, partnering with a leading super-regional U.S. bank on a comprehensive transformation initiative across all business lines. This engagement is strategically significant, encompassing technology, outsourced operations, and a substantial professional services component. Our multiyear engagement with this firm to help them define their targeted operating model and build a business case was instrumental in winning the business. This win is an enormous affirmation of the pivot we made a few years ago to be the market leader in the regional bank segment. We anticipate the project will involve extensive work to retire the client's legacy systems, execute complex data conversions, and integrate new platforms. Importantly, SEI is uniquely positioned to support our clients throughout this transition with our professional services offering, representing an incremental opportunity that is not reflected in Q3 sales results. Our strong wins this quarter were offset by a contract loss in private banking, which drove lower net sales for the segment. We've noticed since 2022 that this client was at risk due to a strategic shift away from their bank trust model. And we received formal notice at the very end of September. This is our only notable loss year to date in private banking. The financial impact should be modest as fee conversions typically occur over multiple years. Importantly, we're confident that recent and future wins will more than offset this loss, supported by a healthy diversified pipeline of opportunities nearing the finish line. Net sales would have approached $47 million for the quarter excluding this single client loss. Even with the loss, posting $31 million in net sales events is a strong result, especially as our new wins are well aligned with SEI's long-term strategic direction. Stepping back, SEI's net sales events have surpassed $100 million year to date, a record for SEI through the third quarter. And as we sit here today, we have more confidence in our sales pipelines when compared to Q3 last year. Building on this momentum, our confidence in the Stratos partnership has only grown since the July announcement. Although we have not yet closed, we are already seeing tangible benefits. Awareness of SEI is increasing across both broker-dealer and RIA channels, and we are receiving renewed inbound interest in our capabilities as a result of the announcement. That enthusiasm was on display at the Stratos National Meeting in mid-September, where advisers consistently asked how they could do more with SEI. And earlier this month, Stratos' leadership, including CEO Jeff Concepcion, joined us at our annual SEI Advisor Summit on Marco Island, which saw record client attendance. Our SEI advisers responded very positively to the partnership and the expanded opportunities it creates. We are on track towards the initial closing, which is expected in late 2025 or early 2026. As we said in New York, we are allocating capital to the highest return opportunities and driving margin expansion through cost optimization and targeted investments in technology, automation, and talent. We're in the early innings of AI and tokenization at SEI. Internally, adoption is encouraging, and we're applying AI to real workflows. Externally, we're advancing tokenization pilots with partners. We expect these initiatives to support efficiency and scalability over time. But near term, our focus is on use case validation and a disciplined rollout. In summary, our year-to-date sales events, record EPS, and expanding pipeline reflect SEI's continued momentum underpinned by disciplined execution and a clear enterprise strategy. Our integrated approach is breaking down silos, enabling us to scale across segments, capture wallet share, and deliver consistent repeatable growth. We are laser-focused on value creation, measured by operating margin, EPS growth, and total shareholder return. Significant opportunity is ahead, and our confidence in SEI's ability to execute and outperform is stronger than ever. And with that, I'll turn it over to Sean.
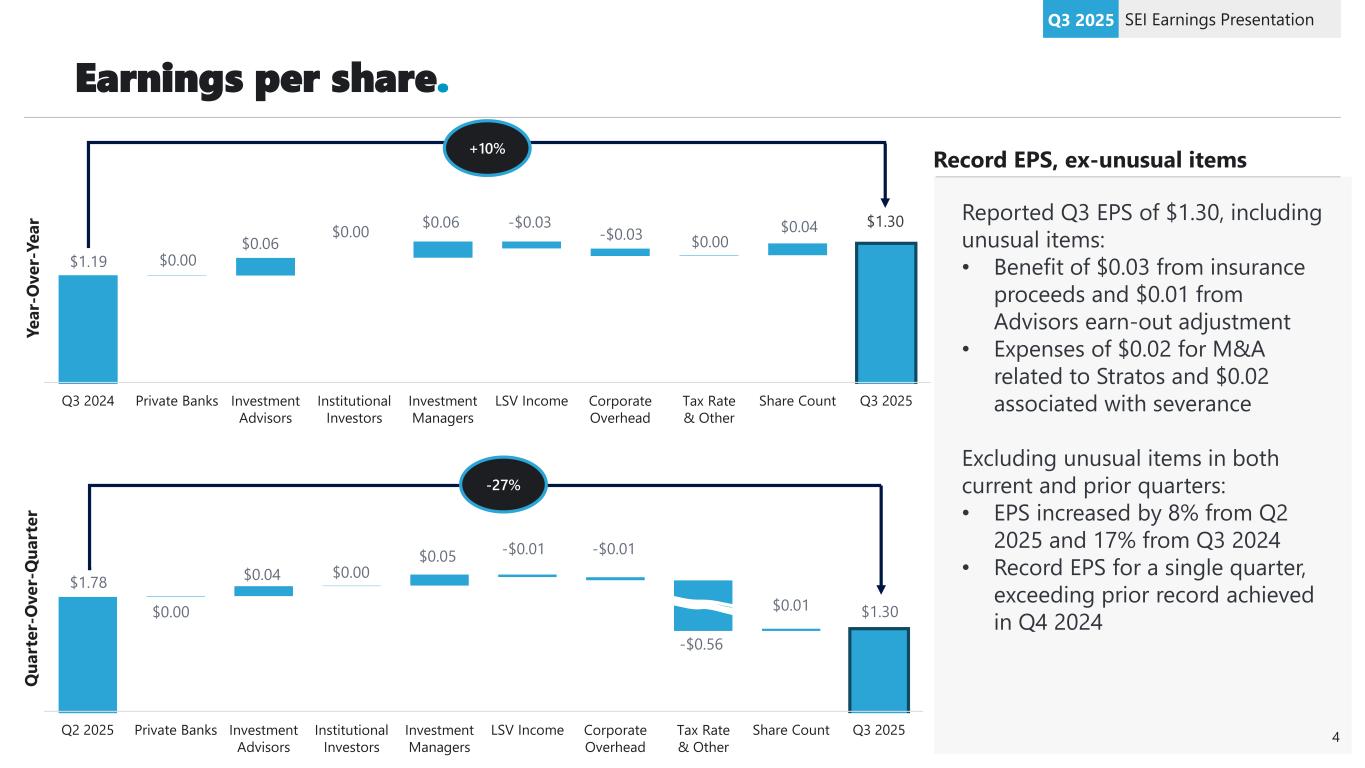
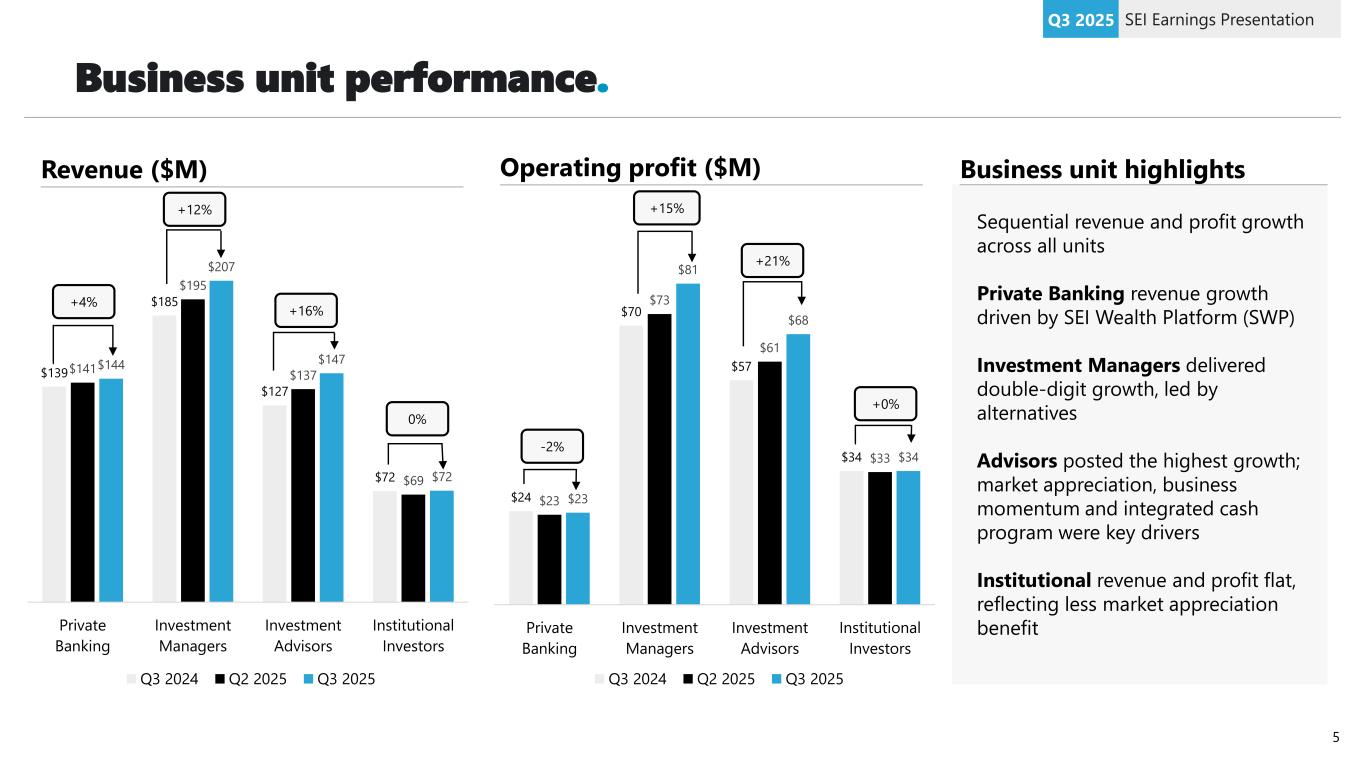
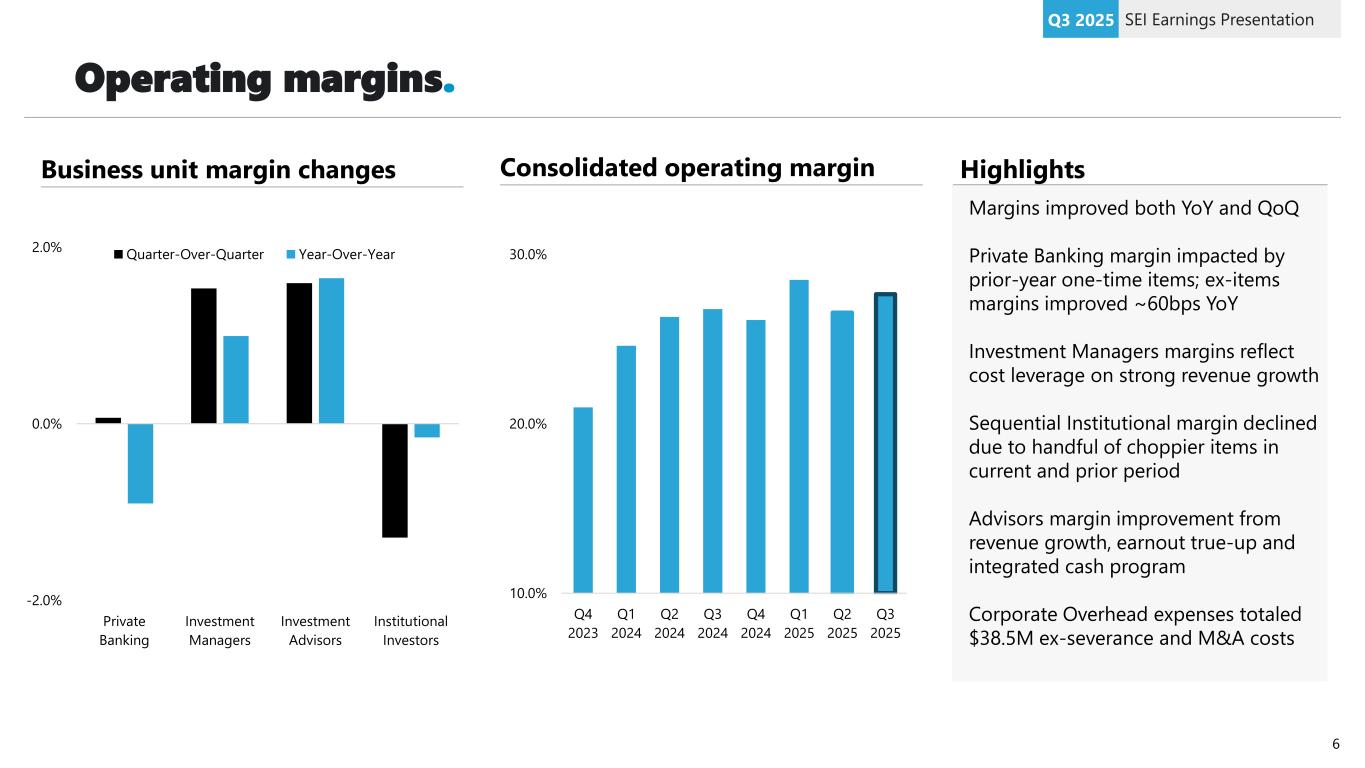
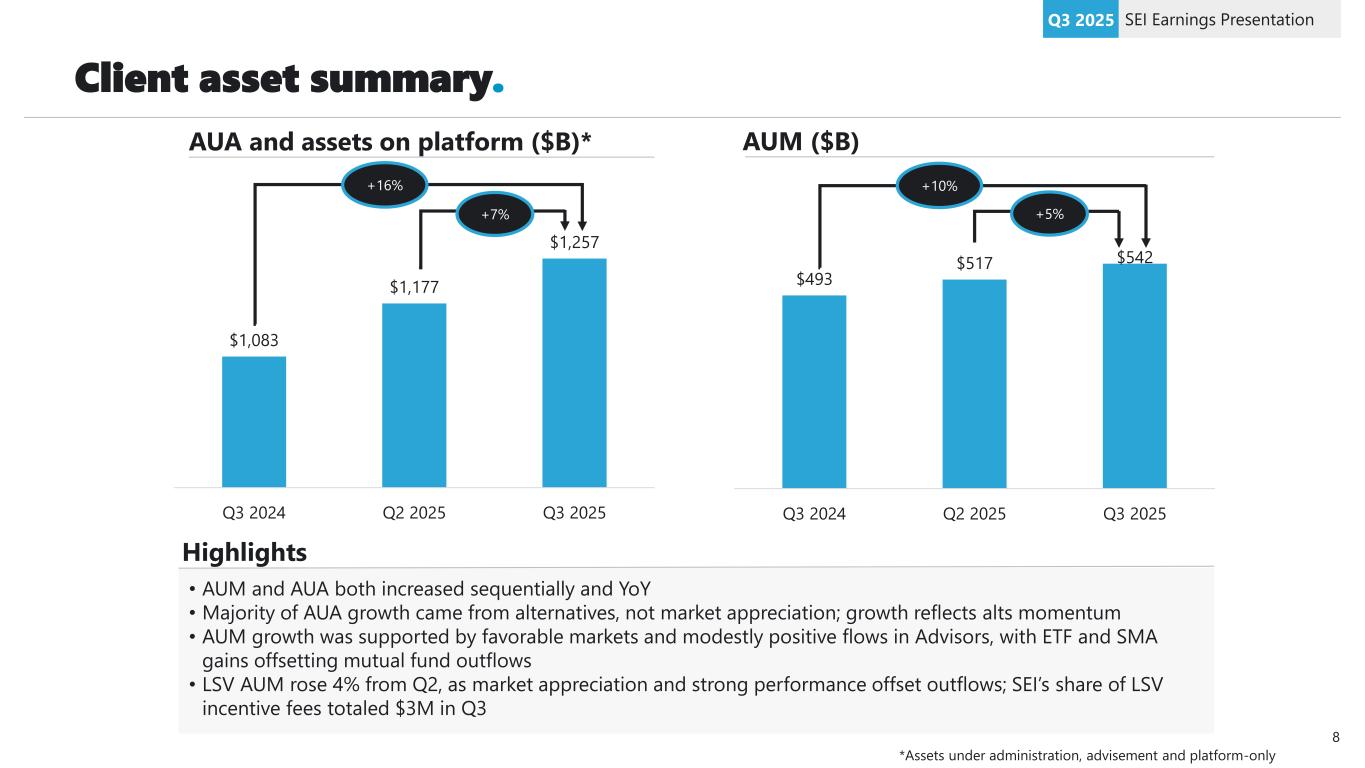
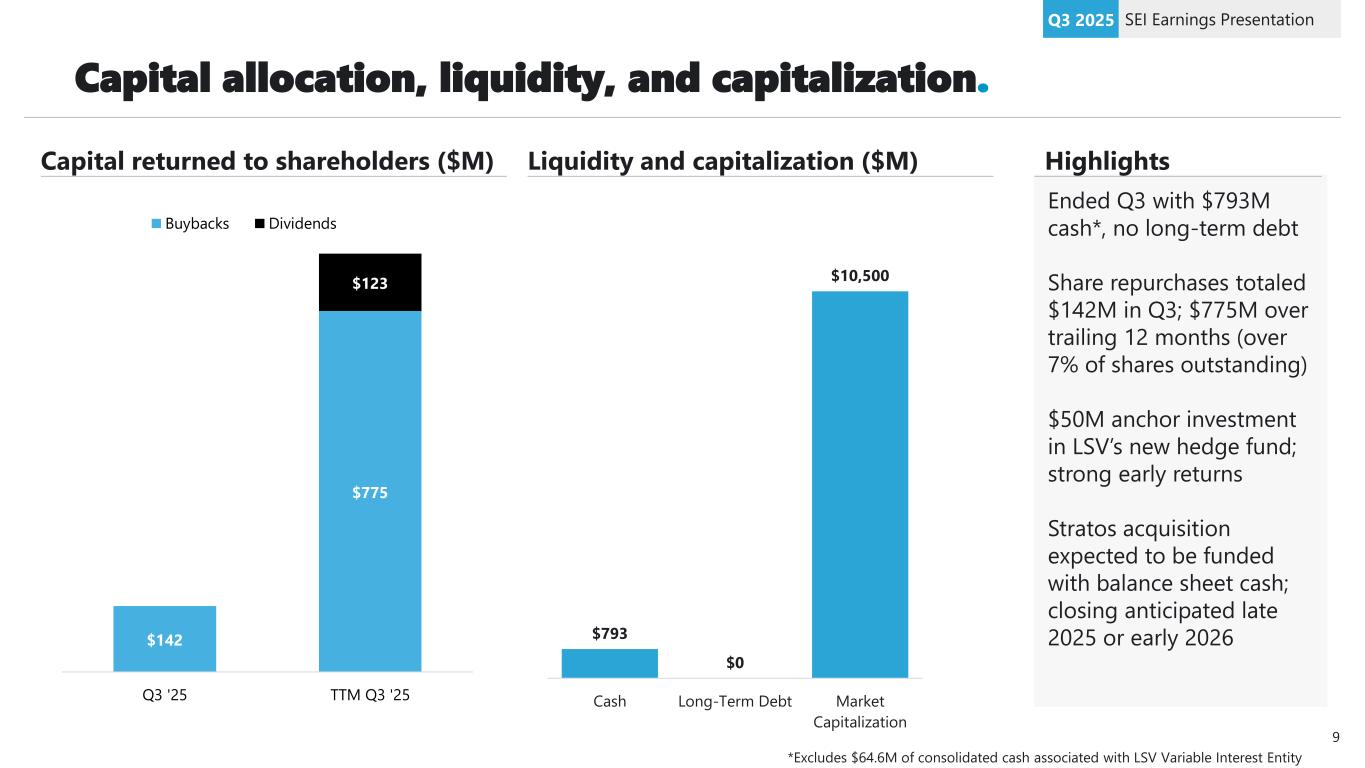
Thank you, Ryan. Turning to slide four, SEI delivered an excellent quarter. Let me start by calling out the unusual items that impacted our Q3 earnings. We recognize the benefit of approximately $0.03 from insurance proceeds related to a 2023 claim into other income. An additional $0.00 from an earn-out true-up in our advisors business. These gains were offset by $0.02 of M&A expense tied to our planned acquisition of Stratos and $0.02 of severance expense related to cost optimization initiatives. For context, unusual items benefited EPS by $0.58 last quarter and $0.08 in Q3 of last year. Excluding these items, EPS grew meaningfully, up 8% sequentially and 17% year over year. It's worth repeating, Q3 represents an all-time record level of EPS for a quarter excluding unusual items like the significant gain on sale realized last quarter. Let's take a closer look at how each of the business units performed on Slide five. Private banking saw a 4% increase in revenue year over year, thanks in large part to healthy growth on our SWP platform. Our investment manager segment delivered another standout performance, posting double-digit revenue and operating profit growth. We continue to see robust growth in alternatives across both the U.S. and EMEA. Traditional revenue in IMS also grew at a healthy pace, benefiting in part from favorable market appreciation. Turning to advisers, this business posted the highest year-over-year revenue growth among all of our segments. We're seeing growth driven by market appreciation, contribution from our integrated cash program, and improving momentum in the underlying business. Institutional revenue and operating profit were essentially flat for the quarter, reflecting lower equity exposure and less benefit from market appreciation compared to our advisors business. On a sequential basis, both revenue and operating profit increased across all business units, with especially strong margin expansion in investment managers and advisers. As you'll see on Slide six, margins were solid in Q3 with meaningful improvement both year over year and sequentially. The year-over-year decline in private banking margin was due to one-time items that benefited last year's results. If we exclude those, private banking margins would have increased by approximately 60 basis points. Institutional margins declined sequentially mainly due to a handful of choppier items in both the current and prior periods. None of these were individually material, but the impact is more pronounced given the lower revenue base in this segment. For investment managers, margins came in ahead of what we communicated last quarter, supported by revenue growth that exceeded 25% annualized from Q2 to Q3. This growth was fueled by factors that are inherently difficult to forecast, such as market appreciation in the traditional business and the timing of capital deployment in the alternatives business. Advisors margin growth reflected strong revenue growth in a $2 million earn-out true-up contributing about 120 basis points to Q3 margin. Margin improvement also benefited from our integrated cash program, which added $10 million to operating profit versus the prior year. Finally, we incurred severance costs of nearly $4 million this quarter, reflecting our commitment to supporting employees through transitions as we continue to evolve our business. The impact was spread across all business units, and most notably corporate overhead. Excluding severance and approximately $3 million of M&A costs related to Stratos, corporate overhead came in at $38.5 million for the quarter. Turning to sales events on Slide seven, Ryan discussed the most notable items in the quarter, including strong wins in investment managers, our large regional bank win in private banking, and a significant institutional win with a new government client. In Asset Management, this quarter's wins offset client departures, most notably in our institutional segment. While losses were previously the only story in this segment, we are now seeing growth elsewhere that offsets these headwinds. A promising sign for the trajectory of our asset management business. Turning to Slide eight, SEI delivered strong asset growth, both sequentially and year over year. Growth in assets under administration was broad-based across CITs, alternatives, and traditional funds. While CITs and traditional funds received some benefit from market appreciation, the majority of the AUA growth was driven by alternatives. Assets under management also increased, with modestly positive net flows in advisers driven by accelerating growth in ETFs and SMAs, which offset continued pressure on traditional mutual funds. Institutional flows were essentially flat, reflecting offsetting sales events. While overall net flows were modest, this trend marks a clear improvement over prior years and supports our evolving asset management strategy. LSV assets under management each increased over 4% from Q2 driven by strong market performance and outstanding performance relative to benchmarks. Market appreciation was only partially offset by nearly $3 billion of net outflows, similar to the pace realized in the first half of this year. LSV performance against relative benchmarks is supporting continued strength in performance fees, which totaled $8 million or $3 million at SEI's share in Q3. Turning to capital allocation on Slide nine, we ended the quarter with $793 million of cash and no net debt. We are maintaining an excess cash balance in anticipation of funding the first Stratos close with the balance sheet cash. Share repurchases represented a primary use of capital, totaling $142 million in Q3 and $775 million for the trailing twelve months. That represents SEI repurchasing more than 7% of shares outstanding just over the last year. At the same time, we're deploying incremental capital to strategic investments that support long-term growth. This quarter, we made a $50 million anchor investment in LSV's market neutral hedge fund. Our early commitment adds credibility to the new strategy and is expected to support future fundraising from institutional investors. Our investment had a strong start, contributing $1.5 million to Q3 results before tax, which has captured a net gain on variable interest income. In summary, SEI's third quarter results reflect continued progress across our core businesses. We are focused on driving growth, optimizing margins, and deploying capital to maximize shareholder value. With that, operator, please open the call for questions.
Operator
Thank you. Please press 11 on your telephone and wait for your name to be announced. To withdraw your question, press 11 again. And our first question will come from the line of Crispin Love with Piper Sandler. Your line is open.
Speaker 4
Thank you. Good afternoon. Hope you're all well. Ryan, you mentioned that two-thirds of your sales events were from alternatives. I don't recall you ever making a comment quite like that as it pertains to sales events. First, are those two-thirds similar to recent quarters, give or take? And then second, when you look at those sales events, the recent ones, are the vast majority from the largest alternative players out there, such as the ones that you called out on a slide at Investor Day being clients, or are there smaller nonpublic alternatives as well that make up a good portion of those wins?
Hey, Crispin. Great to hear from you. It's a great question. I'll go kinda high level and then kick to Phil. So, again, I think it's just an opportunity for us to offer continued transparency into sort of where we're seeing growth. And as we touched on in the investor day, when you look at alternatives in that overall space and the surging demand for outsourcing that I mentioned, we're just kinda calling that out and trying to give a little bit more transparency and granularity. But when you go to Phil, if you wanna chime in here, I think Crispin's question is, is it a lot of the same names that we highlighted that day or new names or a little bit of both?
Speaker 5
Thanks, Crispin. And this is Phil. Actually, it's a mixture of everything, large clients, small clients, but no single event was greater than 10% of the overall number. So it really is a mixture of things anywhere from private credit to insourcers moving to outsourcing, retail, all to, you know, pretty much across the board. We're seeing a lot of alternatives in CITs. It really was a mix. We expect some other announcements, probably early next year to talk a little bit more about some of the larger managers that are moving from insourcing to outsourcing.
Speaker 4
Great. Thank you. Appreciate that and, definitely good news there. Second question, can you just give any color on the known contract loss in private banking with a long-time client? Any details on the losses of merger, competitive takeaways? Just any color would be great.
Speaker 6
Yep. I can answer that question. First of all, this is to highlight this is one loss in the last three plus years since I took over the responsibility. And this is something, as Ryan mentioned, we knew about since 2022. This was a major operating model change for this client. And so we should not read this like a trend. This is a one-off scenario. We have worked with the client. And as you could see, these kinds of deconversions, they take a long time. The onboarding takes time. The deconversion also takes a longer time. But as Ryan has mentioned and Sean has called out that to be on the safer side, we took the hit and announced it in one go.
I do. And I think, Crispin, it's really important to note, and we try to call this out specifically in the script. We got the notice literally at the very end of September. And it's a firm that we have known a long time. We have been actively engaged in trying to help them think through their future operating model. But as Sanjay just highlighted there, we got the notice. We took the entire loss. I don't think we have full insight into the entire deconversion schedule. And exactly what will go when. So we're definitely erring on the side of conservative here. And I think it's really important to emphasize Sanjay's point that this is a one-off event. This is absolutely not a trend. And it can't be ignored, the win that we also had in this quarter as well. But you know, certainly not one. We don't like losses. We worked really hard with this firm. We will support the firm actively as a great partner. Through their transition to a new operating model. As you know, I always live in a world of optimism. I think there's always gonna be more opportunity for us when we treat the client right on the way out. They will probably find a way back to SEI in other ways.
Speaker 4
Perfect. Thank you. I appreciate taking my questions.
Operator
Thank you. One moment for our next question. And that will come from the line of Jeff Schmidt with William Blair. Your line is open.
Speaker 7
Hi, thank you. For the integrated cash program, you're earning close to the Fed funds rate on that cash. With a little spread. Is Internet getting a fixed rate? Or are you considering allocating some of that to fixed rates now that the Fed is easing again? Or how should we think about that?
Speaker 8
This is Paul, Jeff. So on that, we're earning about 370 basis points presently and we're giving the investor about 55 basis points yield. Which is pretty attractive versus our competitors. So we'll continue to look at that investor yield as rates come down. Typically, when a rate comes down 25 basis points, we usually impact the investor by 15 and then we would impact ourselves at 10. At some point, we'll get to a floor, but that's kind of the current program and the current state of affairs on the integrated cash. I think one thing to note when it comes to the integrated cash is to also note that we have 20 times the amount integrated cash and fixed income portfolios. And so when you see a decline in rates, you typically are going to see over time an increase in price. And so some of that you look at it in isolation, it'll have an impact. But overall, it'll be muted by the amount of fixed income we have in our portfolio.
Speaker 7
Okay. And then in private banks, just looking at the expense growth there, it's running a little bit higher over last quarter '2 than we had seen in the previous really a year or two. Is that mainly investments in talent that you've been calling out recently? Or what's driving that? And then how should we think about the offshoring with the new service center? Would that bring growth down over time?
Jeff, I don't think there's anything unusual to call out here with banking if Sanjay wants to provide color. Some of it's just, as Sean mentioned, investments we make to kind of onboard the backlog. Make sure that we're kind of set up to, you know, really successfully create the experience that we want with these clients. But I don't think there's anything you should read into that, Sanjay.
Speaker 6
No. And I would act with the same. I think for us, the number one most important thing is backlog delivery. Signing a new client is a great thing. Yes. We all celebrate. Successfully delivering and onboarding those clients is equally important. And that's why we would see sometimes that, yes, and that could be for professional services delivery, or it could be converting new clients.
Speaker 7
Okay. Great. Thank you.
Operator
Thank you. One moment for our next question. And that will come from the line of Alex Bond with KBW. Your line is open.
Speaker 9
Just wanted to start with the IMS business. Obviously, a strong quarter there. And I know you mentioned the growth there was in part driven by market appreciation and the deployment timing. But just trying to size up the 3Q margin level is the right way to think about the margin for this business on a forward basis considering, the Alt's deployment. And then also, just how the margin here might be impacted sequentially by the ongoing investments you're making and, you know, just trying to see if there will be any impact there you know, from a timing perspective just in terms of a higher expected investment level, in one quarter or the other?
Sure. So, this is Sean. So as I indicated last quarter, we were actually kinda given some light guidance to the street that the margin improvement we were anticipating good margins going forward, but we do know we need to make certain whether it's anticipation of new clients coming on board and us hiring ahead of those clients. Again, as I mentioned in my remarks, the Q3 improvement in margins did take us a little bit by surprise. Some of that, as Phil mentioned, was due to market appreciation. I mentioned that in my comments. That margin or market appreciation obviously is not tied to cost. So when with the market appreciation, you're going to have higher margins than expected. On your the second part of your question on what we expect in the future, we're still expecting strong margins. When I give guidance or light guidance, I would call it, light guidance on what we may expect or what you can expect from margins going forward, I'm really giving more guidance over a period of time as opposed to quarter over quarter. So we do have, you know, for Q4 going to Q1 into next year, we will continue to be making investments into the platform. There's certain things that in Phil's business we need to invest in front of. Whether that's hiring talent in order to support future growth, whether that is certain parts of our technology base. So in broad brush, we would expect margins to be relatively flat, if not a downtick especially as we move into 2026.
Got it. Understood. That's thing I think it's important to add I think it's important to add to that, though, that I think we try to continue to emphasize this message. When we think about how we run the company, we're not trying to run the company on a unit by unit basis. And get too focused on the individual margins in the unit. So if we saw and I'm not forecasting or foreshadowing anything. I'm just saying, what we see as Phil talked about in New York, what we see with that pipeline and what we see with that client base right now we are going to maximize that opportunity. And if that required us to take the margins down a little bit in IMS, we would be more focused on SEI's margins and what we would do in other units to make sure SEI's margins continue to grow and expand, as Sean talked about, in New York. But, I mean, Phil, I think, is really consistent as he was in New York and here. We are really, really enthusiastic about what we see right now with our existing client base and pipeline in IMS. And where we're positioned competitively, we will not let that window pass us by.
Speaker 9
Got it. Understood. No. That's helpful. And then maybe just one more. Just wondering if you could speak to the sales mix between U.S. and international this quarter and also maybe how that's tracking year to date relative to last year. I know it's still early days on the revamp for that area of the business, but maybe additionally, if you could just walk us through maybe what we should be looking for over the coming months and quarters as it relates to just tracking the progress you're making on the international front. Thank you.
Speaker 6
Yeah. This is Sanjay here. So on the international front, as I said on the Investor Day, we are in the early phases. Defining our go to market strategy. And as I said at that time, we're going to focus on maximizing our presence in the jurisdictions we already have a presence. So, for example, UK or Dublin or Luxembourg, those jurisdictions have been we continue to expand our presence there. And we are in the process of defining our strategy. And the other part, we're looking at, okay, how we maximize our opportunities to existing clients. The clients, they we already had the assistance in the U.S. market. And they have a presence in those jurisdictions. So that's what our focus would be. Ryan, Sean, you want to add anything?
Yeah. I will just this is Sean. I'll just echo what Sanjay said. Coming off the heels of Investor Day just a few weeks ago, kind of letting everyone there know that, you know, we are looking at the difference between domestic and international. Would echo what Sanjay said. Little bit early days. So I don't think as we sit here today, we're ready to start giving color around revenue mix between international That that'll come more as we realign our segments, as we start disclosing our segments and with anticipation that at that time we'll give more breakdown between international growth versus domestic growth.
Speaker 9
Got it. Thank you.
Operator
Thank you. One moment for our next question. And that will come from the line of Ryan Kenny with Morgan Stanley. Your line is open.
Speaker 10
Can you unpack a little bit more how you're thinking about the pace of buybacks you did 1.6 million shares in the quarter. Is that the right pace going forward? Or should we expect to slow down as the Stratos acquisition moves forward?
Yeah. So you know, the way I would answer that is, very similar to the way I answered at investor day. So we are expecting that free cash flow on a you know, forward-looking twelve-month run rate would be we would be returning that 90 to 100% through dividends or buyback. So that's the way I'm looking at it. So the cash build, as I is anticipation of drawing that cash down through the Stratos consummation of the Stratos deal And then going forward, I think you can expect whatever our free cash flow that we generate, we're gonna be returning that 90 to 100% back to the shareholders either through dividends but primarily through buybacks.
Speaker 10
Thanks. That's helpful. And then separately, we've seen some modest credit fears in the market with a few bankruptcies, and you're a big private credit servicer. So are you seeing any impact at all in your private credit servicing pipeline? It sounds like no, all good, but be helpful to clarify.
Speaker 5
Sure, Ryan. This is Phil McCabe. I would start by saying that IMS has been IMS has business is really, really diversified by product, by jurisdiction, by type of client. So, but we have spoken to a lot of our private credit managers. They literally are the best of the best in the industry. And they really know how to manage credit risk. They tell us that they're not concerned at all. They're still launching products aggressively. And, you know, collectively, they do, say that there could be a new manager that entered the space on the smaller side. And there could be some struggles in the future. But that's in a part of the market that we really don't play in. We're on the higher end of the market. They're doing really well. The one inch fact on top of all that, is that we really get paid for the most part with private credit based on invested capital. So we're not subject to mark to market or NAV. So we don't really, you know, as of right now, we see any real risk for the business.
Operator
Thank you. And our next question will come from the line of Patrick O'Shaughnessy with Raymond James. Your line is open.
Speaker 11
Hey. Good afternoon. So I understand I heard you when you said that we should not read today's chunky client loss that you spoke about in private banks. As a trend going forward, but to what extent are there other high-risk relationships your existing private bank's client portfolio that you're keeping an eye on at this point?
Speaker 6
Patrick, that's a great question. As of today, we are not aware of any such large client or any such large risk. I also know. Share one example. Early this month, we hosted all of our clients here in Oaks Campus. The engagement was the best engagement over the last three years. So I don't see that as a trend or a big risk. Ryan Shaw? No. I completely agree with you. I mean, if there's you know, we we are always gotta be you know, vigilant in front of our clients, engaged with our clients. But relative to where we were a few years ago, we feel extremely confident that we are in the right place with our clients in the banking business.
Speaker 11
Got it. Appreciate that. Same time. I will say that was that answer. I think I was I appreciate that answer. Sorry. He said he appreciates the answer. Oh, okay. Great. Sorry to interrupt.
So included in ventures, there's really two main revenue streams, although albeit they're not large. One is our Sphere business, and the other piece is our private wealth management business. And those, as I mentioned on Investor Day, if and when we resegment the organization, that segment from a revenue standpoint or even from a segment standpoint will cease to exist. That revenue will then follow the client and the related other segment that it pertains to.
Speaker 11
Got it. Thank you.
Operator
Thank you. And we do have a follow-up question. I believe that will come from the line of Ryan Kenny with Morgan Stanley.
Speaker 10
Hi. Thanks for taking my follow-up. Can you quantify how much margin suppression there's been from accelerated investment? Any numbers or quantification we can think about?
Yeah. Ryan, I, this is Sean. I'm I I don't think I could quantify that. That's actually not really the way we think about the business. It's a great question, but I could not sit here and quantify that for you.
Operator
Thank you. I'm showing no further questions in the queue at this time. I would now like to turn the call back over to Mr. Ryan Hicke for any closing remarks.
Thank you all for your questions and for joining us today. As we close the quarter, I want to emphasize that SEI is on a strategy that positions us for long-term success. But I think it's important as we close the call, we reflect a little bit on the results this quarter. We delivered record earnings per share. The IMS unit had a record sales quarter. We had an important strategic win in the banking business and I know we didn't touch on this so much in the Q and A, but there are some really good leading indicators and lagging indicators when we start to unpack what's going on in the asset management businesses at SEI. And for those reasons, we're confident in our ability to capitalize on opportunities ahead, deliver for our clients, and create value for our shareholders. But thanks again everybody for your time and interest in SEI, and we look forward to updating you next quarter.
Operator
This concludes today's program. Thank you all for participating. You may now disconnect.