Operator
Greetings. Welcome to SEI second quarter 2026 earnings call. At this time, all participants are in a listen-only mode. A question and answer session will follow the formal presentation. If anyone should require operator assistance during the conference, please press star zero on your telephone keypad. Please note this conference is being recorded. I will now turn the conference over to Brad Burke, Head of Investor Relations and Treasurer. Thank you, sir. You may begin.
Thank you and welcome everyone to SEI's second quarter 2026 earnings call. We appreciate you joining us today. On the call, we have Ryan Hickey, SEI's Chief Executive Officer, Sean Denham, our Chief Financial and Chief Operating Officer, and members of our Executive Management Team, including Michael Lane, Phil McCabe, Mike Peterson, Sneha Shaw, Sanjay Sharma, and Amy Slowinski. Before we begin, I'd like to point out that our earnings press release and the presentation accompanying today's call can be found under the investor relations section of our website at SEIC.com. This call is being webcast live and a replay will be available on the events and webcast page of our website. With that, I'll now turn the call over to Ryan.
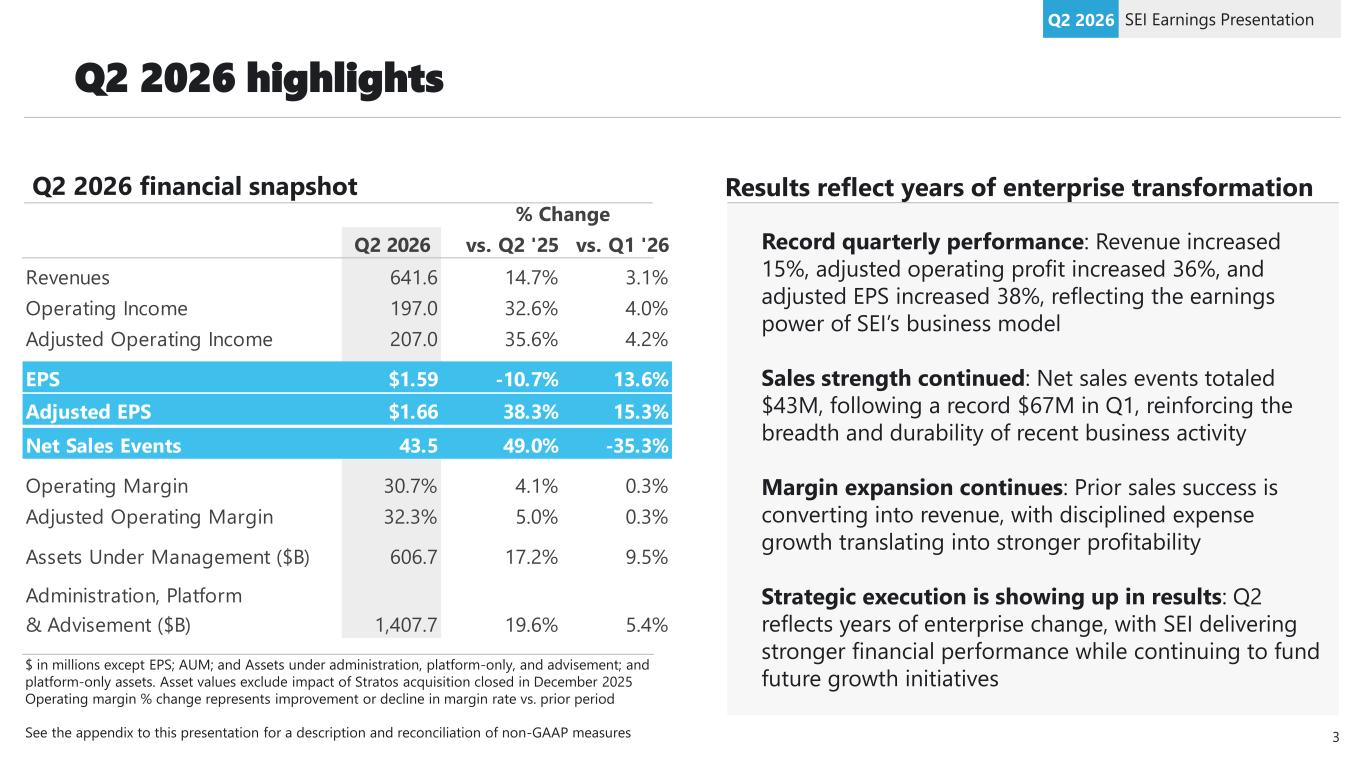
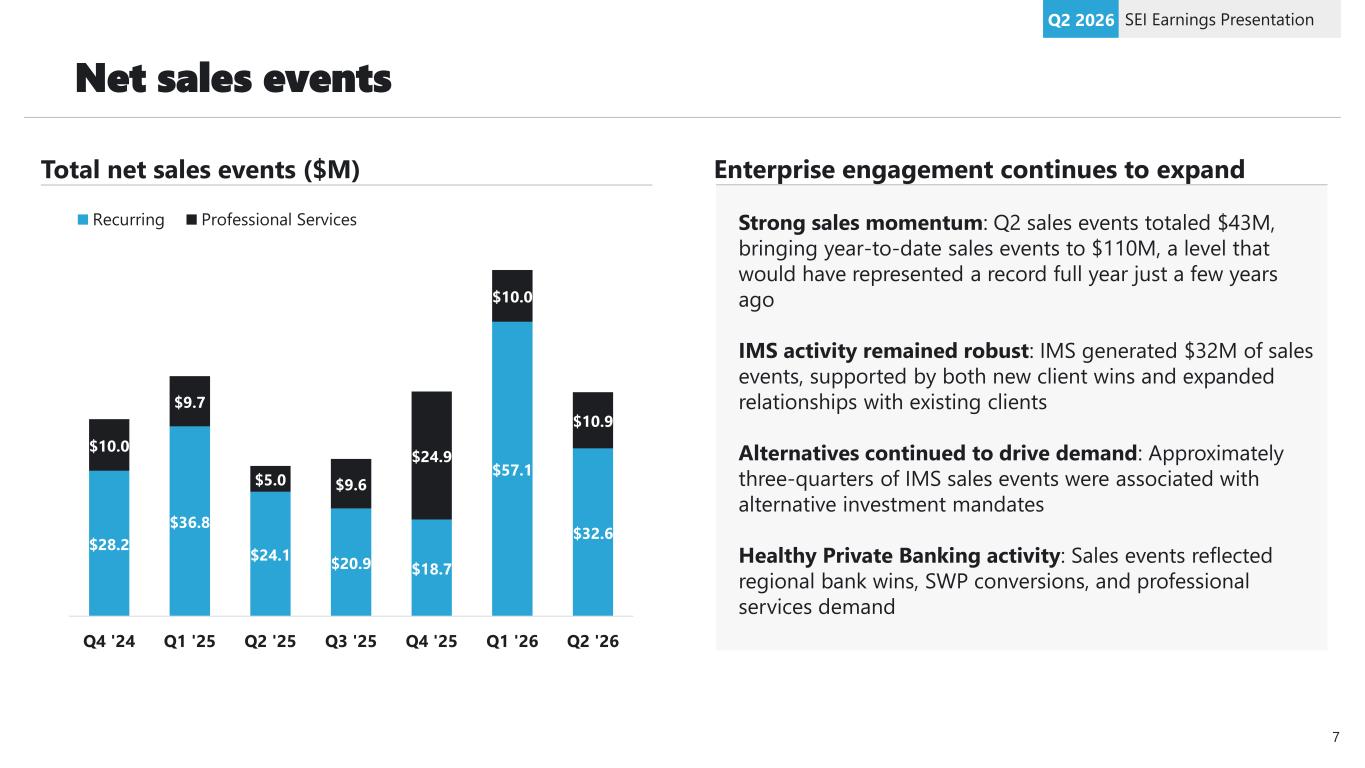
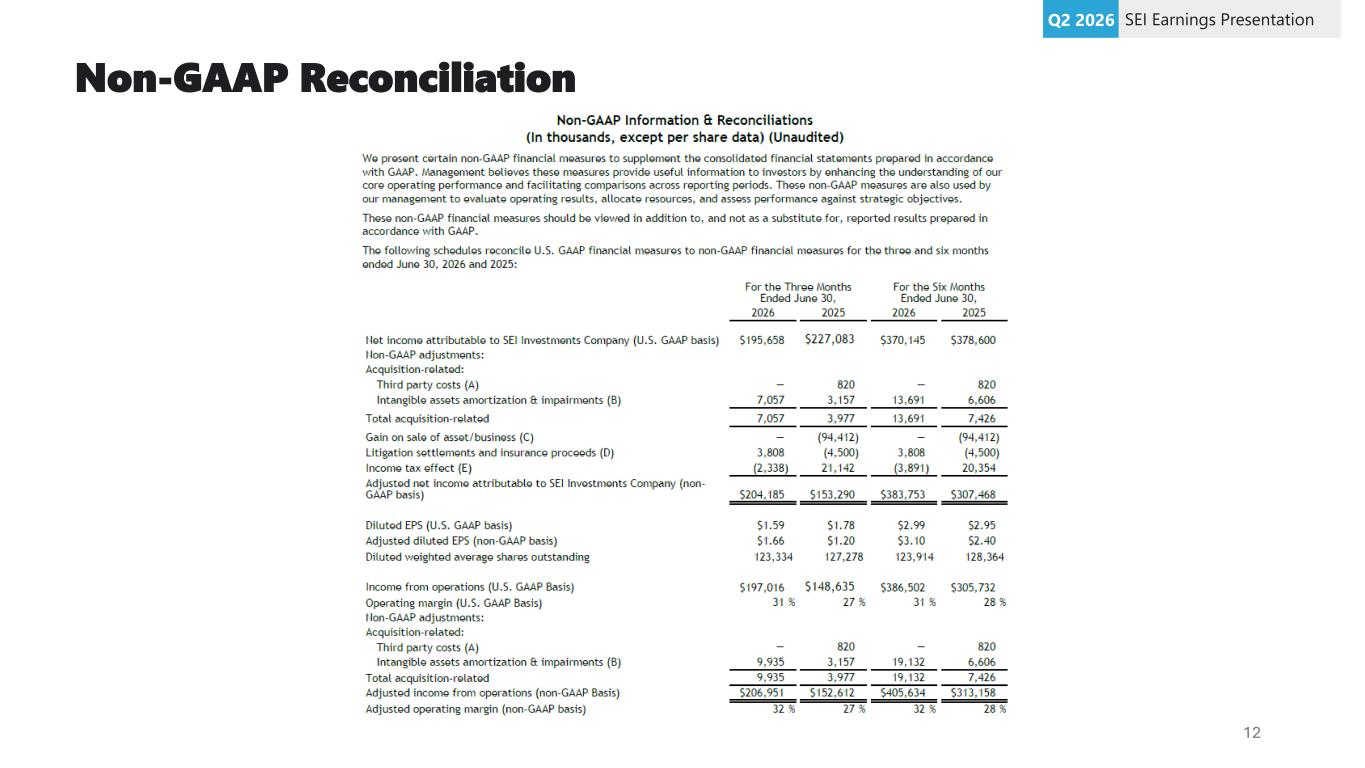
Ryan. Thank you, Brad, and good afternoon, everyone. I assume most of you have reviewed the numbers by now. SEI had an outstanding second quarter. Compared to the prior year, revenue increased 15%, adjusted operating profit increased 36%, and adjusted earnings per share increased 38%. All three represent quarterly records for SEI. This quarter is less about what happened during the last three months and more a reflection of the changes we have made over the past few years. We are more disciplined in how we allocate capital across both investments and talent. We have evolved our value proposition and how we operate as an enterprise. It also reflects the continued activation and execution of the strategic goals we announced during our investor day. You are seeing those efforts translate into financial results. And perhaps most important to us, we're achieving those results while investing in the future of our business. Several of these investments have been funded, initiated, and launched within the last 12 months. They contribute little to our financial results today, but we're already seeing signs of traction and believe they can become meaningful contributors to SEI's next phase of growth. I'd like to touch on a few of them. First, the continued expansion of private markets into retail and retirement channels. We believe this trend remains in the early innings and plays directly to SEI's strengths, specifically our ability to execute at scale. As private markets move into wealth and retirement channels, managers need administration, transfer agency, investor servicing, compliance, and scalable operational infrastructure, capabilities SEI has spent decades building. The recent expansion of our SEC-registered transfer agency is an important milestone. Combined with our fund admin platform and our trust company, the TA gives SEI a full-stack capability. We're also seeing growing interest in bringing private market exposure into retirement plans, especially through collective investment trusts. SEI is one of the only scaled independent trust platforms in the industry, making us the natural partner for investment managers bringing private asset solutions to the retirement space. When we look at the growth of retail alternatives, the expansion of private markets into retirement plans, and SEI's outstanding competitive position, we believe these initiatives have the potential to grow into a business generating more than $100 million of annual run rate revenue in five years. This represents one of the most compelling growth opportunities for SEI, and our position as the connective tissue of modern financial services shines through here. second executing on our asset management strategy we have moved beyond reimagining the business and into execution we're seeing momentum in etfs expanding our private market capabilities and advancing a growing product pipeline that includes new etf launches enhanced model capabilities and strategic partnerships last week we launched our latest active factor etf seus bringing our total ETF lineup to 10 funds. Over the last 12 months, the ETF business at SEI has grown from $3 billion to over $8 billion. We're also making progress in private markets through initiatives like our recently announced partnership with Carlyle, which combines Carlyle's origination expertise, distribution, and trusted brand with SEI's breadth of capabilities. This is the type of innovation we want to see more consistently. Product development that's tied to market opportunity, supported by multiple enterprise capabilities, and delivered in a way that strengthens our competitive position. Turning to Stratos, there is growing interest from SEI advisors seeking succession, liquidity, and growth solutions without leaving our ecosystem. That interest includes several of our longest tenured advisor relationships, many of whom historically may have looked to third-party acquirers. By providing an alternative path, Stratos helps these firms remain within SEI while creating additional opportunities for us to participate in their future growth. We believe this validates one of our core strategic objectives. We also have a healthy pipeline of non-SEI acquisition opportunities at attractive valuations, which represents an excellent use of capital. While there's still work ahead, We're building a stronger and more competitive asset management business every day, and I am confident in the strategic and tactical direction of the asset management platform. The last of the investments I'll highlight is the application of technology, data, automation, and AI to improve both client experience and the scalability of our business. recent enhancements to sei data cloud and our ims platform are helping clients gain faster access to information simplify integrations reduce operational complexity and make better use of their data a significant part of that effort is the digitization of core operating process we're digitizing nav delivery creating automated data flows between sei and our investment manager clients with a very clear objective, eliminate friction, simplify operations, and help clients redirect more time, capacity, and capital towards their growth. Our approach to AI is straightforward. We're focused on embedding AI into workflows to improve service, automate routine processes, accelerate onboarding, enhance access to data, and help clients operate more efficiently. Before concluding, I'd like to briefly address sales events. Sales events totaled $43 million during the quarter, following the record $67 million we reported in Q1. It was one of the strongest quarters in the history of SEI. The breadth of this activity is extremely encouraging. IMS generated more than $32 million of sales events, driven by a healthy mix of new client wins and expanded relationships with existing clients the activity was also broadly distributed across the business rather than concentrated in any one client or opportunity i was on the road with many clients and prospects this quarter i can only emphasize that the engagement we are getting at the sea level of these large organizations is better than i have ever seen in my 28 years in the business. Private banking delivered more than $13 million of sales events, and we also saw encouraging activity from asset management and newer growth initiatives. Many of these opportunities are becoming larger, more strategic, and more enterprise-wide in nature. Clients are engaging with SEI across multiple capabilities rather than a single service or solution. Over the last several quarters, we've emphasized that the quality of sales events is every bit as important to us as the quantity. The results we're reporting today validate that point. We're winning opportunities that leverage existing capabilities, require less incremental investment, and contribute more quickly to our financial results. This is a key driver of the strong growth and profitability we're seeing across the enterprise. As we look ahead, our pipeline remains outstanding. Activity levels are high, the opportunity set is broad-based, and we're seeing continued engagement from many of the largest and most sophisticated firms in our target market. But none of this happens without the incredible focus and execution of our workforce. And I thank them for another amazing quarter and for their energy and passion to lead FCI every day and delight our clients. With that, I will turn the call over to Sean. Thank you, Ryan. Let's start on slide four.
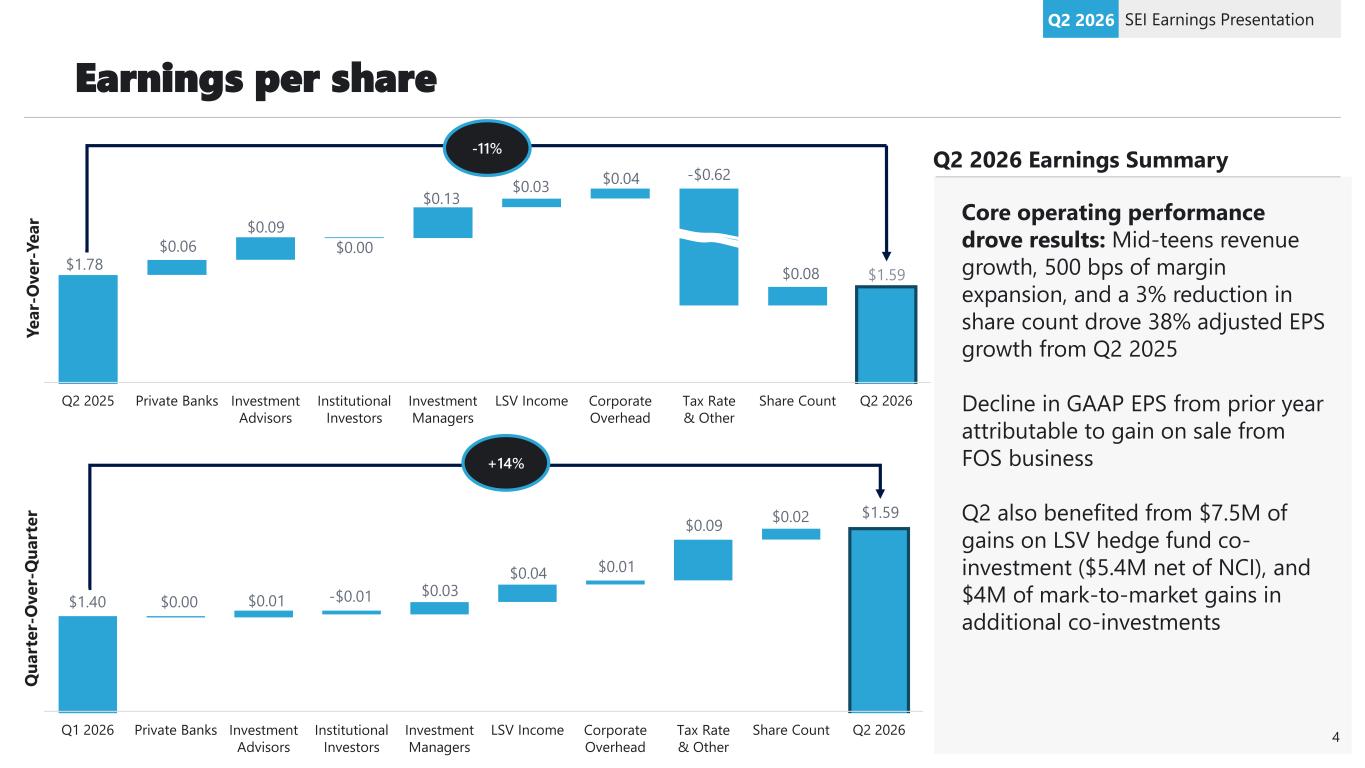
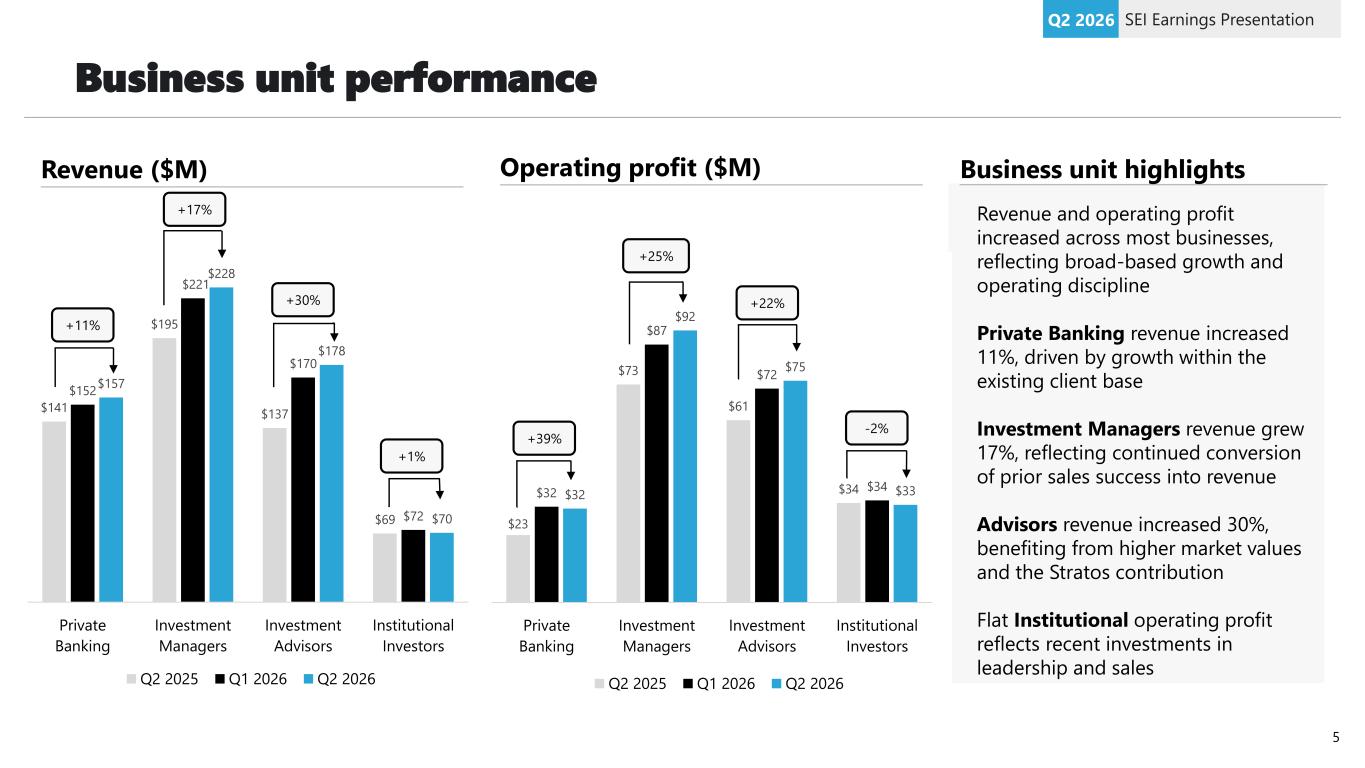
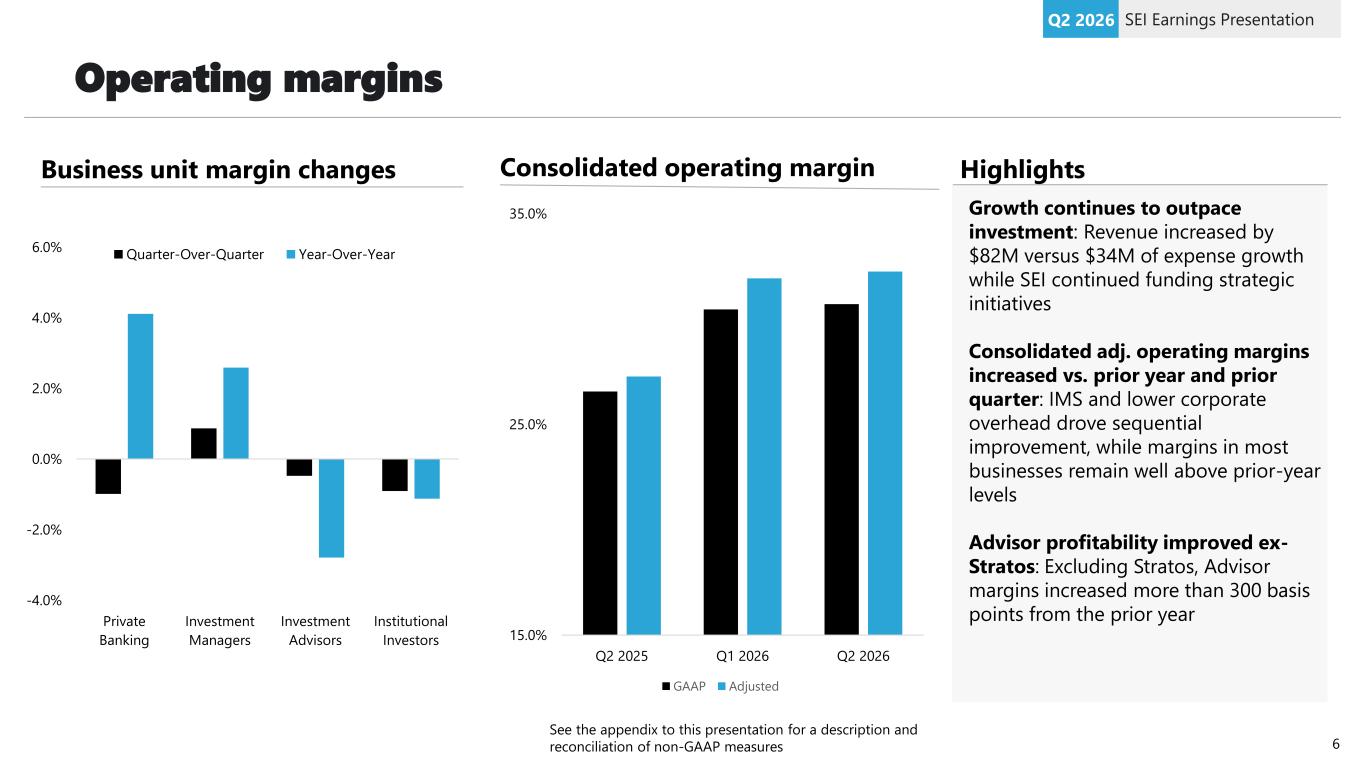
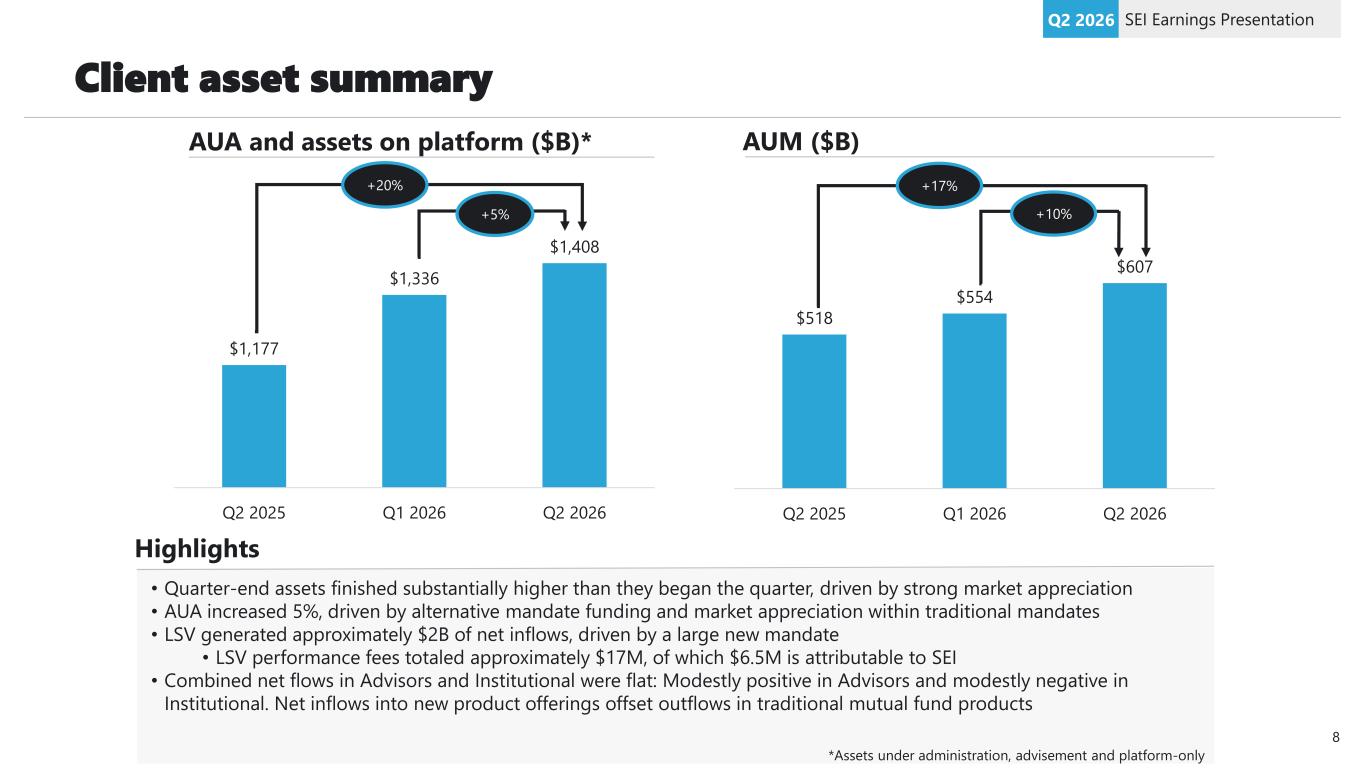
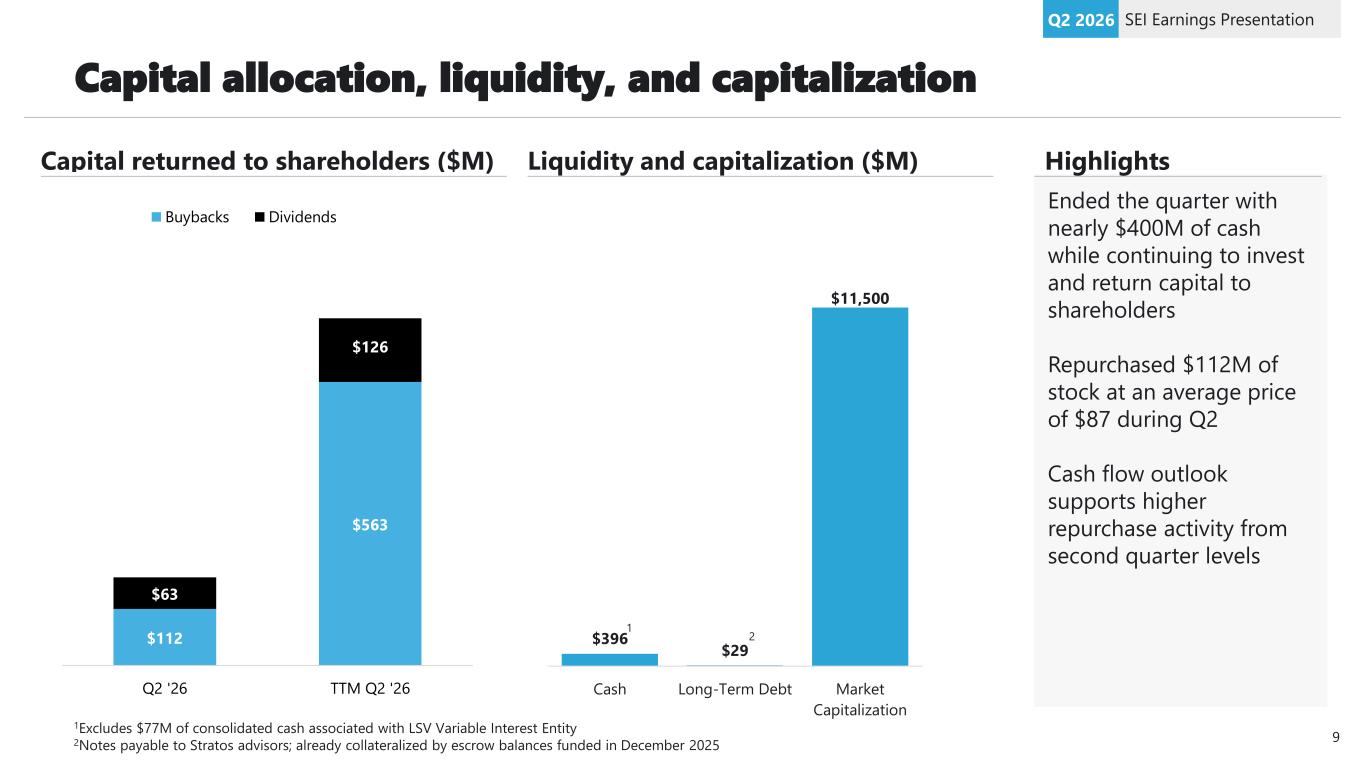
Ryan highlighted the outcome. I'd like to spend a few minutes on what's driving it. The results this quarter were not the product of a single event. They reflect strength across the business, the continued conversion of prior sales success into revenue, and the operating leverage that comes with sustained growth in disciplined expense management. The 38% increase in adjusted EPS from the second quarter of last year was driven primarily by core operating performance. Mid-teens revenue growth, 500 basis points of margin expansion, and a 3% reduction in share count. The quarter also benefited from a handful of investment-related gains. Most notably, our consolidated co-investment in an LSV hedge fund contributed $7.5 million during the quarter to the net gain on VIE's line item. We invested $50 million in that strategy last year, and it has generated over $12 million of gains in the last 12 months after excluding non-controlling interests. It's also a good start. We also We also recognize nearly $4 million of mark-to-market gains across several other co-investments during the quarter. Turning to slide five, revenue and operating profit increased across most of our businesses, and I think it's worth noting, the strongest operating profit growth is coming from businesses that see little benefit from market appreciation. In other words, the growth is being driven by strong underlying business performance. IMS generated revenue growth of 17 percent, reflecting the conversion of prior sales success into revenue. Private banking revenue increased 11 percent, driven by growth within the existing client Advisors' revenue increased 30 percent, which did benefit from higher market values and the contribution from Stratos. Operating profit growth was broad-based, reflecting both revenue growth and continued operating discipline. institutional was the exception with operating profit roughly flat with last year as we continue to invest in the asset management initiatives ryan discussed earlier this quarter's performance reinforces a point ryan made earlier the quality of sales events is just as important as the quantity over the last two years we have seen meaningful improvement in both new businesses converting into revenue more quickly implementations are generally shorter and less expensive and the economics of those wins are margin-accredible. The result is stronger revenue growth and improved profitability. Moving to slide six, adjusted operating margins increased 500 basis points compared to the second quarter of 2025 and 30 basis points compared to the first quarter. Compared to last year, revenue increased by $82 million, while expenses increased by $34 million. Importantly, margin expansion came while we continued to invest in future growth across the business. We added resources in key areas, invested in product development, and funded a number of strategic initiatives while continuing to actively manage our overall cost base. Compared to Q1, margin improvement was led by IMS and lower corporate overhead. Private banking margins declined modestly from the first quarter due to several significant client implementations and continued investment in leadership and sales resources. Even with those investments, private banking margins were more than four percentage points higher than the second quarter of last year. In advisors, Stratus contributed $21 million of revenue, up 11% from Q1, reflecting a full quarter of contribution from several smaller transactions completed late in the first quarter. Stratos generated $2 million of operating profit before non-controlling interest. Excluding acquisition-related and tangible amortization, Stratos EBITDA exceeded $9 million in the quarter. Excluding Stratos, advisors' margins were essentially flat, with the first quarter in more than three percentage points higher than the second quarter of last year. IMS margins improved both year-over-year and sequentially, reflecting continued revenue growth and operating leverage. Finally, the sequential decline in corporate overhead was primarily attributable to approximately $3 million less severance-related expense than the first quarter. Turning to slide seven, the sales success we discussed over the last several quarters continued in Q2, providing further support for our confidence in future growth. Second quarter sales events totaled $43 million, bringing the year-to-date total to $110 million. For perspective, just a few years ago, $110 million would have been a record for an entire year. IMS led the quarter with $32 million of sales events. Approximately half came from new client wins, including continued contribution from the two large relationships announced last quarter. The remainder was driven by expanded relationships with existing clients and professional services activity associated with the several significant wins announced over the last year. By asset type, approximately three-quarters of IMS sales events came from alternative investments. This underscores our commentary regarding the durability and growth in the demand for alternatives. Brian mentioned his level of C-suite engagement, but he wasn't the only one racking up airline miles this quarter. I personally met with executives from several of our largest IMS clients and prospects. I can tell you that SEI's enterprise position is resonating. The conversations were constructive, engagement levels are high, and there's growing interest in expanding these relationships. Private banking sales activity was driven by new regional banking client wins, the conversion of existing clients from Trust 3000 to SWT, and strong client demand for professional services, including SEI Data Cloud. Private banking also continued to have success with re-contracting activity, executing contract renewals representing $13 million of annualized revenue during the quarter, building on the $34 million achieved in Q1. Across advisors and institutional, net sales events were modestly negative during the quarter. We continue to see demand for newer offerings, including ETFs and SMAs, though those products generally carry lower fee rates than the traditional mutual funds. Turning to slide eight, quarter-end assets finished substantially higher than where they began the quarter, driven by strong market appreciation. Assets under administration increased 5%, driven by the funding of alternative mandates and market appreciation within traditional. LSV generated net inflows of approximately $2 billion during the quarter, a notable reversal from recent trends. Inflows were driven by the funding of a new large new mandate that was awarded following an extensive diligence process and strong long-term investment performance. Binding with market appreciation, total LSV assets increased by nearly $17 billion during the quarter. LSV's investment performance also remained outstanding. Several non-U.S. strategies, including global large cap and emerging markets, continue to outperformed their benchmarks, translating into nearly $17 million of performance fees during the quarter, of which $6.5 million was attributable to SEI. Income from LSV was partially offset by a one-time charge. Excluding this charge, SEI's share of LSV earnings would have totaled approximately $43 million during the quarter. Within SEI's asset management businesses, net flows were relatively flat, with modest inflows and advisors, all set by outflows and institutional. New products are gaining traction. Distribution capabilities continue to improve, and client engagement has increased. Those developments are not yet fully reflected in our financial results, but they represent measurable progress from where we were a few years ago. Turning to slide nine, we ended the quarter with nearly $400 million of cash while continuing to invest in the business and return capital to shareholders. During the quarter, we repurchased $112 million of stock at an average price of $87. Repurchase activity was lower than the first quarter, which was driven by the significant opportunity we saw during the market volatility earlier this year. Given our cash flow outlook, we would expect repurchase activity to increase from second quarter levels. In closing, the second quarter highlights the earning power of SEI's business model. The strength of the quarter was broad-based, with growth across nearly all of our businesses and continued evidence that the sales momentum we've discussed over the last several quarters is translating into financial performance. With that, operator, let's open the call for questions.
Operator
Thank you. If you would like to ask a question, please press star 1 on your telephone keypad. A confirmation tone will indicate your line is in the question queue. You may press star 2 if you would like to remove your question from the queue. And for participants using speaker equipment, it may be necessary to pick up your handset before pressing the star keys. Our first question is from Jeff Schmidt with William Blair. Please proceed.
Hi, thank you. The private bank margins have improved, I think, more quickly than you originally thought. And, you know, I know you've pointed to them returning to the historical kind of 25% to 30% range. You know, could there be upside to that and over what time period?
Operator
So, if you recall our yesterday presentation, we talked about a five-pronged strategy for private banking margin improvement. We are executing that strategy. That is a two-pronged strategy. One, we are focusing on growth initiatives. and second set of initiatives are around efficiency improvement and so what you are saying over the last five six quarters that we are improving our margin we are moving right direction that's a that's the outcome of that strategy execution we will be judicious in terms of where we need to invest so that we can continue to deliver our backlog and also continue to invest in our new products as needed for our clients to grow their business so it will be a balance between our growth initiatives as well as margin expense and efficiency improvement. Brian, Sean, you want to add anything?
I mean, the only thing I would add there is really with all new WINS sales events, we are seeing an increase in professional services in essentially every single new deal. In those new deals, professional services has essentially exceeds what our historical margin of 20% is, which is leading and contributing to higher margins, and we expect that to continue.
Okay, that makes sense. And then maybe more broadly, you know, are you seeing demand for outsourcing, just kind of increase in general across your businesses, just thinking of, you know, companies wanting to modernize and use AI? And I guess are your AI capabilities kind of far enough along to help you capture some of that? Or is that, you know, what the IBM partnership may help you with.
Yeah, Jeff, it's Ryan. I would start by saying at the highest level, the answer to your question is an emphatic yes. So we are seeing a demand for outsourcing across almost all of our segments. And I think that's driven by two major trends. One is I think organizations really are, the value proposition we have about helping organizations more intelligently deploy their capital towards growth is absolutely resonating. And then you combine that with the breadth of our capabilities and the reference ability of our clients in the market, it's a pretty powerful combination. If you take that down to a sub-level and talk about areas around technology, modernization, and AI, I'll turn to Sneha to maybe give some color on the progress we've made in AI and some of the demand we're seeing from clients.
Yeah, absolutely. So, you know, what's really interesting for me from our clients is that they're all coming to us because they're going through the same operating model change that we are. And as they're looking at their own operating model, they're questioning where does their competitive advantage sit and where can they leverage partners more? And since we're a trusted partner in so much of their business, the first question they're asking us is, what more can you do for us? So we're starting with just sharing the learnings of our journey and how we're deploying it and what we're seeing. We're now getting a lot of demand for our data cloud services and our professional services around AI readiness, and so that's becoming an increasing area of client conversation and demand, and we think that that's going to lead into even more services that will help them figure out their new operating model as we go.
And Jeff, one other thing I would add there is that, Sean, you know, the reason, really the primary reason for the IBM relationship, we do have a lot of labor-intensive processes. is IBM is really supporting us in that automation journey, helping us co-create agents with us. And it's really so important to the business because we need to scale. The demand for our services, demand for our products has gotten to a point where we need to be able to scale quicker to meet that market demand and support our clients in their growth efforts.
Operator
Our next question is from Ryan Kenney with Morgan Stanley. Please proceed.
Hi. Just want to follow up on that last question on private banks and AI. So you've had strong revenue growth for a while, 10 million of sales events in private banks. So is the increased demand mostly coming from AI, or is there something broader going on that's driving outsourcing? And then just to clarify, is the IBM relationship mostly focused on the private bank segment, or does it span across the company?
First, I'd say, and we'll go around here, When you look at the banking segment, as Sanjay mentioned around the call-around margin expansion, it's still core operating platform, investment processing, the SEI Wealth platform, and our back office services. The expansion of professional services we've talked about, I would say data cloud is probably the number one demand over AI right now because without a data strategy and the right infrastructure around data, you don't have an AI strategy. So that has resonated extremely well, Ryan. But I think, you know, the core of what we do in banking continues to remain, and Sanjay has done a brilliant job of kind of expanding the segment in terms of capabilities and solution set. And I'll let Sanjay provide some color on that. But IBM is an enterprise. Everything we do here, Brian, is enterprise-wide. IBM is an enterprise-wide strategy. We're starting with IMS. Michael's businesses are participating next, and then we will look at the back office services and middle office that support banking. they will be participating in the IBM project.
Got it. That's helpful. And then just shifting gears to IMS, so it was noted that three-quarters of the sales events came from alternative investments, and you've been clearly a leader in the alt space for some time. So can you just walk us through what's differentiated about the alts platform and what's driving the demand for outsourcing in alts?
Yeah, happy to answer that. So I would say right now we have, with all of the activity that Ryan and Sean spoke about and help from Sanjay and Michael, we're having many, many enterprise-level, C-level conversations. And those conversations are really leading towards large alternative managers looking for transformations and trying to transform their back office. So we are in the middle of several large conversations with managers that are looking to move from insourcing to outsourcing. So we have a stronger pipeline than pretty much we've ever seen before, and we're seeing really, really good traction. And any of those large conversations could turn into massive relationships, just any single firm in and of themselves.
And then what I would add to that, Brian, is I would say when you look at what differentiates SEI relative to the competitive set, we have an unbelievable set of people from an operational perspective. Our ability to handle sophistication and complexity, we believe, is second to none. But to the point Sean made earlier, it's one thing to handle complexity and sophistication, but you have to do it at scale. It's got to be right every single time. These are the world's largest brands, and our delivery experience has been phenomenal, and we focus intently on that. And I'd say the last few years, our expansion of investments into technology has allowed us to expand some of those capability sets in terms of information delivery. I mentioned in my script around digitization of the NAVs onboarding. So we're always focused on what more could we be providing in the platform. And I would say, you know, another secular trend that's kind of working in our favor, and I think we see this across Michael's business, Phil's business, and Sanjay's, is firms want to do more with fewer. They do not want to continue to add more partners to their stable, but the criteria to be part of that, you know, that nucleus is really around the ability to continue to innovate, continue to deliver, but deliver at scale and try to stay ahead of the curve. we've also added two new solutions that are going to add meaningful revenue over the course of the next several years or so.
We talked about them both in Investor Day. One was Alternatives in Retirement, and the other one was Retail Alts. On the Alts in Retirement side, we signed up five household names over the course of the last quarter or so, and we expect similar progress in Q3. So we're making tremendous traction there. And on the Retail Alts side, we launched our transfer agency. The first client goes live on August the 3rd. So we're finally going to be in the retail all-interval evergreen fund space, which we've been just sort of on the fringes of before. So we expect both of those new solutions to differentiate us in the future. So we're looking forward to great things. Great point, Bill.
Operator
Our next question is from Crispin Love with Piper Sandler. Please proceed.
Great. Thank you. Appreciate taking my question. Just on revenue growth, it's accelerated that the past few quarters was up 15% year-on-year in this most recent quarter. When you look at the back half of the year and into 2027, how do you think about revenue growth? Are current levels in that low to mid-teens range sustainable, just given all the strong sales events you've had in recent quarters as they continue to flow through?
Yeah, thanks for the question. As you know, we don't give guidance, but we will talk about pipeline. Our pipelines, as Phil mentioned in IMS, Sanjay's saying the same thing. I think we're seeing momentum, as you heard in my script, in Michael Lane's business and asset management. So our pipelines are as strong as they've ever been. So, you know, when we look at pipelines, we think about second-half revenue. We're encouraged with what we're seeing.
Great. Thank you. And then just one follow-up on just your most – the answer that you just gave on kind of the retail alts and retirement channels. Can you just kind of dig into a little bit more kind of why you weren't in that area already? I think is it true that your first exposure into retail alts, semi-liquid products is, what did you say, coming live August 3rd? And is the opportunity there mostly going to be within clients you already have relationships with, some of the large results out there?
Yeah, that's a great question. I mean, Phil and I'll tag team this one. The honest answer, Crispin, goes back to kind of scale. And I mean this. We don't launch something unless we believe it is world class. So maybe we were a little bit late to the party, but we do things pretty deliberately and thoughtfully to ensure that when it goes live, it's going to meet the standards that our clients expect. and you know the brand that our clients are, we won't do anything unless we truly believe it is going to be best in class. So maybe it was 18 months late, but we wanted to make sure it was truly going to be market ready for the types of clients that we expect to see.
Phil, if you want to give a little bit of color to the second part. So the only thing I'll add is Alton retirement is a brand new category. So that category didn't even exist up until about six months ago, and we expect to see that hockey stick up over some period of time as the DOL issues new guidance to protect the alternative managers. So that's brand new. And we're one of two competitors in the space. So literally, we are practically cornering that market right now. On the retail alt side, we always did private BDCs and other types of products like that. But until we had a real bulletproof, like Ryan said, registered transfer agency, we weren't in a position to kind of do that and do that right. We are hoping to take away larger funds from competitors because no one likes their transfer agent. So right now, there are probably 20 or 30 large funds that are $10 or $15 or $20 billion that we're going to target. So we could sell tons of $100,000 funds, but we really want to go after the larger one. So I think we're in a good position to do that.
And then if you just, just to kind of switch gears a little bit, but stay in kind of the same lane, if you look at some of the things that Sean and I highlighted in this script about what's going on in some of Michael Lane's businesses, those things might be at earlier stages. But the same thought process, when we think about our product lineup with Michael and the team have done with ETFs, or the partnership with Carlisle, we're really thoughtful in terms of saying, okay, let's get these new solutions out the market, but let's make sure when they are launched, these are things that we believe the market really wants and believe that we're actually going to satisfy a different need. So we're really excited about some of the early indications that we highlighted in the script around that area.
Great. Thank you, and good to hear that the product's up there.
Operator
Our next question is from Alex Fond with KBW. Please proceed?
Hey, good afternoon, everyone, and thanks for taking the question. You called out the data cloud offering as a driver of some of the strong recent professional services sales. Can you maybe just expand upon why this or the recent enhancements there have been particularly value additive for clients? And then also looking at the investment in other businesses lines, looks like revenues were higher there again, quarter over quarter. Can you just expand upon what's driving the revenue expansion there? I'm thinking it's probably Sphere, but any other color there would be helpful as well. Thanks.
Sanjay, you want to take data cloud?
Operator
Yeah, sure. So if you look at data cloud, you should think about that capability as a foundation for any data modernization, information delivery modernization, data harmonization, across enterprise. That is the foundation for any AI initiative for the banking finance services industry. And that was the major reason why we jumped on creating that capability. And we are really good traction with both existing clients and any new client we are signing through our platforms. And now we're seeing that traction in IMS business as well. So this is, again, we are needing that as a part of an enterprise capability. And with data cloud solution, I want to think about for a banking client, the bank is not just a wealth finance and business. They also have core banking, commercial banking, insurance, other segments. We are providing capability to harmonize that entire data together and then provide information delivery and intelligence on top of that. So that's why that is resonating really well. And so it's not just SCI data cloud solution, but good professional services opportunity as well with both new clients as well as our existing client base.
And on the second half of your question, Alex, the investment in new business, you're spot on. It's Sphere. It's increased revenue in Sphere, which that's where it sits.
Okay, got it. Thank you. No, that's helpful. And then just to follow up on some of the earlier IMS questions, and particularly the 50-50 split there between sales coming from new clients and existing clients. And I think Phil touched on this a little bit, but just trying to determine how we should be thinking about the forward pipeline here in the sense of new logos versus expanding existing relationships.
Is that 50-50 split something you think is you know can continue or is that going to depend on quarter to quarter just trying to figure out how we should think about um you know how the the composition of the forward pipeline there i think 50 50 is probably a reasonable expectation i think the thing that is out of our control which is a good problem to have is the blast radius of some of the announcements we have made in the last couple of quarters are pretty wide so the inbound interest we have gotten in the last 90 to 100 days from other organizations. It's probably exceeding the norm. That's a good problem to have. But Phil, do you think 50-50 is probably fair moving forward?
It is now. I think a while ago, we were 60-40 more cross sales than new names. But with the amount of activity, we were having a lot more new names. And the interesting thing is, with the two large clients that we announced not that long ago, not much of that revenue has matriculated yet. So we expect to see a fair amount more of that come online in early 27. But we have some of the funds are going live now, and both of those projects are tracking really well.
Okay, great. Thank you, everyone.
Operator
Our next question is from Alex Cram with UBS. Please proceed.
Yes. Hey, everyone. Let's ask, maybe just quickly, I don't think you've talked about Stratus in much detail. You've had it for, I don't know, seven months or so now. So just maybe just provide a quick update on, you know, cross-sell initiatives or other things that you're seeing. I think you touched a little bit on M&A there as well. So, yeah, just give us a quick update, please.
Sure. So, Alex, good to hear from you. So EBITDA, as I mentioned in the script, we were about $9 million in EBITDA this quarter. There's another call a little north of $1 million of integration costs, So, I think for the quarter, a little over $10 million in EBITDA, times up by four run rate. We're about right on the mark from where we would expect to be through Q2. We were there as well coming out of Q1 if you kind of normalize some of the timing of the deals. So, we're right on point. The business is being run well. As you can imagine, seven quarters in, we're getting to know them much better. They're getting to know us. We're working really well with thinking about what our inorganic growth strategy are, what our organic growth strategies. Brian?
I was going to say, I mean, Michael, you and Jeff, we just had some of the largest Stratos advisors on the campus.
Yeah, the good news is with Stratos is we are, we literally, our pipeline is a record high for Stratos across both M&A opportunities as well as recruiting opportunities. So those are almost 50-50 split right now. and very significant pipelines. So we feel good about that. We closed the EVP deal. Those are on board now. Those are now W-2 advisors within the Stratos system. And we are implementing a series of other infrastructure capabilities. We launched a new CTO within the Stratos business that is helping with the integration of several of the different technology needs to onboard clients faster so we can scale that business even quicker and improve the customer experience as well as we are working together with them and we have launched with over 30 advisors an OCIO initiative to become a lead generation source for our OCIO business as well as that is a growth opportunity for those stratos.
Okay, good. And then maybe secondarily and hopefully this is not so nitpicky But, you know, there was recently, I think a few weeks ago, the Benchmark Capital sale from Schroeder's to, I guess, Soderbergh. I know you have a technology or a relationship there. Not sure what exactly you do there, but I know there's existing technology. So just wondering, I know sometimes these things can take a long time to play out, but maybe can you just dimensionalize what you do for them, how relevant that is, and how you feel about retaining kind of like your services there?
So Benchmark has been a longstanding SWP client, Alex, in the U.K. So Schroeder's continues to be a large client for SCI globally. And Sanjay and I have a meeting with the partners at Soderbergh in the next couple of weeks to expand more about what SCI's capabilities are and to get a better understanding of their long-term strategic objectives with Benchmark Capital.
Okay. I guess we'll stay tuned for an update. Thank you.
Operator
As a reminder, just star one on your telephone keypad if you would like to ask a question. Our next question is from Patrick O'Shaughnessy with Raymond James. Please proceed.
Hey, good evening. So you mentioned likely ramping up your share repurchase activity in the back half of the year, but you also spoke to a healthy M&A pipeline. How are you thinking about balancing the ramping up or repurchases versus keeping powder dry for M&A?
So, yeah, so we would expect probably second half of the year to be more in line with Q1. As far as keeping the powder dry, we've got a $600 million or so line of credit revolver that is essentially untouched. We have plenty of powder to support any of the M&A activity regarding Stratos. So no concerns there from a return of capital to shareholders, either through the dividend or through stock buyback.
Got it. Appreciate that. And then question about investment advisors and maybe just about the broader RA custody space or advisor custody space. Are you guys currently offering or contemplating offering the ability for advisors to utilize long, short, tax-efficient SMAs that Schwab and Fidelity are offering via their custodians?
And we, as a trust-based custody platform, cannot actually hold long-short strategies and offer long-short strategies on our platform. So we do not at this time, being that we're not a bank, have any plans to include those on the platform.
All right. Appreciate it. Thank you.
Operator
This concludes our question and answer session.
I would like to turn the floor back over to Ryan Hickey for closing comments. well thank you all for the discussion today we really appreciate it we're encouraged by the execution and progress we've seen so far this year I think the reminder we give ourselves as leaders in a management team is to stay humble during the highs have courage through the lows and maintain perspective and integrity throughout the whole process hope everybody has a great evening ladies and gentlemen this does conclude today's teleconference you may disconnect your lines at this time and thank you for your participation