Operator
Hello and welcome to the Sprouts Farmers' Market, First Quarter 2025 Earnings Conference Call. At this time, all participants are in a listen only mode. After the speaker presentation, there will be a question and answer session. Please be advised that today's conference is being recorded. It is now my pleasure to introduce Vice President, Investor Relations and Treasury, Susannah Livingston.
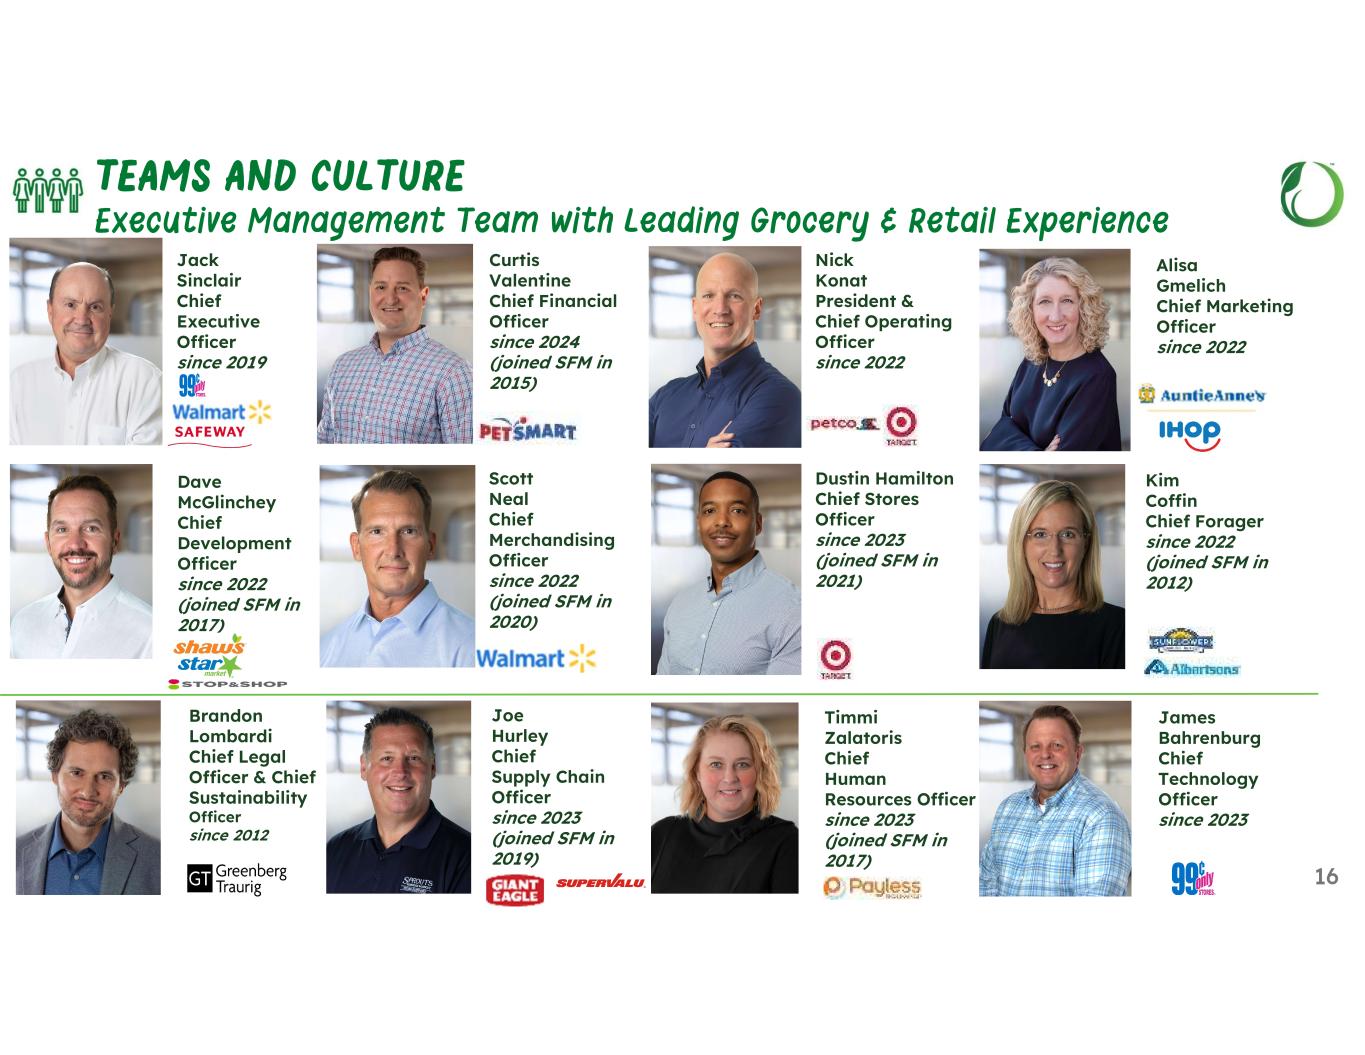
Thank you and good afternoon everyone. We are pleased you are joining Sprout on our first quarter 2025 earnings call. Jack Sinclair, Chief Executive Officer; Curtis Valentine, Chief Financial Officer; and Nick Konat, President and Chief Operating Officer, are with me today. The earnings release announcing our first quarter 2025 results, the webcast of this call, and financial slides can be accessed through the investor relations section of our website at investors.sprouts.com. During this call, management may make certain forward-looking statements, including statements regarding our expectations for 2025 and beyond. These statements involve several risks and uncertainties that could cause results to differ materially from those described in the forward-looking statements. For more information, please refer to the risk factors discussed in our SEC filings in the commentary on forward-looking statements at the end of our earnings release. Our remarks today include references to non-GAAP financial measures. Please see the tables in our earnings release to reconcile our non-GAAP financial measures to the comparable GAAP figures. With that, let me hand it over to Jack.
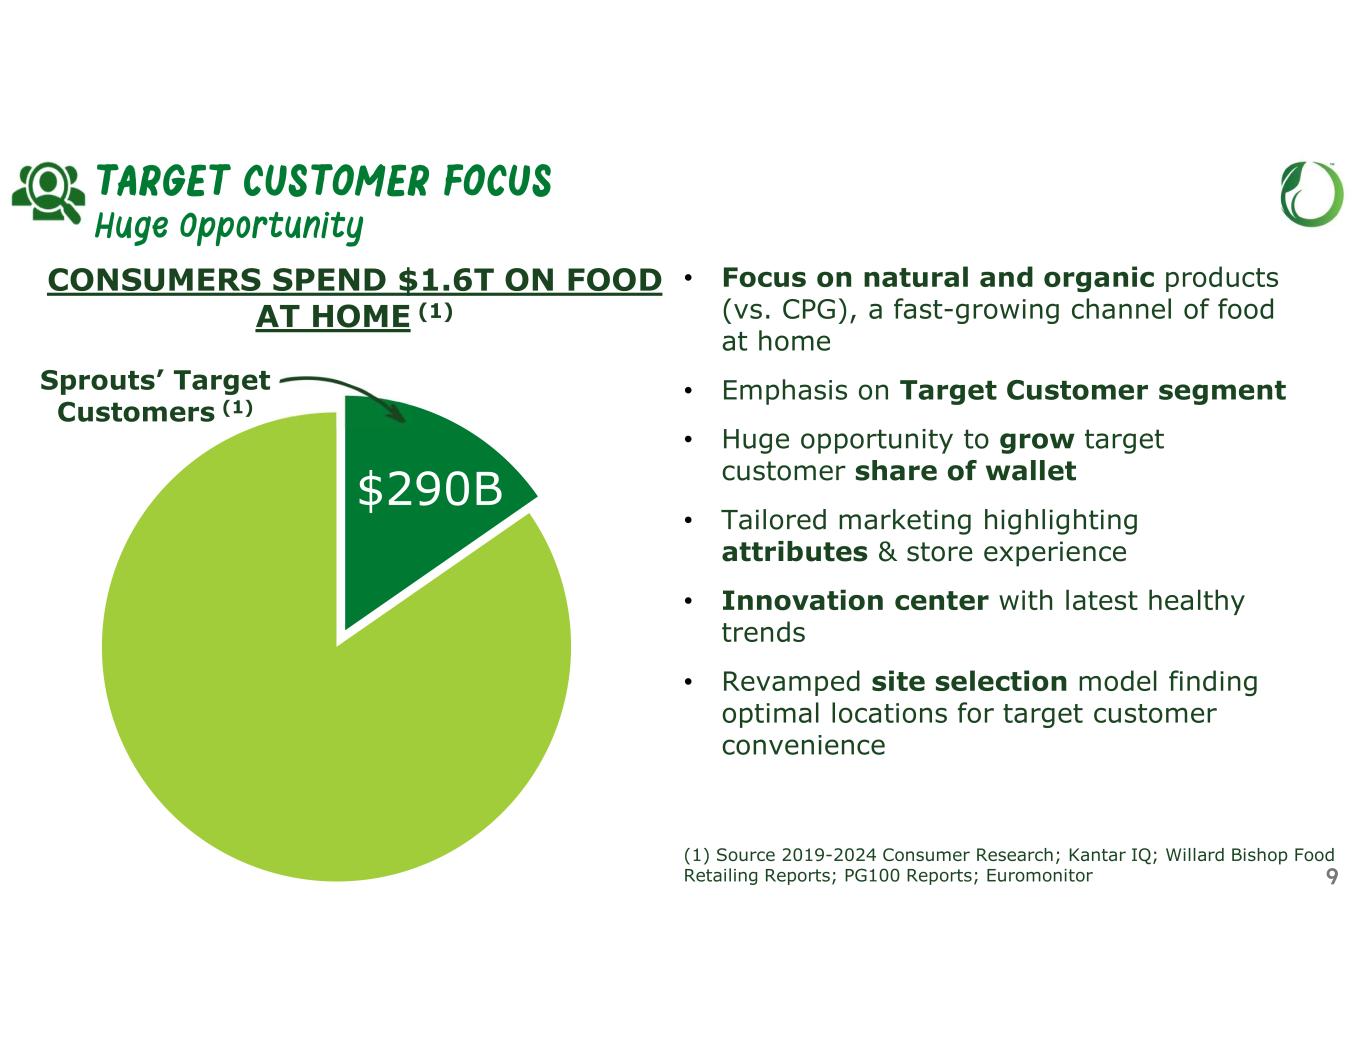
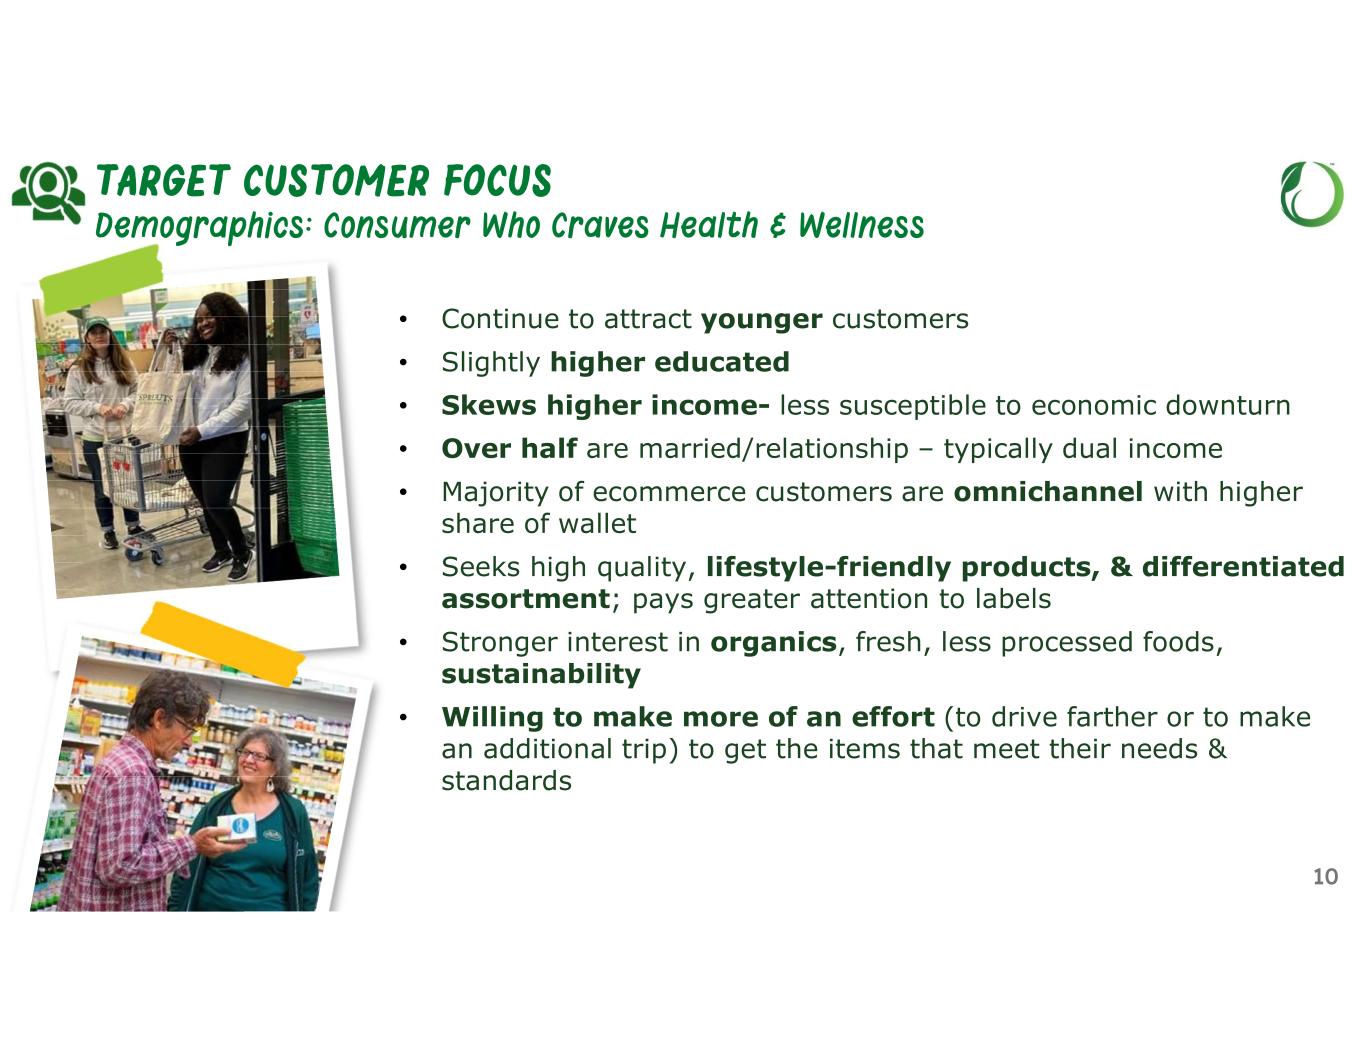
Thanks, Susannah, and good afternoon everyone. We're delighted with our strong first quarter results, marking a positive start to the year. Our sales increased 19%, supported by comparable store sales of 11.7%, and robust new store performance. Our diluted earnings per share reached $1.81, reflecting a 62% increase compared to the same period last year. These results highlight the effectiveness of our differentiated strategy and the excellent execution by our teams across the business. In the past 5 years, more consumers have embraced a movement towards health and wellness, leading to a significant growth in our target market opportunity, now estimated at approximately $290 billion of the $1.6 trillion spent on food at home. Our strategic commitment to our health enthusiast target customer is clearly resonating, driving both traffic and sales. Our specialty attribute-driven products are performing well, and our knowledgeable team members are ready to assist customers in making informed choices to achieve their health goals. Customer engagement remains central to our strategy, which is why we're excited to launch our new loyalty program this year. This initiative, combined with our continued store growth plans, will improve access to fresh, healthy products for our customers across the country. In the first quarter, we made a significant move to begin self-distributing fresh meat and seafood through our distribution centers. This step allows for greater control over our products, enhancing freshness and optimizing the capacity we've built in our supply chain over the past few years. We're just beginning to unlock our potential, and I look forward to sharing more about our journey in a few moments. For now, I'll hand it to Curtis to review our first quarter financial results, as well as our updated 2025 outlook.
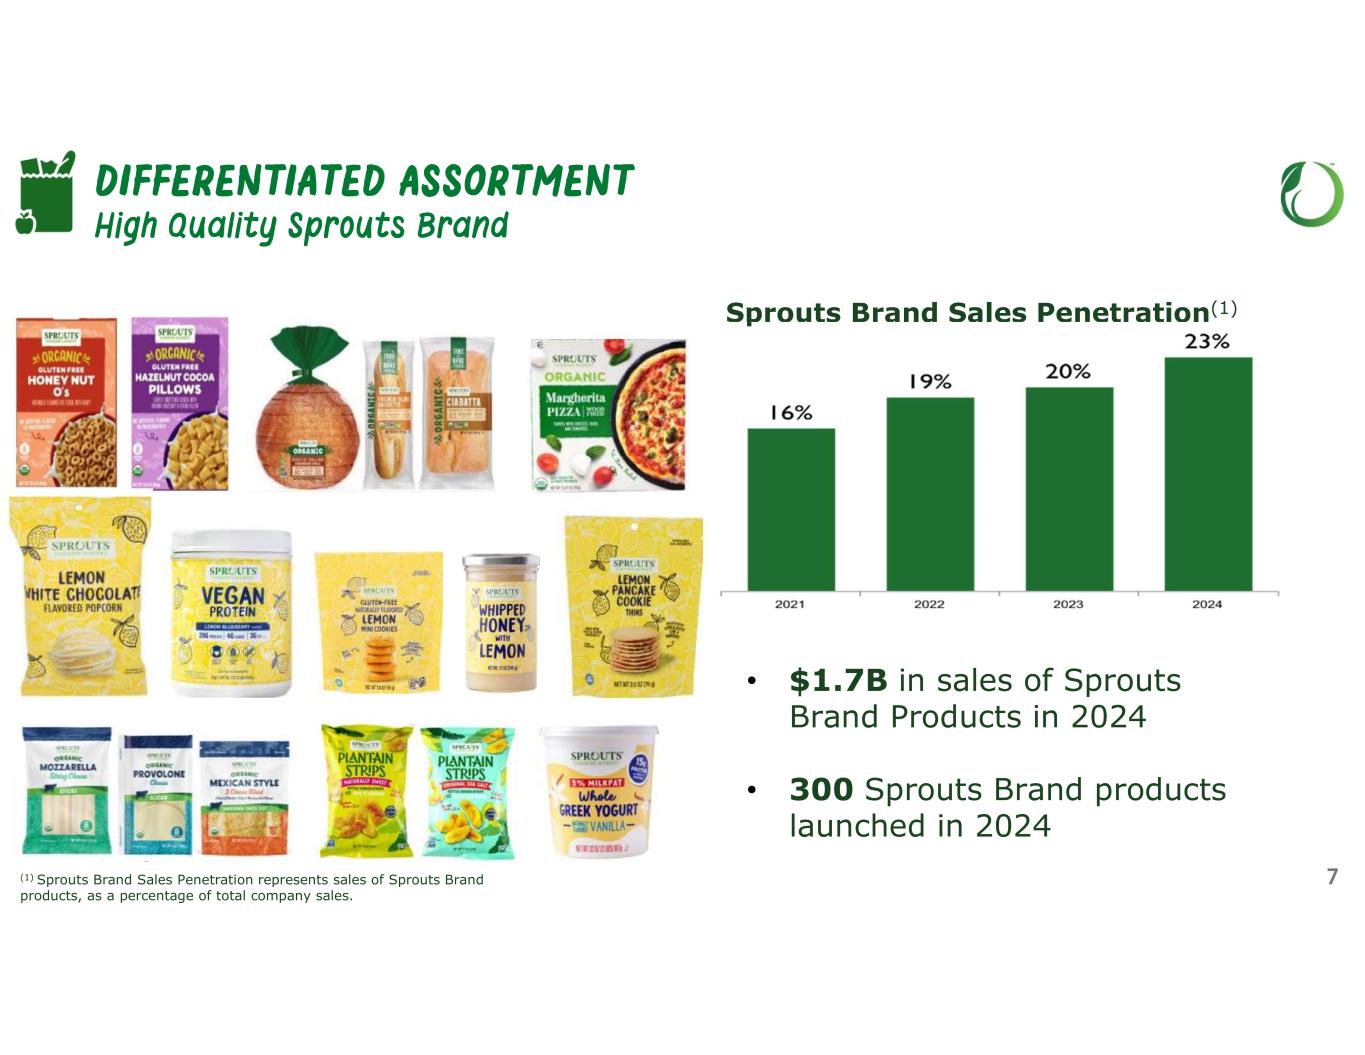
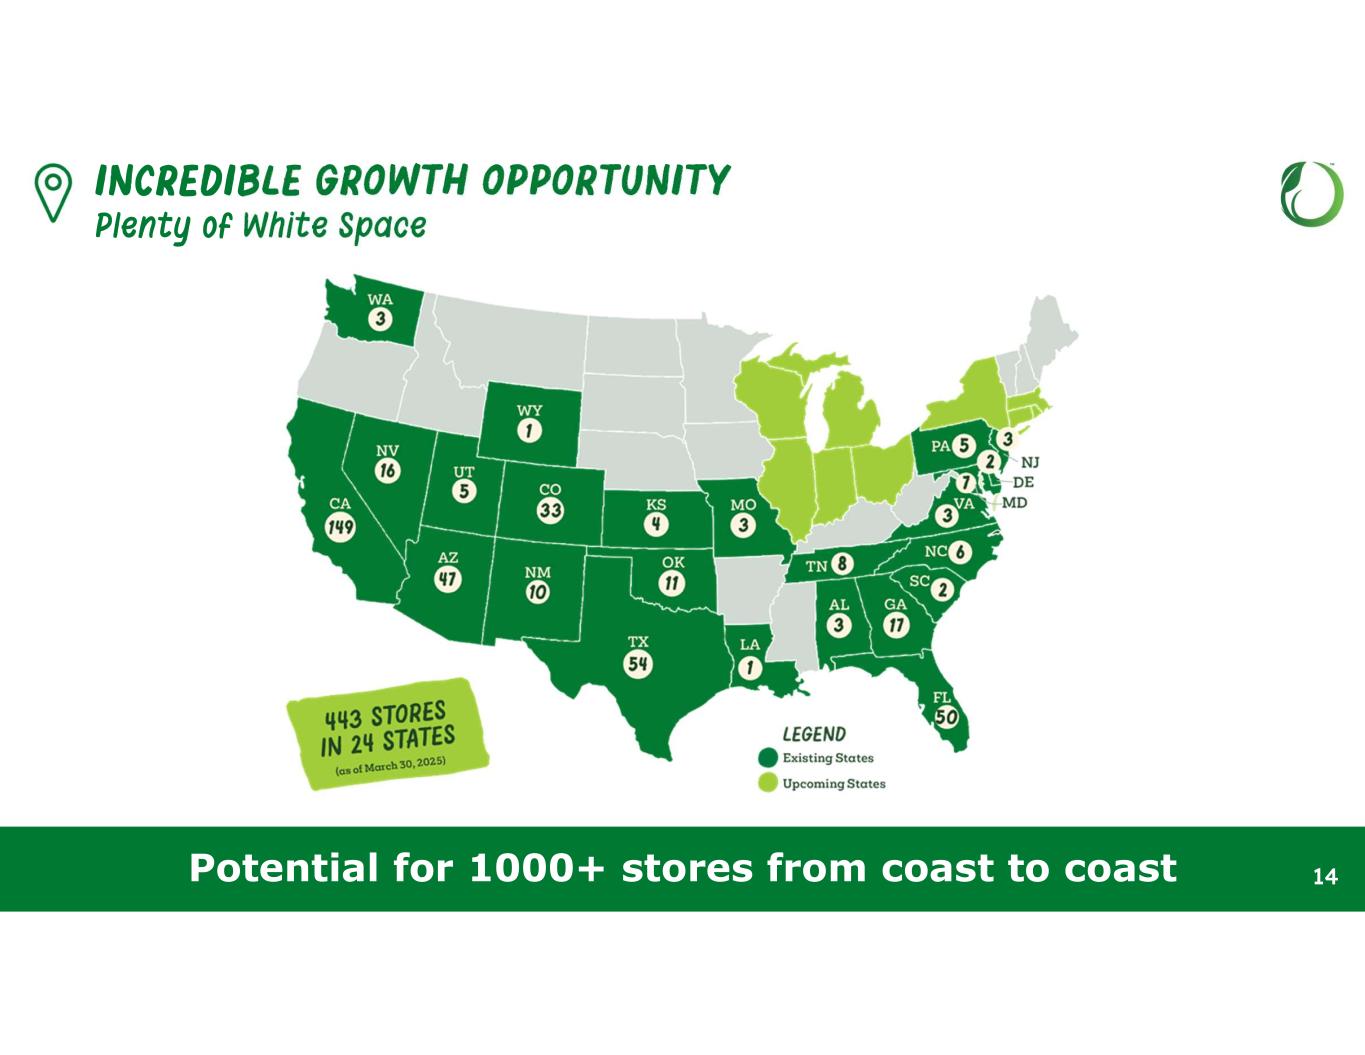
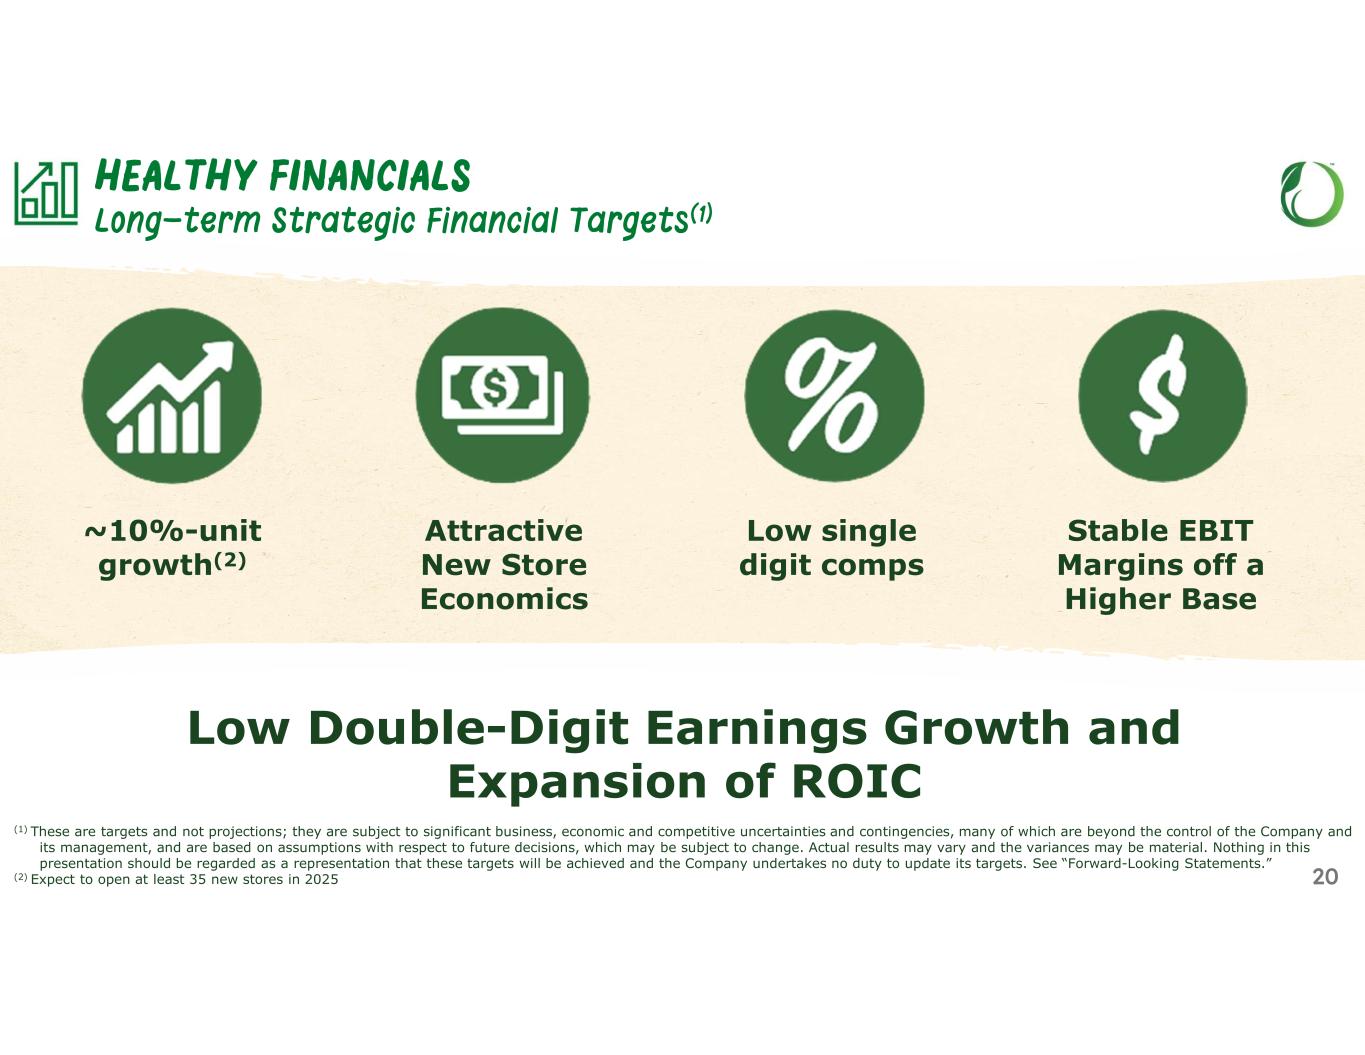
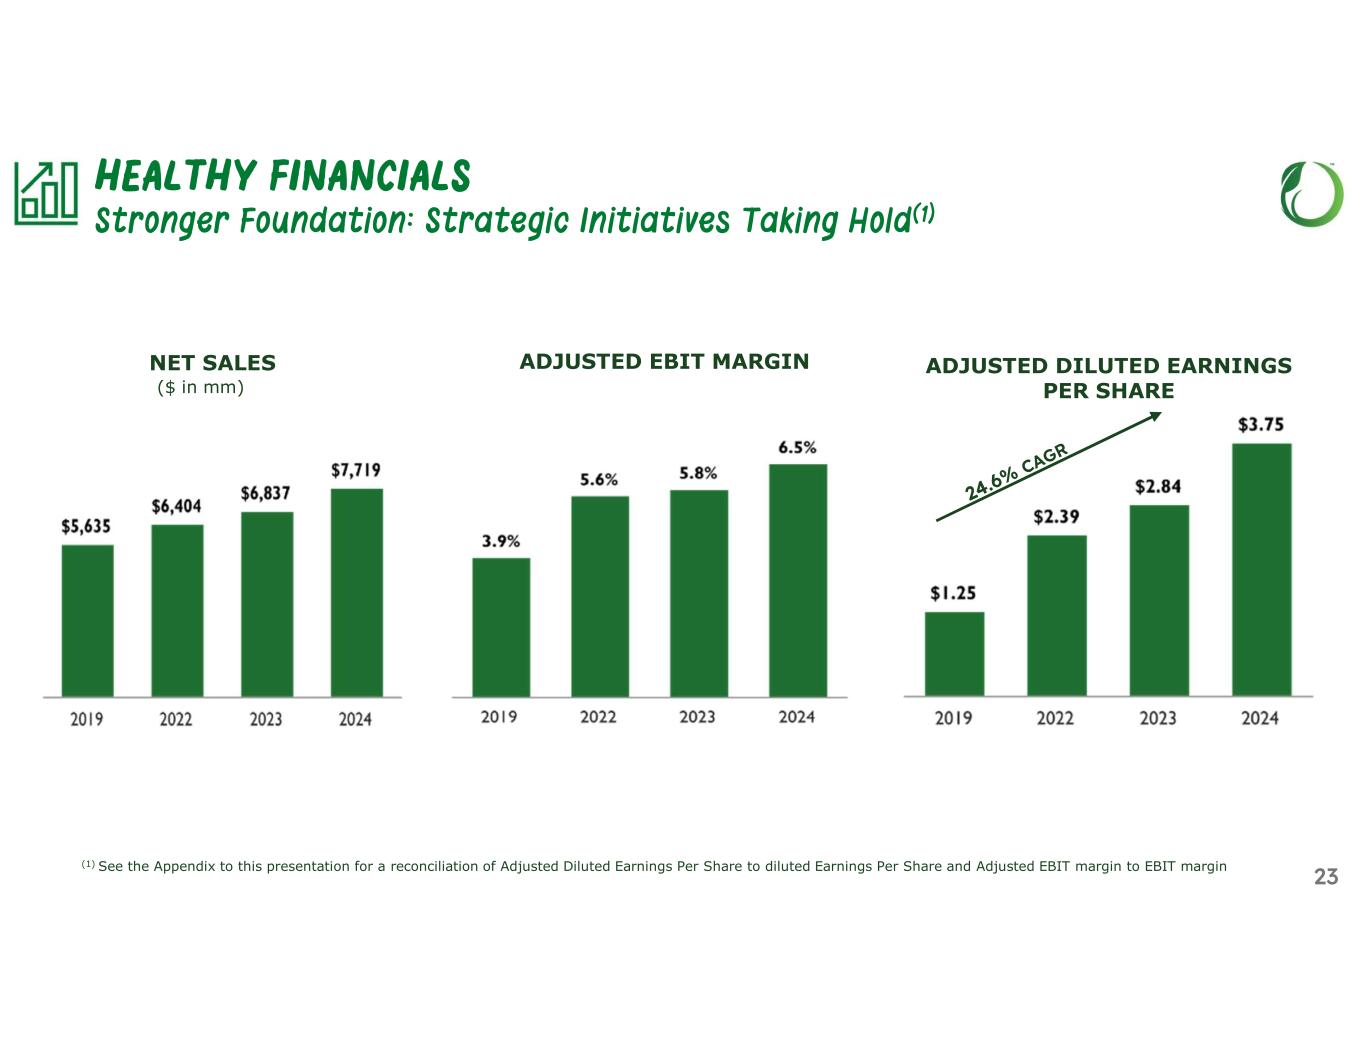
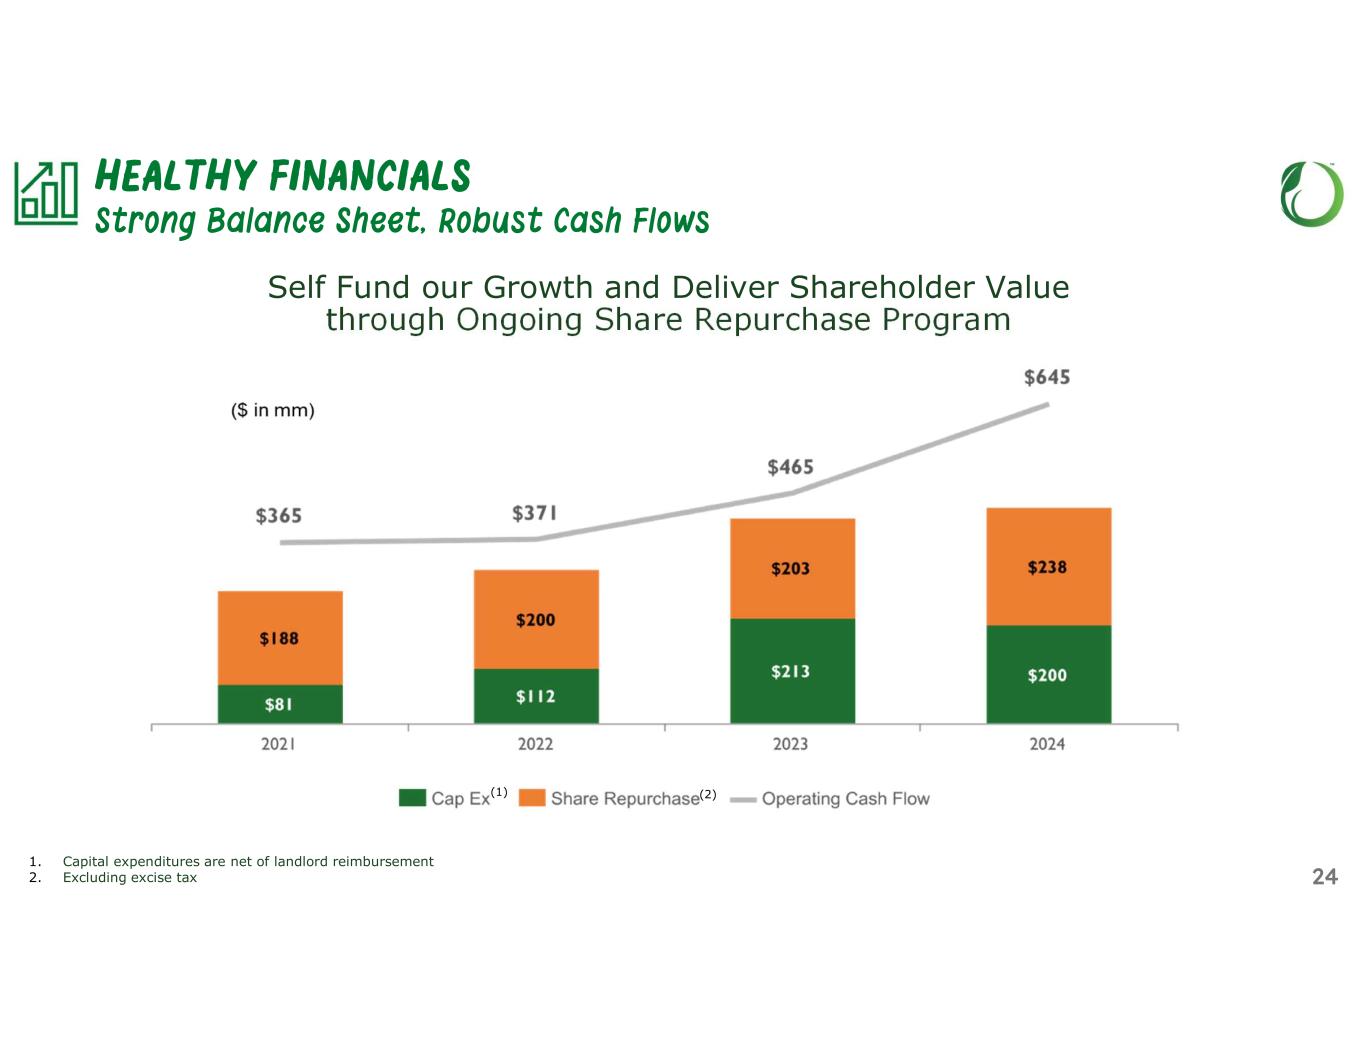
Thanks Jack and good afternoon everyone. In the first quarter, total sales were $2.2 billion, up $353 million, or 19% compared to the same period last year. This growth was driven by an 11.7% increase in comparable store sales and the strong results from new stores. The comp performance across categories, channels, and geography was once again balanced and broad-based, while also being supported by new stores entering into the comp base at a strong rate. Traffic grew, particularly in our brick-and-mortar locations. Our e-commerce sales grew approximately 28%, representing 15% of our total sales for the quarter, with strong performance from all partners. Additionally, Sprout's brand contributed 24% to our total sales for the quarter. A few notable events in the first quarter also boosted sales. Our stores in Colorado benefited from a strike at a conventional grocer, and our vitamin department saw increased sales due to the harsh cold and flu season this past winter. We estimate these events accounted for approximately 50 basis points of the comp sales growth. Our first quarter gross margin was 39.6%, an increase of 129 basis points compared to the same period last year. This increase was primarily due to leveraging our improvements in inventory management and category management. Supply constraints and strong sales continue to put pressure on our in-stocks, resulting in additional shrink leverage. SG&A for the quarter totaled $623 million, an increase of $83 million and 79 basis points of leverage compared to the same period last year. Our strong comp performance led to leverage mainly in labor and occupancy. Store closure and other costs totaled approximately $2 million for the quarter, primarily related to costs associated with exiting leases related to our 2023 store closures, as well as disaster recovery charges from the California wildfires. Depreciation and amortization, excluding depreciation included in the cost of sales, was $35 million. For the first quarter, our earnings before interest and taxes were $226 million. Interest income was approximately $1 million and our effective tax rate was 21%. Net income was $180 million and diluted earnings per share were $1.81, an increase of 62% compared to the same period last year. During the first quarter, we opened 3 new stores, ending the quarter with 443 stores across 24 states. A strong and healthy balance sheet has underpinned our financial performance. During the first quarter of 2025, we generated $299 million in operating cash flow, which allowed us to self-fund our investments of $49 million in capital expenditures, net of landlord reimbursement to grow our business. We have also returned $219 million to our shareholders by repurchasing 1.6 million shares. We have $232 million remaining under our current share repurchase authorization. We ended the quarter with $286 million in cash and cash equivalents, a zero balance on our $700 million revolver, and $22 million of outstanding letters of credit. More customers are prioritizing quality, healthy options, driving growth faster than the overall food-at-home market. This momentum fuels our ambition to enter new markets. As we look ahead towards the rest of 2025, we're committed to achieving strong earnings growth and seizing these opportunities. For 2025, we expect total sales growth to be 12% to 14% and comp sales in the range of 5.5% to 7.5%. We anticipate comp sales to start the year stronger and moderate as we cycle the higher comps from late 2024. We plan to open at least 35 new stores. Earnings before interest and taxes are expected to be between $640 million and $660 million, and earnings per share are expected to be between $4.94 and $5.10, assuming no additional share repurchases. That said, we do expect to continue to repurchase shares opportunistically. We also expect our corporate tax rate to be approximately 24%. During the year, we expect capital expenditures, net of landlord reimbursements, to be between $230 million and $250 million. For the second quarter of the year thus far, we have continued to see solid customer engagement and expect comp sales to be in the range of approximately 6.5% to 8.5%. And earnings per share between $1.19 and $1.23. Year-over-year margin rate in both gross margin and SG&A will start to normalize in the second quarter, and we anticipate continued EBIT margin expansion of approximately 60 basis points year-over-year. To add some perspective for the back half of 2025, we believe our strong financial position and execution of our strategic initiatives gives us flexibility to navigate uncertainties that may arise from the macro environment. We are effectively managing our expenses while continuing to look for investment opportunities that will drive long-term sustainable earnings growth. We believe that our momentum and execution will result in comps towards the high end of our low single-digit comp algorithm and continued expansion of our bottom line margin in the second half, even as we cycle the robust performance from the last year. And with that, I'll turn it back to Jack.
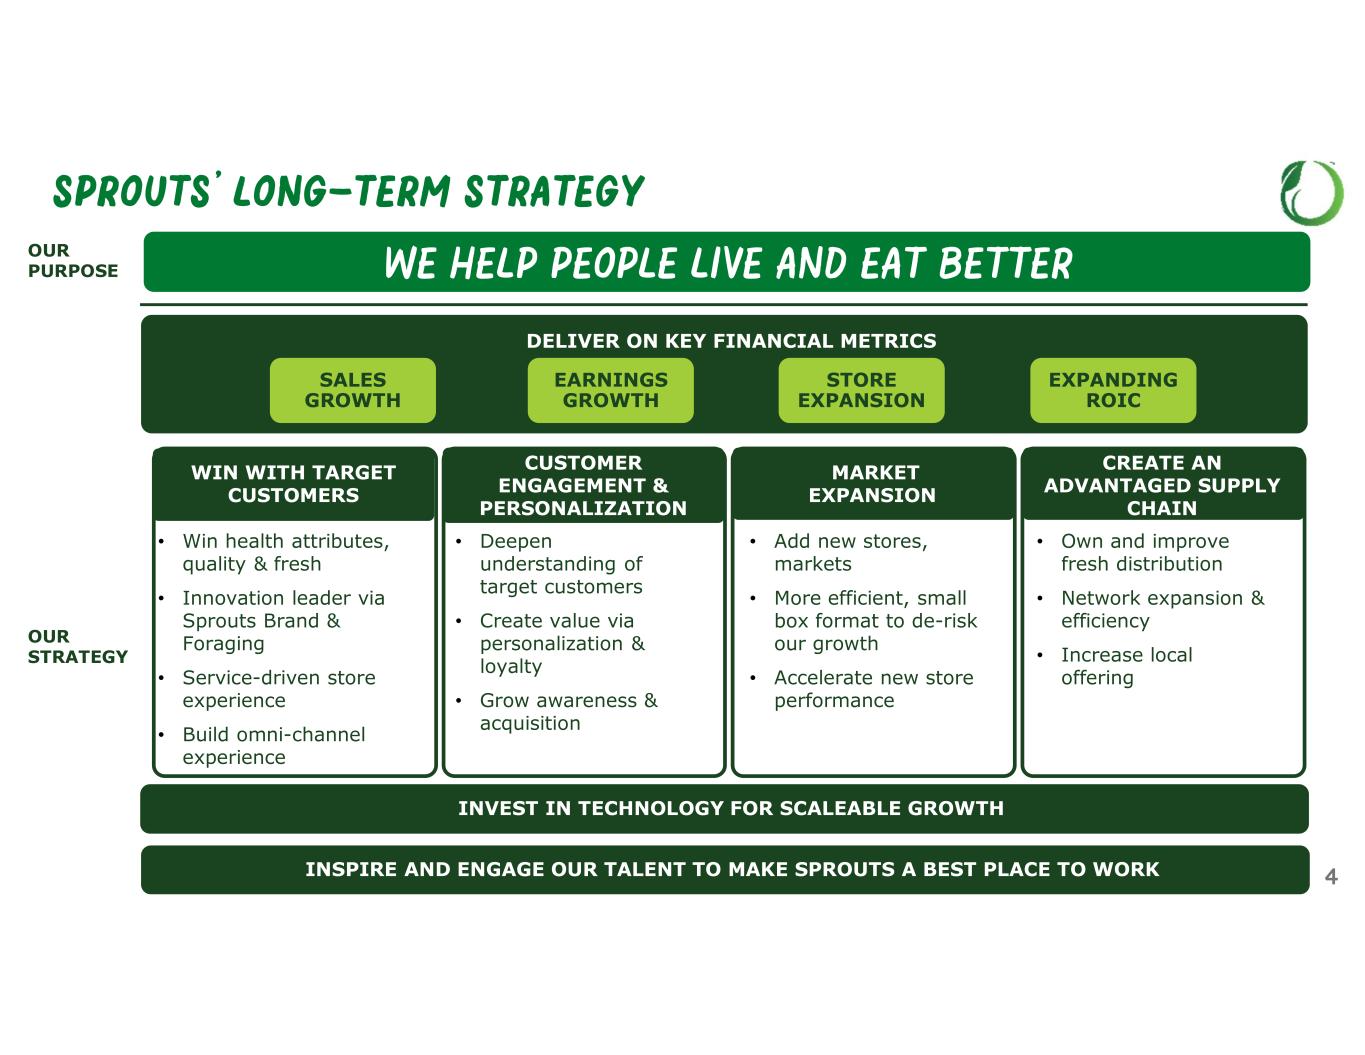
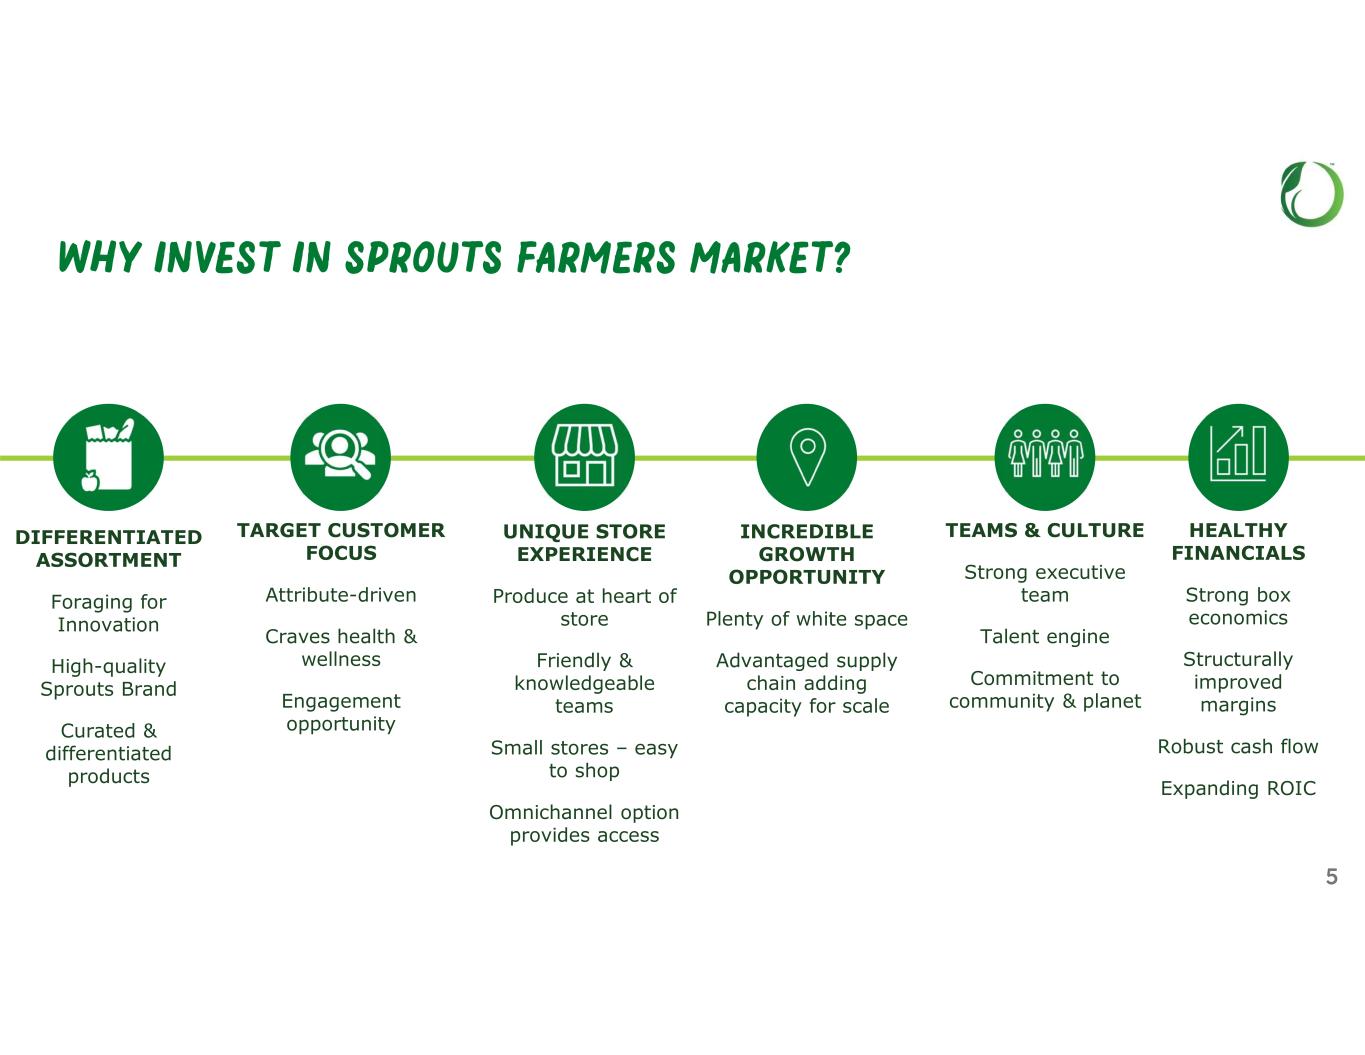
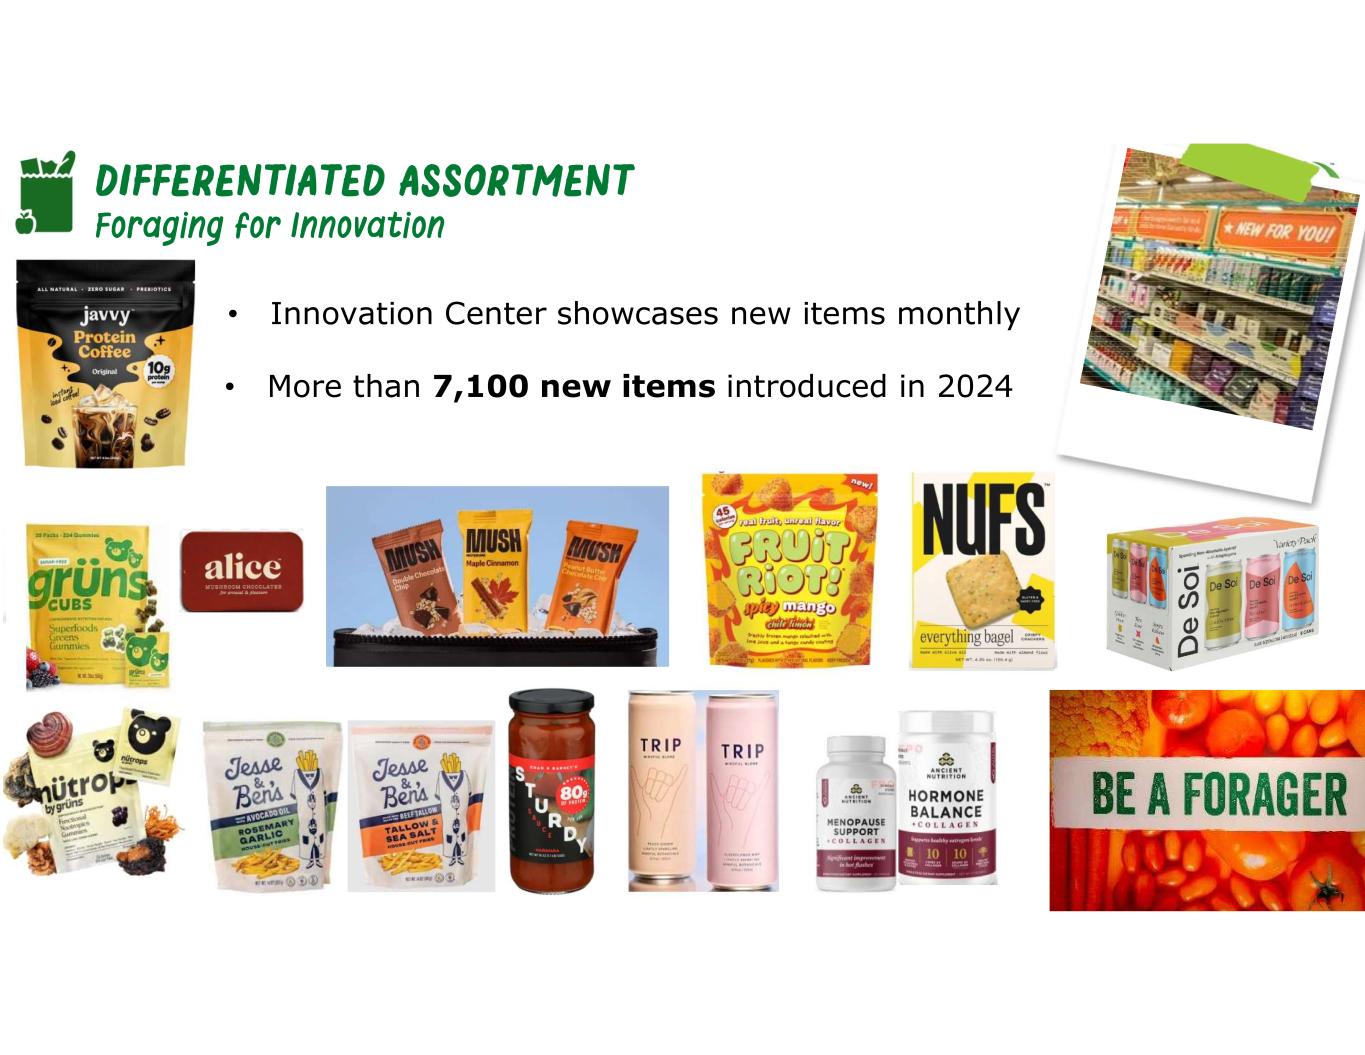
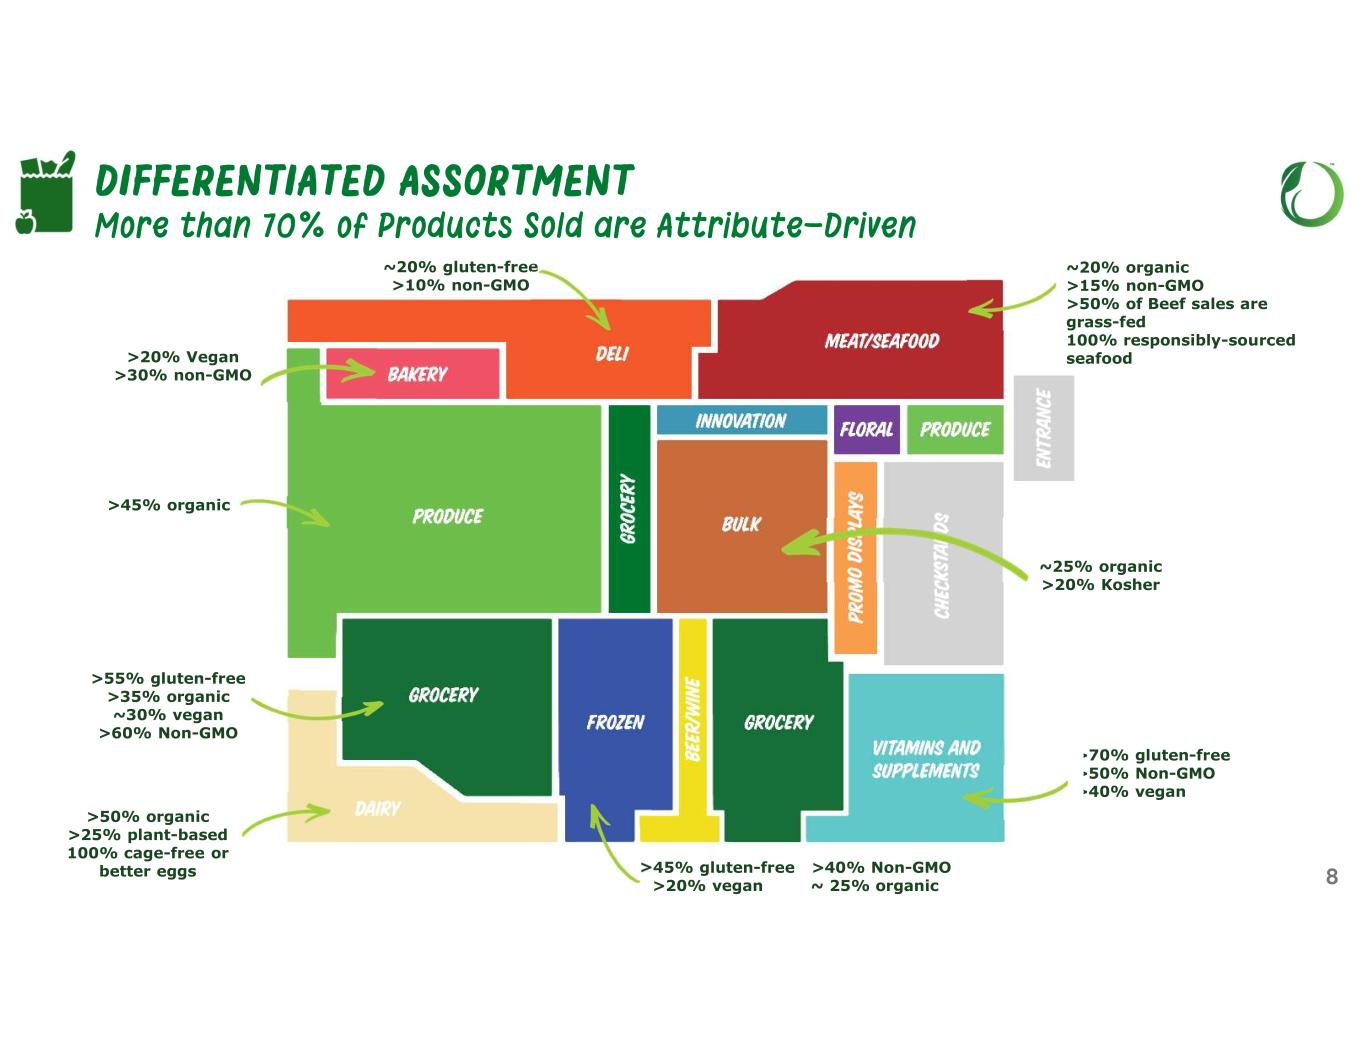
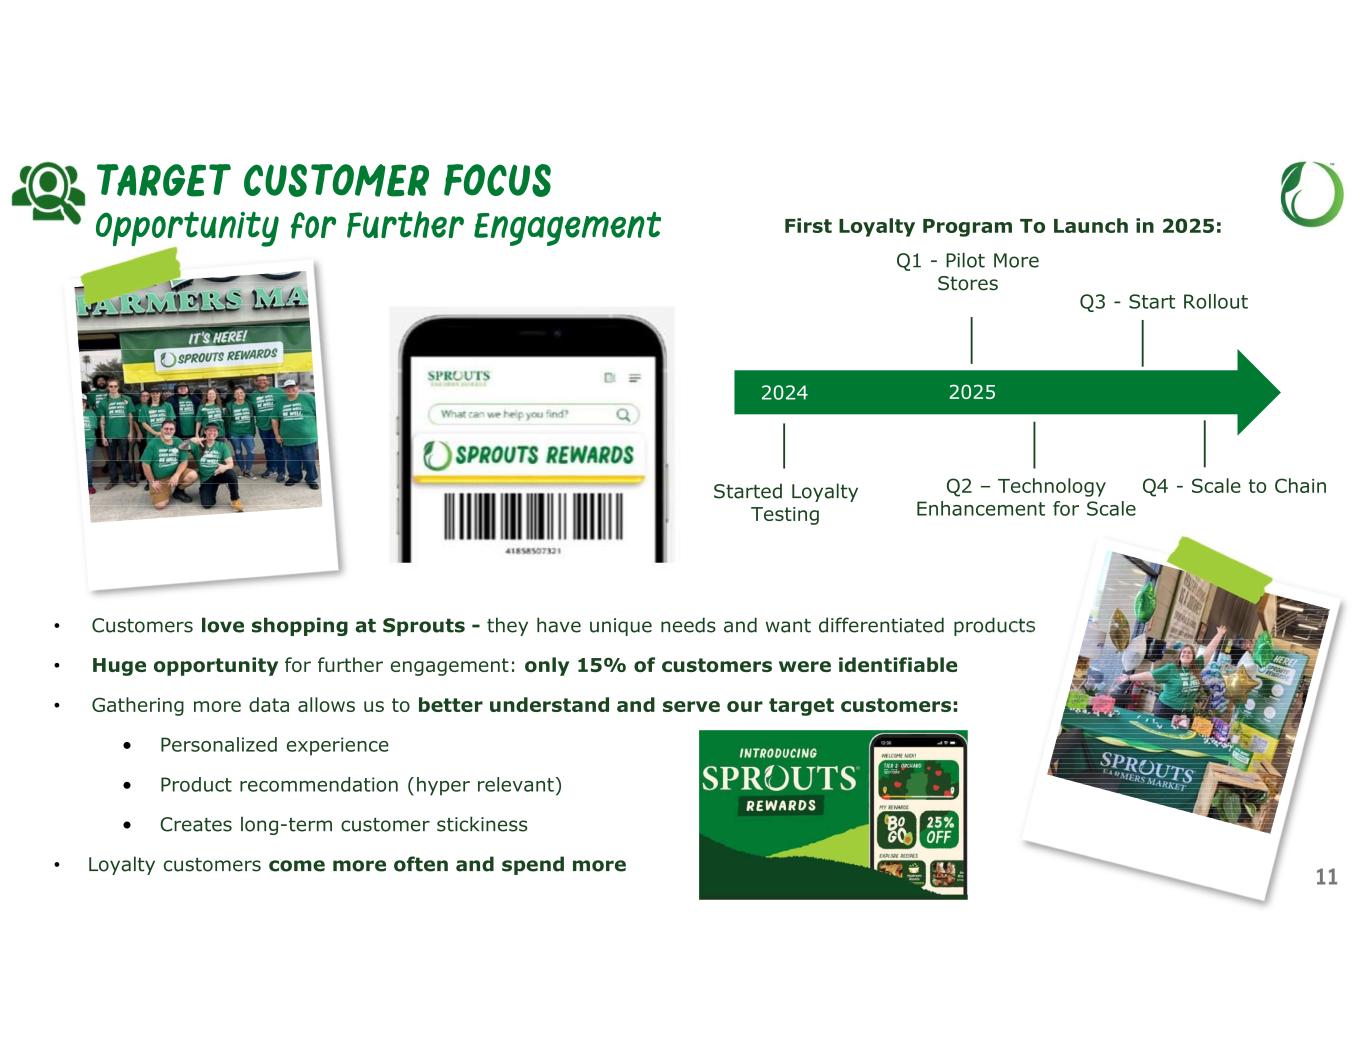
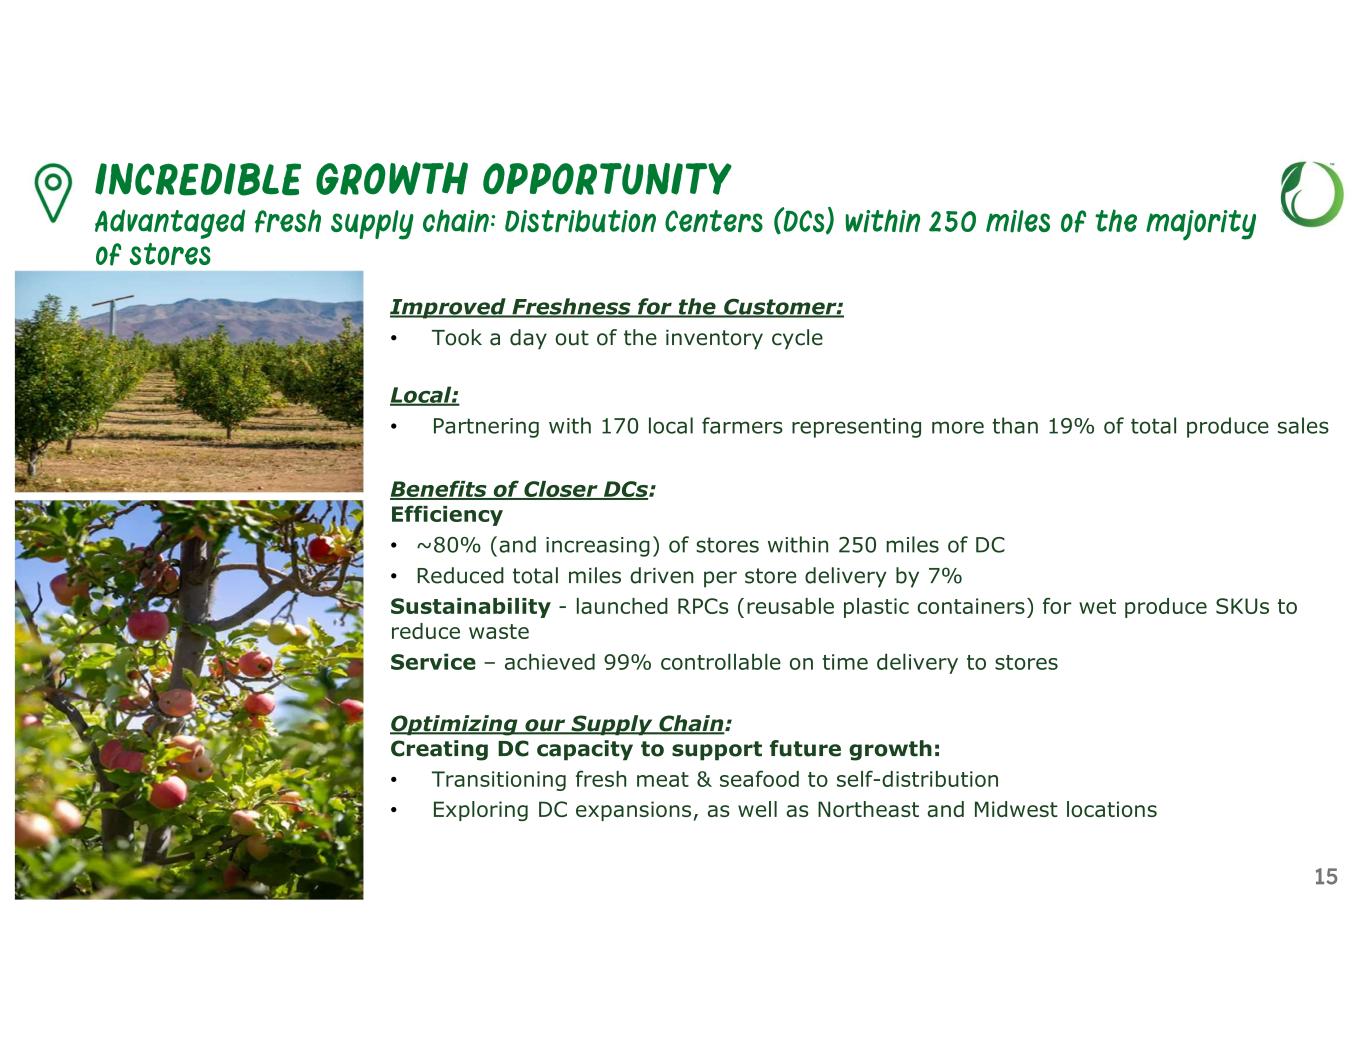
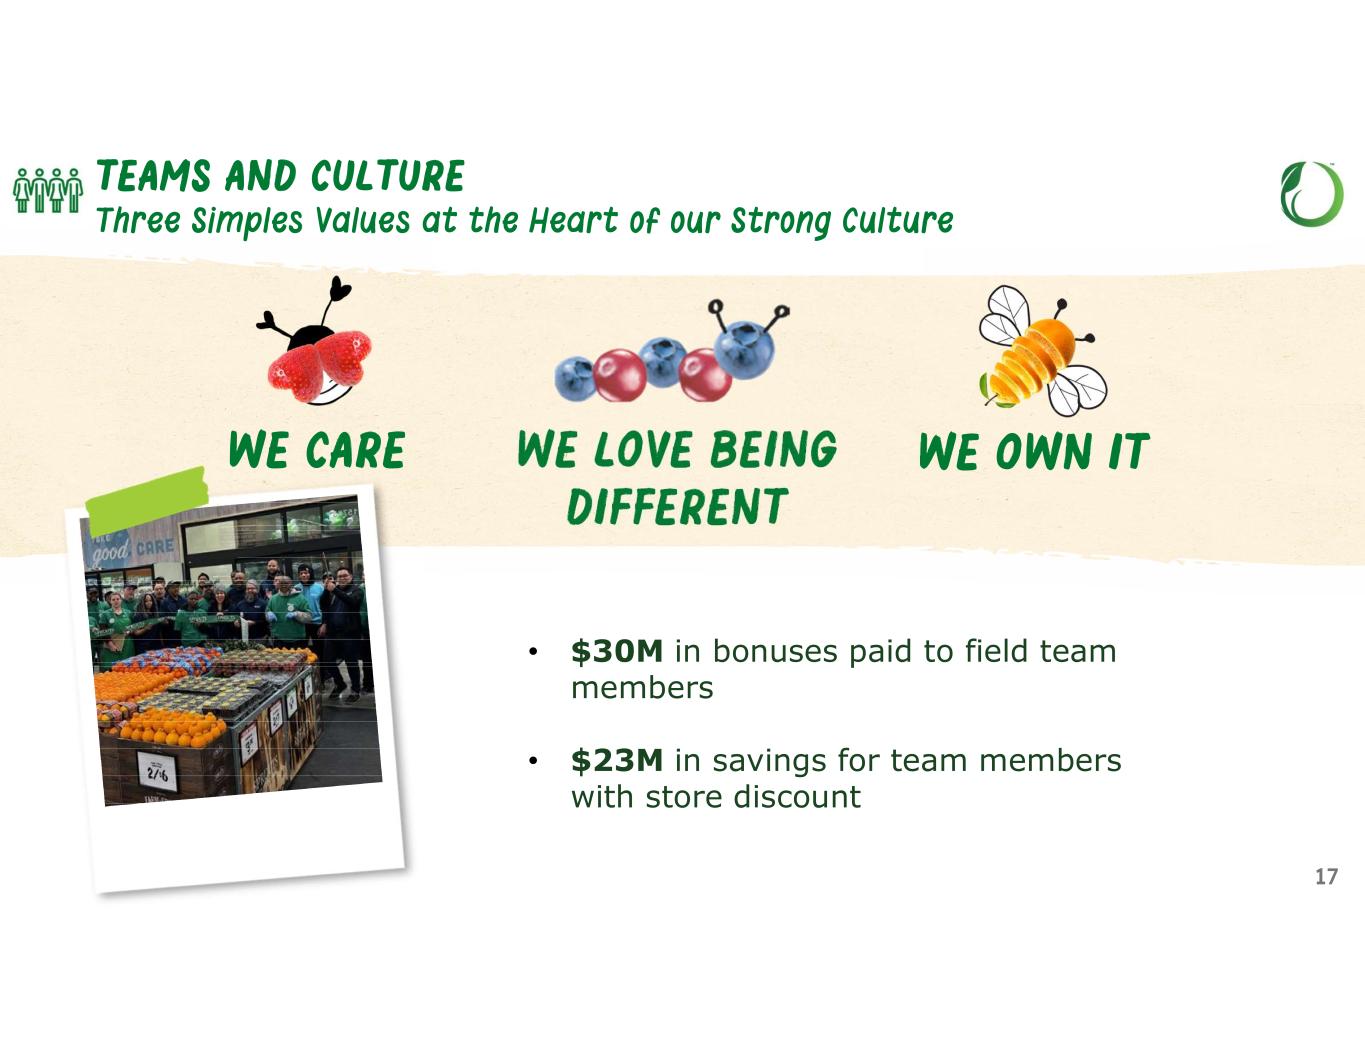
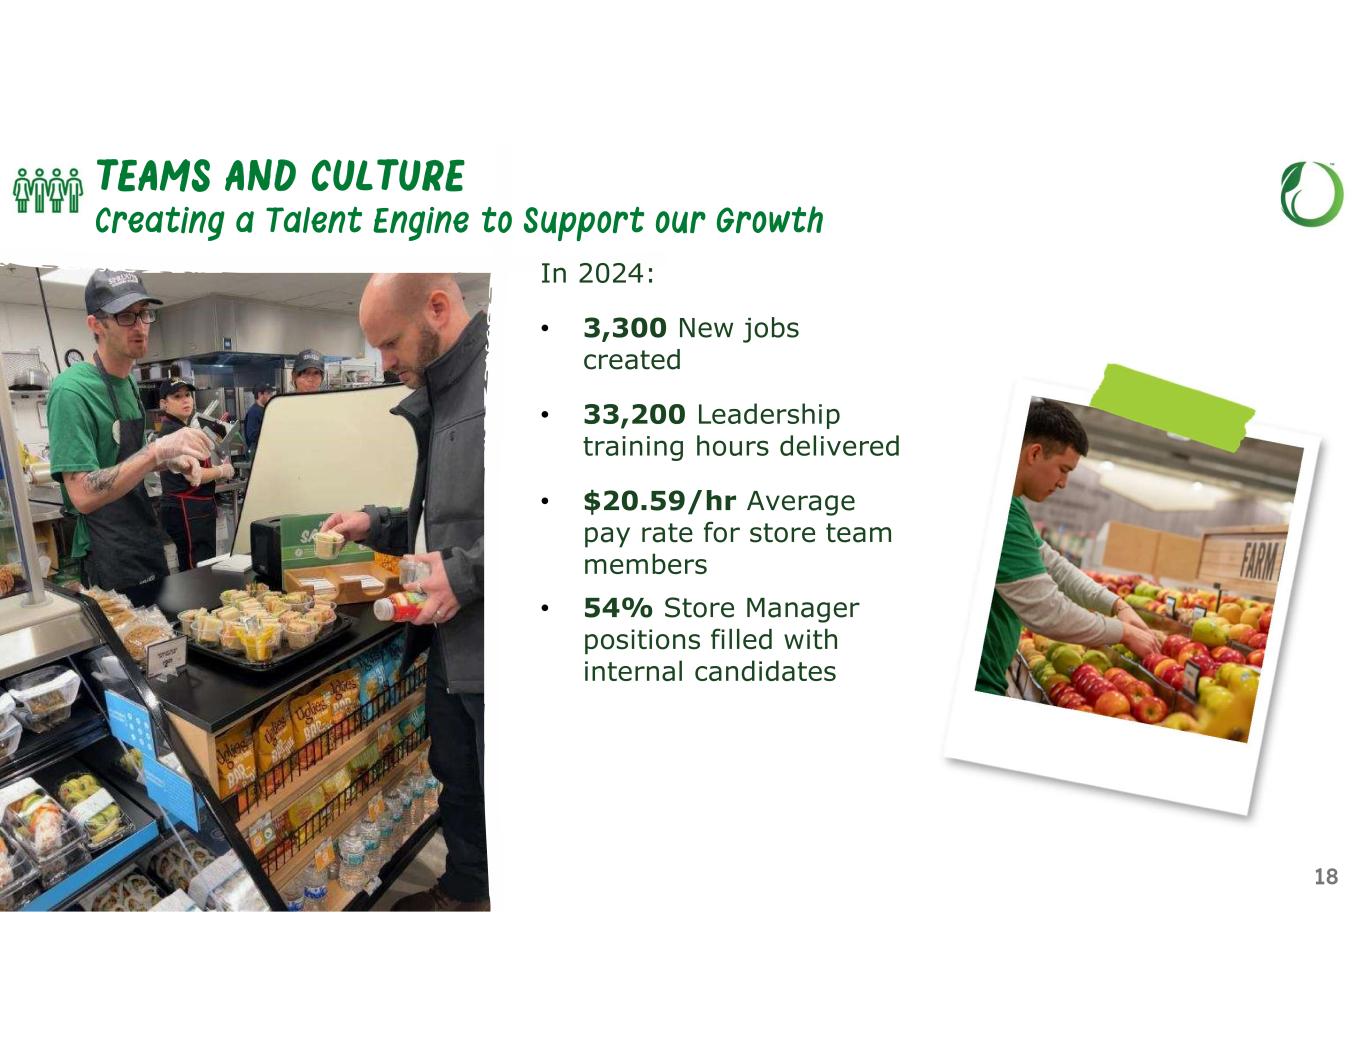
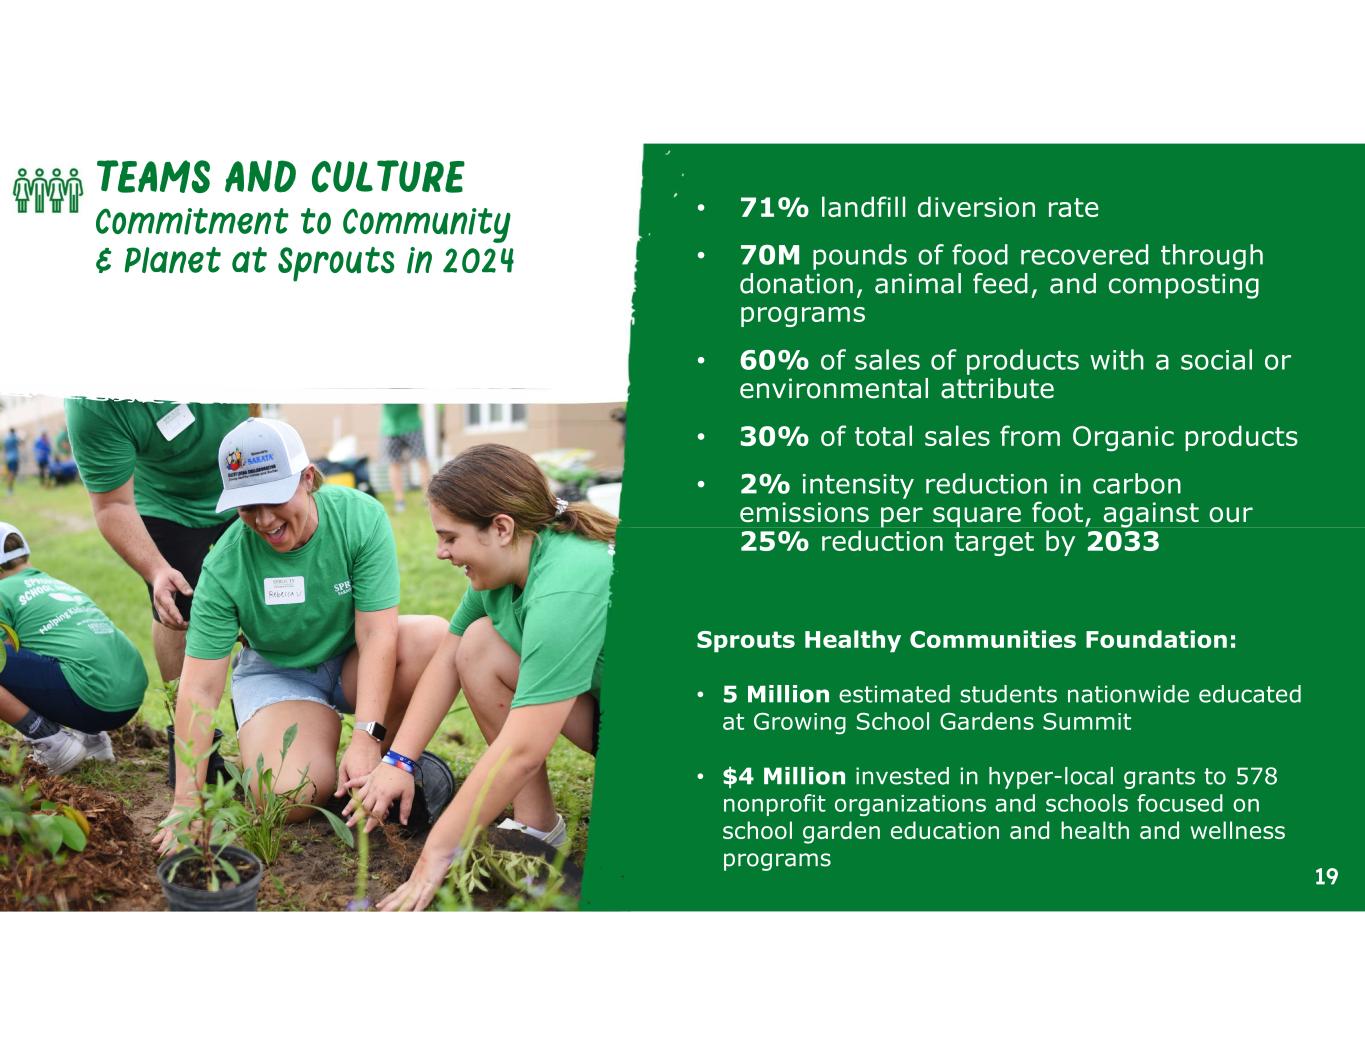
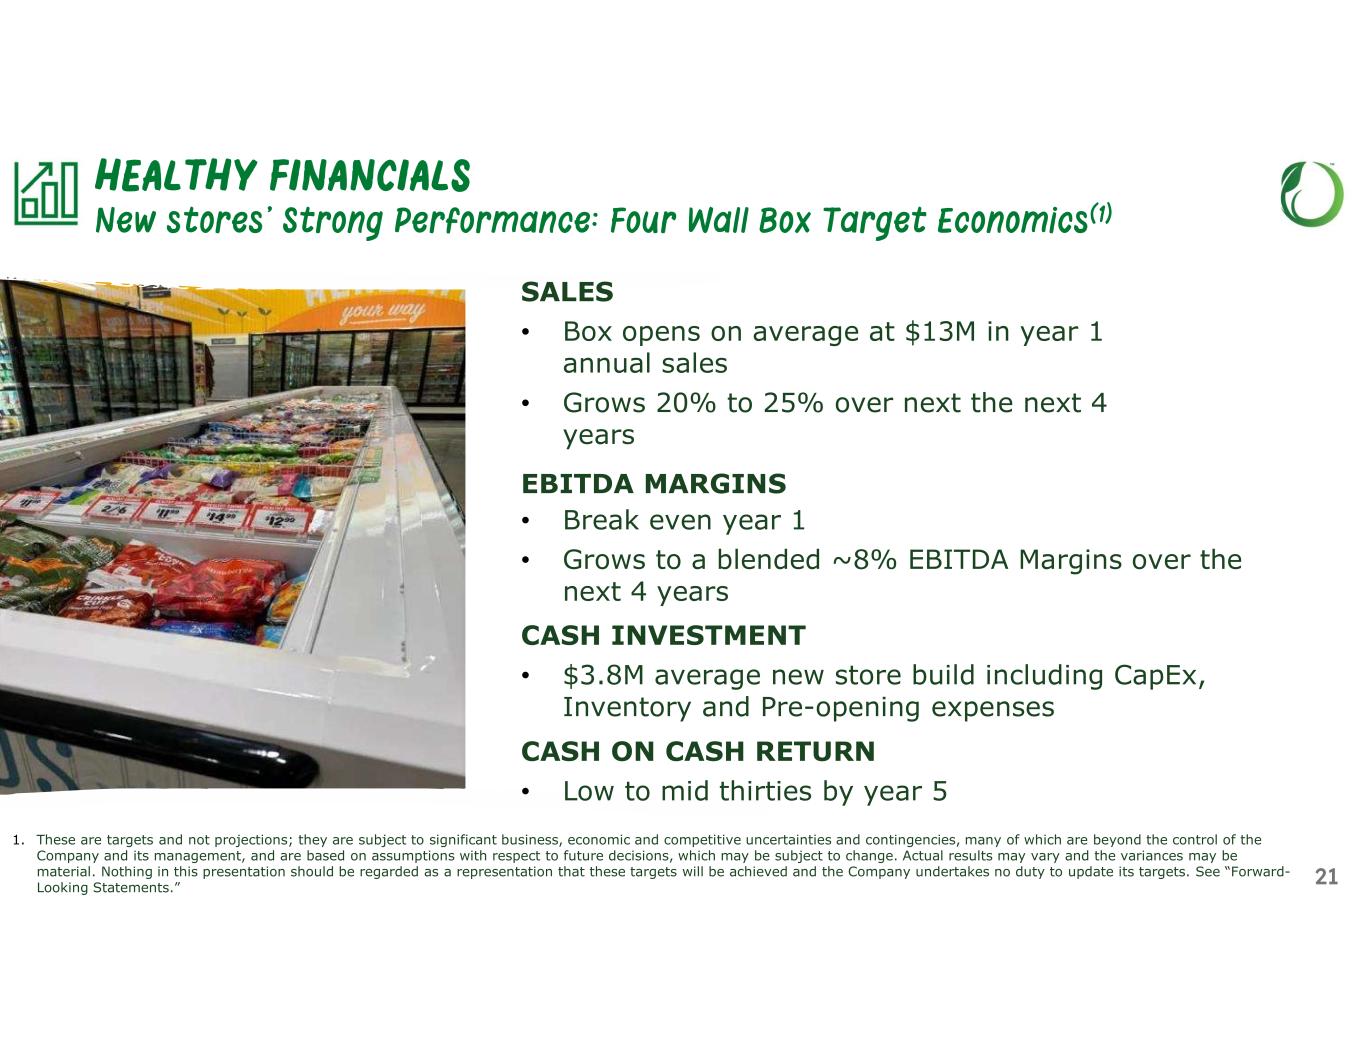
Thanks, Curtis. In 2025, we will build on the strong foundation we've established over the past few years as we invest and grow our business. In the midst of uncertainty, this year we will concentrate on continuing our successful initiatives, and we are confident that we are well positioned to compete in any environment. We're committed to enhancing our offerings, increasing customer engagement, optimizing our supply chain, and building stores that provide pleasant shopping experiences. Additionally, we're focused on developing a dedicated team that is committed to serving our valued customers now and into the future. We're focused on our greatest strength, our differentiation, as has been the case; attribute-driven products continue to lead our sales and are growing faster than the rest of our business. Trends such as high protein and heritage meats, grass-fed options, and products free from seed oils are driving our success with our target customers. The foraging team, in collaboration with our merchants, has developed a robust innovation pipeline for both our Sprouts brand and branded products. Our ability to quickly launch and build brands has attracted entrepreneurial vendors from across the country, who are eager to partner with us and offer their products in our stores. Additionally, we showcased our differentiation and created assortment through unique events such as the lemon event we hosted in the first quarter, as well as Discovery Days that highlight the attributes of our Sprouts brand products. In the first quarter, our marketing efforts collectively drove traffic, highlighting our unique value proposition through our storytelling and media strategy. We launched our new brand campaign in January, sharing that Sprouts feeling and distinguishing ourselves from the typical resolution messages. At the same time, we continue to leverage our market-based media investment strategy. Social media remains a strong channel for us with both reach and engagement increasing. Additionally, our e-commerce business and partnerships continue to grow, allowing us to support our omnichannel customers on their preferred shopping platforms with Sprouts. We're also enhancing the in-store customer experience by offering more sampling opportunities, improving in-stocks, continuing to improve customer service, and enhancing freshness. Our personalization and loyalty journey continued in the first quarter. Following our expansion to 35 stores in December, we continue to see positive results and strong customer engagement, including increased scans and sign-ups. We're continuing to be more data-driven as we analyze new customer information during our test-and-learn phase. In the second quarter, we plan to enhance the customer experience and prepare for our planned launch in the third quarter. We're increasingly confident that loyalty customers engage more frequently, grow faster, and spend more. Over the past few years, we've implemented new systems, expanded existing space, and built new facilities to prepare our supply chain for greater self-distribution in various categories. This proactive approach has unlocked exciting opportunities as we scale Sprouts for growth. Our systems and process work has already improved our in-stock strength, and our produce distribution, increasing freshness for our customers. Additionally, we're taking control of our own destiny by laying the groundwork to self-distribute our meat and seafood alongside our produce. While every transition presents challenges, particularly with a fresh category, our dedicated team is rising to the occasion and making progress. We're on track to begin in-sourcing from our first Sprouts DC in the third quarter. Additionally, we have begun the process to expand our Northern California DC capacity in 2026, which will complete the initial meat and seafood in-sourcing journey, as well as supporting future growth in that region. We plan to open at least 35 stores for the year and continue to expand our strong pipeline, with nearly 120 stores approved and more than 85 leases signed. While the openings in 2025 will enhance store density in our existing footprint, we're also looking towards expansion in new regions as we develop market plans for the Midwest and the Northeast. Our new stores continue to perform exceptionally well and are experiencing strong comps as they enter into the base. We're seeing the success from sea to shining sea, which gives us confidence that our offering will resonate with our target customer in any market. None of this would be possible without our amazing team. We're committed to our purpose and our values, and our annual team member survey reflects our progress, showing improvements in every metric. When our values align with those of our customers, community, and team members, great things happen. We recently published our 2024 impact report, which highlights areas that matter to all these stakeholders, such as our partnership with 400 local food banks, to which we donated almost 30 million fresh meals. Our efforts to reduce plastic have resulted in about 75% of our customers bringing their own reusable bags at the checkout. And the support of our Healthy Communities Foundation provided 500 local nonprofit partners and schools in our communities, brought to us by our team members and our customers in the local stores. We remain focused on scaling our workforce for our future growth. We continue to recruit, develop, and engage Sprout's team members. We've invested in developing our team members through several leadership programs, including the assistant store manager university program, our fast track for internal assistant store managers, in addition to our leadership programs for new hire seasoned assistant managers and store managers. These programs support our retention efforts while filling our leadership pipeline to support our future growth. In summary, we are excited about the future of Sprouts and the growth opportunities ahead as we continue to execute our strategic initiatives. Our strong business momentum places us in a position of strength, enabling us to navigate an uncertain macro environment while investing and unlocking Sprout's full potential. Over the past 5 years, our clear strategy has proven successful, and we are committed to staying on that path. As our target market expands and the demand for healthier options increases, we are witnessing growth that outpaces the overall food-at-home market. This momentum reinforces our commitment to prioritizing our customer needs and helping people live and eat better across the country. We look forward to sharing our journey with you throughout the year. And with that, I'd like to turn it over for questions.
Operator
Thank you. Our first question comes from Leah Jordan with Goldman Sachs.
Speaker 4
Thank you. Good afternoon. So you guys had really nice gross margin expansion this quarter. So as you look at the decelerating trend in your comp outlook, even on a 2-year basis, plus some uncertainty in the macro backdrop, how are you thinking through potential reinvestment at this point? It sounded like Curtis, you said that you were looking for some investment this year, maybe more color on what you were referring to there, or just how are you thinking about the trade-offs between balancing top line and bottom line growth at this point?
Hi, Leah, good afternoon. Yeah, we are investing in the business similar to a level that we invested in last year, but it's into things like loyalty, the supply chain systems, IT, self-distribution. It's still those same pieces—our talent engine getting ready for growth. So, it's those areas and if we can find ways to accelerate that, we'll look for ways to do that for the long-term sustainable earnings growth. As we look ahead on the growth side, I think we'll start to see that moderate as the year progresses. Had some one-timers in there in Q1 that’ll start to normalize, but we see continued expansion here in the second quarter, and again it'll just start to moderate as we get through the rest of the year.
Speaker 4
Very helpful, thank you. And then just Jack, you called out the ongoing consumer shift to health and wellness. It's something we see too, but just given continued outsized growth for the category, do you think this broader trend is becoming too hard for maybe other retailers to ignore at this point? Are you seeing any shift from your competitors, or how confident are you that you can retain your differentiated position?
Well, we're very focused on sticking to our own agenda, Leah, and making sure that what we do is maximize the offer for those health enthusiast customers that we've been so focused on over the last few years, and we'll continue to do that. As we look at other people, other people are clearly bringing some products in across this marketplace, but it doesn't bring them any access to the market that we've chosen not to approach, and as we've watched this market, it's gone from $200 billion to $290 billion as we've referenced, the total available market in this space. We're still only 8 billion of that, so there's plenty of room for us to grow. And the reality is, there's $1.3 trillion roughly that we're not focusing on that the other guys will always be focusing on more than us. We're doubling down on what we can do in terms of the attributes that are working with this health enthusiast customer—organic, gluten-free, vegan, vegetarian, dairy-free—those kinds of drivers. These drivers are the ones that we can't be very good at, and the team is continuing to double down. But we'll be as good as we are at this, and the team is focused very much on it. And I think from a competitive point of view, we're in a good place.
Speaker 4
Great, thank you.
Operator
Thank you. And our next question comes from the line of Rupesh Parikh with Oppenheimer.
Speaker 5
Good afternoon and thanks for taking my question. I guess the first one, just on new stores, so it's at least in my mind, new store productivity seems again very strong. So just any surprises, any I guess even more incremental positive surprises as you continue to roll out new stores?
Not incremental, Rupesh, just really good performance. The 2024s came out strong as we talked about on the last call, and they're continuing to perform well. The 2022 and 2023 vintages have comped really, really well, and they're maintaining strong comps. The overall business is good and they're outperforming that even. And so we've only opened 3 here in Q1, so it's not a huge change from where we were 60 days ago, but the new stores are performing really well and that's driving that number.
Speaker 5
Great. And then maybe just on the loyalty program, so the commentary still seems upbeat from your team. So same thing there, like if you continue to roll it out with any positive surprises you're seeing, and I know it's still early, but I don't know if there's a comp lift or anything you can share in terms of what you may be seeing with that small batch of stores.
And Nick, you can take that one because we're having a lot of confidence in this.
Speaker 6
Yeah, hi Rupesh. This is Nick. Jack mentioned in his comments. We feel very good about where loyalty is. We're really happy with what we're seeing in the 35 stores we're currently in right now, across our kind of KPIs in the business. We're meeting and slightly exceeding those. Jack alluded to some really good uptake on scans and/or sign-ups and scans. Our plan moving forward here is to begin the national launch in the second half of the year, starting with our market here in Arizona. We've got a few things to tidy up as far as getting the enterprise lined up and technology put together, but there's a lot of energy behind it here at Sprouts. Team members can't wait to see it come out, and we're excited to share it with them and all of you guys in the second half.
Speaker 5
Great, thank you. I'll pass it on.
Operator
Thank you. And our next question comes from the line of Ken Goldman with JP Morgan.
Speaker 7
Hi, thank you. I wanted to ask about household additions. I know it's only one data source, but in numerator data that we look at, it seems that your rate of additions is huge to over 20% and seems to be accelerating. I don't want to suggest that that's necessarily the exact accurate number, but it's far bigger than what we're seeing at other grocers, and I'm just curious, is it still in line just roughly or at least directionally with kind of what you're seeing in terms of just adding households at a quicker pace than what you're used to? And then how often are these new households becoming loyal customers in comparison to your legacy customers?
Speaker 6
Hey Ken, it's Nick. Thanks for the question. You're right. We're seeing really healthy custom metrics overall. So I'd start with both our new customers and existing customers. We're seeing strong behavior. We are seeing strong new customer growth, and what excites me is that we're seeing it both in our new and emerging markets, but also in existing markets where we've been for a while, so we're certainly excited to see that customers like what we're doing across the country. The other piece of this I would mention is with our existing customers, we're seeing higher engagement, in turn driving a higher share of wallets, so they're also certainly liking what we're doing and voting with their wallets. We'll continue to drive both of these. Our focus is on continuing to acquire customers across the board, and as Jack mentioned with the market size and market segment growing, we think there's an opportunity for us to continue to acquire new customers while deepening the engagement we have with our existing customers to drive growth.
Speaker 7
Great, thank you. And then a quick follow-up. Some of the other data that we have would suggest that in times when consumers are a little more challenged, they will shop in more stores to buy all their groceries. I don't think that's controversial, but I just wanted to make sure that going ahead, is there a possibility that if consumers do struggle a little bit more if we head into a recession, that you could potentially pick off even more households just from consumers who are saying, look, I have to go to 3 or 4 stores instead of 1, and my fuel costs are really low, so maybe I can do that. It's one of the bull thesis we hear on you guys ahead is that you can benefit in a recessionary period. I'm just trying to get a little sense of if you would agree with that.
Well, I think the context of my remarks a little while ago, Ken, where we think we can thrive in any circumstances going forward. And if there is consumer pressure, the one thing that's clear is people have got to eat and they'll carry on eating, and people with specialist diets are continuing to, if you're a vegan, you stay being a vegan. So, we're pretty confident that the offer we've got in front of people is going to be important, even in difficult circumstances. The other thing that tends to happen when consumers are under pressure, they eat more at home than eating out. So, we think that's a potential benefit within the context of the question you've asked. So, yeah, I think we kind of feel almost if it's tough, we'll do fine, and if it's not tough, we'll do fine. So, we're pretty confident that the proposition we're putting in front of our target customers is allowing us to be successful, regardless of the number of grocery stores people shop.
Speaker 7
Great, thank you so much.
Operator
Thank you. And our next question comes from the line of John Heinbockel with Guggenheim.
Speaker 8
Hey, Jack or Nick. Building on the last question, right, opportunity with what's for dinner tonight, and I think you think you are under indexed in that trip. So what do you think is the unlock there? Does that run through the loyalty program? You think something else?
Well, I'll let you take that, Nick, a little bit. We're certainly confident in the work that we're doing around meals and the investment in space and product and that, but maybe you can expand on that.
Speaker 6
Hey, John. I think a lot of what we're doing is aimed at tapping kind of the thrust of your question. We believe there's a lot of opportunities to gain more share of wallet from our existing customers, and that's by talking to them, sharing with them the things that are important to them from an attribute standpoint and getting them to shop more within our store. So, for instance, you see our new format, meats at the front of the store, intentionally. It's super important to our target customer. They're looking for attribute-driven grass-fed, organic protein options. We've been intentional in trying to serve that as a way to take care of the customer as well as drive more of center-of-the-plate and then turn a larger shop. And as you noted, certainly the loyalty work is aimed at customizing and personalizing everything we do around our vegan shoppers, organic shoppers, gluten-free shoppers so that we can gain more of their spend and more of their trips.
And I think it's fair to say, John, loyalty will play a role in that as we get further down and understand the customers and communicate some of the attributes that Nick was talking about.
Speaker 8
Building on that, I understand you want to enhance the loyalty experience as you begin to implement this. What do you think is currently missing from the program that shoppers desire, if anything, and how can you improve the experience?
Sure, where we are, the good news is we've been asking our customers about the loyalty program in those 35 markets, and we're getting really good marks on the program from the standpoint of providing our customers what they are looking for, tailored to their unique needs. I'll be able to answer that question in two pieces. Short term, John, we're looking to streamline the omnichannel experience for loyalty, so that the online experience, the in-store experience, and the transfer of the experience across channels is really seamless. In the test today, it's not quite at the level I think we can be. So, that's one short-term change that will help our customer. Long term, I think we're going to continue to go where the customer takes us as we learn through this process and use the data and our insights to do so. I will tell you we will always be committed to ensuring we find ways to help customers find and get access to new and unique products as that’s most important to them. They look to us as the place that can introduce them to the unique items that they're looking for. So, whether that be through technology, experiences, or other ways to engage the customer, that's something you'll continue to see us invest in.
Operator
Thank you. And our next question comes from the line of Edward Kelly with Wells Fargo.
Speaker 9
Yeah, hi, good morning everybody, or good afternoon everybody. I wanted to ask you, probably I guess a follow up on Ken's question, and it kind of pertains to one cadence of the comp throughout the quarter. I mean, it seems like it's probably pretty steady, but I'm curious, because consumer confidence seems to be changing, and as part of that I'm just wondering if you're seeing any behavioral change at all in the store that might pertain to private label or anything else that you potentially would know.
Hey, it's Curtis. The cadence, just a little bit better in February than the other two months, but that was really around the height of the cold and flu season and a couple of things we called out in the script, the strike that sent some business our way. Outside of that, it was pretty steady throughout. Really, no dramatic changes from the fourth quarter as far as the shape of the comp. It was broad, it was balanced, geographies, channels, etc.; everything kind of played out as we'd hoped it would, and it was steady throughout the quarter.
Speaker 9
And no note of like behavioral changes at all related to the macro and the way the consumer's feeling.
I think probably somewhat surprisingly we haven't seen any impact from consumer confidence either regionally or category-wise or trading down or different dynamics within it. So that's probably the surprise in some ways. Who knows where consumer confidence is going to lead to in terms of behavior going forward, and we're watching it really carefully, but we haven't seen any significant change in behavior.
Speaker 9
Okay, and just to follow up on self-distribution. Jack, you mentioned something about just beginning to sort of unlock the benefits associated with that, and I was curious if you could provide a bit more color on both like the margin and the operational benefits; what you're doing on the meat and seafood side, and I'm curious as to whether there is further opportunity beyond those categories down the road.
Well, I'll let Nick go into some detail, but the reality of this is we've been investing in space to be able to add in more categories to self-distribution over the last few years, and as we've put DCs, we've built 3 DCs on the ground and expanded some other ones. As we've done that, the intention was always to bring more categories to bear, and the fresh categories are the most important ones as they are so vital to our customer base. So, the work that we've been doing and we're building is getting our meat and seafood business under our own auspices so that we can manage it ourselves. The aspiration behind that will be to have better in-stocks, better working dynamics with our vendor base, and enable us to potentially just get more in-stock and be better at providing our service to the customer, and we're very hopeful that that's going to help us in both the top line and the bottom line within the meat category. That's not going to pull through until next year when we get this fully up and running, and we're working our way through that. The teams are doing a great job, but maybe Nick you could build on that.
Speaker 6
Yeah, the protein focus for us is important strategically. As I mentioned, I think in John's earlier question, we have a very differentiated meat and protein business, and in the seafood and meat side. We offer only attribute-driven products in that space, and the importance of freshness, control, quality, and in turn also profitability is really important for us in that business. We chose to invest there and bring that in-house with self-distribution. We have the capacity to do so. As we mentioned, we're going to be spending this year making that transition, and we've already started that process, and as Jack mentioned, continue it towards the end of the year and early in 2026. So, we're not going to see a ton of the benefit this year, but we should see some of that next year. Right now for me and my team, that's what we're really focused on is how do we execute that really well and not create any major issues for the business, and so far we're doing just that.
And with regard to further opportunities, there may be, as we come down the line on this, further categories. It's something we're looking at, but at the moment we're really doubling down and getting the meat and seafood thing right.
Speaker 9
Great, thank you.
Operator
Thank you. And our next question comes from the line of Krisztina Katai with Deutsche Bank.
Speaker 10
Hi, good afternoon, thanks for taking the question. So Jack, I wanted to ask on attribute-based products and the momentum that you continue to see there. Can you talk about the plans and launches that you have for 2025 and just plans to further leverage the momentum of the Sprouts brand in particular? And then two, some of the reformulation efforts that are out there under the new health secretary removing some of the harmful ingredients like dyes. What are your general views on potential changes in competitors' offerings and how that might change your go-to market strategy?
That's a good question. And we're spending a lot of time looking. The one great thing about our company is we're well ahead of most of these dynamics regarding what's in our food and what the dyes and these kinds of things. We've got some work to do, which I'll talk about in a second. With regard to our Sprouts brand business, we've been delighted at the progress that we've made on that. Our Sprouts brand is very clean relative to the rest of the marketplace. In fact, I don't think we've got any work to do on the Sprouts brand. The business there has been very focused on bringing those attributes to bear. Organic has been a big plus for us. Gluten-free has been a big plus for us, and they're doubling down. The team is doubling down on that. And as we've said, we're not trying to aspire to a bigger percentage of sales in Sprouts brand, but without doing that, we've gone from 16% to 24% of Sprout's brand because we're bringing products that relate to that attribute-based business that you're alluding to. With regard to ingredients and where this goes, as I said, we're in a good place relative to that. There are one or two things that we're taking a close look at, and I think we'll be better placed than most in terms of managing it. I don't think it's going to change our go-to market strategy because I think we're ahead of this relative to the rest of the market. How it's going to play out concerning the branded goods and the rest of the market, I think is going to be an interesting one, but less relevant to us than it will be to many others.
Speaker 10
Great, and if I can just follow up, I have one for Curtis. Gross margin continues to surprise to the upside. You obviously noted improvement in inventory and category management, maybe if you can talk about the sustainability of these, how much is left there to further unlock. Just trying to understand the overall ceiling of gross margins that we can see because you continue to manage that line item really well.
Yeah, thanks Krisztina. Yeah, the teams are doing a great job there. They continue to find more opportunities. We talked a lot in the last 4, 5, 6 calls about being a fairly immature business and still having opportunities ahead of us. We're capturing some of those as we go here quarter to quarter, but we still believe there's leverage to pull there. There are ways to get better, certainly in how we order, how we allocate products; things like that, we'll continue to get better. How we manage the in and out of 7000 SKUs that we're bringing in and taking out every year can be better. And so there's still room to go, clearly not as much as is behind us, but we still have opportunities there. And it's great. It gives us the opportunity to invest in things like loyalty and self-distribution and the things that we're putting our money into to grow the business in the long term. So, we expect it to moderate for sure in the second half of the year as we go forward, and hopefully the teams will continue to surprise us with upside, but for now we're expecting that to come back closer to normal.
Speaker 10
Great, thank you. Best of luck.
Operator
Thank you. And our next question comes from the line of Mark Carden with UBS.
Speaker 11
Good afternoon. Thanks so much for taking the questions. So to start, in recent quarters you guys have talked about the opportunity to capture more trade-in from the food away from home channel. Do you think you've seen much of a step up here just given some of the soft restaurant traffic data that's been out there over the past few months? And then do you approach retention any differently with these customers you might be bringing in?
Speaker 6
Hey Mark, it's Nick. We certainly have seen that. We believe we're getting some of that food-at-home purchase, again, especially from our core target customer, who is looking for convenient meals that are driven by health and attributes, and we're seeing, as I mentioned, some of our center-of-the-plate and meal-driven offerings certainly perform well. We're working hard to capture some of that spend and share. As far as the question on retention of that, this is where I get back to our opportunity with loyalty. And when people come in and engage with us, whether it's the first time or 10th time, and we understand what they're purchasing and why we can start to serve them all sorts of great options to keep them coming back and expand their baskets. So, we're looking forward to that as the loyalty program launches and our capabilities there improve.
Speaker 11
That's great, thanks. And then on tariffs, you guys appear to be pretty well positioned on the food side. How do you think about any potential impacts it could have on your pace of unit growth going forward relative to your algo, just given the potential for higher costs to build?
Again, it's something we're paying a lot of attention to, Mark, as you say regarding the selling of our food, we're pretty well protected in that in that most of our stuff comes from the U.S., and the stuff that comes from Mexico has been protected more or less unless something changes, but we're in a relatively good place there. The thing we are paying attention to is the cost of building our stores. So far, I don't think it's going to have an impact on us this year, but we're going to have to think pretty hard about what the long-term impact might be on that. At this stage, we've got plenty of space within our returns that gives us confidence that whatever happens in terms of steel tariffs and lumber tariffs and other things that we're well protected in it, but we are paying a lot of attention to it as you can imagine.
Speaker 11
Great, thanks so much. Good luck guys.
Operator
Thank you, and our next question comes from the line of Mike Montani with Evercore ISI.
Speaker 12
Hey, good afternoon. Thanks for taking the question. Just wanted to ask if I could follow up on the comp side. Can you guys provide some incremental information in terms of transaction size versus transaction count that you experienced within the quarter to drive the comp? And then as we look at the start of 2Q results, are you comping within the range or does the guidance provide cushion if things were to moderate from here?
Hi, Mike, this is Curtis. Yeah, so traffic and basket, about 70% traffic in Q1, so we continue to see strong traffic results and a pretty normal basket. The business is in good shape here as we start the quarter. Q2 is off to a good start and looking similar to Q1, but we're feeling comfortable with the guidance, and we'll see where the world goes here over the next few months.
Speaker 12
Got it. And if I could just follow up on the margin side, we were getting to about 60 bps of EBIT margin improvement in 2Q and then 40 to 50 bps in the back half. So, you had mentioned some moderation in the pace of gross margins. Should we basically look at that and say it could be roughly equal gross margin expansion versus SG&A leverage or anything you'd say to keep in mind there?
Yeah, I think, spot on for Q2 in about the 60 range. I think the majority of that will be gross as we continue to see strong results there, and some of the supply things we talked about will probably leak into Q2. As we get to the back half, it'll be probably a little bit more balanced between the two. We should see leverage in SG&A throughout the year as well, and it'll be a little more balanced between the two as we talk about the second half.
Speaker 12
Great, thanks for taking the question and good luck.
Operator
Thank you, and our next question comes from the line of Bill Kirk with ROTH Capital Partners.
Speaker 13
Hey, good afternoon everybody. So you just posted a quarter with almost 12% EBITDA margins, and I don't think you've ever had a quarter over 10%. So, I guess my question is longer term, can Sprouts be a double-digit EBITDA margin business?
Hey Bill, it's Curtis. Certainly, we're aspiring to continue to improve the business quarter after quarter and year after year. Obviously, we think about it in terms of stable. We're going to continue to invest in the business to drive those long-term results and as we've said before, as we kind of catch new watermarks, new high watermarks, we don't expect to go backwards. I'm really pleased with how the business is performing and how the teams are performing, taking care of our target customer, and we're going to continue to drive inefficiency out of our model and look to improve the business, but we're going to continue to invest in the business as well. You can count on us for stability; if it gets better than that we'll maintain it.
I think the exciting thing for us at the moment, Bill, is that we're in the place where, as I've always said, we're a relatively immature business, so there's opportunities for us to improve our business. And as we continue to do that, reinvesting for the future is so exciting in terms of the work we can do in IT and supply chain and making it better and really investing in our team members as we create this differentiated experience in store. I'm really excited about where we're at, and giving us the fuel to do that is something that will navigate our way through how we think this one through, but it's an exciting place to be at the moment.
Speaker 13
Thank you. As a follow-up, Curtis, I think you mentioned that tight in-stock levels had helped shrink leverage. Have they reached a point or has it reached a point where those tighter inventory levels are impacting sales in any way? Or are there any missed sales out there as those inventory levels that helped shrink leverage have gotten a little tighter?
Yeah, good question, Bill. I think we feel good about getting the product we need to keep the sales going. Obviously, it was a good quarter in Q1 and pretty similar to Q2. I think we do want to get back in stock as best we can to take care of the target customer. Are we leaving a little bit on the table there perhaps? We just really need to be in stock to take care of the customers, and that's what we're focused on—getting back to bright and shore those up.
There are a few categories that we've looked at that probably as the transition and self-distribution has probably helped us a little bit in that space or hindered us, whichever way you want to describe it.
Operator
Thank you, and our next question comes from the line of Robert Ohmes with Bank of America.
Speaker 14
Hi, this is Kendall Toscano on for Robbie. Thanks for taking my question. Curious, although grocers probably don't have as much exposure to tariffs we have in place right now, curious if there's anything you're seeing from your end in terms of pricing actions to maybe try and get ahead of future tariffs or manage pricing costs in other areas.
Speaker 6
Hi Kendall, it's Nick. No, we're not seeing anything on the product side right now in any preemptive response to tariffs. Things have been pretty stable for us on the cost side.
Same on SG&A, really. I think people are trying to figure out exactly where it's going to be when it's all said and done, so we haven't seen much yet.
Speaker 14
Got it, thanks. And then, apologies if I missed it, but can you give us any more color in terms of the supply constraints you brought up before, exactly what categories are driving that? And I know you also mentioned that was a driver of some gross margin expansion, so is that something you expect to continue into the second quarter?
Yeah, there's a few things going on there. One, clearly the meat transition and self-distribution is just a challenge with fresh product. And so as we made that transition to kind of our bridge solution before we're ready to do it in RDCs, we had some empty shelves and spots that contributed to shrink, and we pulled back a little bit on promo in the second half of the quarter as we were just managing supply and working through the transition. That piece is largely behind us. We're in good shape on the meat front. We've got our bridge solution in place. Our partner is doing great, and we're working through supply with them. Then the other piece is eggs, which just continues to be a challenge with avian flu, that continues on here. And then the third part is just generally the business is in great shape, and we're running strong comps and so we're chasing inventory in a variety of areas across the business, and that has led to a little bit less shrink. We'll see how that plays out in the second quarter. A little bit of that, as I said earlier, could leak into Q2, but we're working hard to try and get back to bright and shore those up.
Speaker 14
Great, thank you.
Operator
Thank you, and our next question comes from the line of Kelly Bania with BMO Capital Markets.
Speaker 15
Hi, good evening. Thanks for fitting me in. Wanted to follow up on e-commerce. I think you said that your growth was consistent across your three primary partners and just wanted to dig in a little bit more on Instacart and how that's going, because I thought it was interesting that they lowered their minimum delivery threshold, I believe to $10 recently, and so just curious if that contributed to any growth there or if there's any way—change in the way that consumers can use Sprouts with that lower threshold there, thinking of kind of prepared foods and convenient meal solutions in particular.
Speaker 6
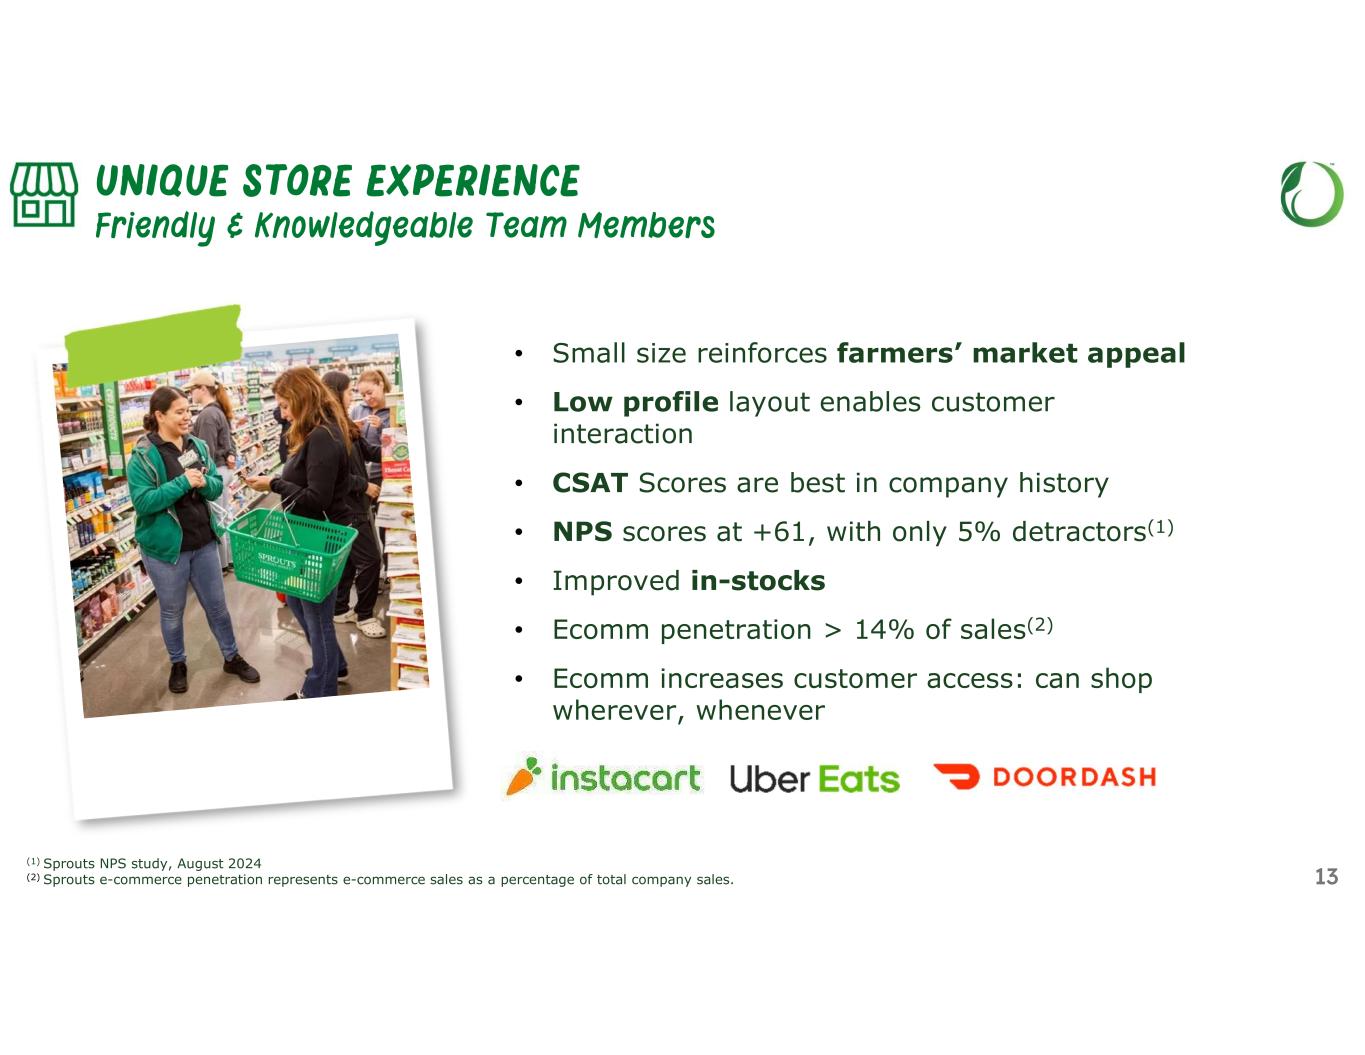
Hey Kelly, it's Nick. Yeah, as you mentioned, we did see really strong e-commerce growth of 28% overall, and I think we've talked about our e-commerce growth is driven first and foremost by the fact that we've got a really unique and differentiated offering that's hard to find in other places and so people will certainly continue, and we continue to see strong transactions and people looking for what we have on e-commerce. And I think as we've noted strategically for us, we're here to serve the customer wherever they want us to. The good news is those e-commerce customers are omnichannel customers and also high value. So that growth has a nice tailwind for us. Regarding Instacart, the good news is we're seeing strong growth across all three of our partners—Instacart, DoorDash and Uber Eats. We're certainly comping over some of the new launches with Uber Eats last year and DoorDash, which continue to grow. Instacart is still the large majority of our e-commerce business, and we're seeing strong growth. Some of the things you mentioned, we're seeing a little bit of help, but again, I think our customer is more focused on the unique products and attributes, more so than maybe the deal that others on that platform may be looking for, but so far we continue to see strong growth with that partner in all three.
Operator
Thank you. And our next question comes from the line of Scott Marks with Jefferies.
Speaker 16
Hey, good afternoon, guys. Thanks for taking my questions. First thing I want to ask about, you mentioned earlier that you've kind of seen broad-based growth across all categories, which I think is a little bit different from what we hear from maybe more traditional retailers and some of the suppliers. So, just wondering if you can talk maybe on a relative basis, maybe some areas that are doing a bit better and maybe some that are a little bit weaker.
Yeah, I think the reality for us is it's continuing to what we've seen over the course of the last few years. Those categories are differentiated, and those categories have got different attributes in them. We're seeing a stronger growth in those categories than in categories that are more traditional. So, our dairy business is really strong, our frozen business is really strong, and our grocery business is really strong. While at the same time, I think one of the step-ups we've had, Nick has been what's happened in our vitamin business which Curtis alluded to, part of the reason being cold and flu, but part of it is just the way that world is changing in terms of products that are very, those supplements that are coming in to help with people with different issues and different things, or thinking about, I've been astonished that new products are coming through there on how well they're doing. So, as well as our base business, which is bulk and produce, and our meat business, which we're feeling comfortable with, those are probably the areas that are doing a little bit better.
Yeah, I think you're right on, Jack. The only color I would add is where it's innovative and attribute-based—for us, Scott it's winning and our customers are voting for that. That's maybe where the outsized growth is coming in those and when it's innovative and new and differentiated with an attribute, that's certainly winning for us. Overall, Jack covered some of the categories. I think one of the things I'm really happy with the work of the team is, in pockets of the country or parts of our categories that maybe were a little softer last year, we put a lot of work in and helped improve, and so we're seeing all the businesses continue to grow. So, there isn't a lag; this is not working for us. There's been a lot of work on execution and the team has done a good job of growing all of our businesses right now.
Speaker 16
Understood, thanks for that. And then just as a follow-up. In your investor deck, there was a comment in there about having a same store growth tailwind from some of the new stores, but that being partially offset by some cannibalization, which is something I don't believe I've seen alluded to before. So just wondering if you can kind of share some insights into that in terms of maybe the magnitude and which markets.
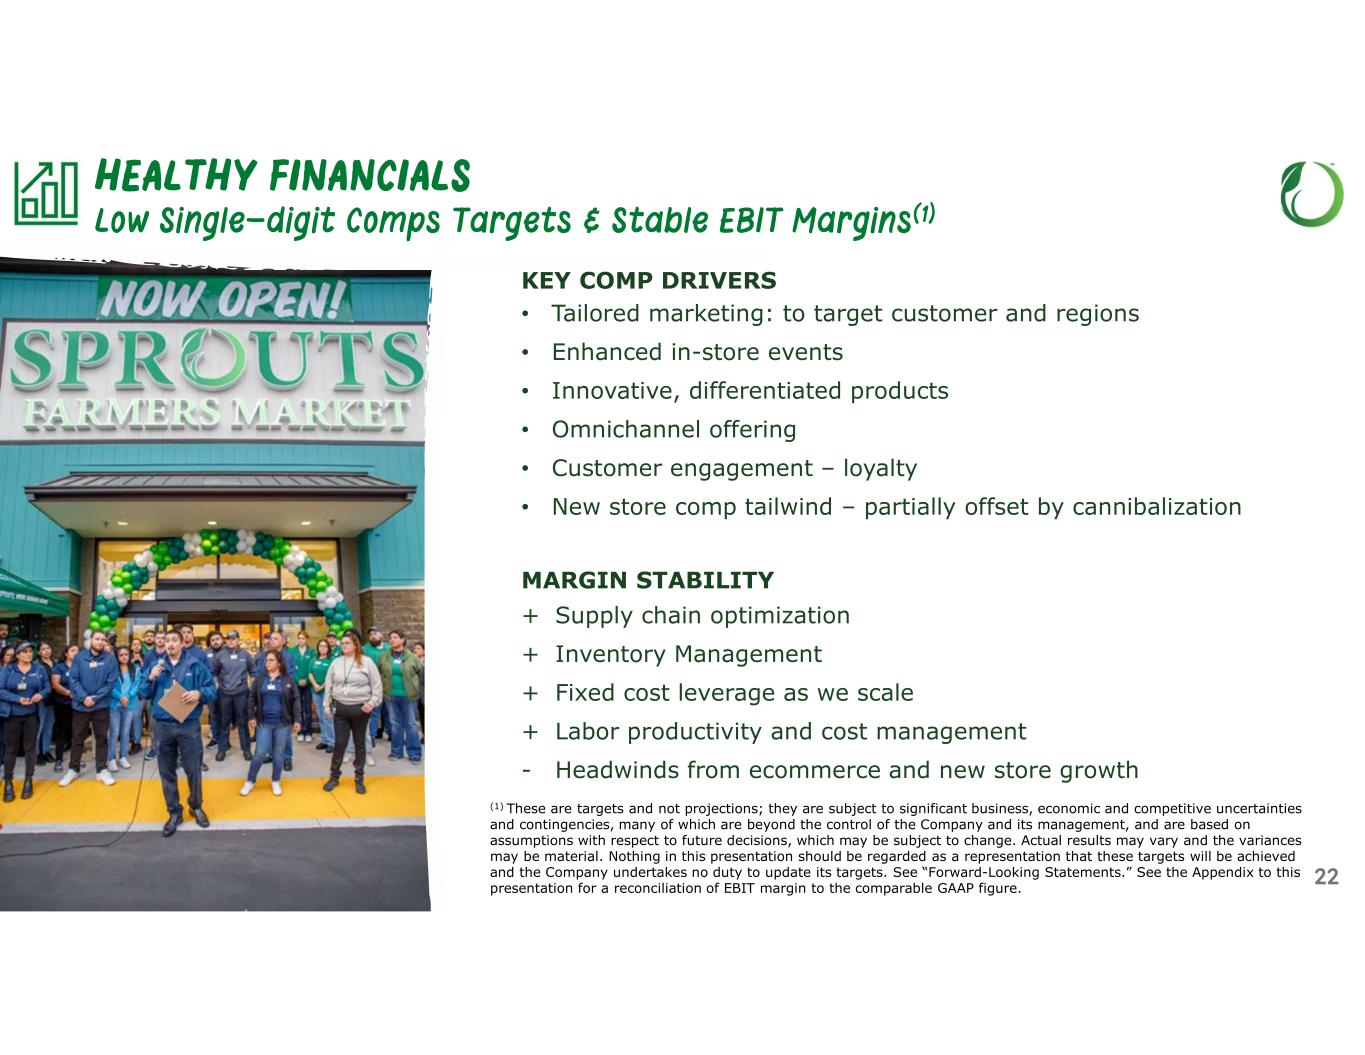
Yeah, I think the cannibalization, it's probably about 100 to 150 basis points, and it just depends on kind of where we're opening stores and how close they are to other stores that tends to obviously lean a little bit more towards our more established markets in the West and Southwest. As we open stores in the East, we've got a little bit more space and a little bit less cannibalization, but blended together, you're in that 125 basis points range. And on the new store side, they're coming in and they're folding into the comp really, really well, really pleased with the new store performance. We just don't have the number of vintages behind us. It was 8% last year, 8% the year before that. Prior to that, we only opened 12 and 16 stores in a couple of years, so once we get the full, kind of 10% growth over multiple years, that number will continue to grow. I think the cannibalization will stay in that same range. Right now, a slight benefit if you net them together with the new store comps, which are partially offset by the cannibalization. I expect the new store comp impact to continue to grow as we get more stores in the base, and again, the cannibalization should stay pretty steady in that 100 to 150 range as we open in that mix of new markets versus existing more established markets.
Speaker 16
Understood. Thanks so much. I'll pass it on.
Operator
Thank you. And our next question comes from the line of Scott Mushkin with R5 Capital.
Speaker 17
Hey guys, thanks for fitting me in. So, I wanted to go back to a question that kind of came up a little bit, which was just the idea of competition. If we're going to go back in time, I get this question from investors a lot with you guys. It reminds people of Whole Foods. And people ended up copying Whole Foods to a degree, which pushed their margins back down quite a bit. So the question is, what else can you do to expand the moat from competitors? Because they're going to come, right? Product differentiation is key, which you're doing, but what else in your mind can really drive an increasingly unique customer experience? Is it much better customer service for example, which would actually require some investment and maybe keep the margins from growing as much? But I just want to get your thoughts on that.
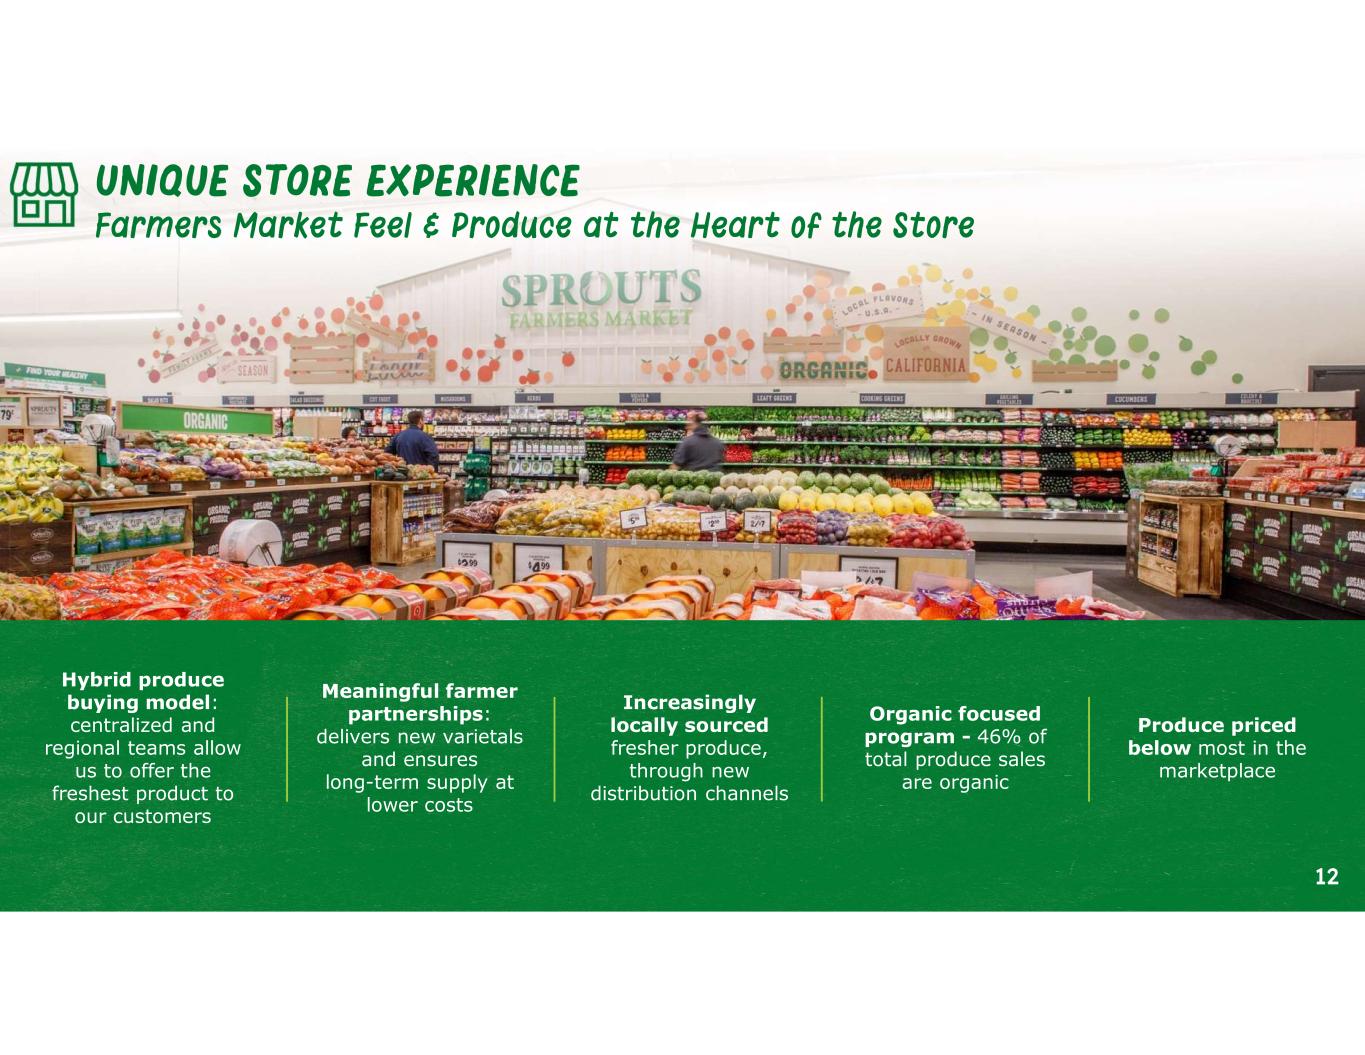
Well, we're very focused on, as I've used the expression plowing your own canoe. We're going to do—everyone laughs at it, because I don't quite understand it myself—but it certainly means we're trying to do our own thing and pushing that agenda down the road. I don't see the agenda changing significantly, Scott. We've got to double down on our produce business, which has always been the important part of it. Organic produce has been pivotal for us, and I don't see—if your organic business is growing as fast as it is for us relative to conventional, it's very hard for the other guys to chase after that. They're going to chase after the basics of that business rather than the organic side of it. So, we're excited about the opportunity in that space and doubling down on it. I think we can do more in launching of product goods. We talked at the last call; we launched 75,000 products last year. That's an extraordinary number, and keeping refreshing our business. I spent yesterday with an innovation group in the beverage forum out in California, and the number of products that are coming our way. It is literally very difficult for the other guys to launch as many products as that. So, we feel pretty confident in that space. With regard to pricing, we've always looked at pricing and maintaining a price differential with everybody on our fresh produce business, and we continue to have that. And with regard to the products we're selling, we're pretty well-priced on the products outside of the fresh food space. From a pricing point of view, we think we've got a moat. From a product point of view, we think we've got a moat. And then probably as important is how we create the atmosphere inside our stores. I've been absolutely delighted in the way the operations team have taken on board the mantle of trying to be the best service you can possibly be and the best service in the grocery industry in the United States, and that involves sampling and saying hello to people and greeting people, and we've got some pretty tough measures to ensure our teams are doing that. And that I think is a really important part. I think a lot of grocers try to aspire to. And that's part of the reason that we feel confident that the work that we're doing to drive some efficiency in our business allows us to then convert back into service and convert back into product. It's something that will give us that differentiation going forward. So, it's been working so far, and as I look at what's happening in the marketplace, Scott, I feel pretty confident that we're on the right track.
Speaker 17
That's perfect, Jack. That was actually a fantastic answer, so I appreciate it. Thank you.
Operator
Thank you. And I'm showing no further questions at this time. So with that, I'll hand the call back over to CEO, Jack Sinclair, for any closing remarks.
Well, thanks everybody for your attention. We appreciate your support, we appreciate your interest in our business and we look forward to updating it through the year. Thanks everybody.