Operator
Good day and thank you for standing by. Welcome to the Sprouts Farmers Market first quarter 2026 earnings conference call. At this time all participants are in a listen-only mode. After the speaker's presentation we'll open up for questions. To ask a question during a session you will need to press star 11 on your telephone. You then hear an automated message advising your hand is raised. To withdraw your question please press star 11 again. Please be advised that today's call is being recorded. I want to hand it over to our first speaker, Susanna Livingston. Please go ahead.
Speaker 8
Thank you and good afternoon everyone. We are pleased you are joining Sprouts on our first quarter 2026 earnings call. Jack Sinclair, Chief Executive Officer, Curtis Valentine, Chief Financial Officer, and Nick Conant, President and Chief Operating Officer, are with me today. The earnings release announcing our first quarter 2026 results, the webcast of this call, and financial slides can be accessed through the Investor Relations section of our website at investors.sprouts.com. During this call, management may make certain forward-looking statements, including statements regarding our expectations for 2026 and beyond. These statements involve several risks and uncertainties that could cause results to differ materially from those described in the forward looking statements. For more information, please refer to the risk factors discussed in our SEC filings and the commentary on forward looking statements at the end of our earnings release. Our remarks today include references to non-GAAP financial measures. Please use the tables in our earnings release for a reconciliation of our non-GAAP financial measures to the comparable GAAP figures. With that, let me hand it over to Jack.
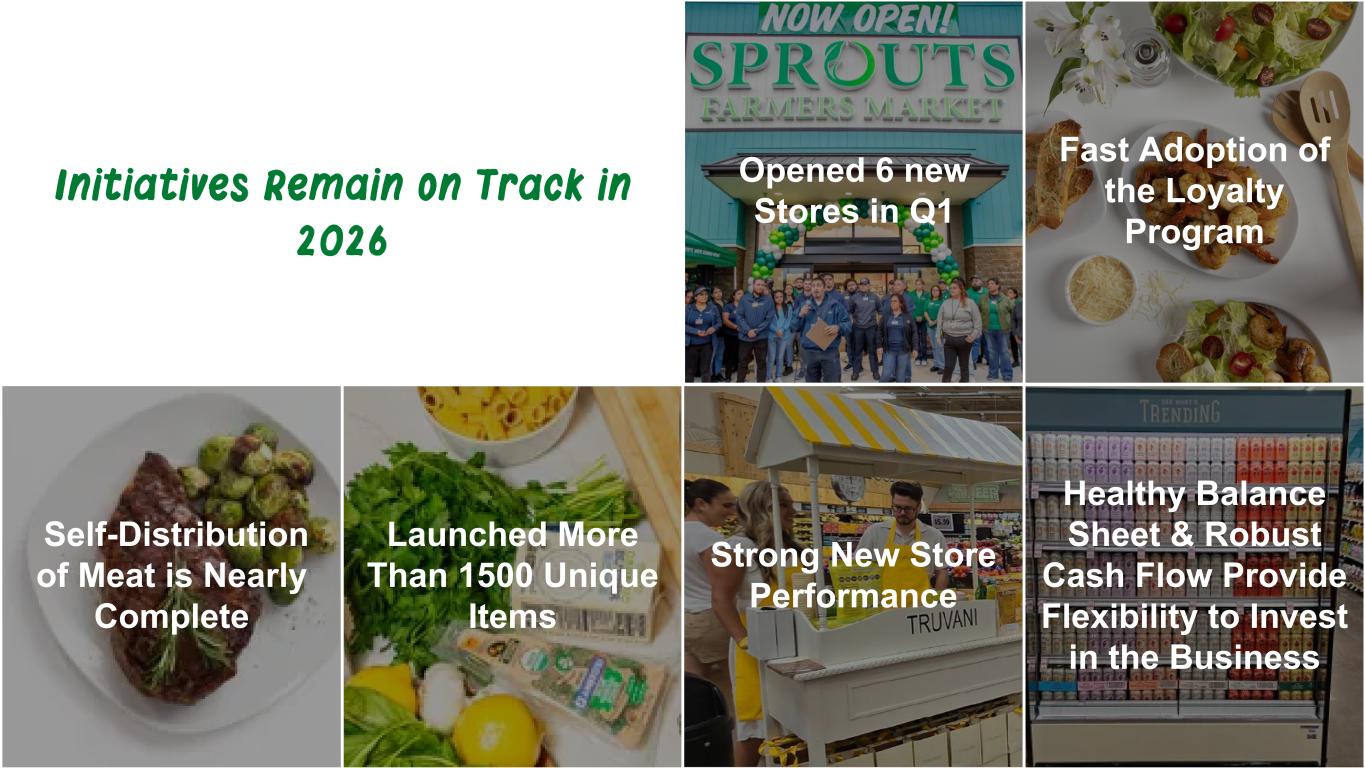
Thanks Susanna and good afternoon everyone. Before I dive in, I want to start by thanking our team for their disciplined execution and continued focus throughout the quarter. The first quarter played out largely as we expected. We continued to work through tough comparisons and a cautious consumer backdrop. Our recent new store openings are performing well, and we continue to be trusted partners for innovative product launches. Progress in our self-distribution of meat has been encouraging and is nearly complete. In addition, we continue to strengthen our talent across the organization. Our purpose is clear. We help people live and eat better. Our immediate 2026 priorities are to strengthen differentiation through foraging and innovation to reinforce our great in-store experience to accelerate customer engagement through loyalty and personalization to build an advantage supply chain to expand access to healthy food through new store growth and to take targeted actions to strengthen value all supported by our investment in our talent and technology this quarter we executed with discipline balancing early loyalty investment and targeted value actions with cost control, while continuing to advance the capabilities we need to support our long-term growth. I want to thank our team for their focus across the organisation. With strong execution and easing comparisons, we're expecting sequential improvement in our business as we move through 2026. For now, I'll hand it to Curtis to review our first quarter financial results, as well as our updated 2026 outlook. Curtis?
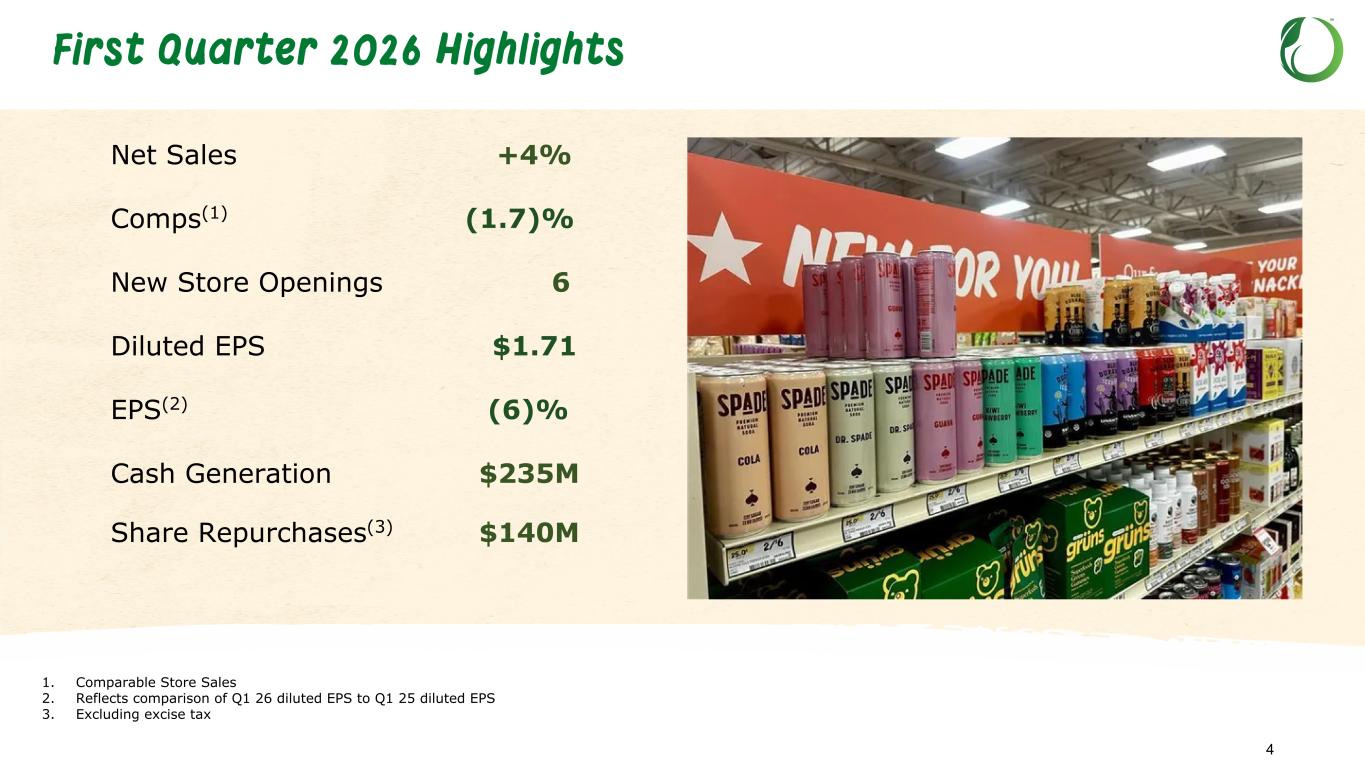
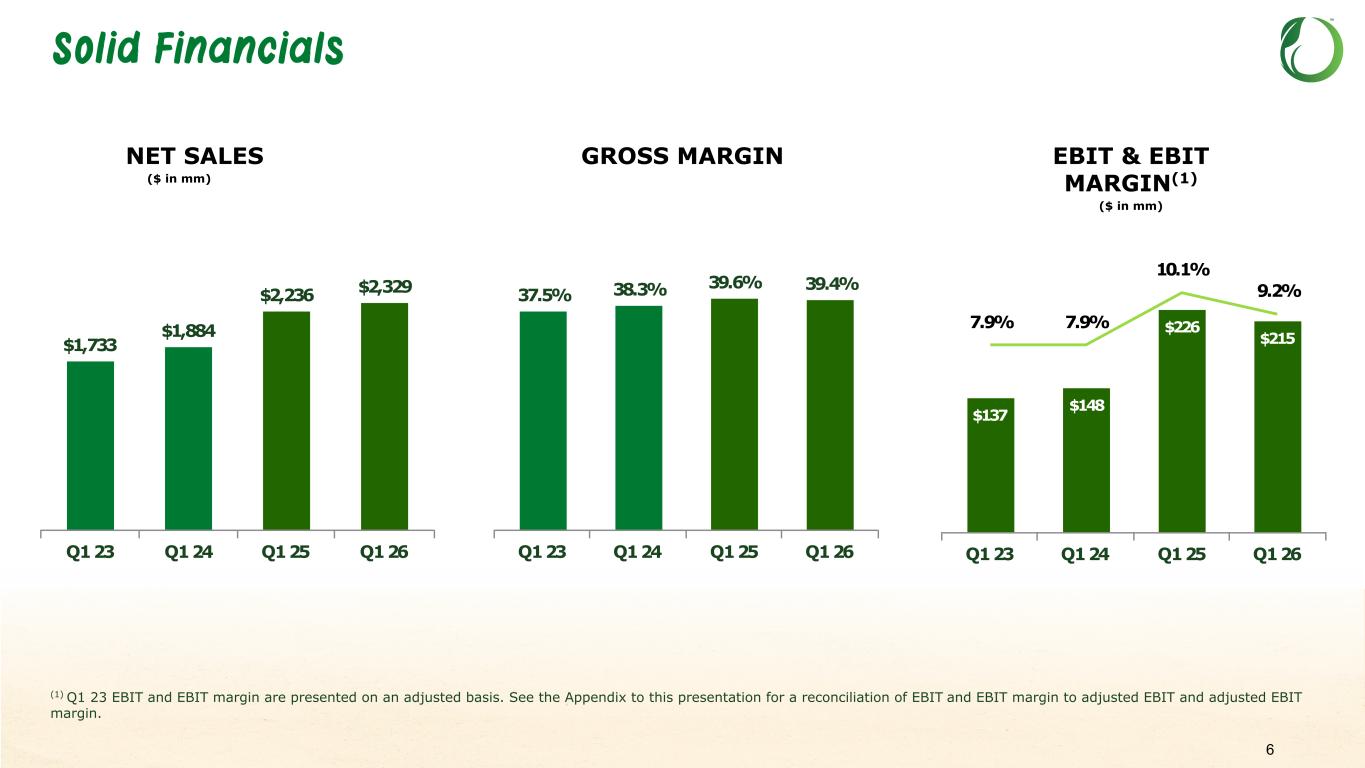
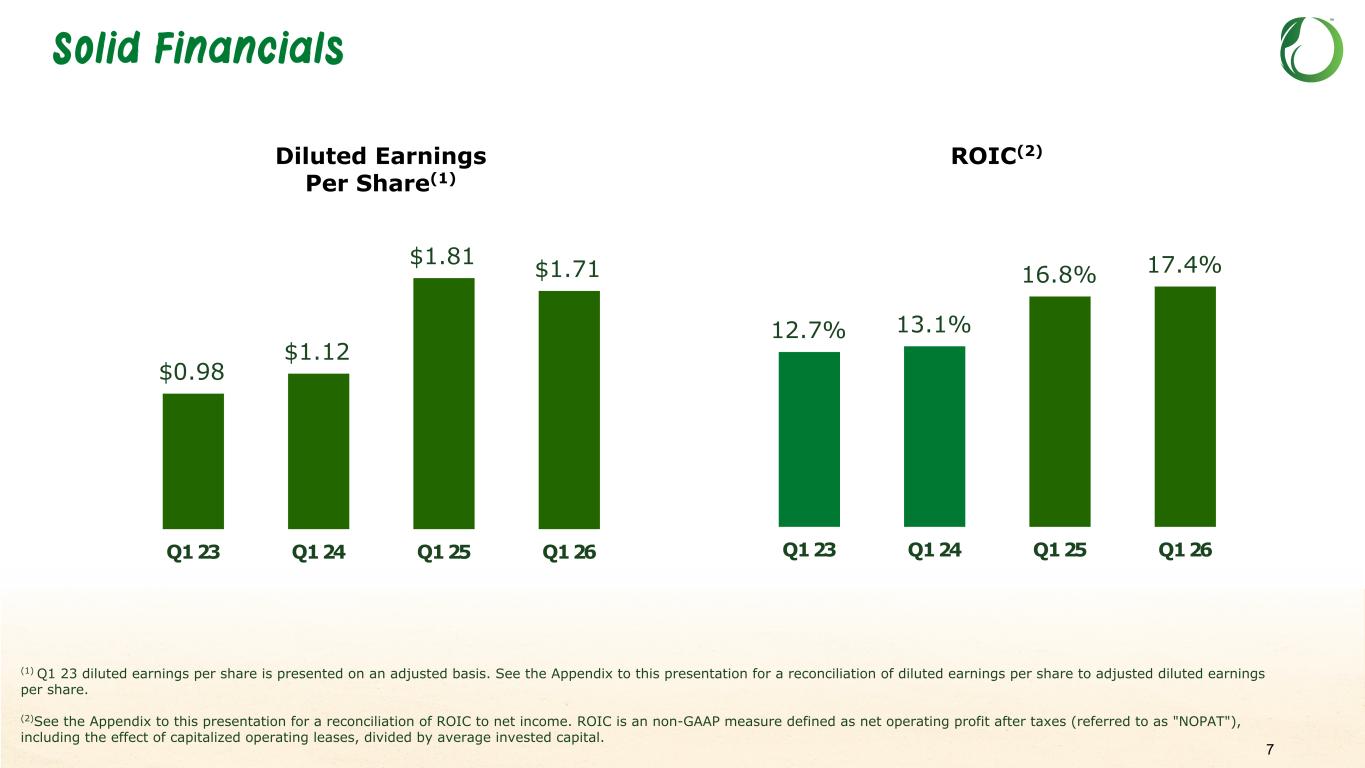
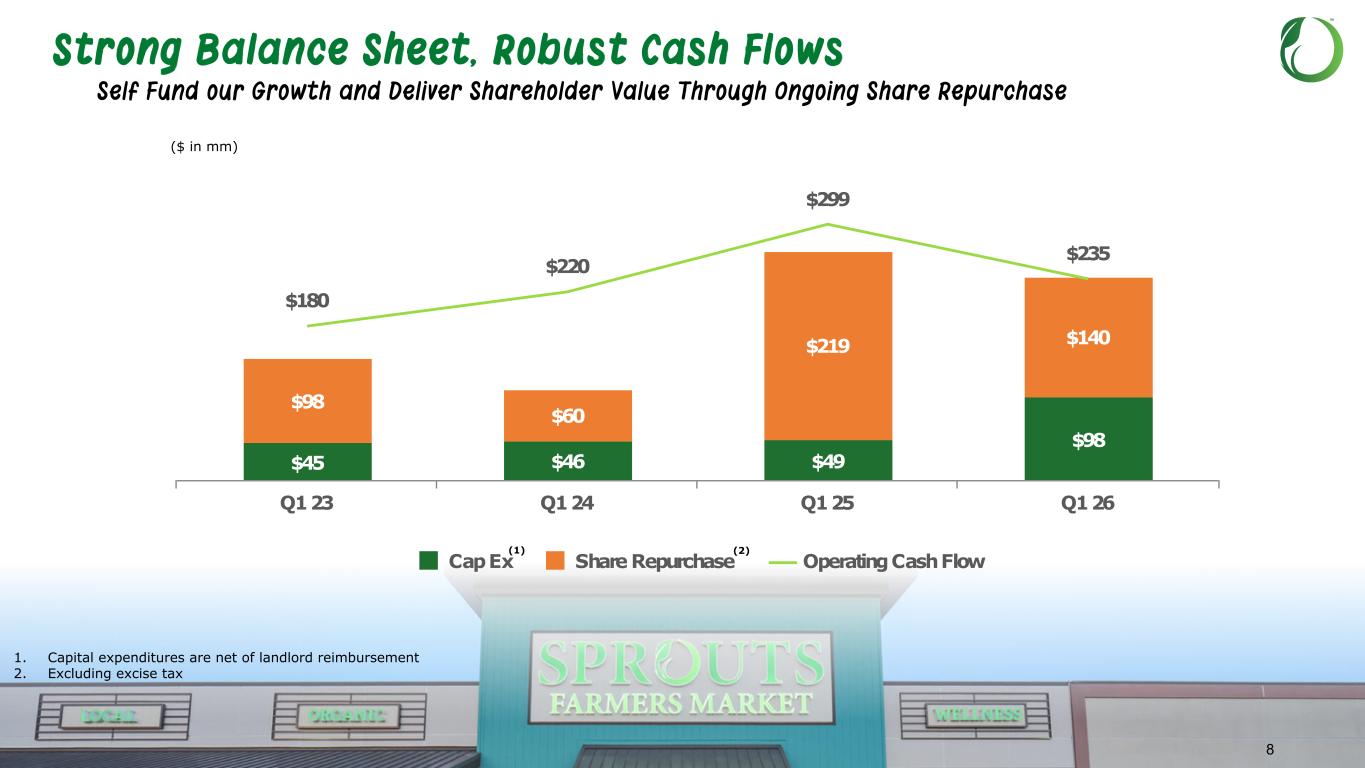
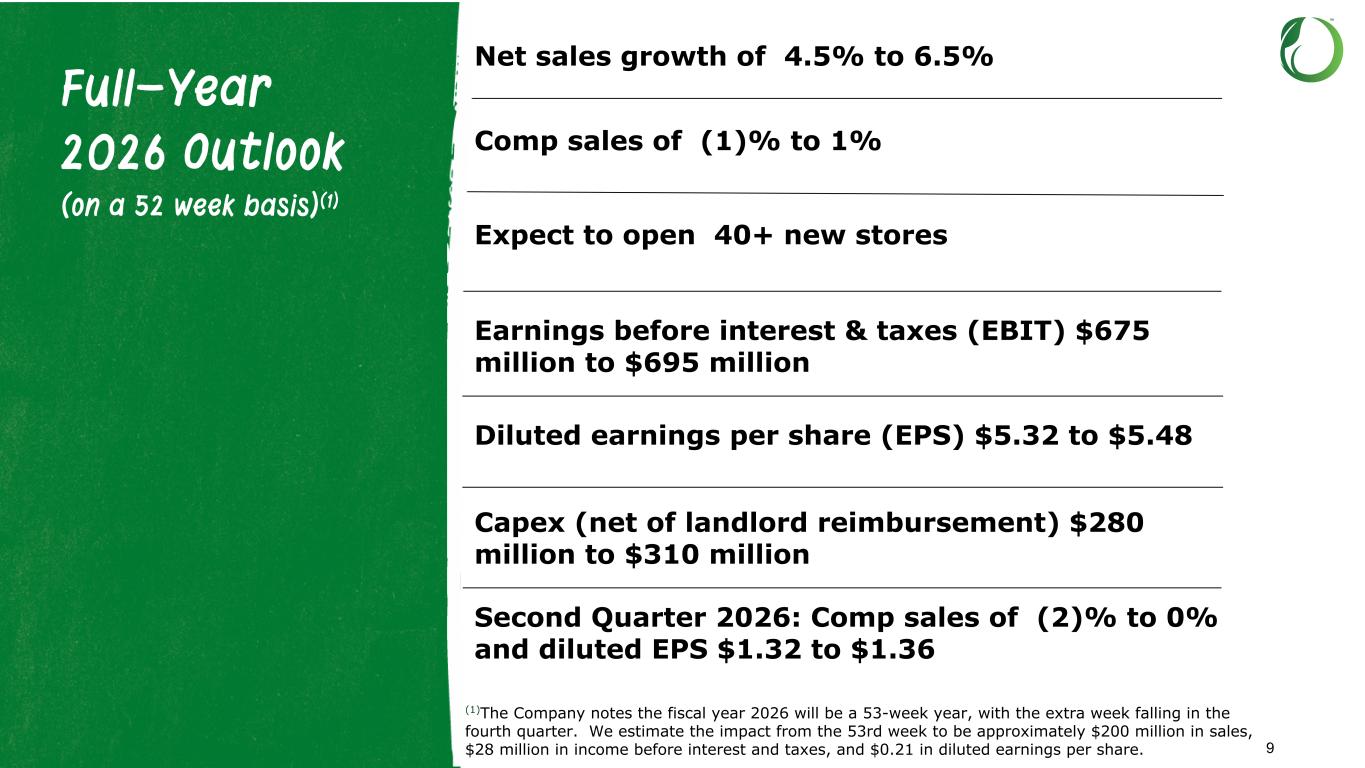
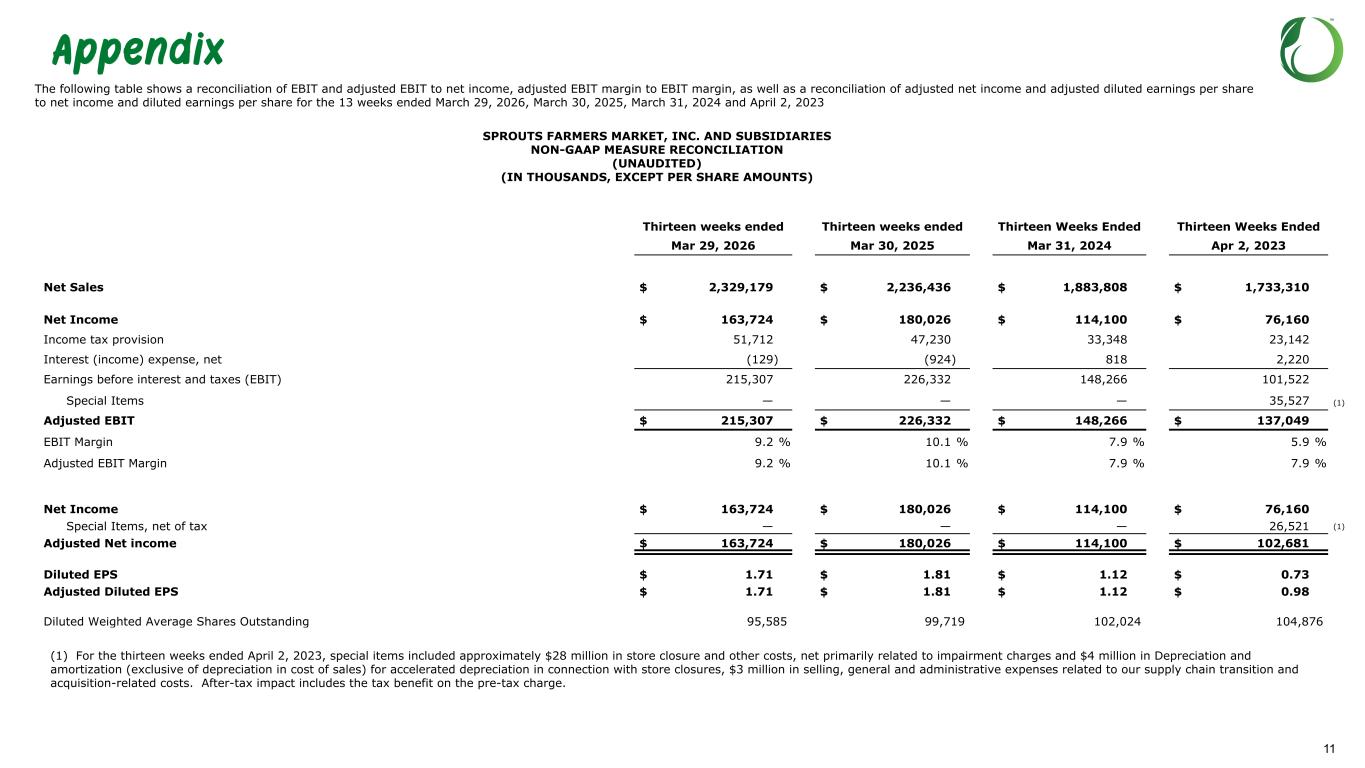
Thanks, Jack, and good afternoon, everyone. In the first quarter, total sales were 2.3 billion, up 93 million, or 4%, compared to the same period last year. This growth was driven by strong new store performance, partially offset by a 1.7% decline in comparable store sales. Innovation is a differentiator for Sprouts and continues to drive our sales. E-commerce sales grew 10 percent and represented approximately 16 percent of total quarterly sales. Sprouts brand also continued to perform well, growing faster than the rest of the business and representing more than 26 percent of total sales. During the quarter, we maintained discipline around margins and returns. Our first quarter gross margin was 39.4 percent, a decrease of 20 basis points compared to the same period last year. This primarily reflects loyalty investment consistent with our plan and unfavorable shrink performance. These headwinds were partially offset by benefits from self-distribution, which is performing as expected. We've taken initial steps to improve affordability for our target customers. We have made selective price adjustments on the most relevant items to our customers' baskets alongside a more focused promotional plan. We believe our P&L and guidance provide flexibility to support these actions and our customers needs. SG&A for the quarter totaled $659 million, an increase of $36 million and 42 basis points of deleverage compared to the same period last year. This was primarily driven by fixed cost deleverage from lower comparable store sales. We remain focused on cost discipline while funding key growth and customer initiatives for the near and longer term depreciation and amortization excluding depreciation included in the cost of sales was 42 million dollars for the first quarter our earnings before interest and taxes were 215 million dollars interest income was approximately 129 000 and our effective tax rate was 24%. Net income was $164 million, and diluted earnings per share were $1.71, a decrease of 6% compared to the same period last year. On unit growth, we opened six new stores, ending the quarter with 483 stores across 25 states, including our entry into New York. Our strong and healthy balance sheet continues to provide flexibility. For the first quarter, we generated $235 million in operating cash flow, which enabled self-funding of our investments in capital expenditures of $98 million net of landlord reimbursement. We also returned $140 million to our shareholders by repurchasing 1.9 million shares and have $696 million remaining under our $1 billion share repurchase authorization. We ended the first quarter with $252 million in cash and cash equivalents and $22 million of outstanding letters of credit. Turning to our outlook, we continue to lapse in exceptional numbers from last year. We expect year-on-year comparisons to improve in the back half as trends ease. We also believe our initiatives will build as the year progresses. As a reminder, 2026 will be a 53-week year, with the extra week falling at the end of the fourth quarter. For the full year, on a 52-week basis, we are maintaining our outlook for total sales growth between 4.5% to 6.5% and comp sales between negative 1% to positive 1%. We still plan to open at least 40 new stores in 2026. Earnings before interest and taxes are expected to be between $675 and $695 million. dollars we expect our corporate tax rate to be approximately twenty five point five percent and we expect capital expenditures net of landlord reimbursements to be between two hundred and eighty and three hundred and ten million dollars we are increasing our earnings per share outlook to be between five dollars and thirty two cents and five dollars and forty eight cents assuming at least three hundred million in share repurchases for the second quarter we expect comp sales to be in the range of negative two to zero percent and earnings per share to be between one dollar and thirty two cents and one dollar and thirty six cents even margin pressure is expected to be approximately 75 basis points due to fixed cost deleverage from lower comp sales annualizing our loyalty points investment and the impact of higher fuel costs we will continue to manage the business with a balanced approach investing for the future will receive the best returns while remaining disciplined on execution and cost control for 2026 delivery. And with that, I'll turn it back to Jack.
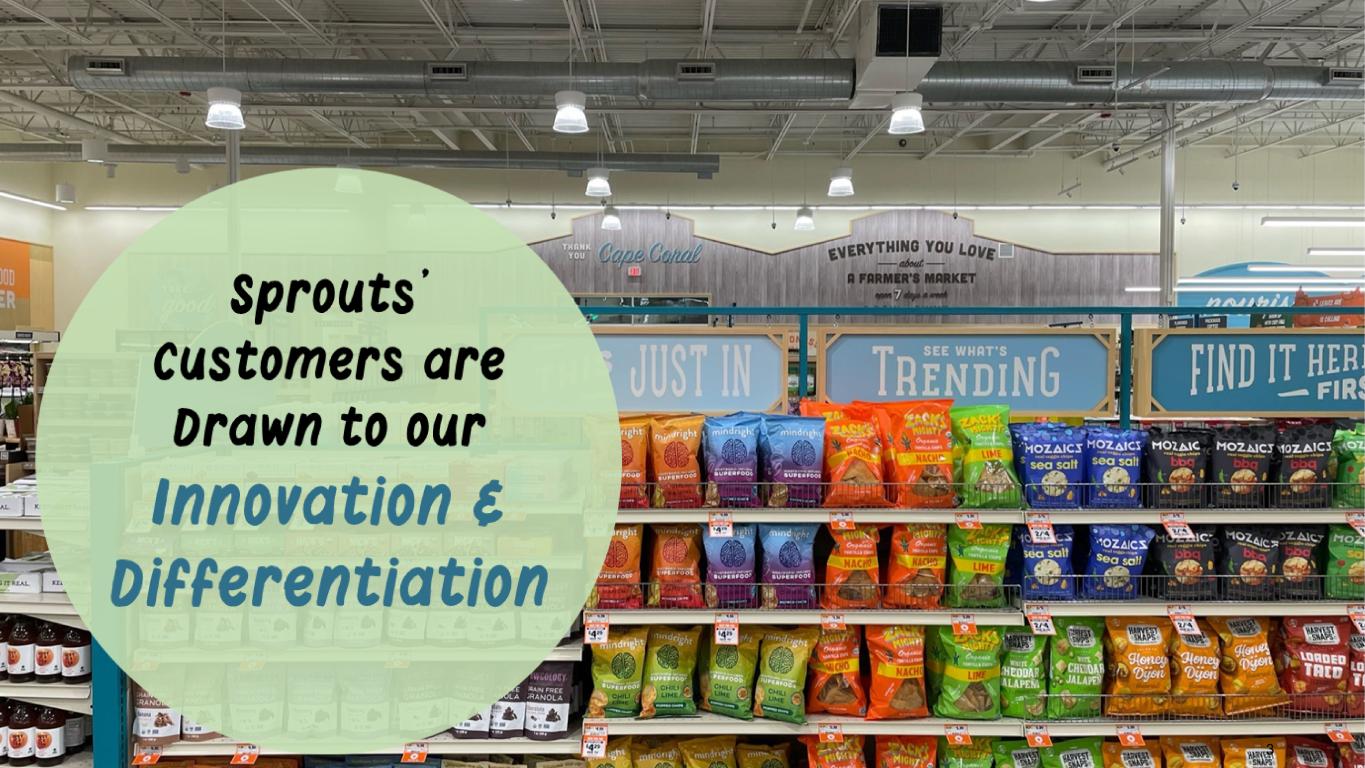
Thanks, Curtis. As always, we are confident in our strategy and the long-term potential of Sprouts. Our focus is to stay true to our strategy and sharpen execution across our priorities, foraging and innovation, customer experience, supply chain, and new store growth, supported by targeted investments in talent and technology we strive to make healthy eating accessible and affordable as health and wellness evolves delivering differentiated attribute driven products remain central to how we stand out and meet our customers expectations we're leaning into foraging innovation and discovery to introduce new and distinctive items with clean ingredients we've seen particular success with organics as they remain an important quality standard for our target customer and a meaningful growth driver for sprouts in the first quarter more than 55 percent of produce sales were organic and over 34 percent of total sales came from organic products we've already launched 1500 new items this year including brands like press coffee cold brew protein drink pendulum probiotics for gut health, and Proda, a protein soda. Innovation remains our strength, and we continue to attract a strong and healthy pipeline of emerging health and wellness brands that view Sprouts as the preferred launch partner. Sprouts brand continues to grow, expanding our differentiation across both fresh and non-perishable categories. Several of these innovations are resonating with customers, most notably our regenerative organic certified coffee, seed oil-free humus and beef tallow kettle chips. As we innovate, we remain focused on maintaining the right balance of everyday wellness essentials to curated premium wellness items, ensuring relevance, value and quality for our customers. As we go to market, you'll see us leaning more into our leadership in the health and wellness space. This is why customers seek us and continue to shop with us. As a result we're sharpening our marketing to more clearly express what makes Sprouts unique, highlighting differentiated brands, founder stories and product innovation. The store experience remains another core differentiator and our customers consistently cite it as a key driver for the love of sprouts. That advantage starts with what we believe is the best store team in the industry. Our team members are essential to delivering our unique assortment and supporting customers with attribute-driven needs, combining expertise with authentic personal service. This year, stores are focused on simple, genuine customer connections that make shopping easy and enjoyable while elevating daily execution, improving in-stocks, freshness, and production efficiency. I want to thank our team for the work they do every day to make our customers feel welcome. Another theme core to the DNA of Sprouts is making healthy eating accessible and affordable. It always starts with our assortment and we're working to bring healthy, delicious meal solutions such as wellness bowls under $10, $5 sushi Wednesday, and our $4.99 sandwiches. We will continue to innovate in areas that highlight Sprout's healthy attributes in everyday essentials, such as our recently launched two new yogurt parfaits with restaurant quality at a great value. We're also taking a targeted approach to price and promotion, with a clear focus on returns. In the first quarter, we took initial price reductions on a small number of SKUs, such as coffee, and a handful of other essential items. As well, we continue to test additional pricing opportunities. We're reshaping our promotional plans to be more streamlined and targeted on driving greater value on the categories and items that matter most to our customers. We continue to invest in talent and technology to strengthen our operating model and build the capabilities needed to scale. This year we're bringing new training and tools to our team to help them see opportunities in their business, to improve how we drive in stocks and better manage shrink. We believe these investments support consistent execution in stores, enhance customer experience and position sprouts for sustainable long-term growth. Our loyalty program continues to scale and is a strategic lever to deepen customer engagement. We're seeing positive customer response to both broad-based and targeted offers, including loyalty multipliers. As participation grows, we're gaining richer insights into customer behavior and using these learnings to accelerate personalization. Building on first quarter insights, we're adding resources to increase the pace of testing and learning and investing in capabilities and tools needed to turn what works into scalable programs. Vendor participation and demand have been strong, reinforcing our ability to expand these programs over time. From a supply chain standpoint, our focus is on building an advantage distribution channel that allows us to take more control of our fresh inventory. Our plan to open our new Northern California Distribution Center in the second quarter is on track and will complete our initial meat self-distribution journey. In addition to our structural changes, we're making targeted enhancements that improve service levels, inventory management, and allow the organization to respond more quickly to shifts in demand as i noted new stores are off to a strong start reinforcing our confidence in our long-term strategy already in 2026 we've opened stores in new york texas florida and virginia to resounding success we're seeing a great reaction as we enter new communities and we're sharpening site selection as we scale expanding access to healthy foods from sea to shining sea looking ahead we have nearly 150 new stores approved and more than 105 executed leases in our pipeline to wrap up while the near-term backdrop remains challenging we believe we are well positioned to navigate through it we're encouraged by what we can already see in new stores execution supply chain and the team with easing comparisons discipline around cost management and the initiatives we have underway we're confident in our strategy and our ability to drive long-term value thank you for joining us today we look forward to sharing more of this journey with you in the quarters to come and with that i'd like to turn it over for questions operator thank you and as a reminder to ask a question you want to press star one one on your
Operator
telephone and wait for a name to be announced to withdraw your question, please press star one one again. Please limit yourself to one question and one follow-up. In the interest of time, please stand by while we compile the Q&A roster. One moment for our first question. Our first question will come from the line of Rupesh Parikh from Oppenheimer. Your line is open.
Good afternoon. Thanks for taking my question. Just given some of the macro concerns out there, just curious just overall what you're seeing in terms of the health of your consumer. And then as you look at different segments, low, middle, high, just curious if you're seeing any changes there.
So, yeah, clearly there's a lot going on in the macro environment, and we're watching it pretty closely. We're focusing in on what we can do in terms of making life as good as we can for all of our customers. Certainly the macro environment suggests that our loyal customers have stuck very much to us going forward. The less engaged customers are feeling a little bit more pressure, and it could well be to do with the income levels. But I think it's a kind of general pattern across our customer base. As we look at the marketplace, it's a little bit uncertain what's going to happen going forward. And we are focusing on doubling down and being good at what we do. And I'm kind of encouraged by certain categories in terms of when we've done some price investments, some response to that. And I'm encouraged in some of the work that we're doing in our deli departments and increasing the options for people to access healthy, cheaper food. direct from Sprout.
Great. Then maybe just going deeper into just some of the price reductions, just as you look at all your value efforts, how do you say they're progressing versus your expectations and just confidence in gaining further traction from here?
Well, we're doing a number of different tests in different places, and some are working better than others, and some work very directly, and that's what we're learning. The testing process is both a geographic test, which we're doing in certain places, and specific categories. Tariffs put quite a number of – we referenced coffee in the script. Tariffs put some pressure on the top-line prices of a number of categories, and that's kind of eased off a little bit, and we've certainly been investing a little bit in that, coming back the other way. So we're being very selective by category, and we're doing some specific tests across different geographies.
Great. Thank you, Bessalak.
Operator
Thanks. Thank you. Our next question will come flying out of Thomas Palmer from JPMorgan. Your line is open.
Hey, thanks for the question. Maybe I could start off a little bit of a follow-up to Rupesh's question on affordability. What behavior change are you seeing, I guess, as you run these tests in terms of are you driving more new customers into the store? Is it more about seeing existing customers buying more items? And how do you communicate the improved price points to customers? What have you found effective? Go ahead, Nick.
Hey, Tom. It's Nick here. A couple things, as Jack mentioned. It starts with the assortment work we've done. The two areas I'd call it I think that have been most successful at driving basket, And I think we're also seeing traffic in these categories is the work we've done in the deli with our wellness bowls, our new parfaits, our $5 sandwich, $5 sushi. Those have been really good for us, and we're seeing both basket and traffic to those areas increase. Sprouts brand, the other area I'd call on the assortment side, if you look at, we've got tremendous organic offerings, and that's driving organic growth. And as we push and market those, we're seeing increased sales and basket in those Sprouts brand items. On the pricing side, for us, our focus is twofold. It's to try to put a few more ends in the basket and also to get our core customer to come back more often because those everyday essentials are more within reach for them. So that's how we're looking at the pricing activity and how we measure it.
Okay. Thanks for the detail, Nick. And then just a follow-up on the commentary about the expected EBIT margin pressure in the second quarter, any help just on kind of the split between gross margin and SG&A that you foresee, and maybe any framing of kind of how much of this 75 basis points might be related to fuel? Thanks.
Yeah, this is Curtis. Yeah, a little bit of extra pressure from fuel in the second quarter. That's kind of what we've embedded for now, and we'll see how that evolves through the quarter here. The shape of it will look pretty similar, I think, to Q1. So if you look at our Q1 results, some pressure and gross margin, maybe a touch higher. We've got our new NorCal DC rolling out, so there's some overlap costs there, as well as the fuel you highlighted.
Speaker 4
And then maybe just a touch better on the SG&A than what we saw in the first quarter, but generally a pretty similar shape to what was experienced here in Q1. got it thank you thank you our next question will come flying out Seth Sigmund from Barclays your line is open hey good afternoon everyone I wanted to follow up on the point around affordability and you know you're making some price changes I know that's not all you're doing there's other efforts to improve affordability but can you just remind us how you can manage that all from a margin perspective like what are the offsets we should be thinking about And then a related question on the loyalty program, specifically the vendor support. Where are we from that perspective? You know, I know it's still early, but I know that's a part of the equation through the year to start to see some stabilization in the margin. So help us think about sort of that opportunity. Thanks so much.
Yeah, this is Curtis. I think, yeah, the opportunities we've talked about are, you know, inventory management and continuing to improve in that space, you know, specifically within shrink, a little challenging in the first half. That challenge eases, and we get some easier comparisons in the second half just because of the sales volatility we've had year over year. We should continue to get better at shrink. We should continue to get better at markdowns and how we move product through the ecosystem. Those are the things that we've been working on that we can continue to get a little better at as we move forward. Certainly, the vendor funding is another piece. Then that's really, as you noted, early days. But we'd expect that to ramp as the year evolves and build as we continue to build programs around now that we've got the loyalty data and how we go to personalize off of that. So that'll be a piece that kicks in and helps as well. But those are the primary drivers. Over the longer term, you know, we'll think about, you know, self-distribution and other further opportunities there. And that should also be a helper down the line.
Speaker 4
Okay, great. That's super helpful. And then just thinking about sales, you're guiding to sequential improvements through the year. Comparisons are obviously a factor, but can you talk more specifically about the signals that you're seeing in the business now that gives you confidence that perhaps trends have stabilized after the slowdown that you've seen over the last couple of quarters? And I guess in that context, how are you thinking about the Q2 sales guidance. Thank you.
Yeah, you know, it's played out pretty much as expected. As you know, it's only been 60 days since last we chatted here, so it's not a lot has changed, but we're seeing, you know, some slight improvement in traffic, some slight improvement in units as we get into the second quarter here, and, you know, it's kind of playing out as we thought. Similarly, we talked, you know, we have better visibility into the customer and a perspective on what that would look like as it relates to the improvement quarter to quarter, and that's played out as expected. And so, you know, it's early, it's 60 days later, but so far, so good. We've seen things play out kind of how we were thinking they would. Beyond that, if I go back to, you know, why do we have confidence, you know, from a broader perspective, it's, you know, it's the four-year run we had prior to, you know, the last couple of quarters where we built sequentially over time to that three to four comp in the algorithm, and then a really strong, obviously, experience with some tailwinds in 24 and 25. So obviously, the lapping's a challenge, but we believe we get to the other side of that, that we'll get back into our algorithm later this year.
Yeah, and as Curtis said, the lapping's clearly a part of this dynamic going forward in terms of why we're feeling better about what's going to happen in the second half. But there is still continued tailwinds in terms of this health and wellness and clean ingredients the marketplace is trending towards that and there's clearly some macroeconomic dynamics that play into it but that underlying trend that's been with us for a number of years we think we're really well placed to be in taking advantage of that and to next point on assortment in terms of making sure the assortment we're bringing forward on both the sprouts brand products and the new products we're bringing in playing to that health and wellness and differentiating their agenda. We're feeling really confident about the way that assortment's evolving and the team and the response we're getting from the entrepreneurial spirit that's so prevalent in this space. They're bringing a lot of products to us, and that's something that gives a lot of confidence going forward.
Speaker 4
Nice progress. Thanks so much. I appreciate it.
Operator
Thank you. Thank you. Our next question will come from the line of Leah Jordan from Goldman Sachs. Your line is open.
Thank you. I just wanted to ask a little bit more on the comp trends in the quarter, just color there, cadence by month, differences by geography. Also, more specifically, how is Q2 to date tracking? and maybe just remind us of the one-time lapse that we still need to be thinking about going forward. I know on the whole, the comps get easier, but just the one-time kind of months we should be mindful of. Thank you.
Hi, Lee. It's Curtis. So yeah, Q1, we talked a lot about the strike at a competitor in P2 or February that drove some business our way last year, And that kind of played out as we expected. So Feb was our worst month of the quarter. January and March look pretty similar. As we've evolved into April here, we are just slightly ahead of the midpoint of the guidance for the comp for the quarter. And then from a year-over-year perspective within Q2, we just talked about May and June last year being a little bit favorable on the produce season, which does look good again for us here in 2026. And then the cyber incident that impacted the natural organic space last year being a little bit of a tailwind for us in June. And so those are the moving parts, but again, things have really played out through February, March, April as we initially anticipated.
Okay, that's really helpful. And then just for my follow-up, I wanted to go back to the broader affordability discussion. You made some targeted price adjustments around essentials. It sounds like you're doing some more tests, but maybe in areas like coffee or other things that you've done, And, you know, maybe help give us some detail around where price gaps kind of were and maybe where they are today. And are you seeing any response from peers in the marketplace after doing that? And then also, I guess, you know, because some of this confident momentum is still in the come, you know, I guess what kind of volume response are you seeing in these categories after you make those price adjustments? I mean, I guess how are you able to measure, like, okay, yes, We've made enough of a price investment at this point, given it's still, you know, being tested and in progress.
Well, the context of that conversation is the same today as it's been all the way through this dialogue in terms of the products that we're trying to invest in or put better prices in. They're based on what's important in our customers' basket. And they're not relevant to what's not necessarily relevant in what other people's basket is. So we're not really looking at direct pricing comparisons. We do in produce, as we've talked about, but in other categories, we're looking at specifically our attribute-based products and looking at elasticity. And we have in some of those investments that we've talked about, when we've dropped prices, we've seen volumes go up. And I suppose that's intuitive. And the question is, how far do we go? At the moment, we're doing tests in broader-based categories in certain locations, and we're doing specific category work. But it's all about elasticity. It's all about comparing ourselves to our customer and what they do, as opposed to comparing our prices to other people. So we don't think about it like a gap you might do in a traditional way of thinking about this. We think about how can we drive volume through price. Nick, maybe you want to add to that.
Yeah, I think the only thing I'd add, Lee, is I think it's a combination that I don't want to lose touch of. It's affordability focuses on assortment, and then it's our everyday pricing, And then it's also on some of our promotion activity. And the customers told us as we look at broader category level and subcategory level promotions and being really targeted there, we've seen really good uptake in unit lift and sales dollar lift that we've seen good response to. So, as Jack said, it's targeted to our unique customer, what's most important to them. And then we're seeing unit lifts and those things we're moving. and then we'll measure that over time and make sure that translates into bigger baskets and more traffic.
Great. That's really helpful. Thank you.
Operator
Thanks. Thank you. Our next question will come from the line of Edward Kelly from Wells Fargo. Your line is open.
Operator
Good afternoon, guys.
I wanted to ask, you know, maybe first, Curtis, could we start with the back half gross margin outlook and sort of how you're thinking about things. And part of that, I'm kind of curious as to, you know, what you're assuming for fuel. Obviously, it's a little bit of a moving target. Our math has maybe fuel as a 20 basis point headwind quarterly if it were to continue at this rate for the rest of the year. I'm just kind of curious, is that ballpark? And what's in the guidance for that? And then how are you thinking about gross margin in the back of things? Thanks.
Hey, yeah, it's probably just a touch high, but pretty close, I would say, on the estimate there. Although, again, it's been pretty bouncy, so it depends a lot about what the price is. Right now, we've just factored it into Q2, knowing that it's right in front of us, and that's where the price point is, and we'll see how that evolves in the second half of the year, and so don't have a lot of that factored into the second half. As we think about the second half, you know, we expect margins to stabilize. Really think about that from an EBIT perspective. There'll be a little bit of pressure as the comp continues to improve and get back into the algorithm. But once we're there, we'd expect that stable margin kind of posture that we talk about. And then on the growth side, specifically, we do get some of those things that are challenging in the first half that do ease in the second half. So the loyalty piece will be fully anniversaried as we get them to Q3. We do have an easier shrink comparison, particularly in the fourth quarter. And so some of those things go away. And then we've got our benefit from self-distribution in meat that'll be a little bit more clear once we get past the opening of the NorCal DC. So expecting margins to improve and be kind of flat, maybe slightly positive in the second half. And I'd also add that we do have, you know, for what we're testing right now, assuming that that were to go as we're testing, you know, we've got a little bit built in for some of the pricing adjustments from an affordability perspective.
Okay, and just a follow-up. You know, taking a step back on comp to leverage and, you know, sort of where this, you know, is evolving for you guys, if you get back to sort of three, four comp here, Can you leverage on that moving forward? I'm just curious as to how that leverage point has sort of changed in your thinking, if at all.
Yeah. We talked about feeling good from a fours perspective, and I think that's coming down as we continue to, you know, we're working hard on the cost side of the business, leveraging our scale as we get bigger as a business to improve our cost base, working hard on how we can leverage technology to improve our cost base as well. These are the things that we've been talking about and investing in in the past couple of years that are starting to help on that front. And that's just work that we'll continue to do, you know, over and over again as we continue to get bigger. So it should be less than four. And then it comes down a little bit to just how much we plan to invest in the business and where we need to make investments in the business. And so there'll be a bit of an ebb and flow on the investment front. We've been at that for a couple of years now at a pretty steady clip. If we find a reason in a high return opportunity, we'll invest a little more. So that will be the other factor in that, but certainly should be less than the four we've talked about historically, and we feel pretty good late this year if we get back to that algorithm range to bring SG&A pressure in line and kind of have that moderate as well.
Operator
Thank you. One moment for our next question. Our next question will come from the line. Mark Carden from UBS. Your line is open.
Good afternoon. Thanks so much for taking the question, guys. So, to start on loyalty, how have loyalty program signups trended relative to your expectations? Have you guys seen many shifts in signup trajectories or consumer behavior as you've settled on the new EARN model? And has it had any more or less of an impact on margin than you originally expected?
Hey, Mark, it's Nick. You know, when we made the updates and improvements to the program in early 26th. We did a lot of work studying the customer and their response, and the customer surveys and sentiment we had actually showed really well. We didn't see any decline, in fact, a slight uptick in support for the program as we were adjusting it to provide more tangible value through the point multipliers and other efforts, as well as more personalization. So, we feel pretty good about the customer sentiment with the program changes we made in early 26. And from a behavior standpoint, you know, I think as Jack mentioned, our core customer, our core loyalty customer, we're seeing, you know, be really steady, good spend and increased spend and happy with what we're seeing there. And then much like we noted last quarter, new members in the program are joining the program and continuing to spend and spend more. So we feel good about that. But, you know, we have a lot of work to do in the first half to continue to invest to demonstrate and show how we can drive behavior in this environment and continue to test, learn, and scale. We're making smart investments and accelerating that capability that helped propel us in the back half and beyond.
That's great. And then just given some of the pressures on cost of living, including rising fuel prices, are you guys seeing much of a shift in purchasing behavior in categories like meat or seafood? And are you still seeing similar reductions in items per basket? Just any color there would be helpful. Thanks.
Yeah, in reverse order there, Mark, on the items for basket, not a material change, still just pressure.
Like we talked about on the last call, that last item in the basket is always, you know, when, you know, there's a little bit of inflation or maybe fuel prices are up and the customer's thinking about just basket size and how much they can spend, we always see it in that last item in the basket, and that's been pretty consistent, you know in the last couple of months since last we talked and then i mean mark on the on the mix or the categories you know what i'm pleased with is our health attributes where we really lean in as we talked about organic breastfed protein and so on we're seeing really good growth in those attributes we kind of look at the business through that lens first um and we're seeing solid growth there where things a little bit more commoditized as you mentioned that's where you might see the
item out of the basket a little bit of pressure in the value channels but we feel strong about where we lean in and where we want to win which is that health customer we feel good about the categories that are winning in that space and we take the responsibility for affordability really seriously there's a real opportunity for us to help people live and eat better if we focus in on those areas where we can make things just a little bit better for our customers thanks so much So good luck, guys.
Operator
Thank you. Our next question will come from the line of Michael Montani from Evercore ISI. Your line is open.
Yes, hi. Good afternoon. Thanks for taking the question. I just wanted to ask on the top line side, if you could talk about, you know, the traffic and ticket that you experienced in the quarter, should we think about food at home inflation, kind of low twos as like a rough proxy, and then, like, really what's your outlook there? because we were looking at, like, 150 to 200-bit step-up potentially through the course of the year due to oil and fertilizers kind of filtering through. So any color you have on that, as well as on the traffic side, could you just talk about, you know, the loyalty program, you know, personalization, potentially some of the work in media and marketing you're doing? You know, what gives you conviction that you can basically turn, you know, the traffic side to be positive again?
Hey, Mike. I'll start with Curtis on the kind of shape of the comp. And so, yeah, from an inflation perspective, you know, similar to where we've been, you know, the last couple times, we're, you know, we're typically on a like-for-like SKU basis at or maybe a touch higher than CPI based on our mix. we've leaned you know lean a little bit premium in the assortment and the things we've brought in and that adds a little bit and and we're mixing to organics and things like that so from a mixed perspective we see a little bit higher kind of aur and inflation so those things are still the same as they were and we're seeing you know a pretty steady basket when you put all things together. So a positive basket, negative traffic kind of gets us to the Q1 comp. The sequential improvement should really come from the traffic side. We're not counting on a lot of additional inflation at this point. We'll see how we manage that and handle that if and when it comes. But for now, we're expecting the inflation piece to be fairly steady from what we've seen.
And we're expecting a sequential improvement to come in the traffic as the compares ease year over year. i'll let nick talk a little bit about the marketing side of things in terms of the cost and inflation and how it's playing out fuels a little bit uncertain as curtis said a minute ago it's up and down what exactly is going to happen with that we'll have to wait and see fertilizer we haven't really seen that come flowing through into our cost base yet what that's can and the good thing is when you sell a lot of organics you don't need as much fertilizer so there's a lot of opportunity for us to maybe double down on organics in the world where the fertilizer costs are flowing through into food prices. But I'll let Nick talk about the marketing side of things.
Yeah, hey, Mike, real quickly, I think a couple of thoughts on the marketing. One, I'm really happy with what's going on with new stores and how the marketing is working to bring new customers into those stores. It's approved point one of the power of the brand, of our positioning and health and wellness and power of the marketing and the work the team is doing there. so that's been really strong. In addition, I think we continue to do a great job of launching new products and new items with a lot of our vendor partners, and the marketing work there has been very solid. I think as I look at traffic in the back half, we've got a lot more data than we've ever had on how to drive customer behavior, what to learn from our customer, and our customer marketing team is using that to help us think about how do we adjust our brand message and media to be more relevant to the customer right now where they're at in this space. We've got some early tests and efforts in place that have shown an ability for us to move the customer, to drive awareness, and to move traffic. So I'm very happy with the early work the team is doing, and I think you'll see that impact us in the back half.
Operator
Thank you. One moment for our next question. Our next question will come from the line of Scott Marks from Jefferies. Your line is open.
Hey, good afternoon. Thanks for taking the questions. First thing I wanted to ask about, maybe you already touched on this, but can you let us understand how comps, how performance is trending just across geographies, maybe across more recent vintage stores or more mature stores, you know, expansion versus existing markets, just any color you can provide on that would be great.
Sure. Hey, Scott, it's Curtis. on the it's been pretty consistent from a geography perspective as we talked about before we're not seeing materials gone up and and moderated here it's it's all across all geographies maybe just a little bit of additional pressure in the southwest and in the southeast then then the other category geographies but but not material in that respect on the vintages I'll say it's you know we're pleased with the new stores as we've highlighted in the script and that's another good proof point there is they they're still positive comps in the new vintages uh or the more recent three or four vintages and so that's just another encouraging piece that even though there's an underlying lapping pressure you know we're seeing some good good results in those most recent vintages uh and again just gives us some confidence in the overall strategy and where we're headed and things bouncing back as the is the compares ease i think that's really you know those are the kind of little bits that are a bit different as you break it down across either geography or store type.
Appreciate the thoughts there. And then maybe the second one for me, it sounds like you guys had another strong quarter for e-commerce. I wonder if you can share any updates on e-commerce, how you may be adapting your e-commerce strategy given some of the other changes you're making on affordability and everything else. So any comments you can share on that would be helpful. Thanks.
Hey, Scott, it's Nick. As we mentioned, we saw double digit sales growth in e-com and we're now roughly about 16 percent penetrated. I think it starts with the it speaks to the power of our assortment that people you know want the unique innovative items that we have and it lends itself well as a secondary shop to e-commerce and so it starts with I think the proof point of people are looking for the unique things that we have and make them part of their daily life. But two I've been really happy with our the way our partners have worked with us, Instacart and DoorDash in particular, on helping us break into new markets, find new customers on their platforms, and drive growth. And that's growth through targeted marketing opportunities, through targeted sponsored price investment, and continue to grow the business and basket there. And the last thing I'd say is the good news about e-com for us is it's an omni-channel customer. And so when we grow that business and grow that customer base, most of those customers are shopping in-store, and those are most valuable customers, and so it's really healthy for us to see that growth on the e-com side.
Operator
Thank you. Our next question will come from the line of Christina Katai from Equity Research Analysts. The line is open.
Hi. Good afternoon, and thanks for taking the question. So, Jack or Nick, you talked about leaning into foraging and the launch of 100 new items so far this year. Just curious, what is the team targeting as a percentage of newness for the balance of the year and just how that breaks down across opening price points versus more premium price points? And are you seeing competitors move faster on similar attributes-based products, just thinking around trending areas like protein forward offerings?
Well, I think everyone's seeing the trends, Christina. I think one of the advantages, and I think we talked about it in the script a little bit, is that I think we're being seen as the place to launch these products going forward. We've got, when you walk around the Expo West and the whole place is buzzing around, can we get into Sprouts or not? And we get, I think we got 65,000 applications to bring SKUs to, bring products to our business last year. We're only able to manage 7,500 of them into the space. So, but we don't have a specific target in terms of a percentage. What we've got to do is use these innovative and entrepreneurial new brands to continue to excite our customers. The innovation center that we have is working really well and continues to get better. And that's been one of the features that we've brought into the stores over the last couple of few years. And it's getting better in terms of how we manage that. So I think we've got a great reputation with the vendor base. We don't have specific targets.
And we've got to continue to reinvent ourselves. and that's kind of the role that we have in terms of this space and I think a lot of people would view Sprouts as the right place to launch these products you know yeah no I the only thing I would add to Jack's comment Christina on yours is Nick yeah we don't necessarily have targets but I think we are going to expect to be able to launch as many new items this year as we have in the past we've developed a really great capability capacity between our foraging teams and our category management teams to take that massive influx of interest, work with partners, and identify the best items to launch. So we are going to continue to do that as we be the – hopefully, you know, serve the customers the most innovative and health-forward retailer in the market. And then you asked about balance. The good news, I think that's a focus for us as part of affordability is how do we innovate across all categories and all price points so that everybody can experience the right healthy options for them and based on their preference and because of the depth of innovation available to us i think we've got a lot of great options that are good for our customer and also remain distinctive from what else is out in the market that um you know buffers us from competition and price great color thank you and if i can just follow up you're you're sharpening your marketing to highlight what makes sprouts unique are you at all planning to to change the percentage that you're allocating to marketing spend in 2026 or any of the key channels, just thinking digital, social, that
has worked really well for you, and just, you know, you're tying that in with the messaging around affordability, just, you know, sort of how should we think about, you know, what has been achieved on that front versus what is still to do for the balance of the year?
Thanks, Christina. I appreciate you noticing. We're working hard at bringing what makes Sprout Sprouts to market and talk about the unique, differentiated items and our store experience that sets us apart. So you'll see us continue to lean into that positioning. And I would tell you, I think you'll expect to see that even stronger in how we go to market and position ourselves against who we are, which is the best place to help you live and eat better. From an investment standpoint, no, we're not planning on making any incremental investments in marketing. I don't think we need to because we have a lot of an opportunity to be more efficient in how we market. And I think we've got the tools in place as we build on the brand capabilities to do that. And to your point, certainly we'll continue to look at where in the media funnel we invest and in which geographies that drive new customers, that drive the right customer into the store, and that balance that awareness and traffic. So we'll continue to do that. And I think there's more opportunity in the back half of the year for us to get even smarter with our media.
Speaker 8
Great. Best of luck.
Operator
Thank you. Thank you. And our next question comes from the line of Robbie Ohms from Bank of America Securities. Your line is open.
Oh, hey, guys. Thanks for taking my questions. The first one, I think I might have missed it, but did you guys give the exact traffic and ticket comps for the quarter?
Hey, Robbie, not specifically, but, yeah, traffic or basket was positive, low single digits, and traffic was negative in the offset there.
Thank you. And then the Long Island store, any color you can give us on how that has come out of the box relative to expectations?
Well, I was lucky enough to be in there a couple of weeks ago. We've got a great team in there, and we're definitely going into new markets. We're establishing ourselves in a place where people don't know us. So the marketing team, as Nick alluded to earlier, our new stores have been doing a terrific job on it. It started well for us. I'm really pleased with the team. It'll take a little bit of time. We're ahead of where we thought we would be. This thing could, we've got a lot more stores coming. One of the things about stores on islands on their own, not just Long Island, but on islands on their own is how do you bring critical mass by having a few more stores? And over the course of the next 18 months, we've got a number of stores coming in Long Island, which will strengthen our marketing and strengthen our communication and our brand. But it's kind of, it's been really exciting to go to a new market. and we've got more of them coming as we look through the next 18 months. It'll be a similar challenge for us when we go to Chicago, similar challenge when we go to Boston, and we're learning a lot from what's happening in Center Reach, which is a store in Long Island.
That's really helpful. And maybe my last question, just Jack, the foraging team, we obviously don't expect you to give specifics, but are they seeing anything on the horizon that could reignite some momentum for sprouts?
Well, I think the trends that are applying, and I'll let Nick comment on it as well, the trends that we're chasing after, just like everyone else's, the protein trend's a big one, the fibre trend's a big thing, and there are some other things coming down the track at us in terms of health and wellness, particularly in the supplements business and in the vitamins business in terms of brain health and those kind of things. So there's a lot of trends happening. And our team, we think we've invested in a really strong team over the last couple of years, and we'll continue to invest more so that we're ahead of the trends. And it'll link a little bit. When celebrities launch products and make a big deal of it, that's something that can stimulate demand pretty quickly. So we're kind of working pretty closely with a number of kind of interesting people that come to see us. And so there's personalities and there's lots of trends within that.
I think that's well said, Robbie. The only color I just would add is I think the part of this is how do we work with a lot of these new brands to help bring their brand to life and make them even stronger than they are on their own? And the other piece of it is I say that we will also miss. We really push hard in finding brands that nobody else has seen. And there'll be times where they don't hit, but that's part of our DNA. And I think we've got, because we're the best place to launch brands, our odds of getting those that really go big and viral are as best as anybody in the industry because of the way we launch brands and how early we are to do so.
Operator
Thank you. Our next question will come from the line of Kelly Bania from BMO Capital Markets. Your line is open.
Thanks for taking our question. I wanted to go back and ask just another one on the price adjustments and the more focused promotions. are you able to quantify the growth impact of what's the planned investment for 2026? And I'm just trying to understand if there's a shift of any dollars or how much is incremental. And then can you also help us understand the parameters for these tests, meaning is the goal to just get back to a specific level of traffic and then you would back off of these investments? Or is this more of something that we should think about evolving in years to come? Because without a specific price gap or, you know, level of pricing that you're targeting, you know, where do you find completion with this initiative?
A lot in that. You know, so I think, no, probably won't quantify too specifically other than to say kind of what we said earlier, which is we do, you know, we've been investing in the business. and a lot of those things have shown up in gross margin favorability, and we still have tailwinds from those investments. And so we're thinking about it, you know, much more as a shift, so to speak, if you use that term that you use, from those things that would have provided a little bit of favorability to now funding some of the affordability actions and helping out the customer. So that's definitely how we see it as we think about the different things we're testing. Again, it's a test, so I don't want to get too specific about what that impact may or may not be, but assuming that the majority of that rolls out, that's kind of how we're thinking about the back half of the year, and we want to see the response from the customer, you know, item and category and all the different things we're trying, and, you know, we'll put some things into action in the second half, but we feel like we've got the funding to do that within the guidance, you know, based on some of the things that are coming in, and we talked earlier about things ramping up like, you know, participation in the loyalty program and some of the offsets that come from that data and from working with the vendors in that space to drive the business together. So we've got a few levers there to help support that effort. And that's kind of what's baked into the plan for the last part of the year. I think, and then to your longer term question, that's how we think about it in the longer term too, right? Continue to make the business better, to continue to mature our processes and how we go to market and, you know, watch elasticities, follow our pricing strategy in order to deliver great value and affordability for the customer. So that's how we'll continue to think about it beyond 2026.
Okay. And can I just also follow up on the SG&A growth, just the 5.6% there? Can you help us understand what is kind of happening at a same store operating expense level? And And, you know, if you kind of lap this next year, would you need to reinvest any more back into SG&A this year or next year?
Yeah. You know, I think the trends have been good. Like we've started to see some real progress in the cost work that we do impacts all the stores. And so we talked a little bit earlier about, you know, bringing down that leverage point from the four we talked about historically. And it just comes down to investment. If we see great, great things to invest in the business, typically there's an upfront there, you know, in resource or technology to build a capability. But we would only do it if we were going to see benefit on the back end. And so it's a little bit TBD as the year evolves for 2027 and what we might be thinking about from an investment perspective. but certainly we feel like we can get SG&A kind of back to close to stable as we get to the latter part of the year and we start to get back into our algorithm, you know, and then we'll start to think about next year and where we need to make investments to continue to drive the business for the long term.
And on a store-by-store basis, we're getting much more efficient in running each individual store, if that was the question you were asking. We made a load of progress in being more efficient in operating the stores, and that's something that will flow through both in the new stores and the existing stores going forward.
Operator
One moment for our next question. Our next question comes from the line of Jacob Aiken-Phillips from Milius Research. Your line is open.
Hey, good afternoon. I wanted to ask an inflation question because there's growing concern that increased fuel costs will flow through the petroleum and fertilizer markets are disrupted, some drought conditions. I know you're not seeing that yet, But can you talk us through, like, how the business would perform under different inflation scenarios, like low inflation, like normal and then an elevated level?
Yeah, Jacob, this is Curtis. I mean, you know, again, every, I think every version of that is a little bit different. I can point back to when the last round of significant inflation and, you know, 22, 23, where we saw our business continue to accelerate and we had a lot of things going on that were moving the business. as we reshaped our strategy, you know, I think it's a lot of, you know, nobody quite knows exactly how that's going to play out. And, you know, we'll manage it when it comes, if and when it comes. And, you know, I'll talk to Nick a little bit about how we would manage it if it came through. But, you know, we've seen different versions of that over the years, and the business has been solid throughout.
I think the important thing in an inflationary environment is that we do what we do well. We've got to be serving our customers really well in terms of the health and wellness agenda that i do think is relevant irrespective of inflation deflation people want that want to eat healthy want to eat healthy and one of the dynamics that i think is a little bit of a moat for us is that we're not as prone to being affected by big inflation or not inflation whether that's going to happen or not who knows i think the fuel things and the fertilizer things are all a little bit uncertain how it's going to play out but we'll certainly be very conscious of taking care of our customers and making sure we're giving people access to affordable health and wellness products within the assortment that Nick's been talking about in the call today. And it's something that we'll pay a lot of attention to. We take our responsibility of helping people live and eat better seriously. And that applies whether there's inflation or deflation.
And my second one is, you have a strong growth in attribute-driven categories and some pressure and the more commoditized ones can you walk us through how we should think about the mixing implications of that for constant margins over time and then you just have to follow up are vitamins and supplements committed absolutely driven or more commoditized all right so you've asked a lot of questions there there's a lot of good ones as well let me just start off with vitamins and supplements is such an important category for us because we've got great people who can give you great advice and i'd invite any of you to go and ask our people in the store
about how they can advise you on that, and it's less commoditized because of that, you may be talking about the other stuff.
I mean, overall, you know, the core of what we do is stay differentiated and focused on core attributes, and that's what we'll always do and focus on. And if things do start to become more commoditized, that's when we then pivot and find different brands, different offerings to stay differentiated. From a margin profile standpoint, the margin mix of our business is pretty consistent. There's not a massive gap between category or attribute that would have a real meaningful impact, Jacob, on our mix with those shifts. Again, small things here and there, but nothing's consequential that you would see significantly flow through.
And we're unusual for a grocery store, if that's what we're described as. We're unusual in the sense that our margins are pretty consistent across the different categories. we don't have really low margin high volume branded goods so the mix is more consistent and that makes one of them one of the uniquenesses of our business is that margin mix profile great thank you thanks thank you our next question comes line of John Hainbuckle from Guggenheim your line is open hey guys quit sort of an all-encompassing question here but I think last quarter, we talked about emerging health enthusiasts as a cohort.
How important are they, right, to the business, to the growth? How are they behaving, right?
And then what are they reacting best to in terms of your desire to, you know, help them out affordability-wise?
Yeah. Hey, John, it's Nick. I think, let me start with, you know, we still feel really strongly you about the overall market, right? We've talked about our $200 billion health enthusiast market, whether you're new in the space or been there. I think that provides a lot of opportunity for growth for us overall. From an emerging standpoint, I think, you know, we've been pretty happy in the past. We've seen good acquisition from, you know, younger or call it newer cohorts that that's you speak to and you know we're seeing things like protein uh one of the things we're seeing is non-alc is a big driver in that space and our we leaned into non-alc early about three years ago and and that continues to to drive and grow our business um a lot of the supplement space and so um you know the good news is because of the emerging brands we have that how we work with them on social i think we're well positioned to capture that customer and between that customer and the existing health enthusiasts, I think the market's in a really good place for us.
And just building on what Nick said earlier on the marketing, how we can get more sharp at communicating with these people as they come into that space. There are more, if the market today is 280, whatever we think, it's going to be bigger in the future. Our challenge is how we can really hone our message around that particular group of customers as they come into this space. Thank you. Thanks, John.
Operator
Thank you. And with that, this concludes the question and answer session. I would like to turn it back over to Jack Sinclair, CEO, for closing remarks.
Thanks, everyone, for your attention and your interest in our company. We're excited about the future going forward and look forward to updating you over the next few quarters. Thanks ever so much and take care.
Operator
Thank you for your participation in today's conference. This does conclude the program. You may now disconnect. Everyone have a great day.