Operator
My name is Angela, and I will be your conference operator today. At this time, I would like to welcome everyone to Trinity Capital's second quarter 2026 earnings conference call, which is being held on August 5, 2026. All participants have been placed in a listen-only mode, and the floor will be open for questions following the presentation. If you would like to ask a question at that time, please press star 1 on your keypad. If at any point your question has been answered, you may remove yourself from the queue by pressing star 2. It is now my pleasure to turn the call over to Ben Malcolmson, Trinity Capital's Head of Investor Relations.
Thank you, and welcome to Trinity Capital's second quarter 2026 earnings conference call. Speaking on today's call are Kyle Brown, Chief Executive Officer, Sarah Stanton, General Counsel and Chief Compliance Officer, Michael Testa, Chief Financial Officer, and Jerry Harder, Chief Operating Officer. Also joining us for the Q&A portion of the call is Ron Kundich, Chief Credit Officer. Earlier today, we released our financial results, which are available on our website at ir.trinitycapital.com. As a reminder, certain statements on this call may be considered forward-looking under federal securities laws. For a full discussion of the risks and uncertainties related to these statements, please refer to our most recent SEC filings. With that, please allow me to turn the call over to Trinity Capital CEO, Kyle Brown.
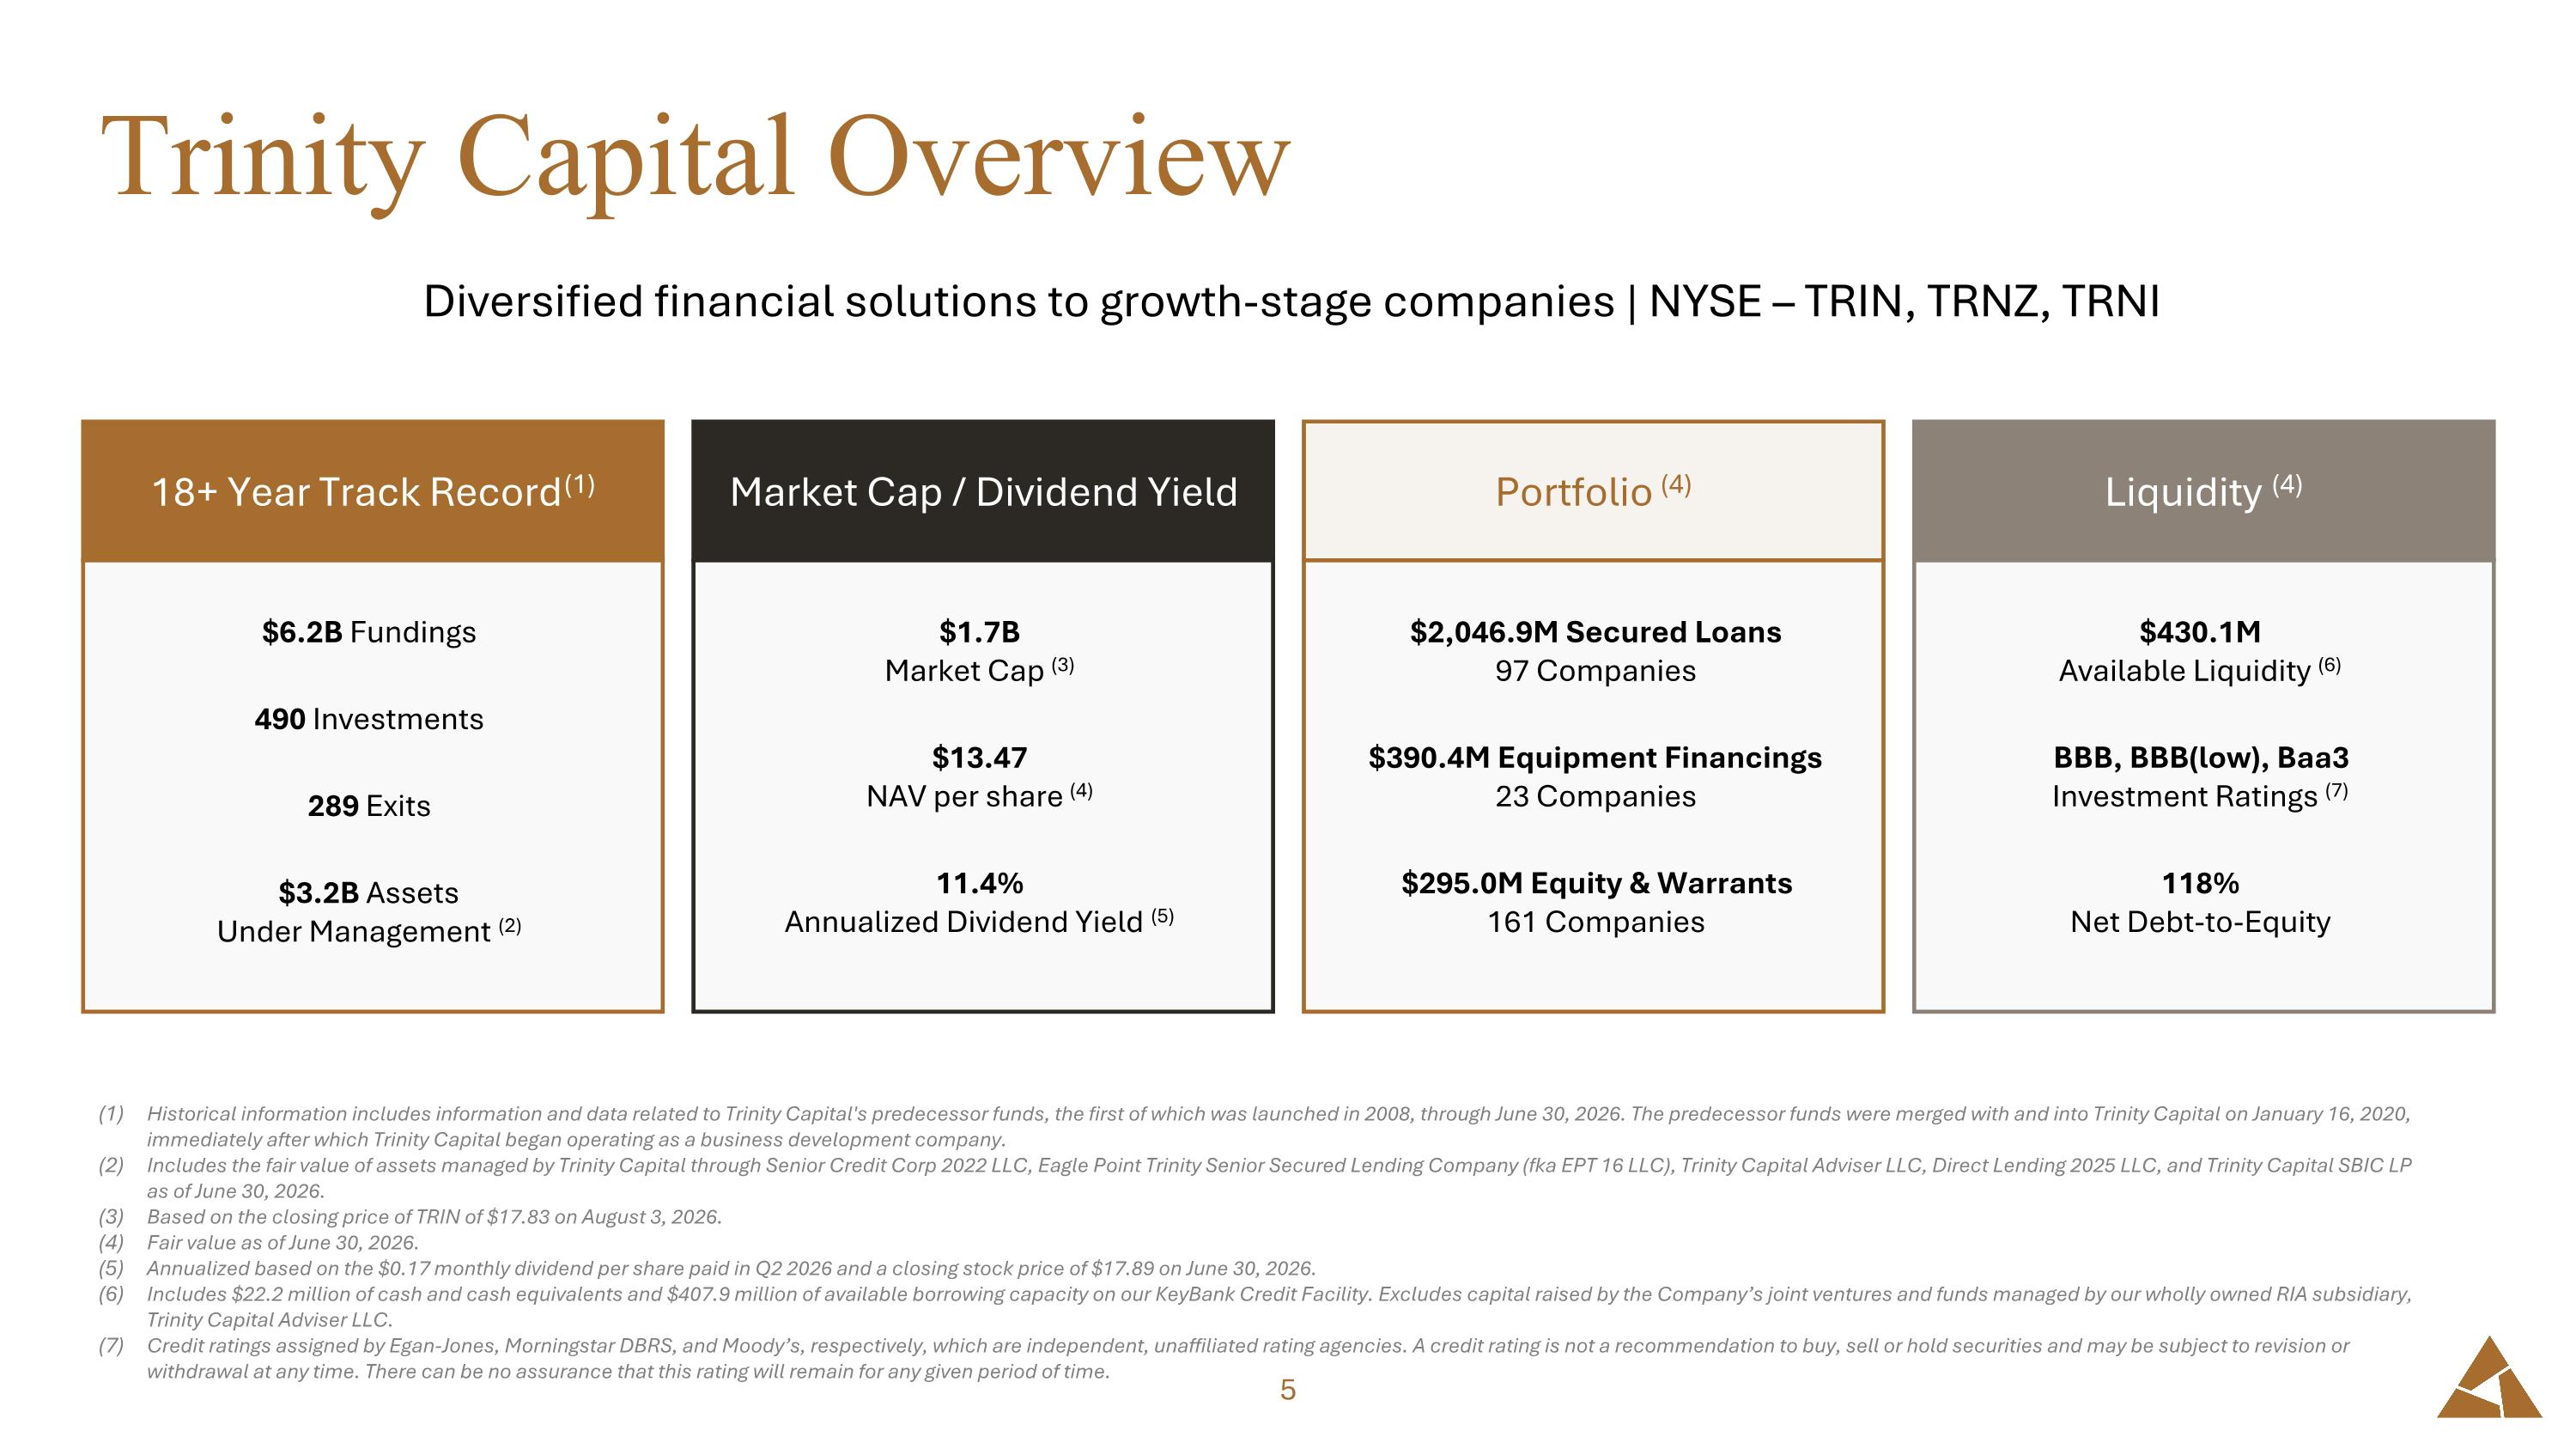
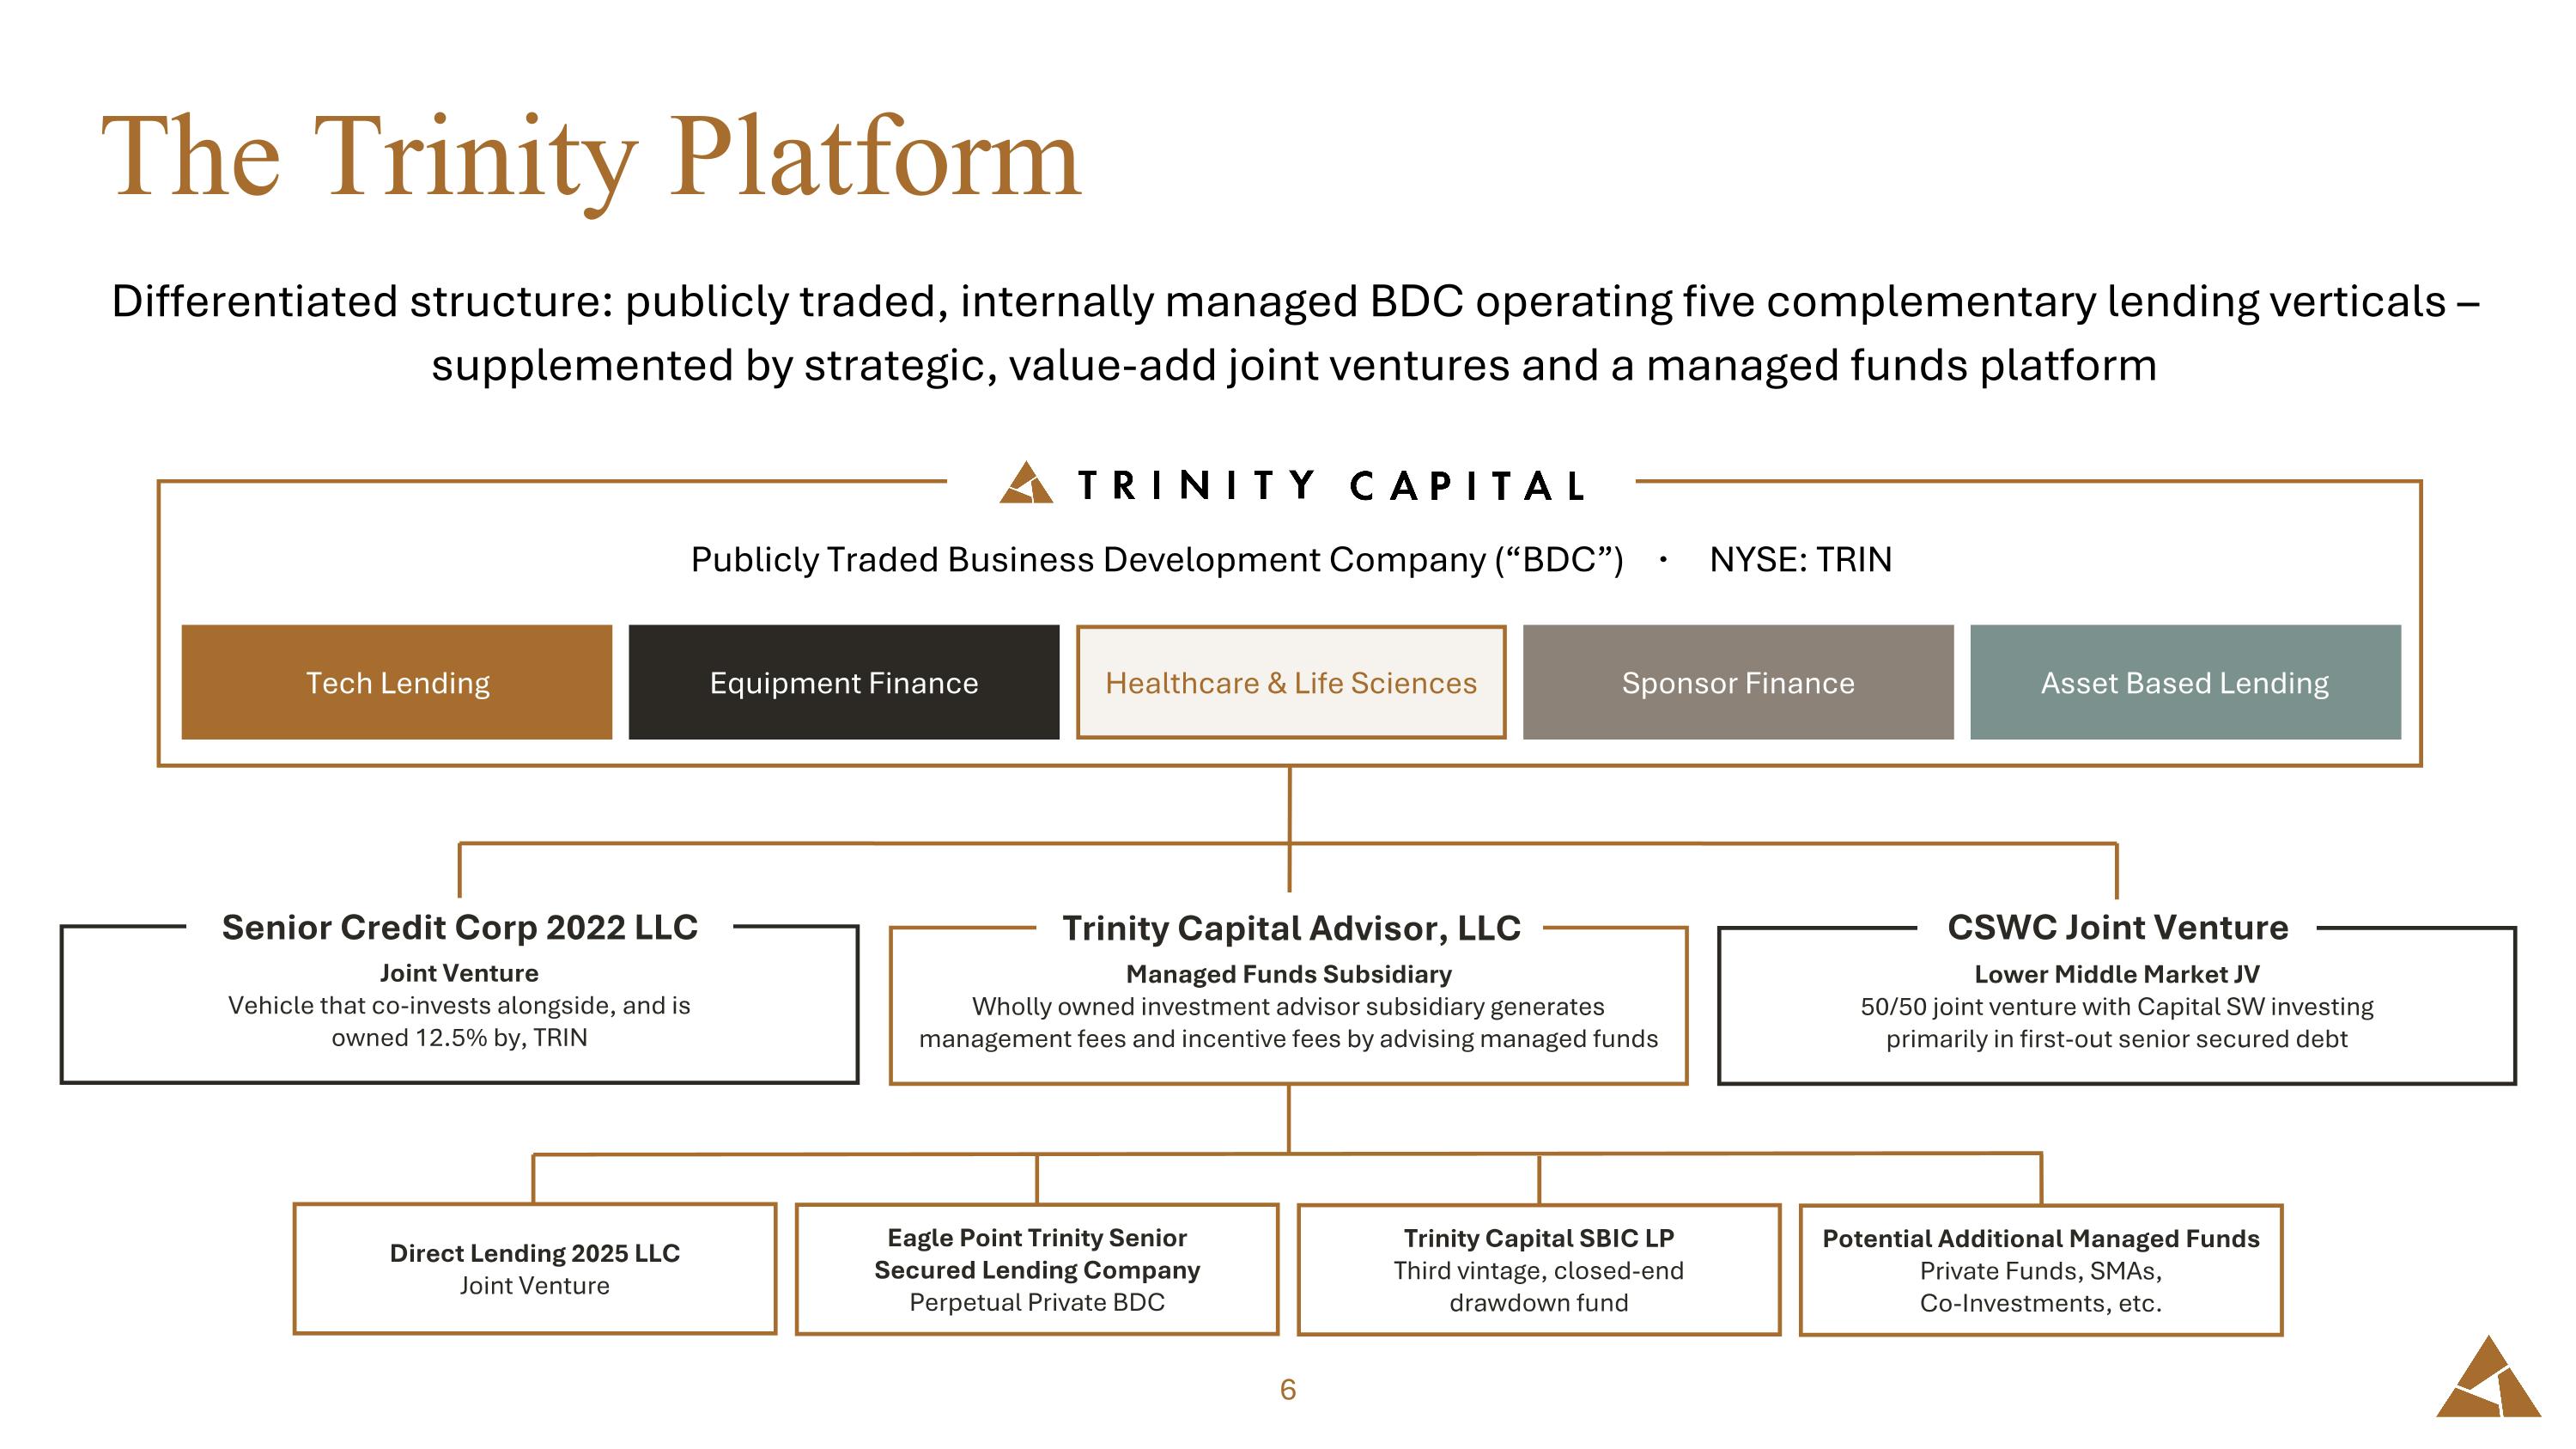
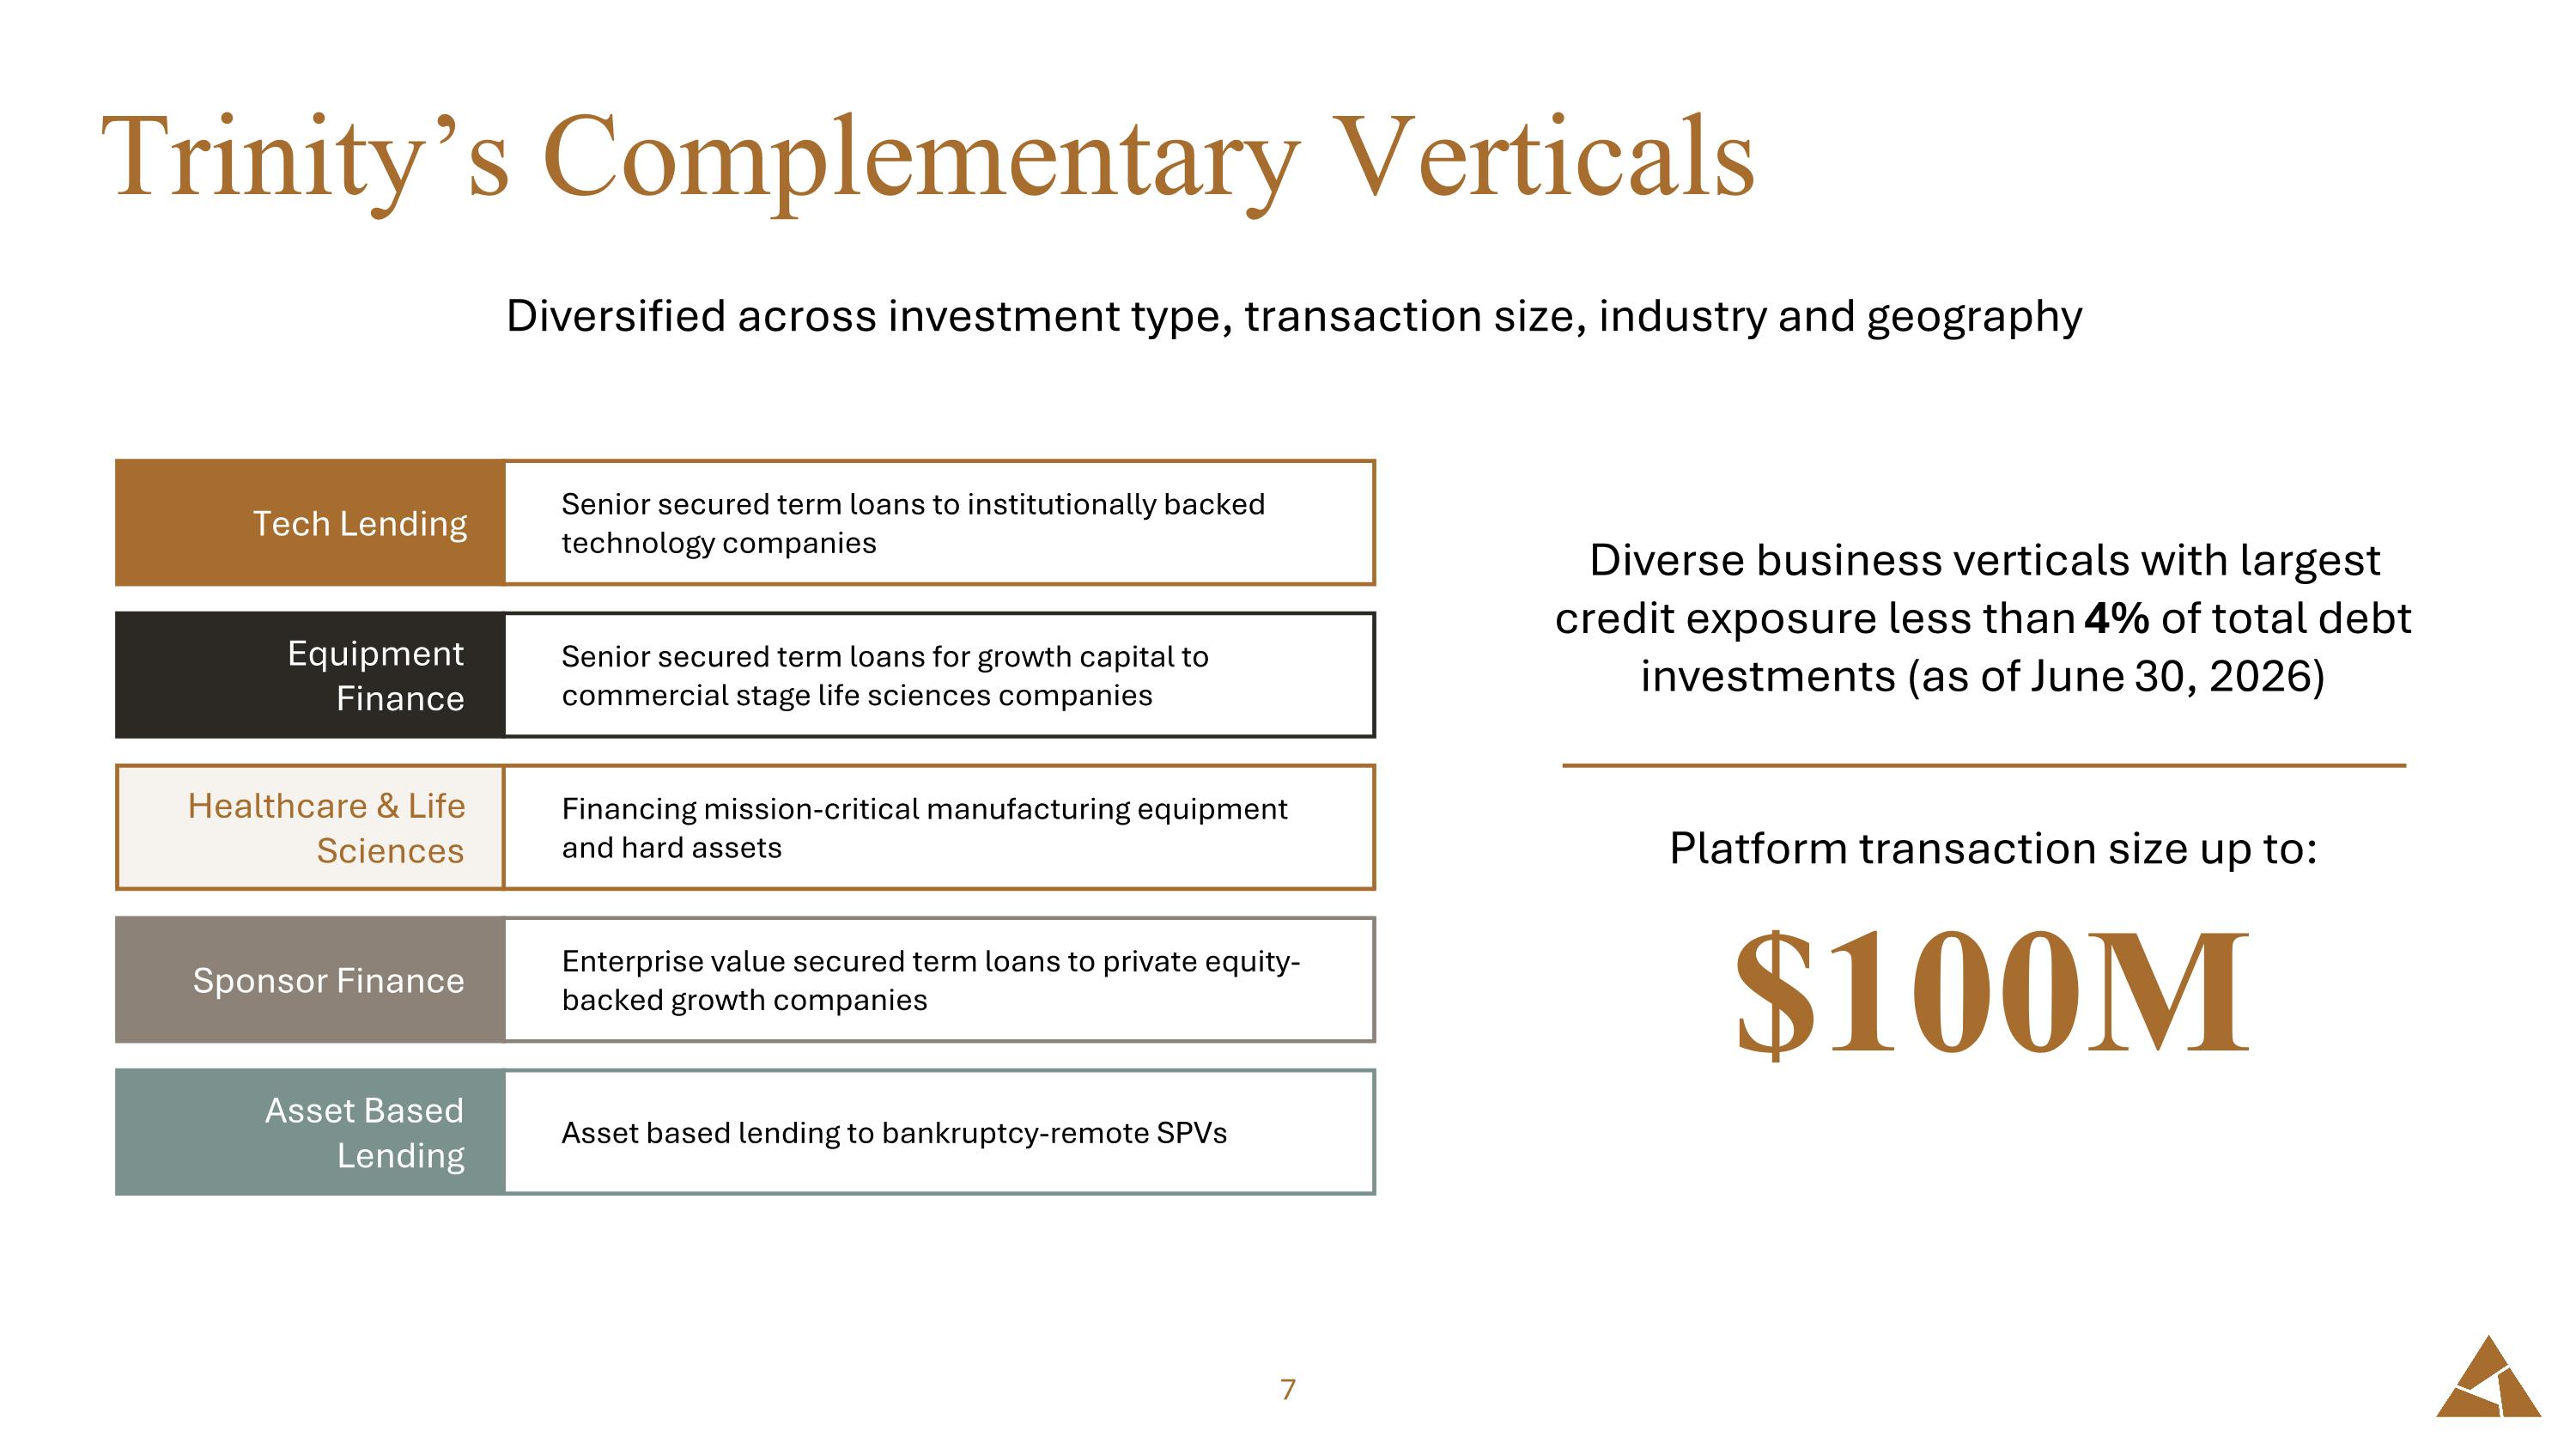
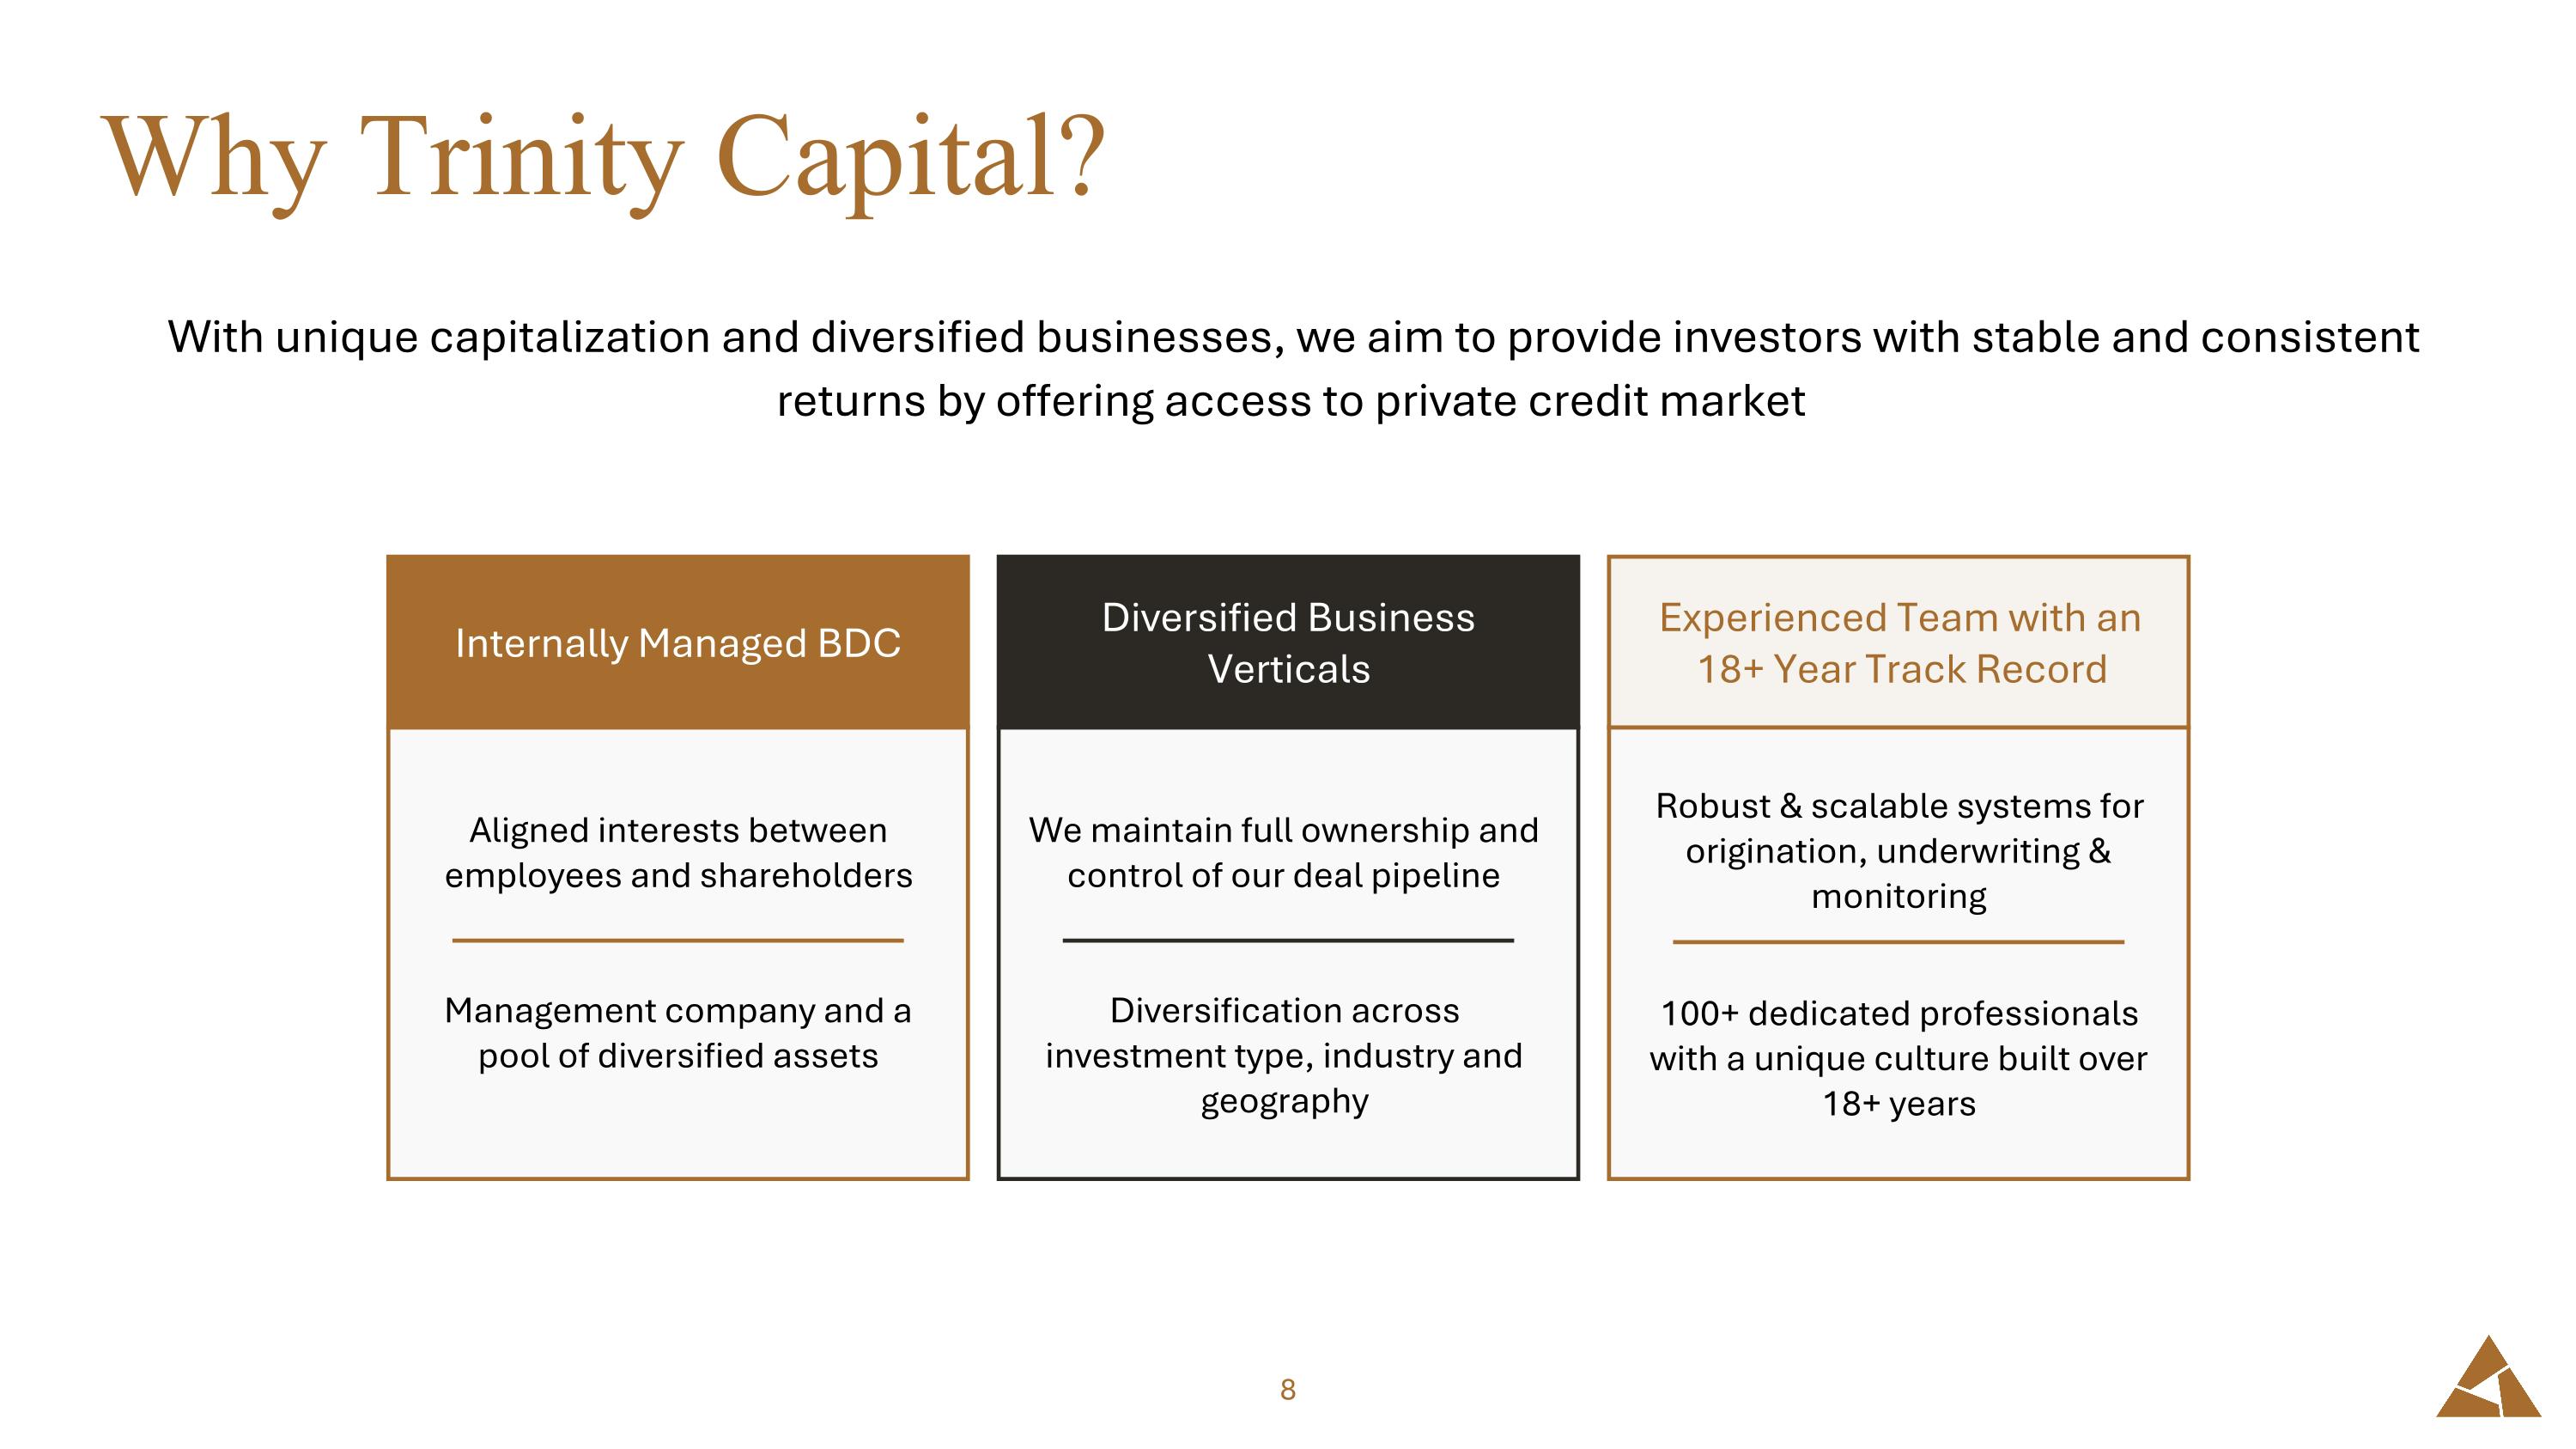
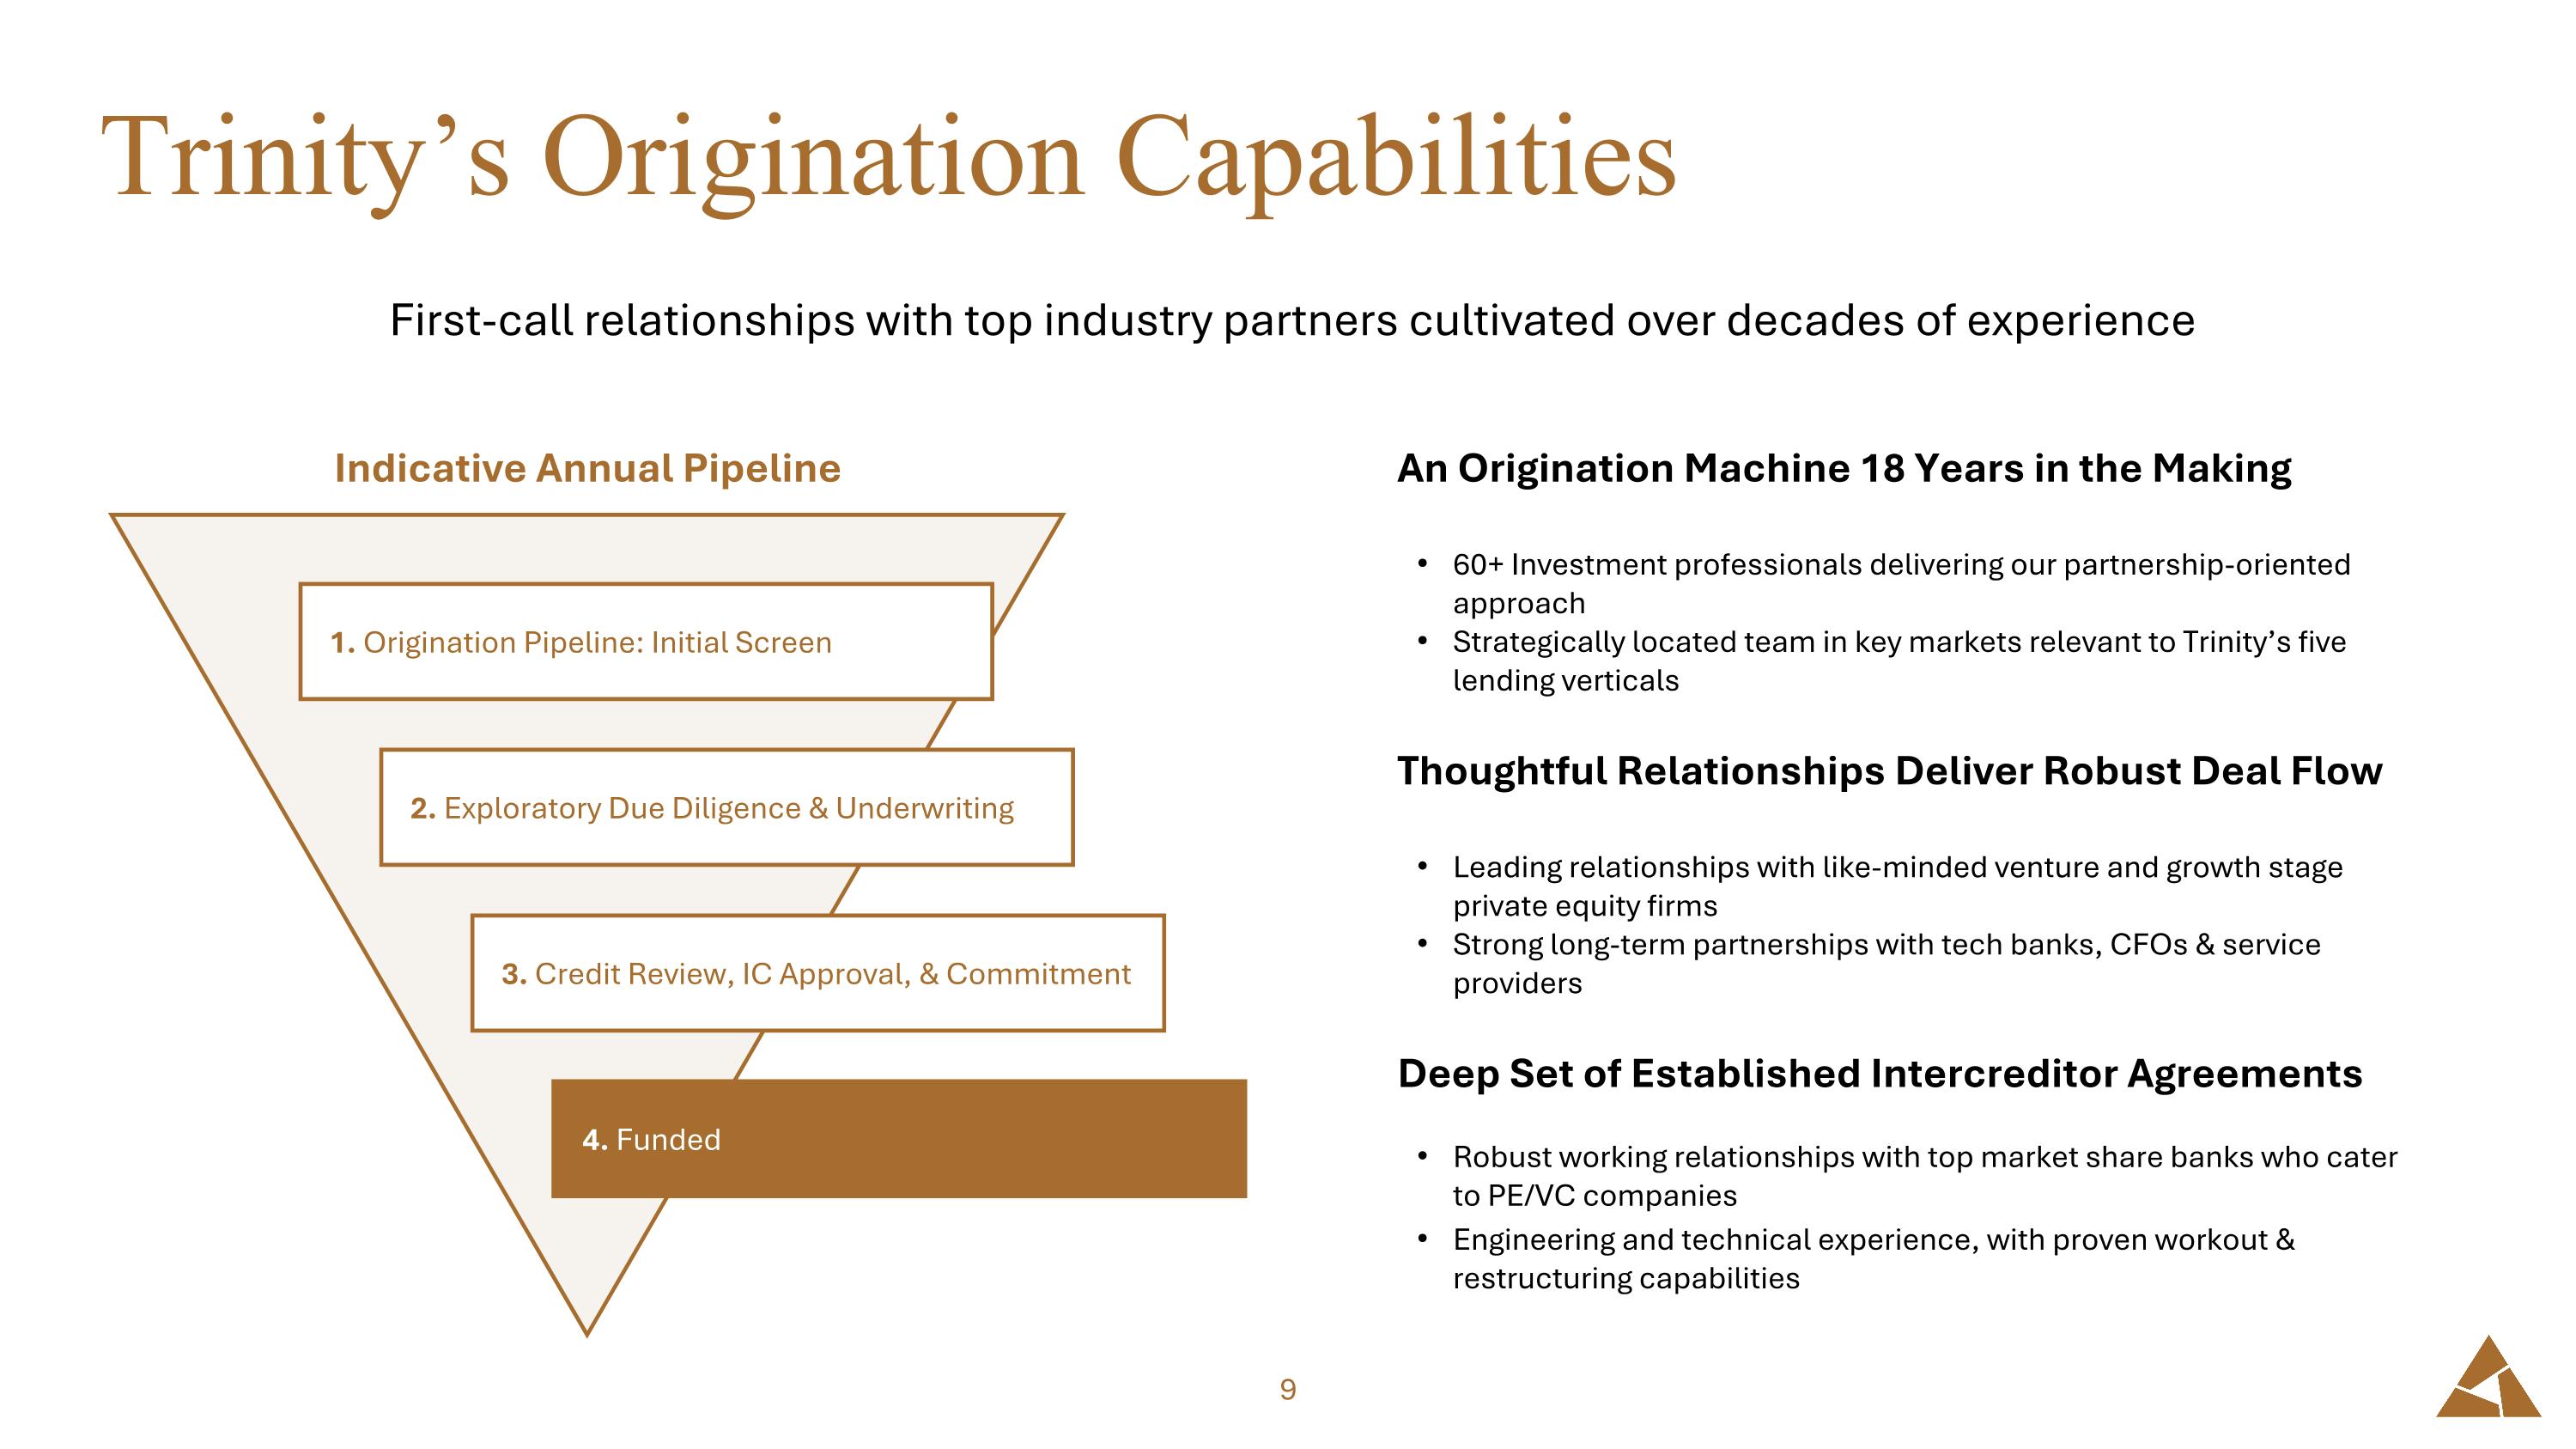
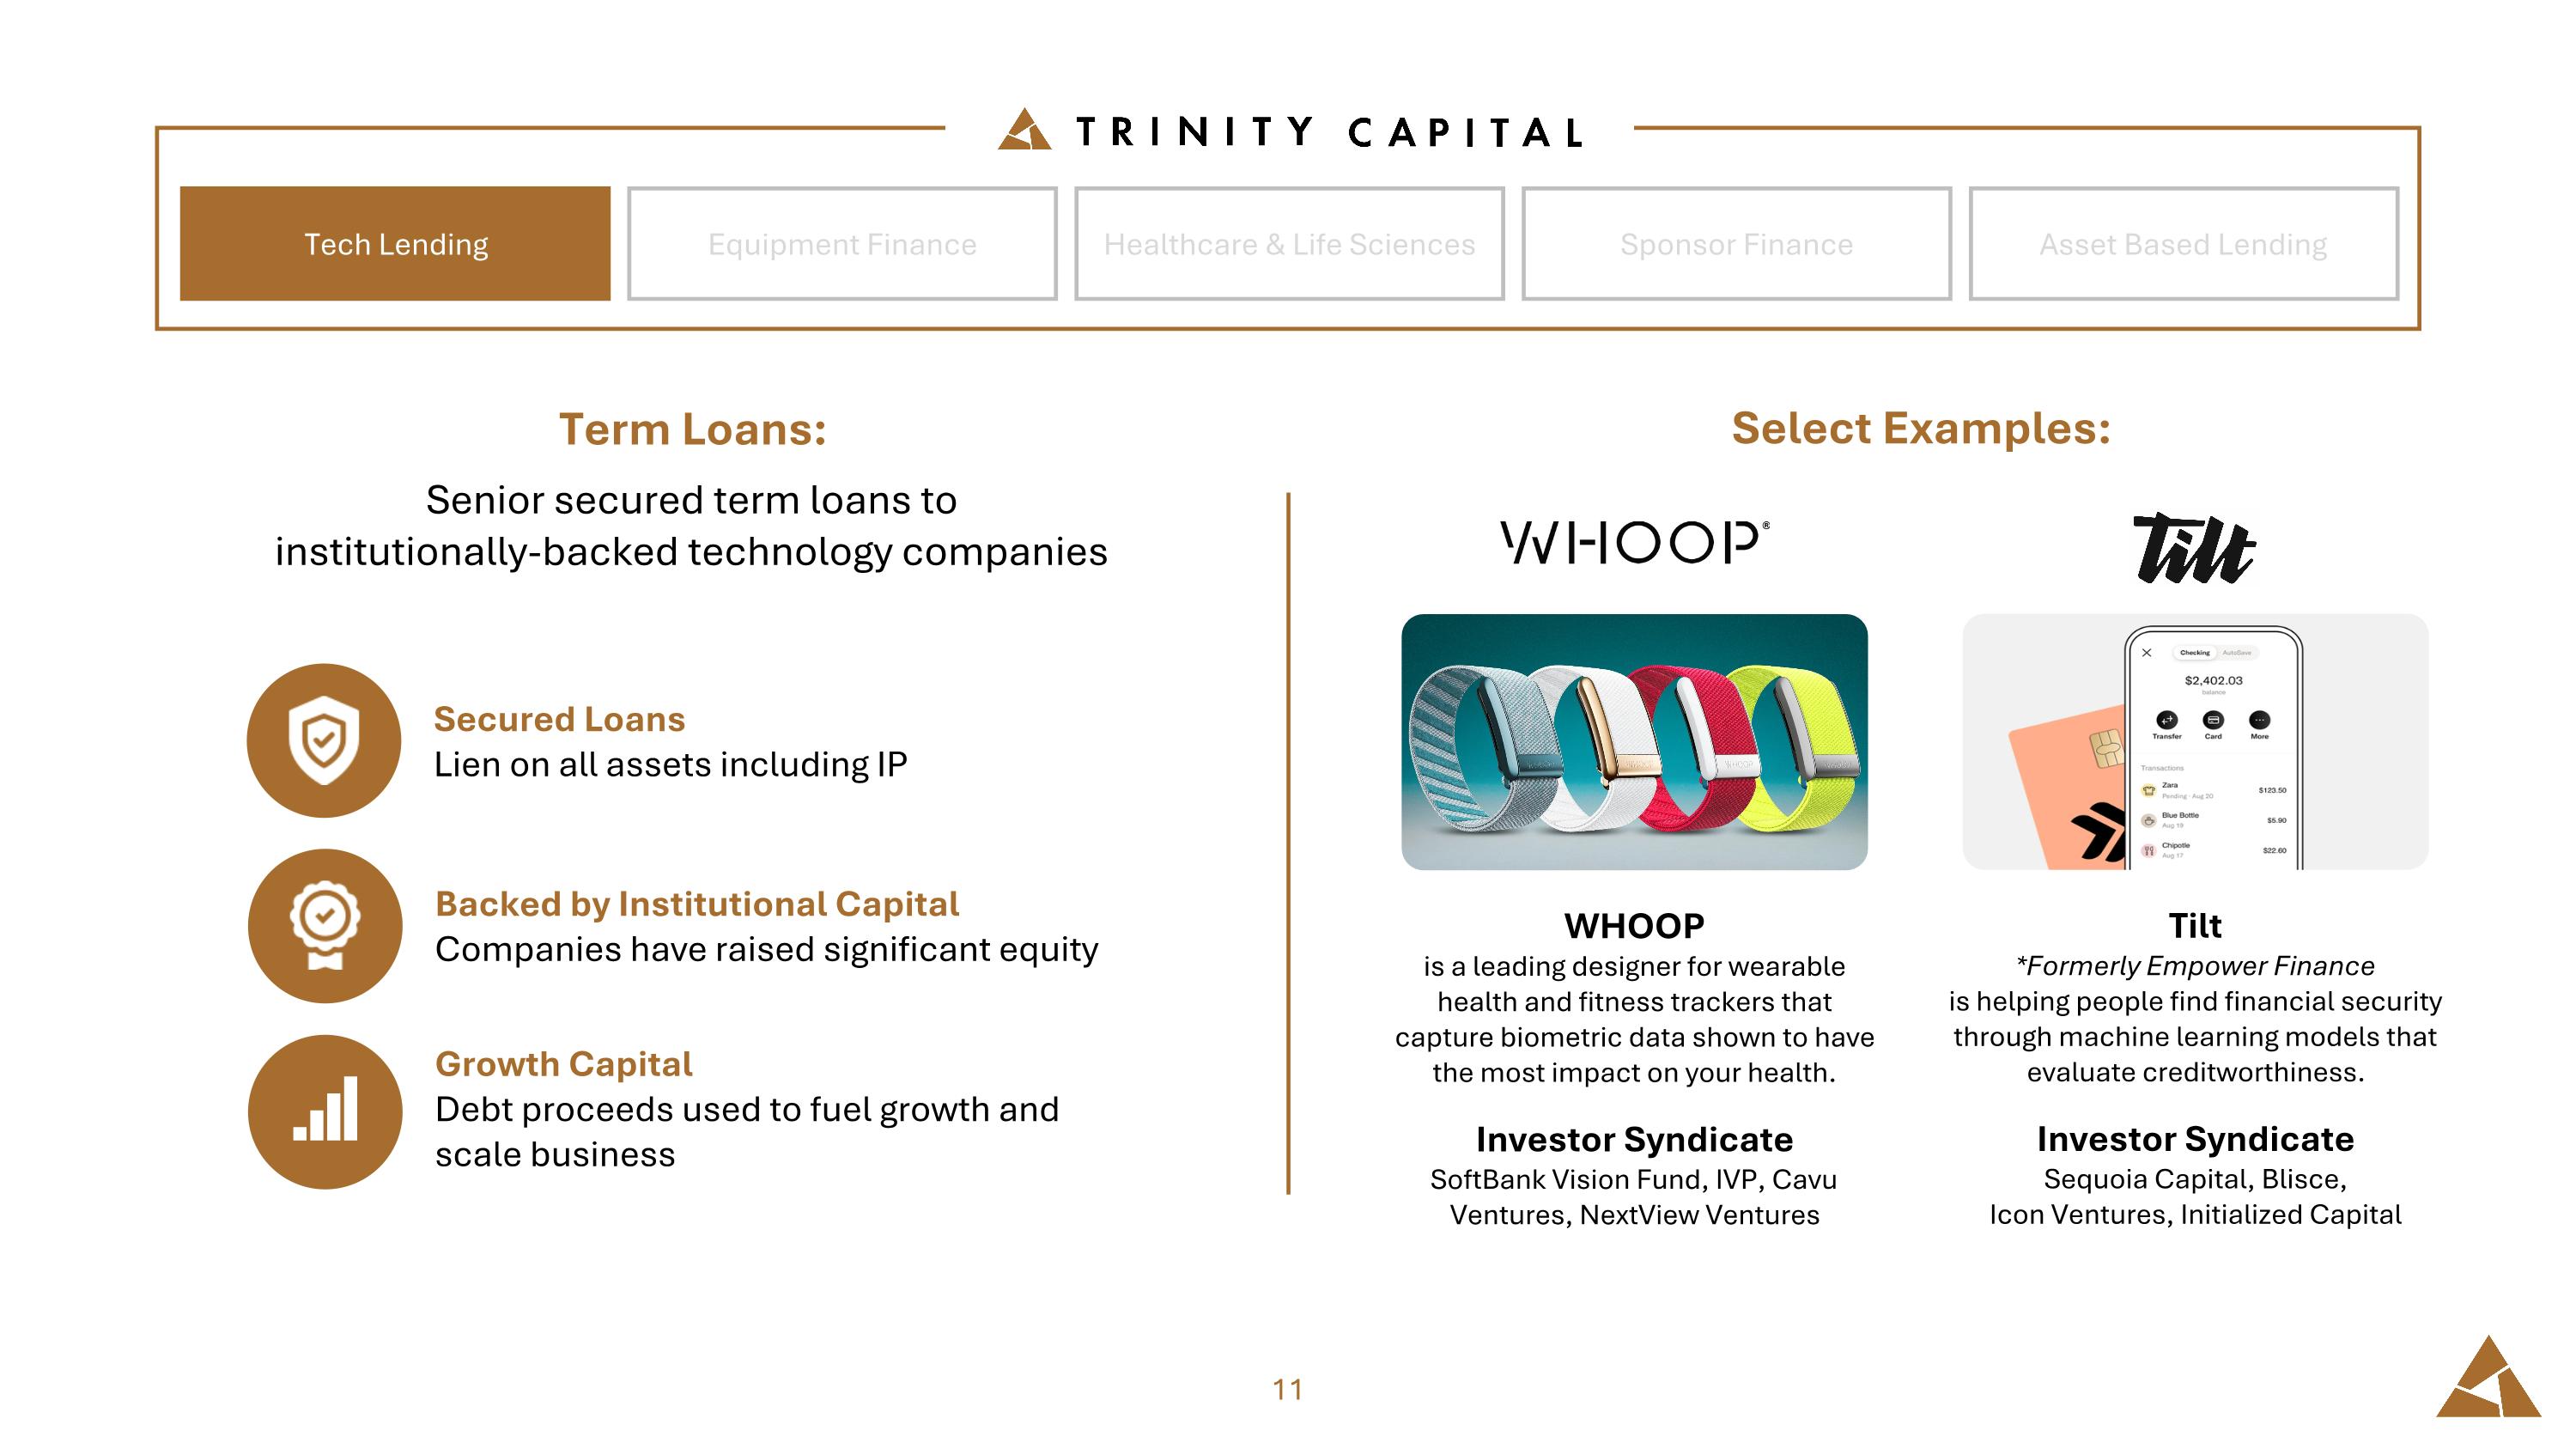
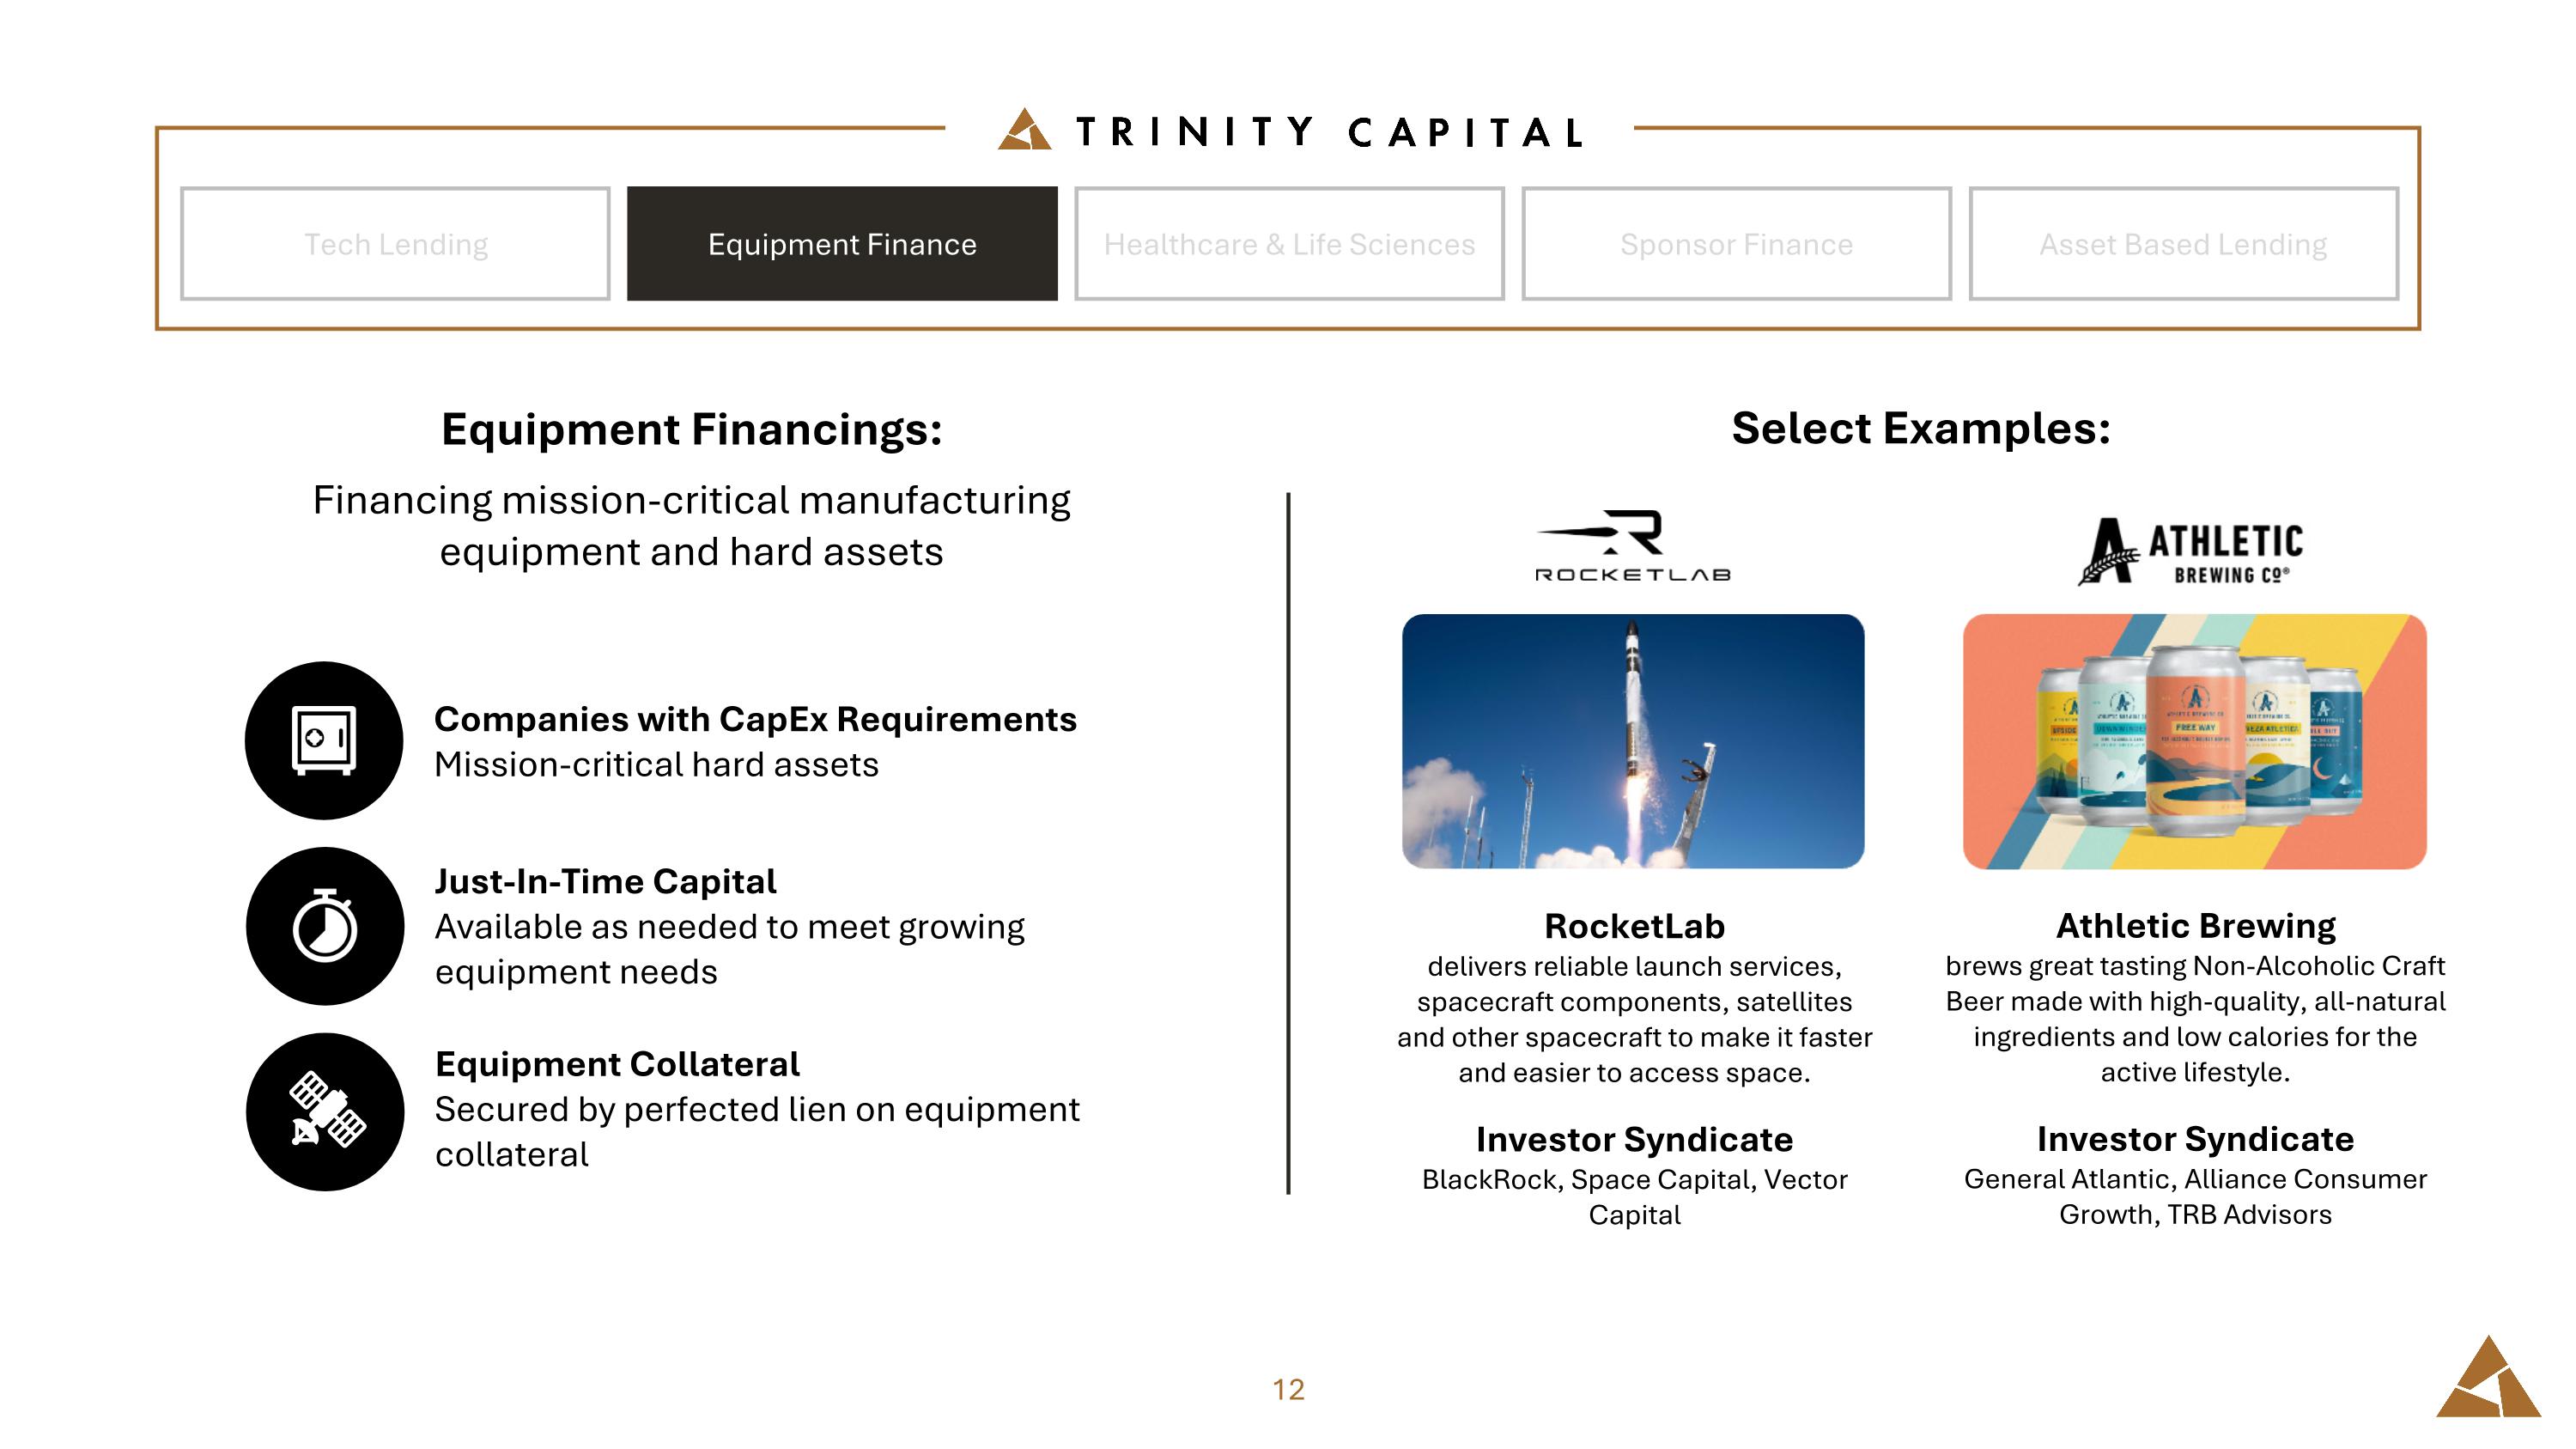
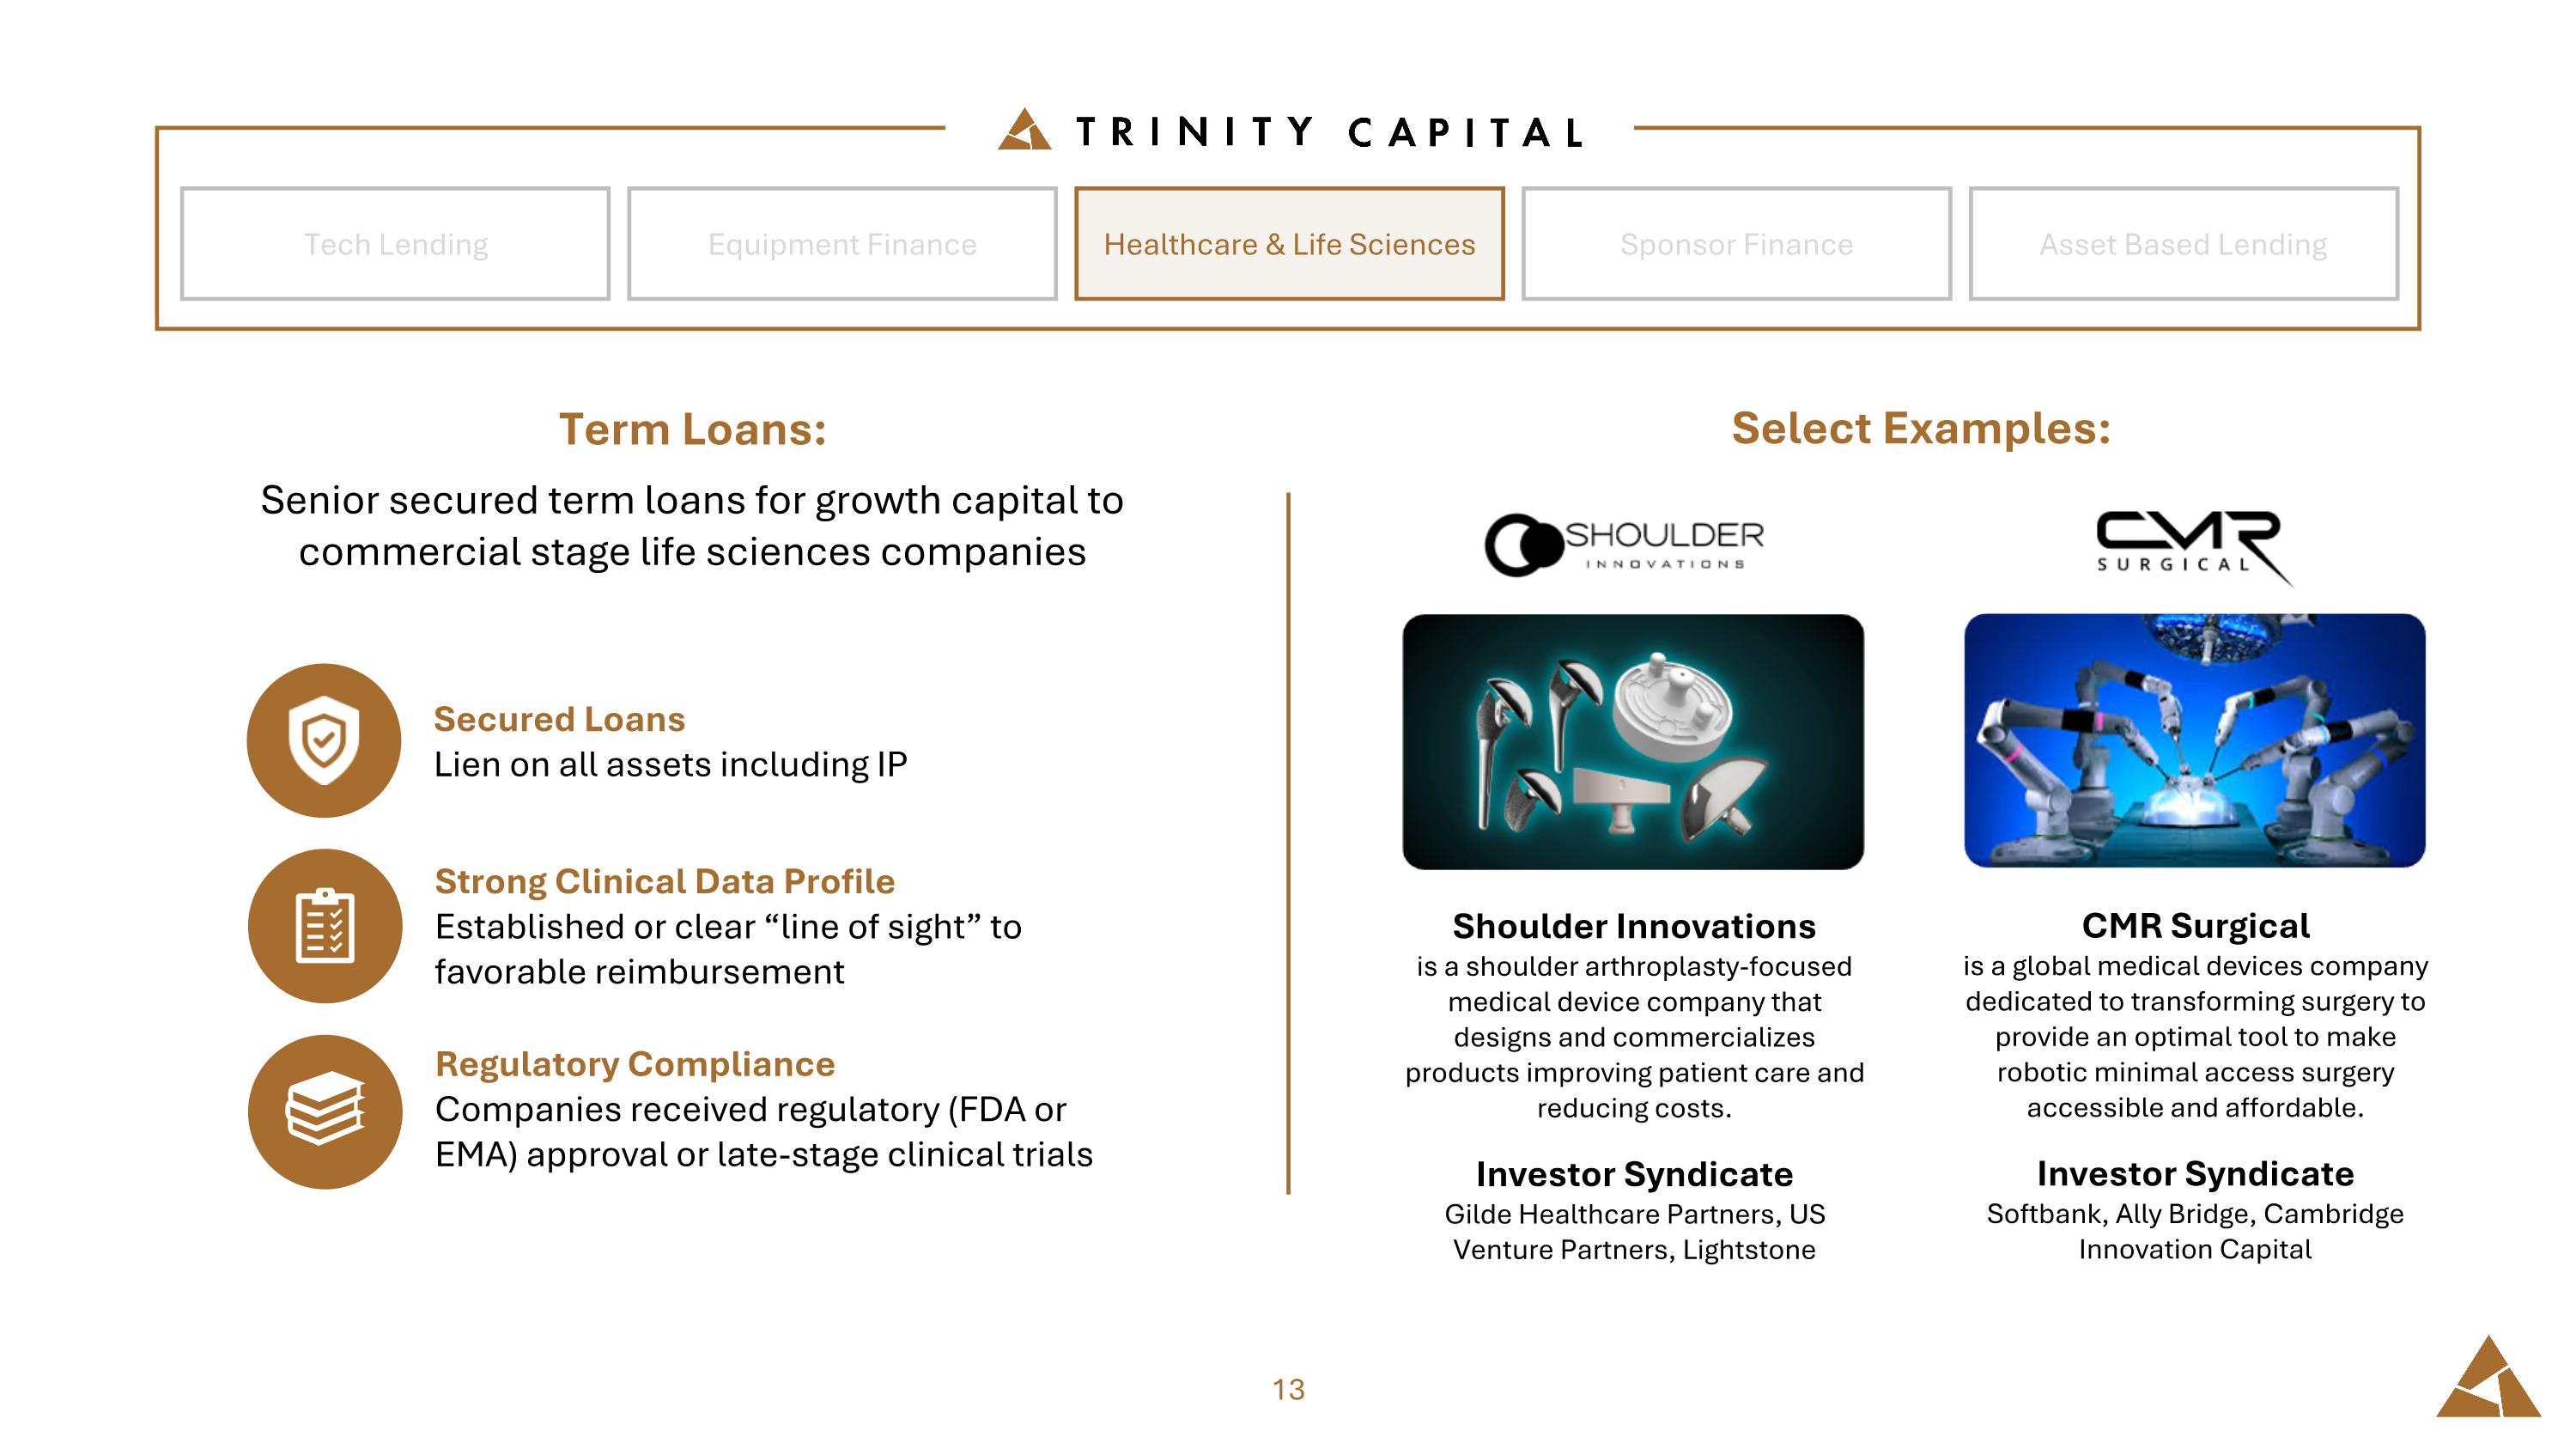
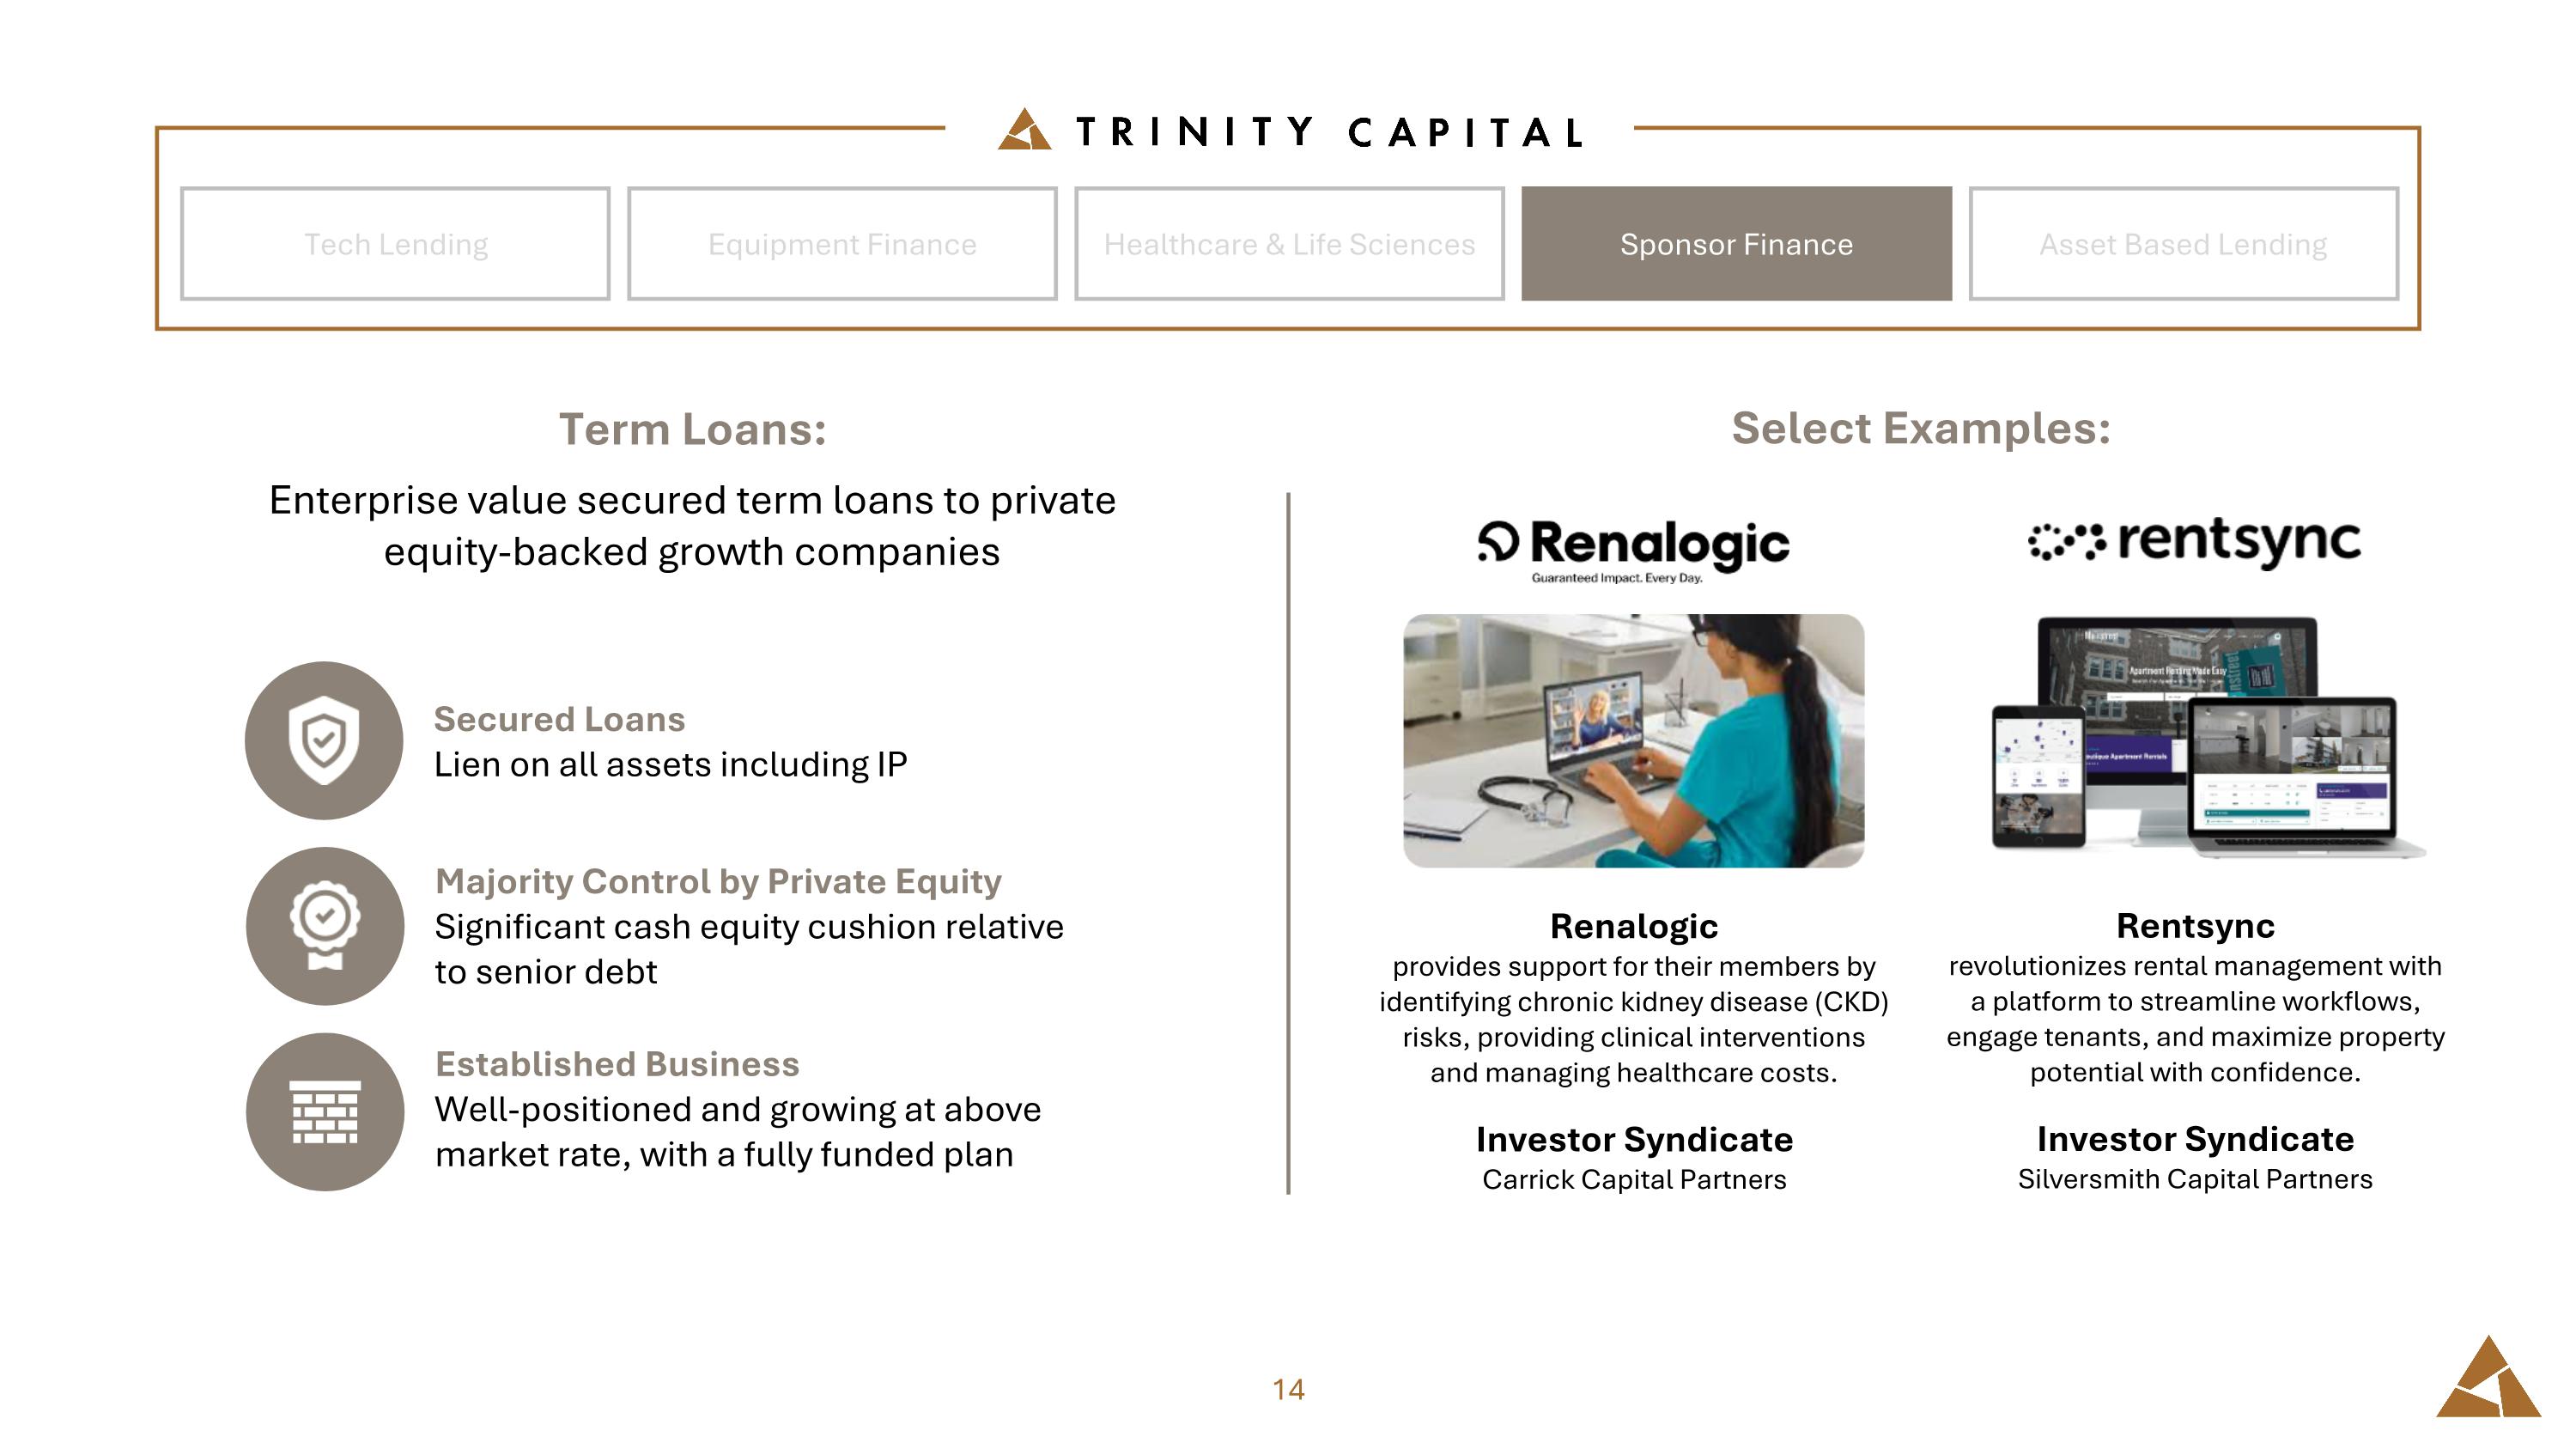
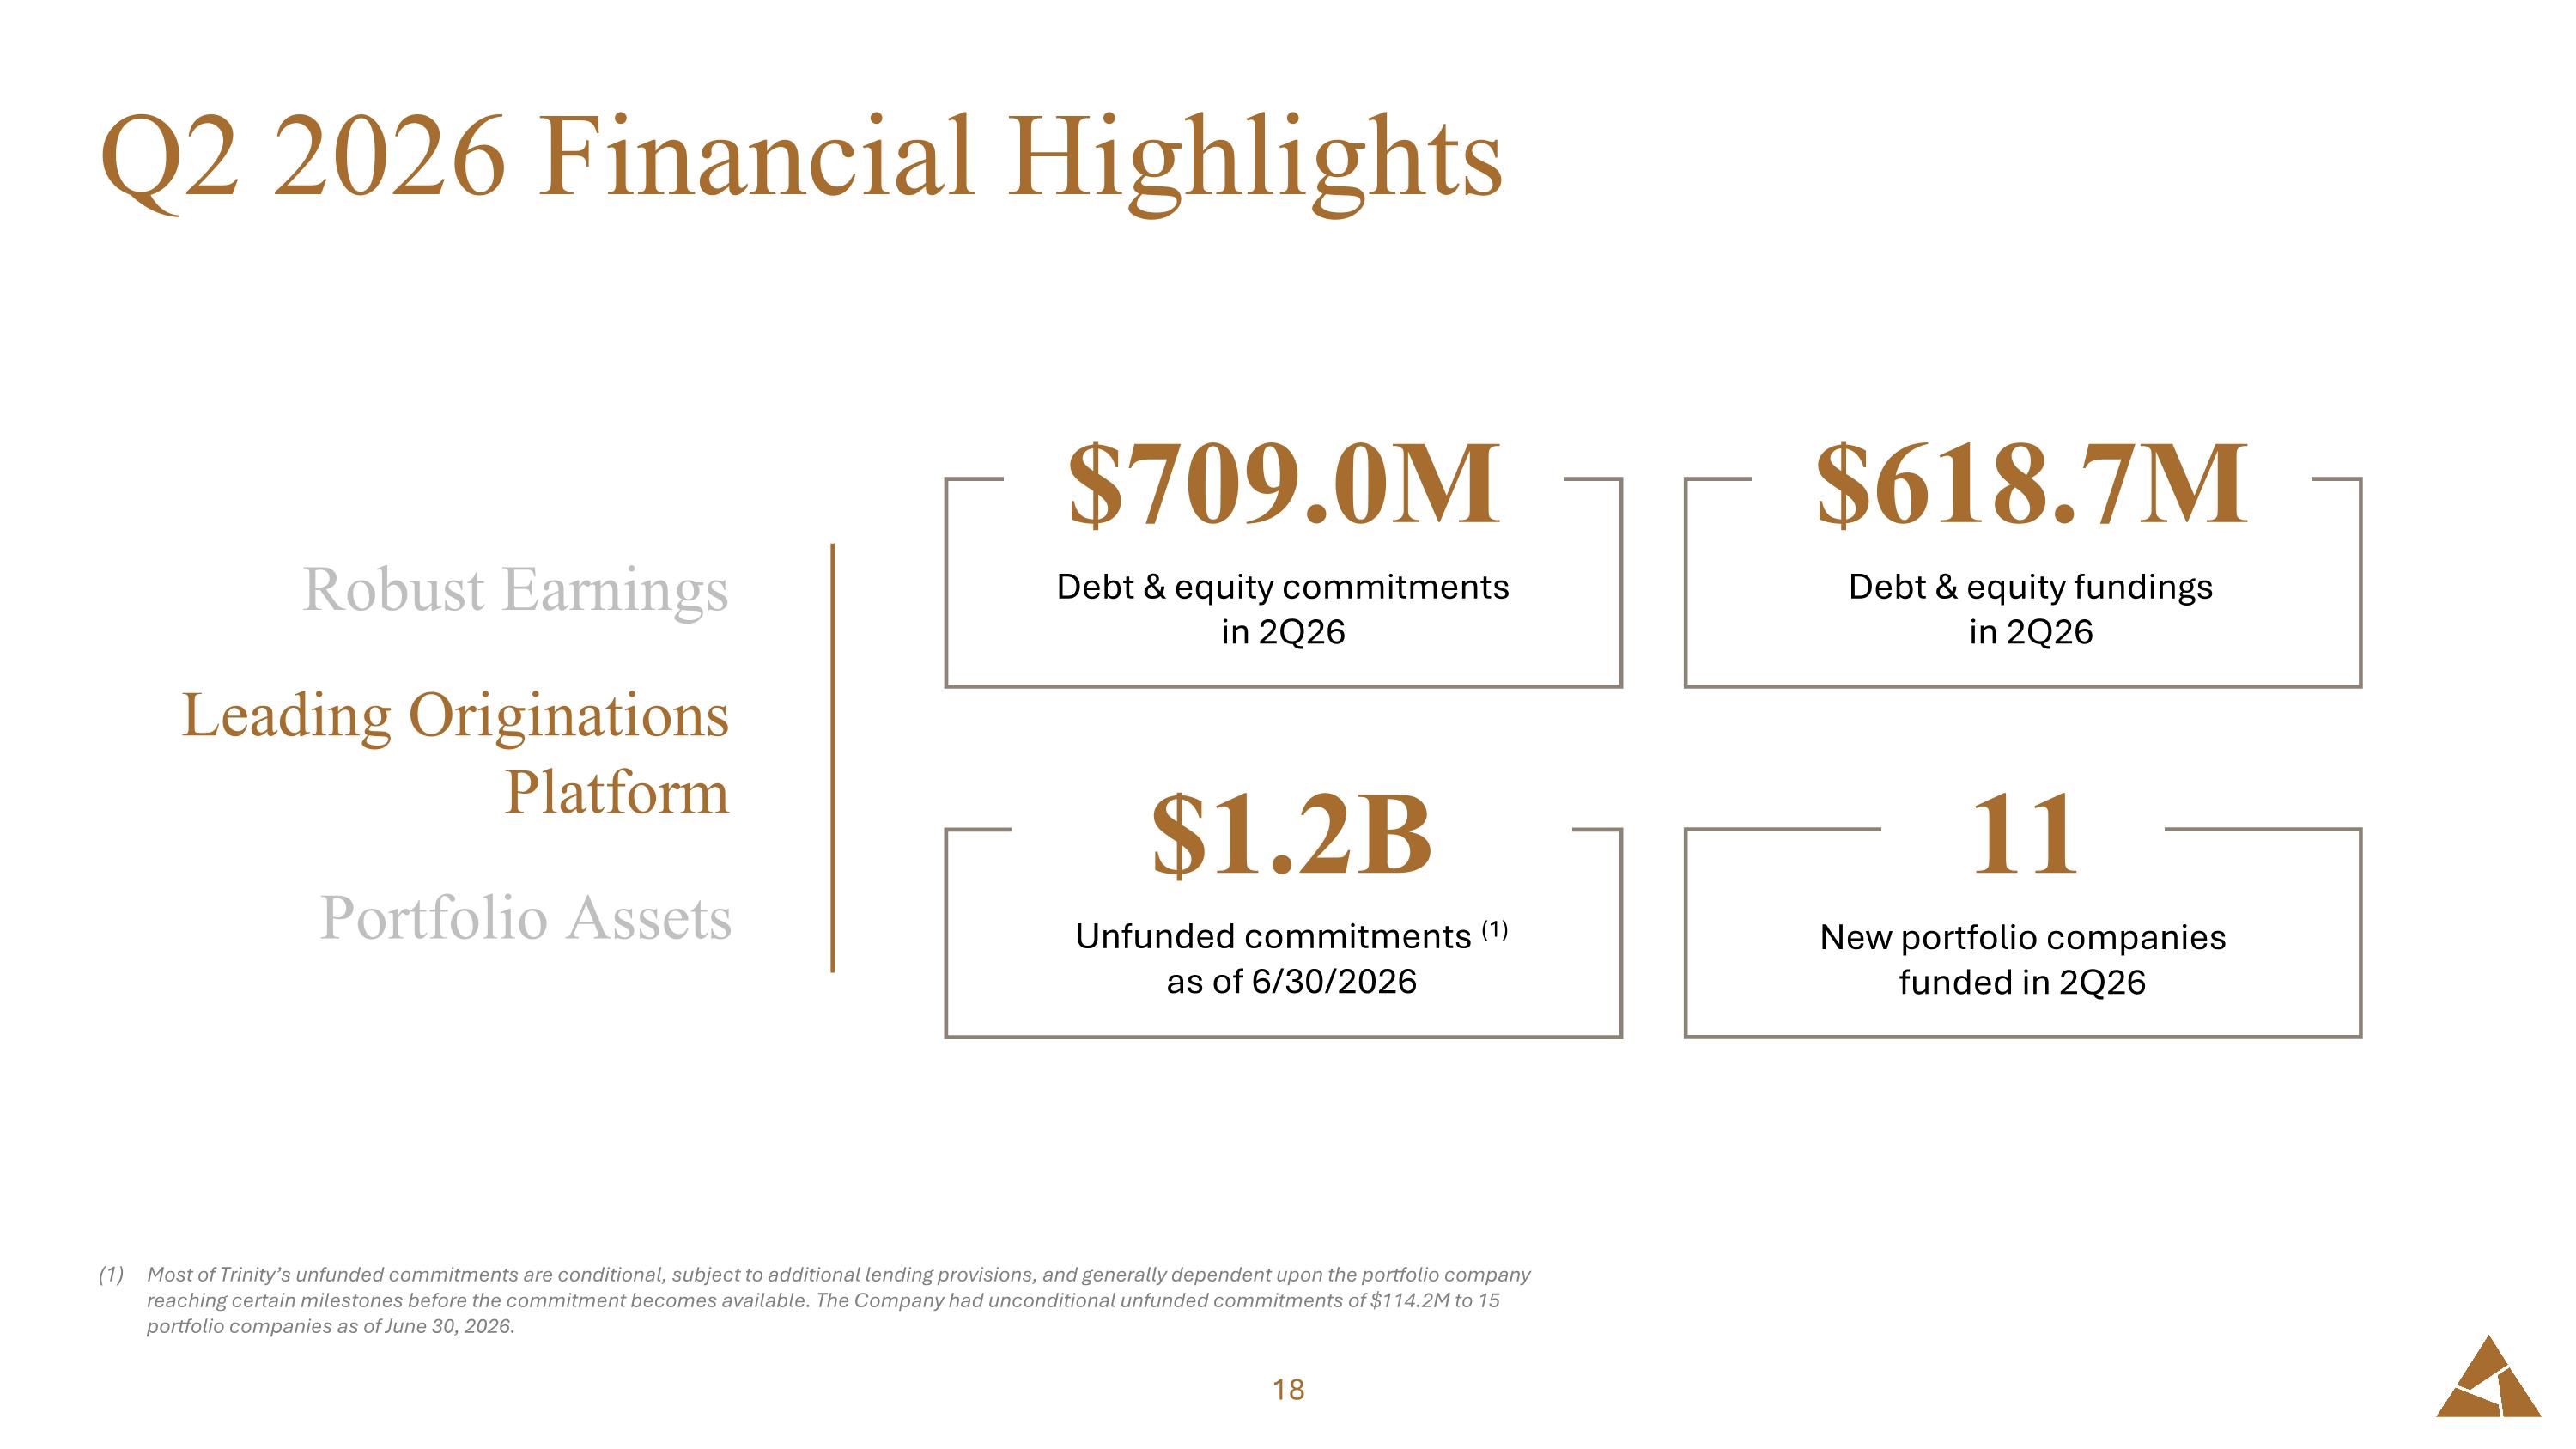
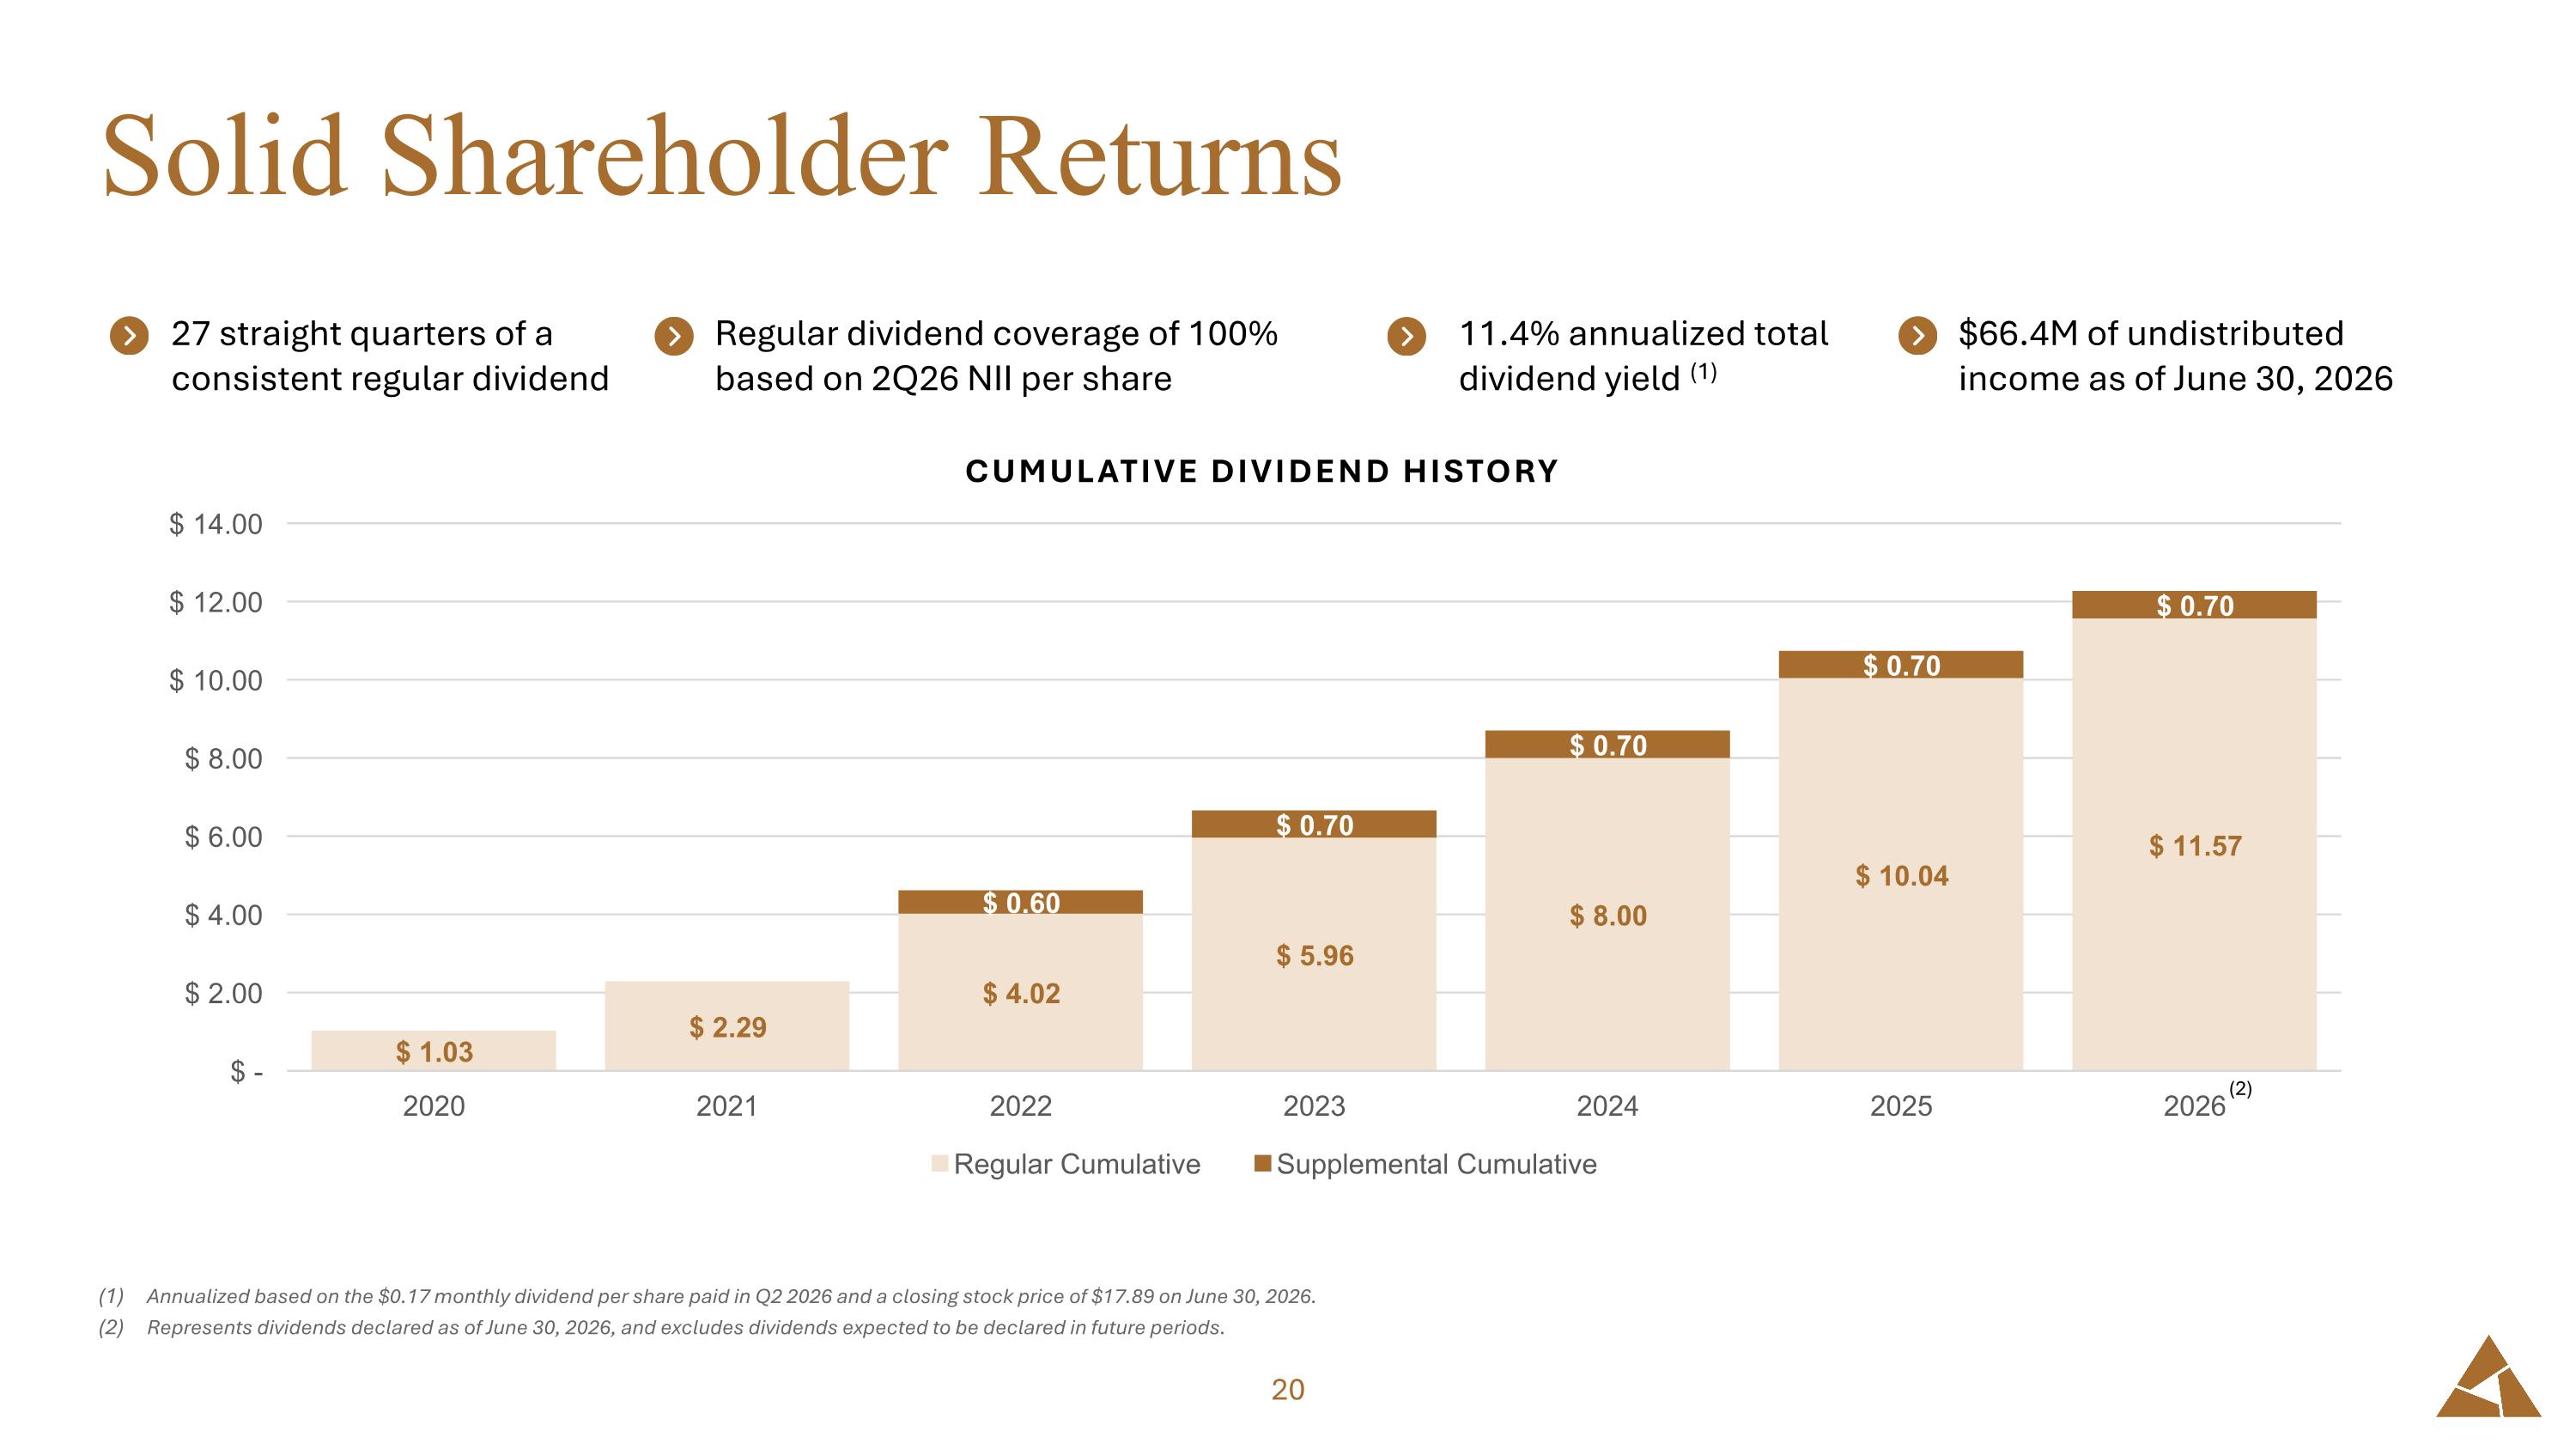
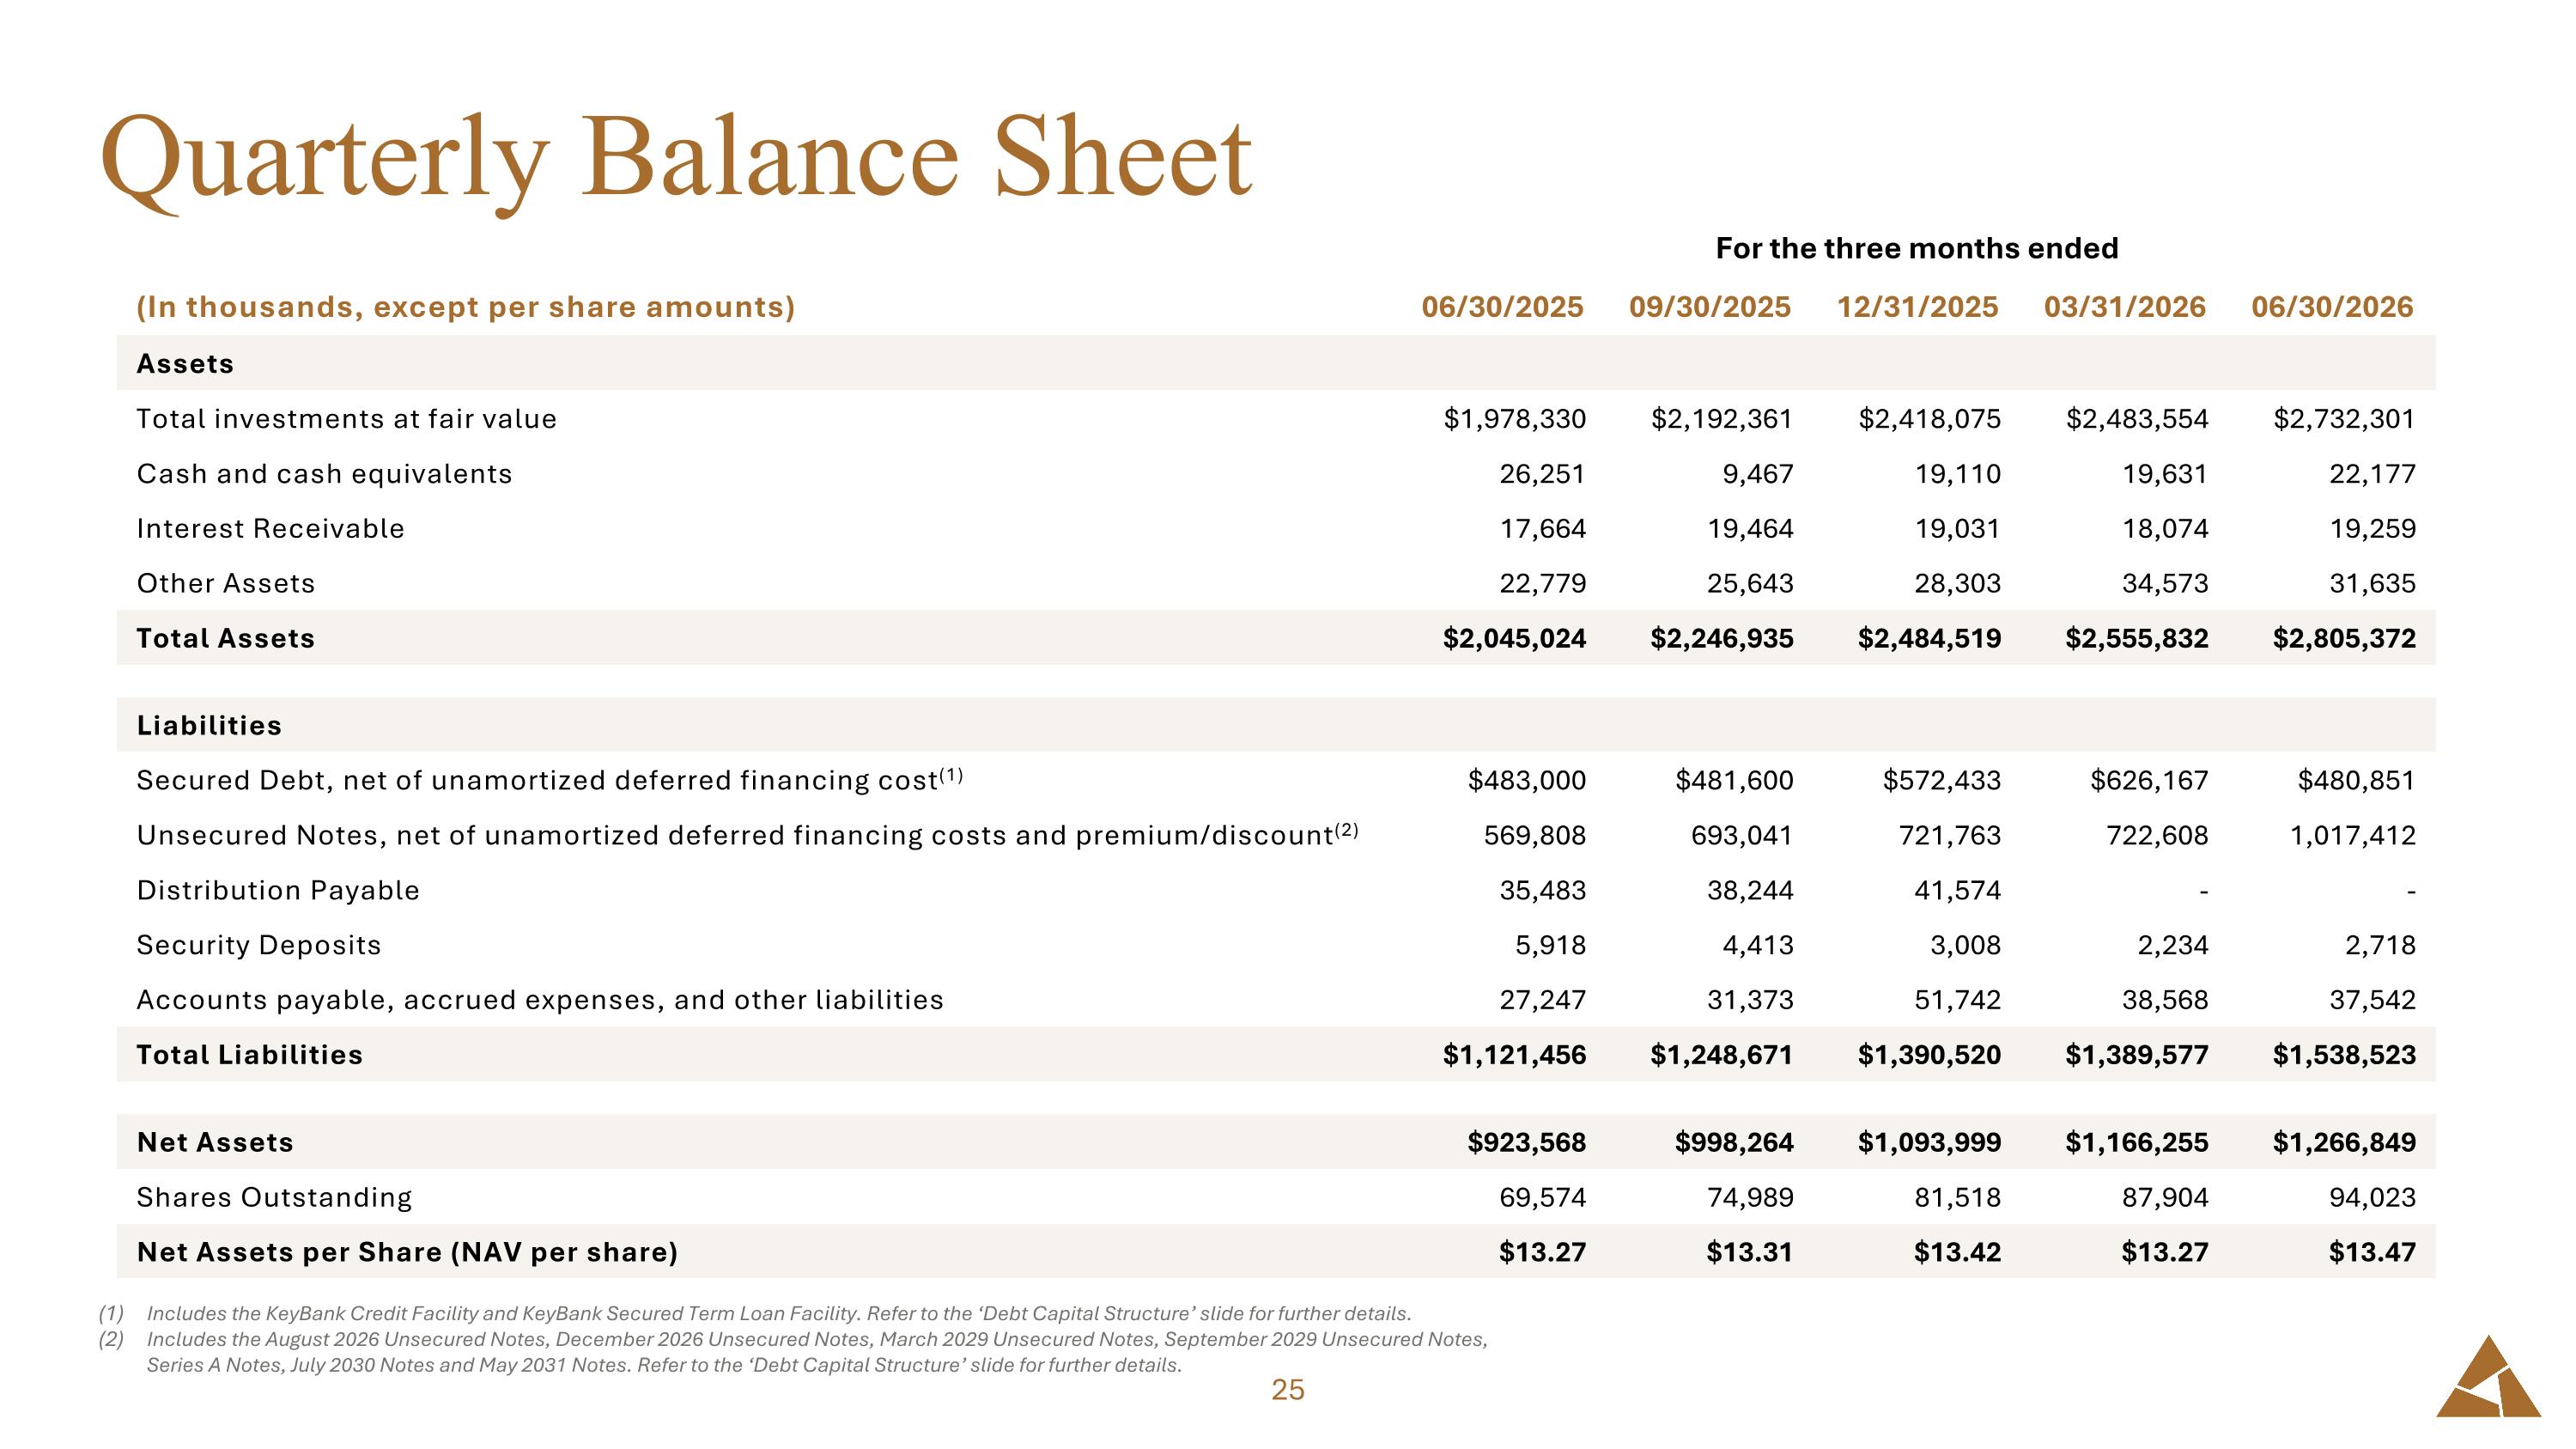
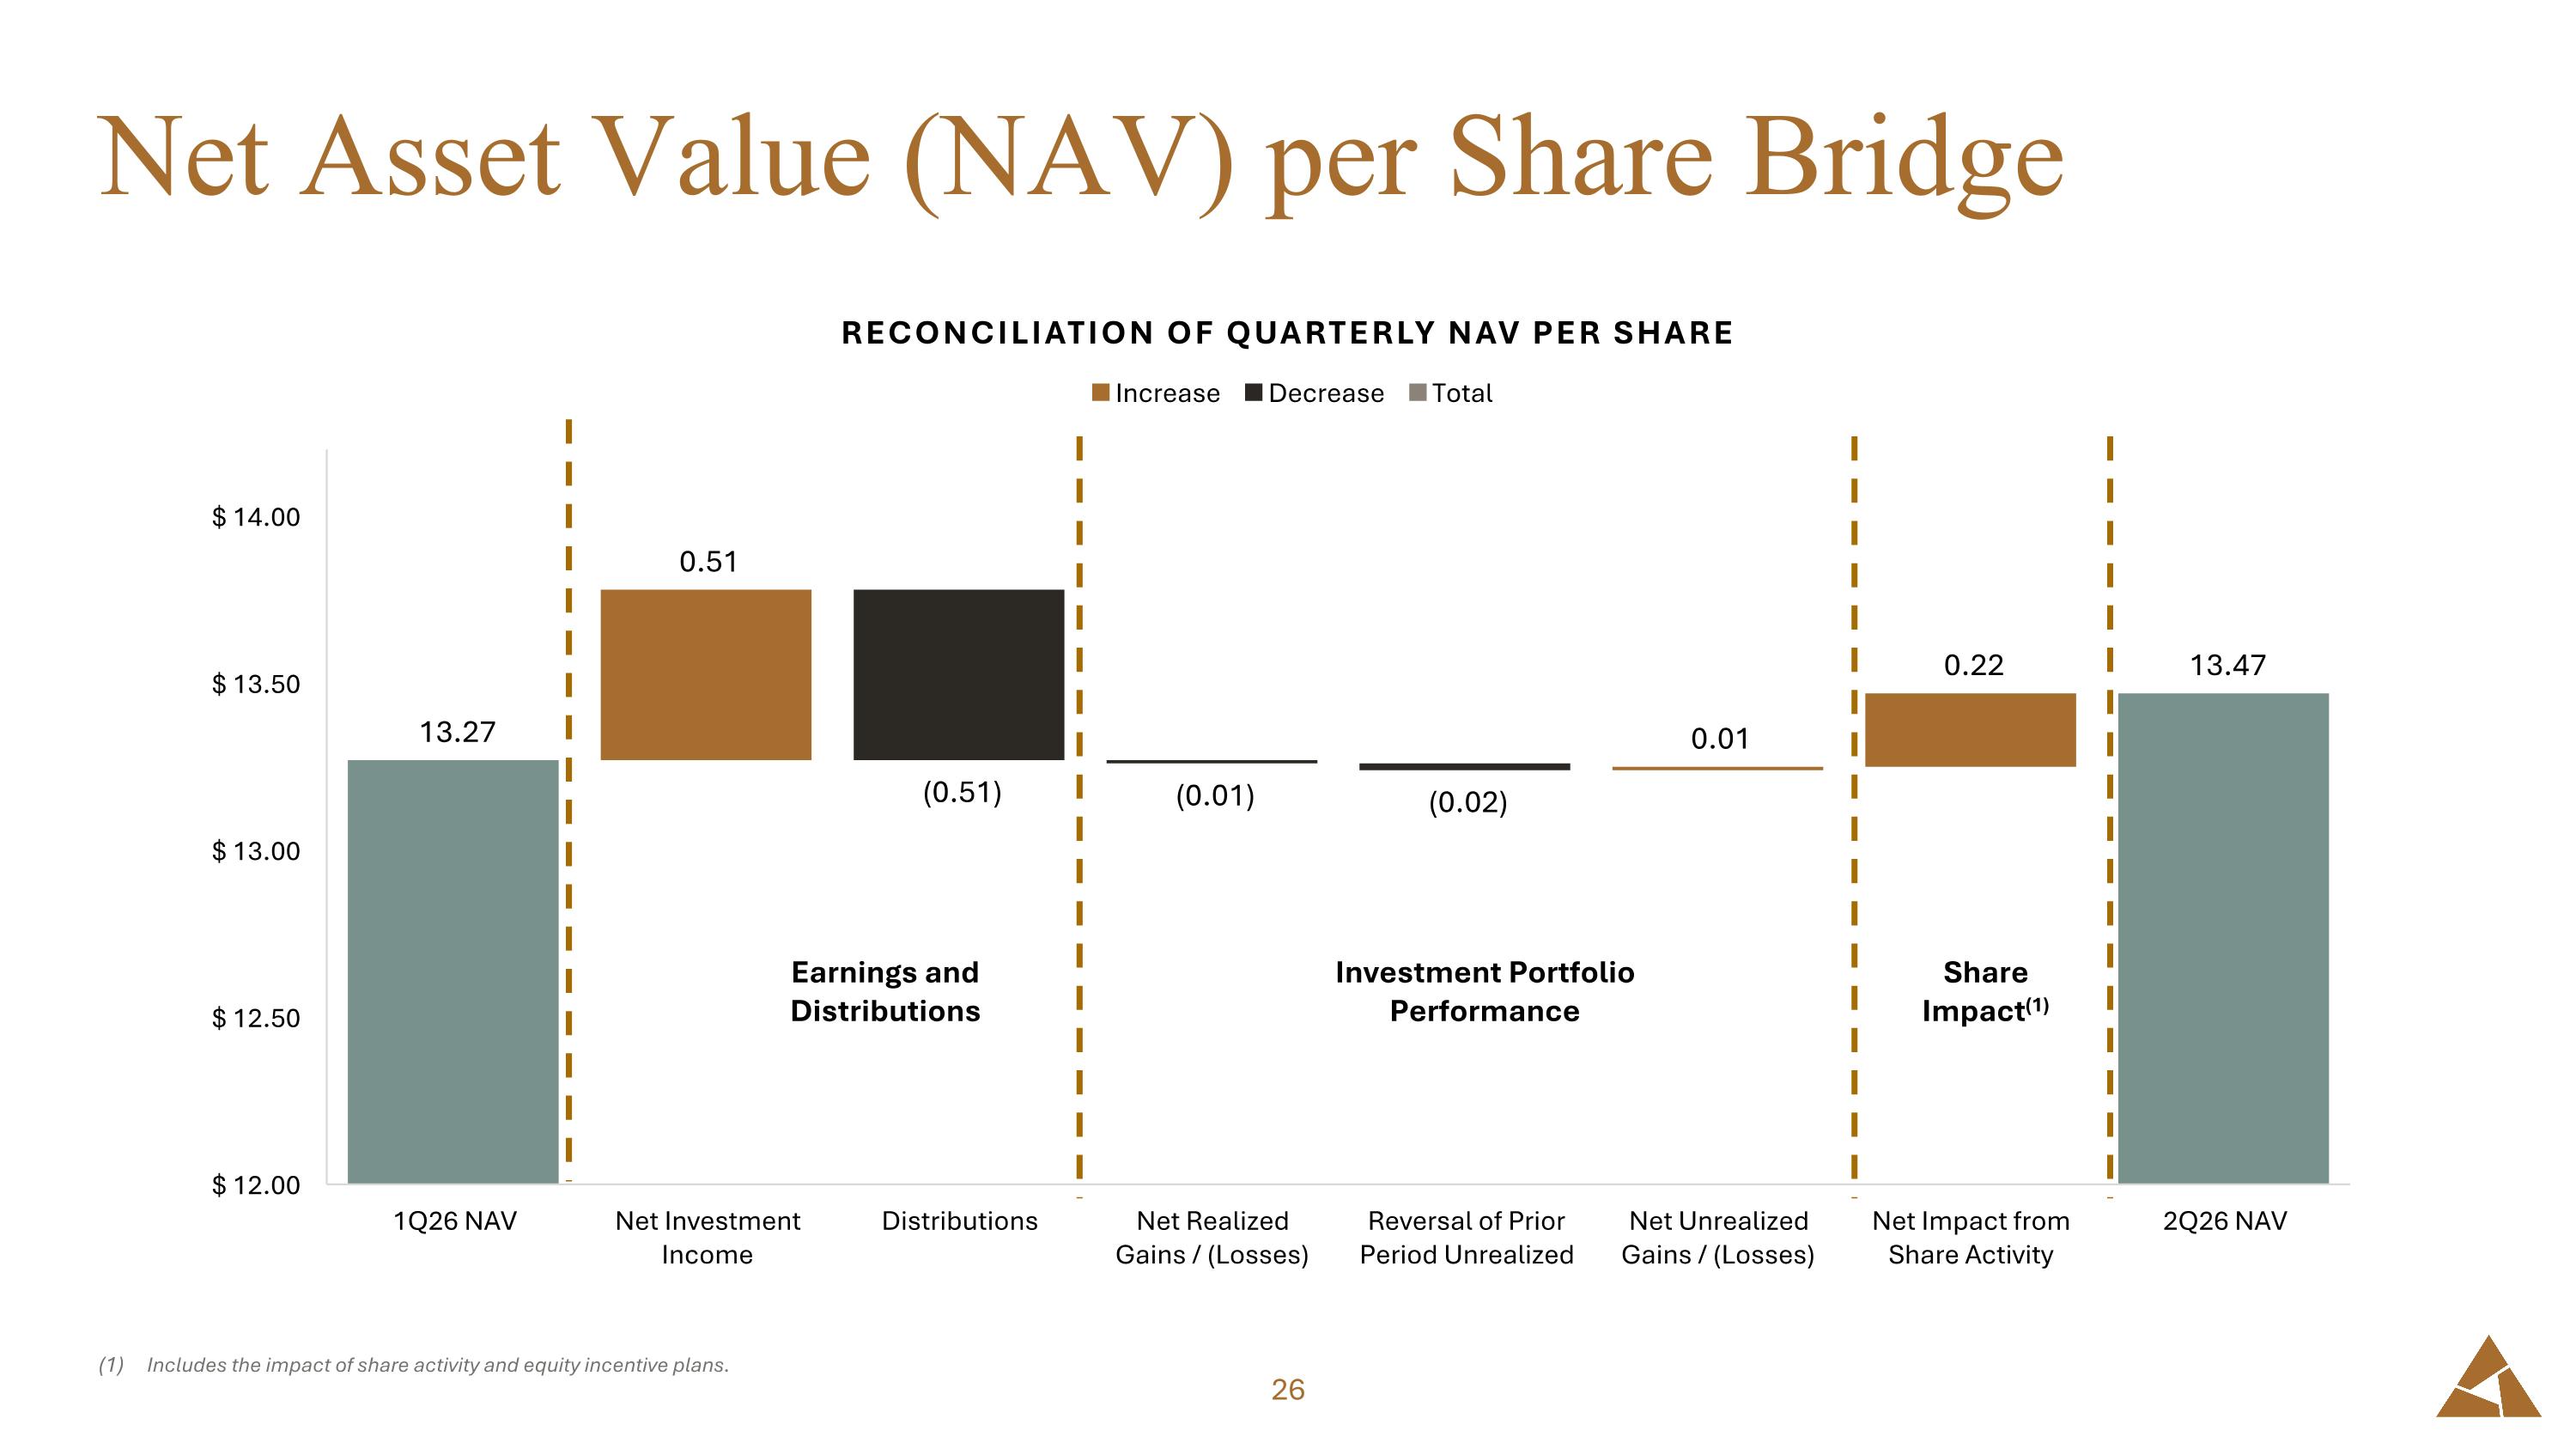
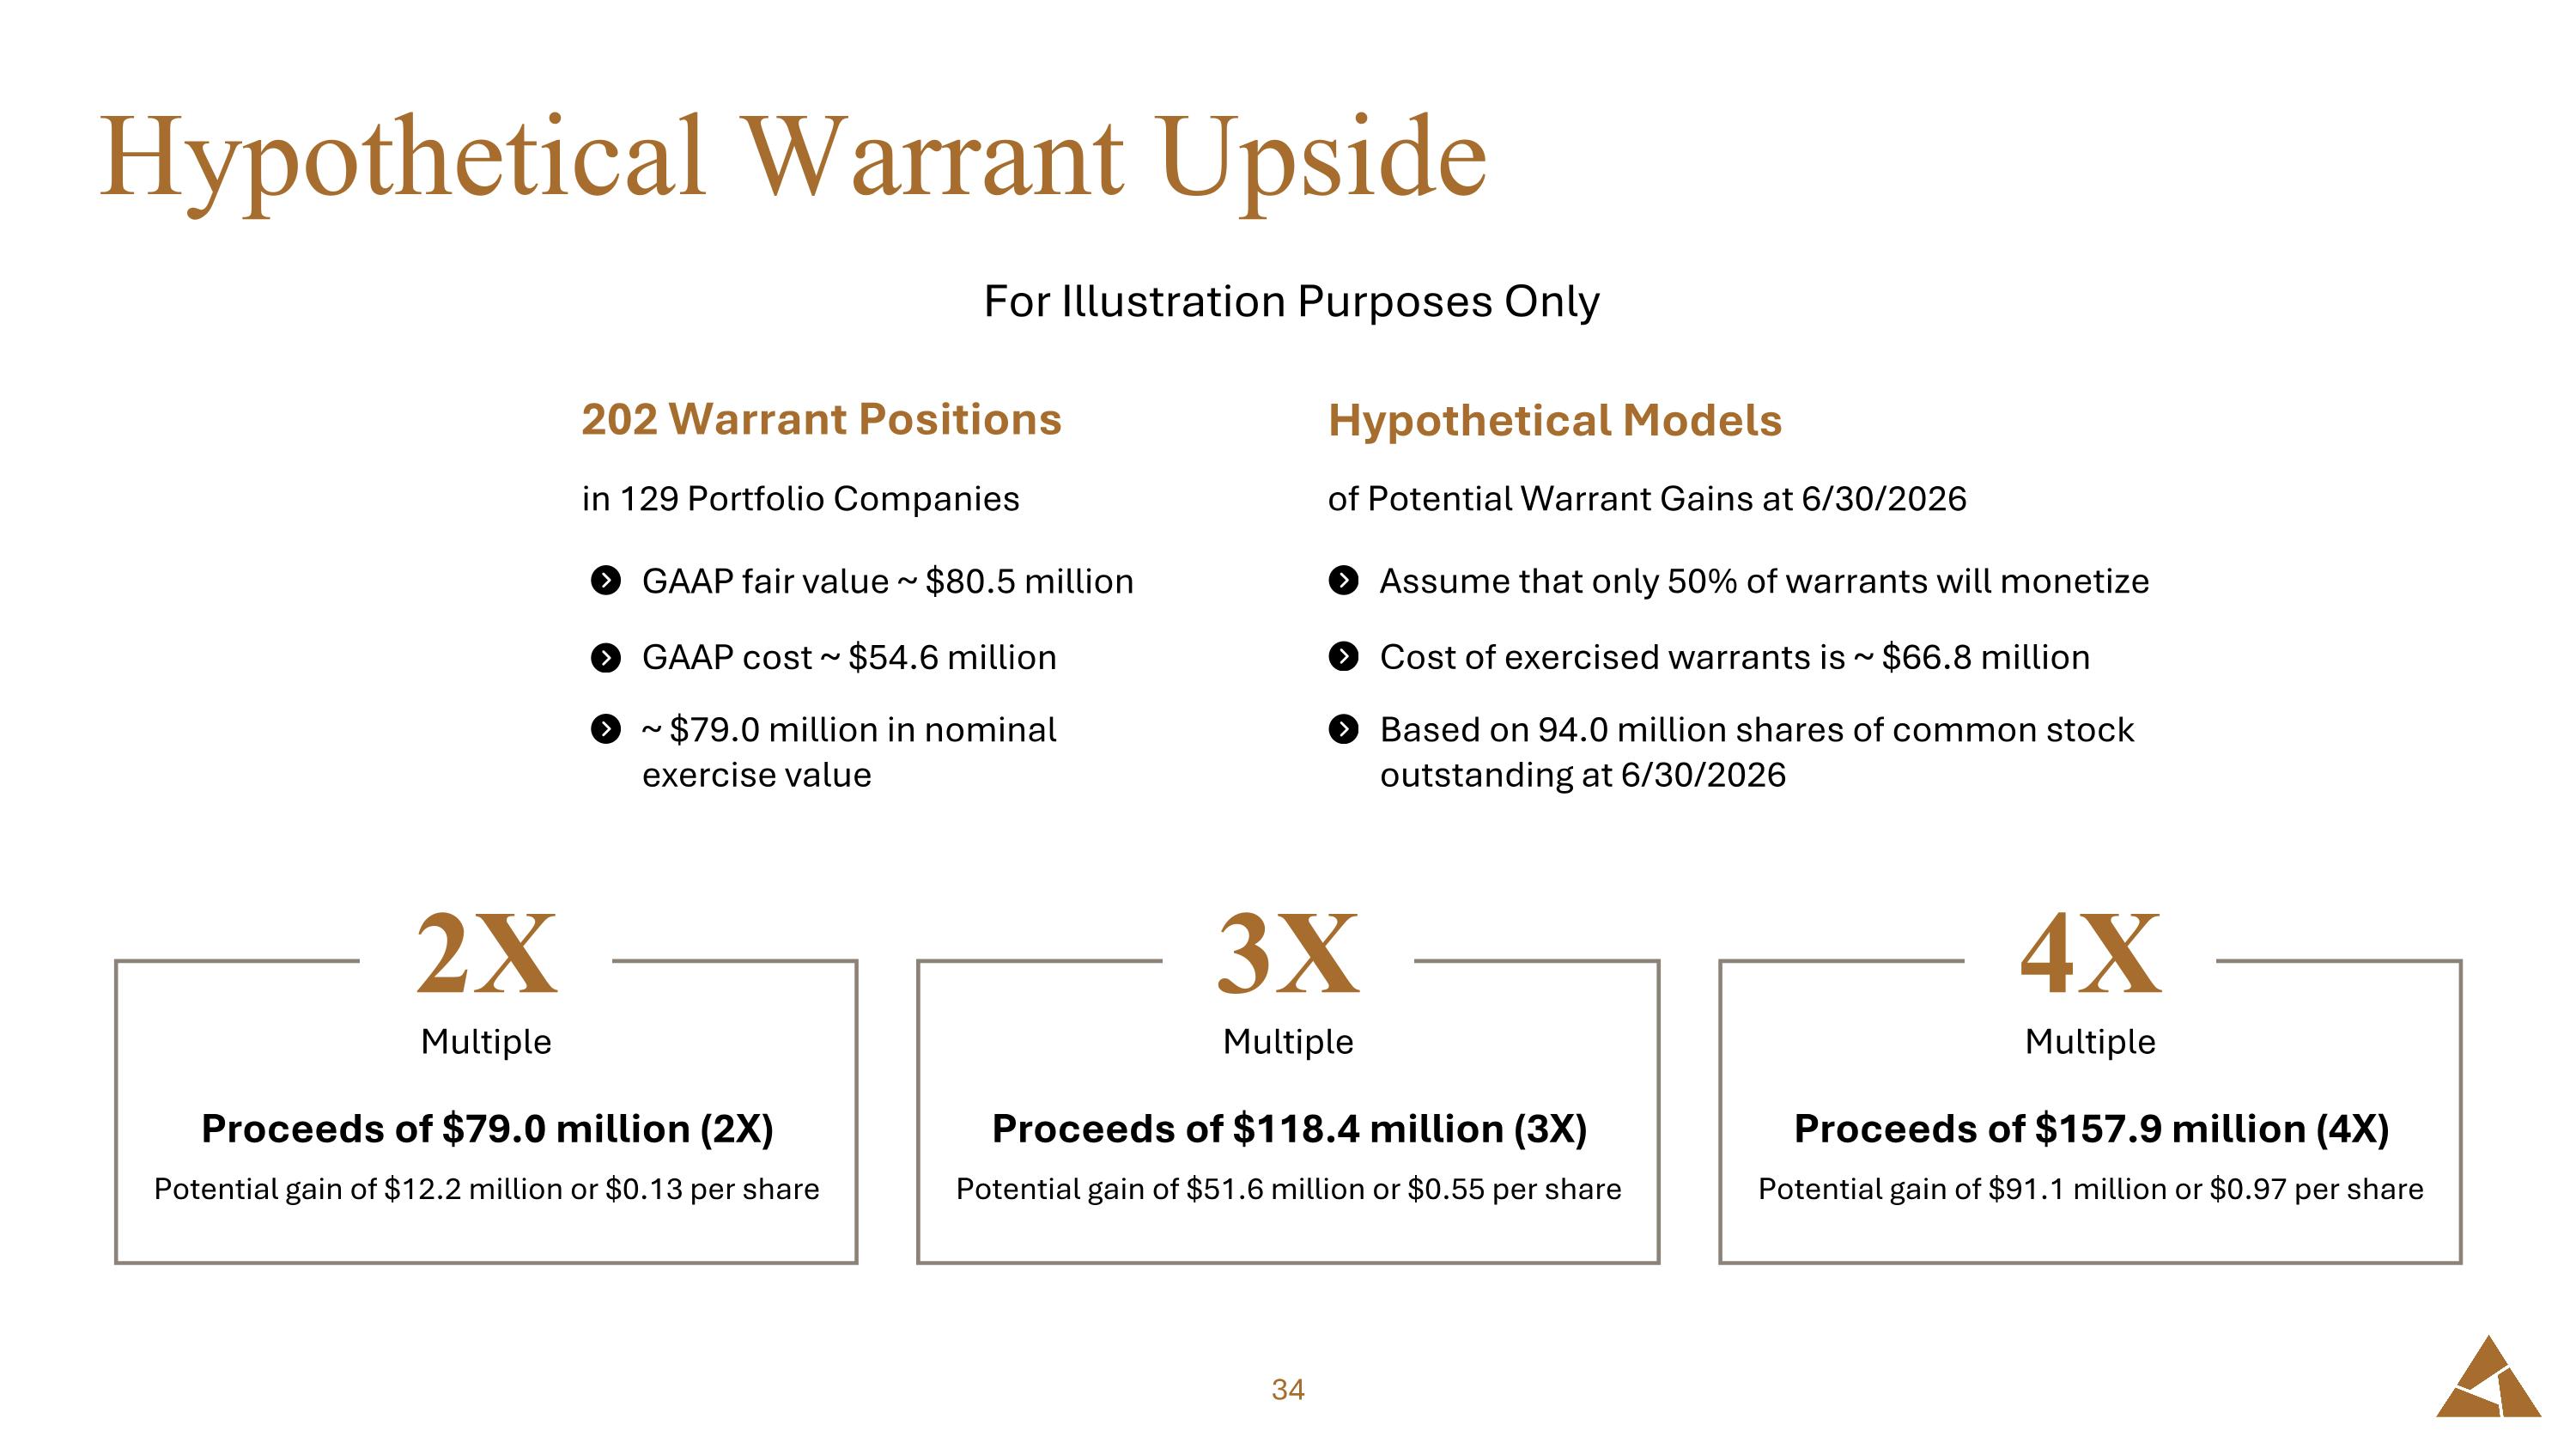
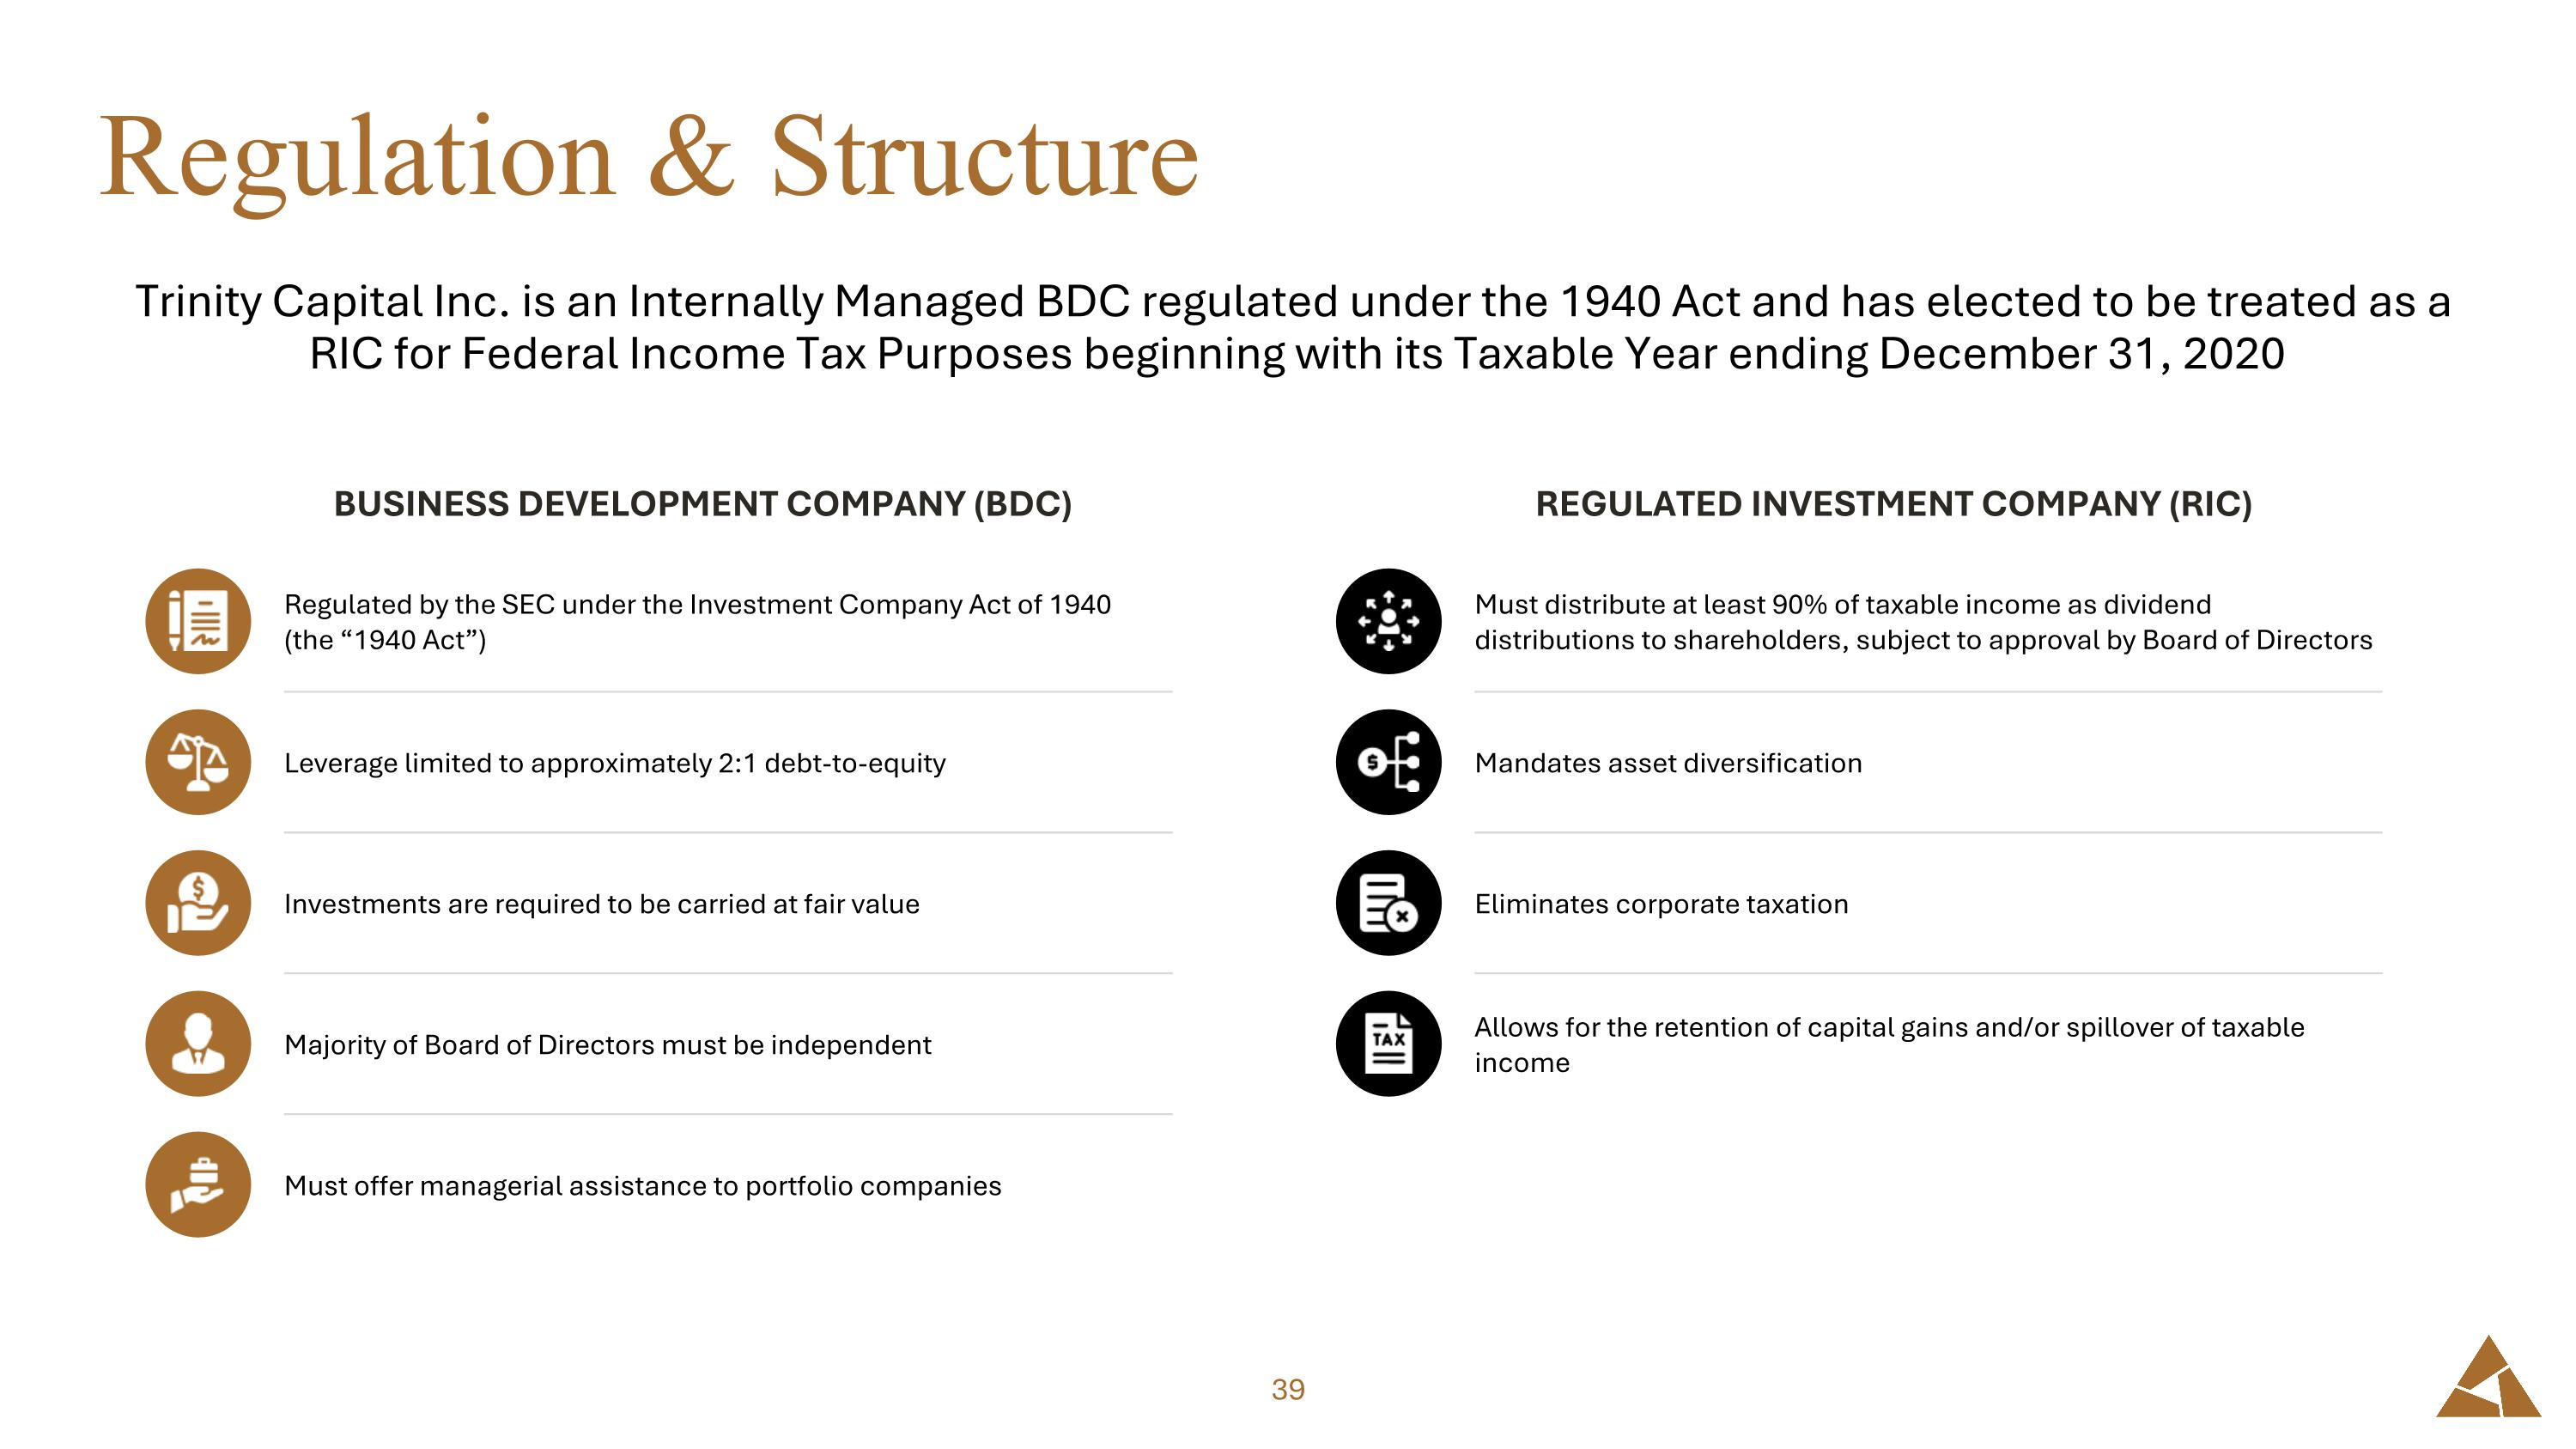
Thanks, Ben, and thank you to everyone joining today. Trinity Capital leads the BDC space in year-to-date shareholder return as we continue to build a differentiated platform fueled by a diversified five vertical lending enterprise, A managed funds business generating income in addition to our portfolio returns and an internally managed structure that keeps our interests aligned with shareholders. We believe these unique advantages are driving our consistent outperformance. To start off, I'd like to spotlight some shareholder-friendly news from Q2. As of June 30th, Trend's total shareholder return is the best in the BDC space over the last one, three, and five years. From our IPO in 2021 to the end of Q2, Trend stock has delivered a total return of 174%, far outpacing the S&P 500's 114% and the BDC index's 58% over that same time period. We are paying a $0.17 monthly dividend through the end of Q3, and Trend shareholders have been the recipients of a consistent distribution for approaching seven consecutive years now. Our managed funds platform continues to grow at a healthy pace, and income generated from the platform contributed 6% of our net investment Income and Q2. And looking forward, we have 202 warrant positions and 129 portfolio companies, which have the potential to provide incremental upside to our shareholders. Here are some highlights from Trent's performance during the second quarter. Our net asset value grew 9% quarter over quarter and 37% year over year to a record $1.3 billion. Also, NAV per share increased from $13.27 to $13.47 quarter over quarter. platform AUM increased to 3.2 billion dollars up 30 36 percent year-over-year our originations engine is as strong as ever achieving a record 619 million dollars of fundings in q2 along with 709 million dollars of commitments and we maintain strong credit with non-accruals improving to less than one percent of the portfolio at fair value net investment income per share of 51 cents covered our dividend and reflects the strong earnings power of the portfolio. It was a quarter defined by outperformance across NAV, originations, and credit quality. We remain confident in our earnings trajectory and dividend stability heading into the second half of 2026. We continue to grow strategically. Q2 fundings were up 69% year over year, and our pipeline is thriving. With $700 million in accepted term sheets and $1.2 billion in total unfunded commitments as of June 30th. Of those unfunded commitments, 91% remain subject to ongoing diligence and investment committee approval, with just 9% unconditional, a structure that preserves underwriting discipline for future deployments. Our originations activity reflects consistent performance across Trinity's five lending verticals, driven by an experienced team and a proprietary pipeline. As a direct lender, we do not rely on syndicated deals and also have immaterial overlap with other BDCs, giving our investors access to a genuinely diversified and differentiated portfolio. During Q2, we announced the acquisition of Equipment Leasing Services, a middle market equipment financing firm that remains a standalone portfolio company and adds another income generator to the trend platform. Our joint venture with Capital Southwest is a co-investment vehicle focusing on first out senior secured loans in the lower middle market. This strategic partnership, which features joint decision-making and now includes a scaling portfolio, allows us to diversify into a complementary segment of the lower middle market with a proven partner while minimizing risk and providing stable income for our investors. Subsequent to quarter end, we transitioned our listing to the New York Stock Exchange, a milestone we're proud of and one we believe better positions us in the financial sector and provides improved daily liquidity within our stock. Our goal since day one hasn't changed. out-earn the dividend, grow the business, and do it the right way. That means originating our own deals, underwriting them to our own standards, and making decisions as one aligned team. That alignment starts with structure. As an internally managed BDC, there is no external manager collecting fees. Our employees, management, and board own the same shares as our shareholders. So our commitment to consistent dividends and long-term value creation isn't a talking point. It's a financial reality. We operate like shareholders because we are shareholders. And the fees generated through our managed funds flow back to the BDC, creating incremental income that benefits shareholders directly rather than flowing to a third party. Our five lending verticals provide meaningful diversification while keeping us directly within our core competencies. Each vertical is staffed by dedicated originators, underwriters, and portfolio managers, creating a scalable model that drives results without sacrificing focus. The people executing that model are why it works, and Trinity's unique culture enables us to attract and retain a world-class team of originators and underwriters. What we've built and continue to build is a platform with real breadth, growing scale, and a managed funds business that's delivering meaningful incremental income. None of it is accidental. It's a product of deliberate decisions made the same way, quarter after quarter, year after year. The pipeline is active, underwriting discipline is intact, and our capitalization strategy has been constructed to grow earnings power over time. Trinity is built different, built for this moment, and built to last. From here, General Counsel Sarah Stanton, who leads our corporate development efforts, will walk through our updates on the Managed Funds platform.
Thank you, Kyle. Our Managed Funds and joint ventures continue to scale meaningfully, with more than $800 million of capacity across these strategies. The Managed Funds platform contributed $0.03 per share to our $0.51 NII in Q2, enhancing returns for TRIN beyond the income generated by our BDC portfolio. And two recent additions are poised to drive further growth, our SBIC fund, now adding significant low-cost liquidity, and our Capital Southwest joint venture, extending our reach into the lower middle market. Our SBIC fund has now closed more than $75 million in equity commitments and is already being deployed. At a two-to-one debt-to-equity ratio with low-cost leverage from the federal government, the SBIC fund is expected to create more than $250 million of incremental platform capacity at full scale, with a potential to upsize beyond that based on new SBA guidelines. Meanwhile, our joint mentor with Capital Southwest has given us an efficient entry into the lower middle market, a complementary segment we can now access with strong credit discipline alongside a highly respected partner. With this JV, we now co-manage several vehicles that diversify our capitalization sources, expand our origination's power, and broaden our capital base without diluting shareholders. The managed funds platform is doing exactly what it was designed to do, generate incremental returns beyond our interest income, increase our investment capacity, and widen our pool of available capital. The foundation is in place, and we expect this platform to become an increasingly meaningful contributor to earnings over time. With that, I'll hand it to CFO Michael Testa for a closer look at our financial results.
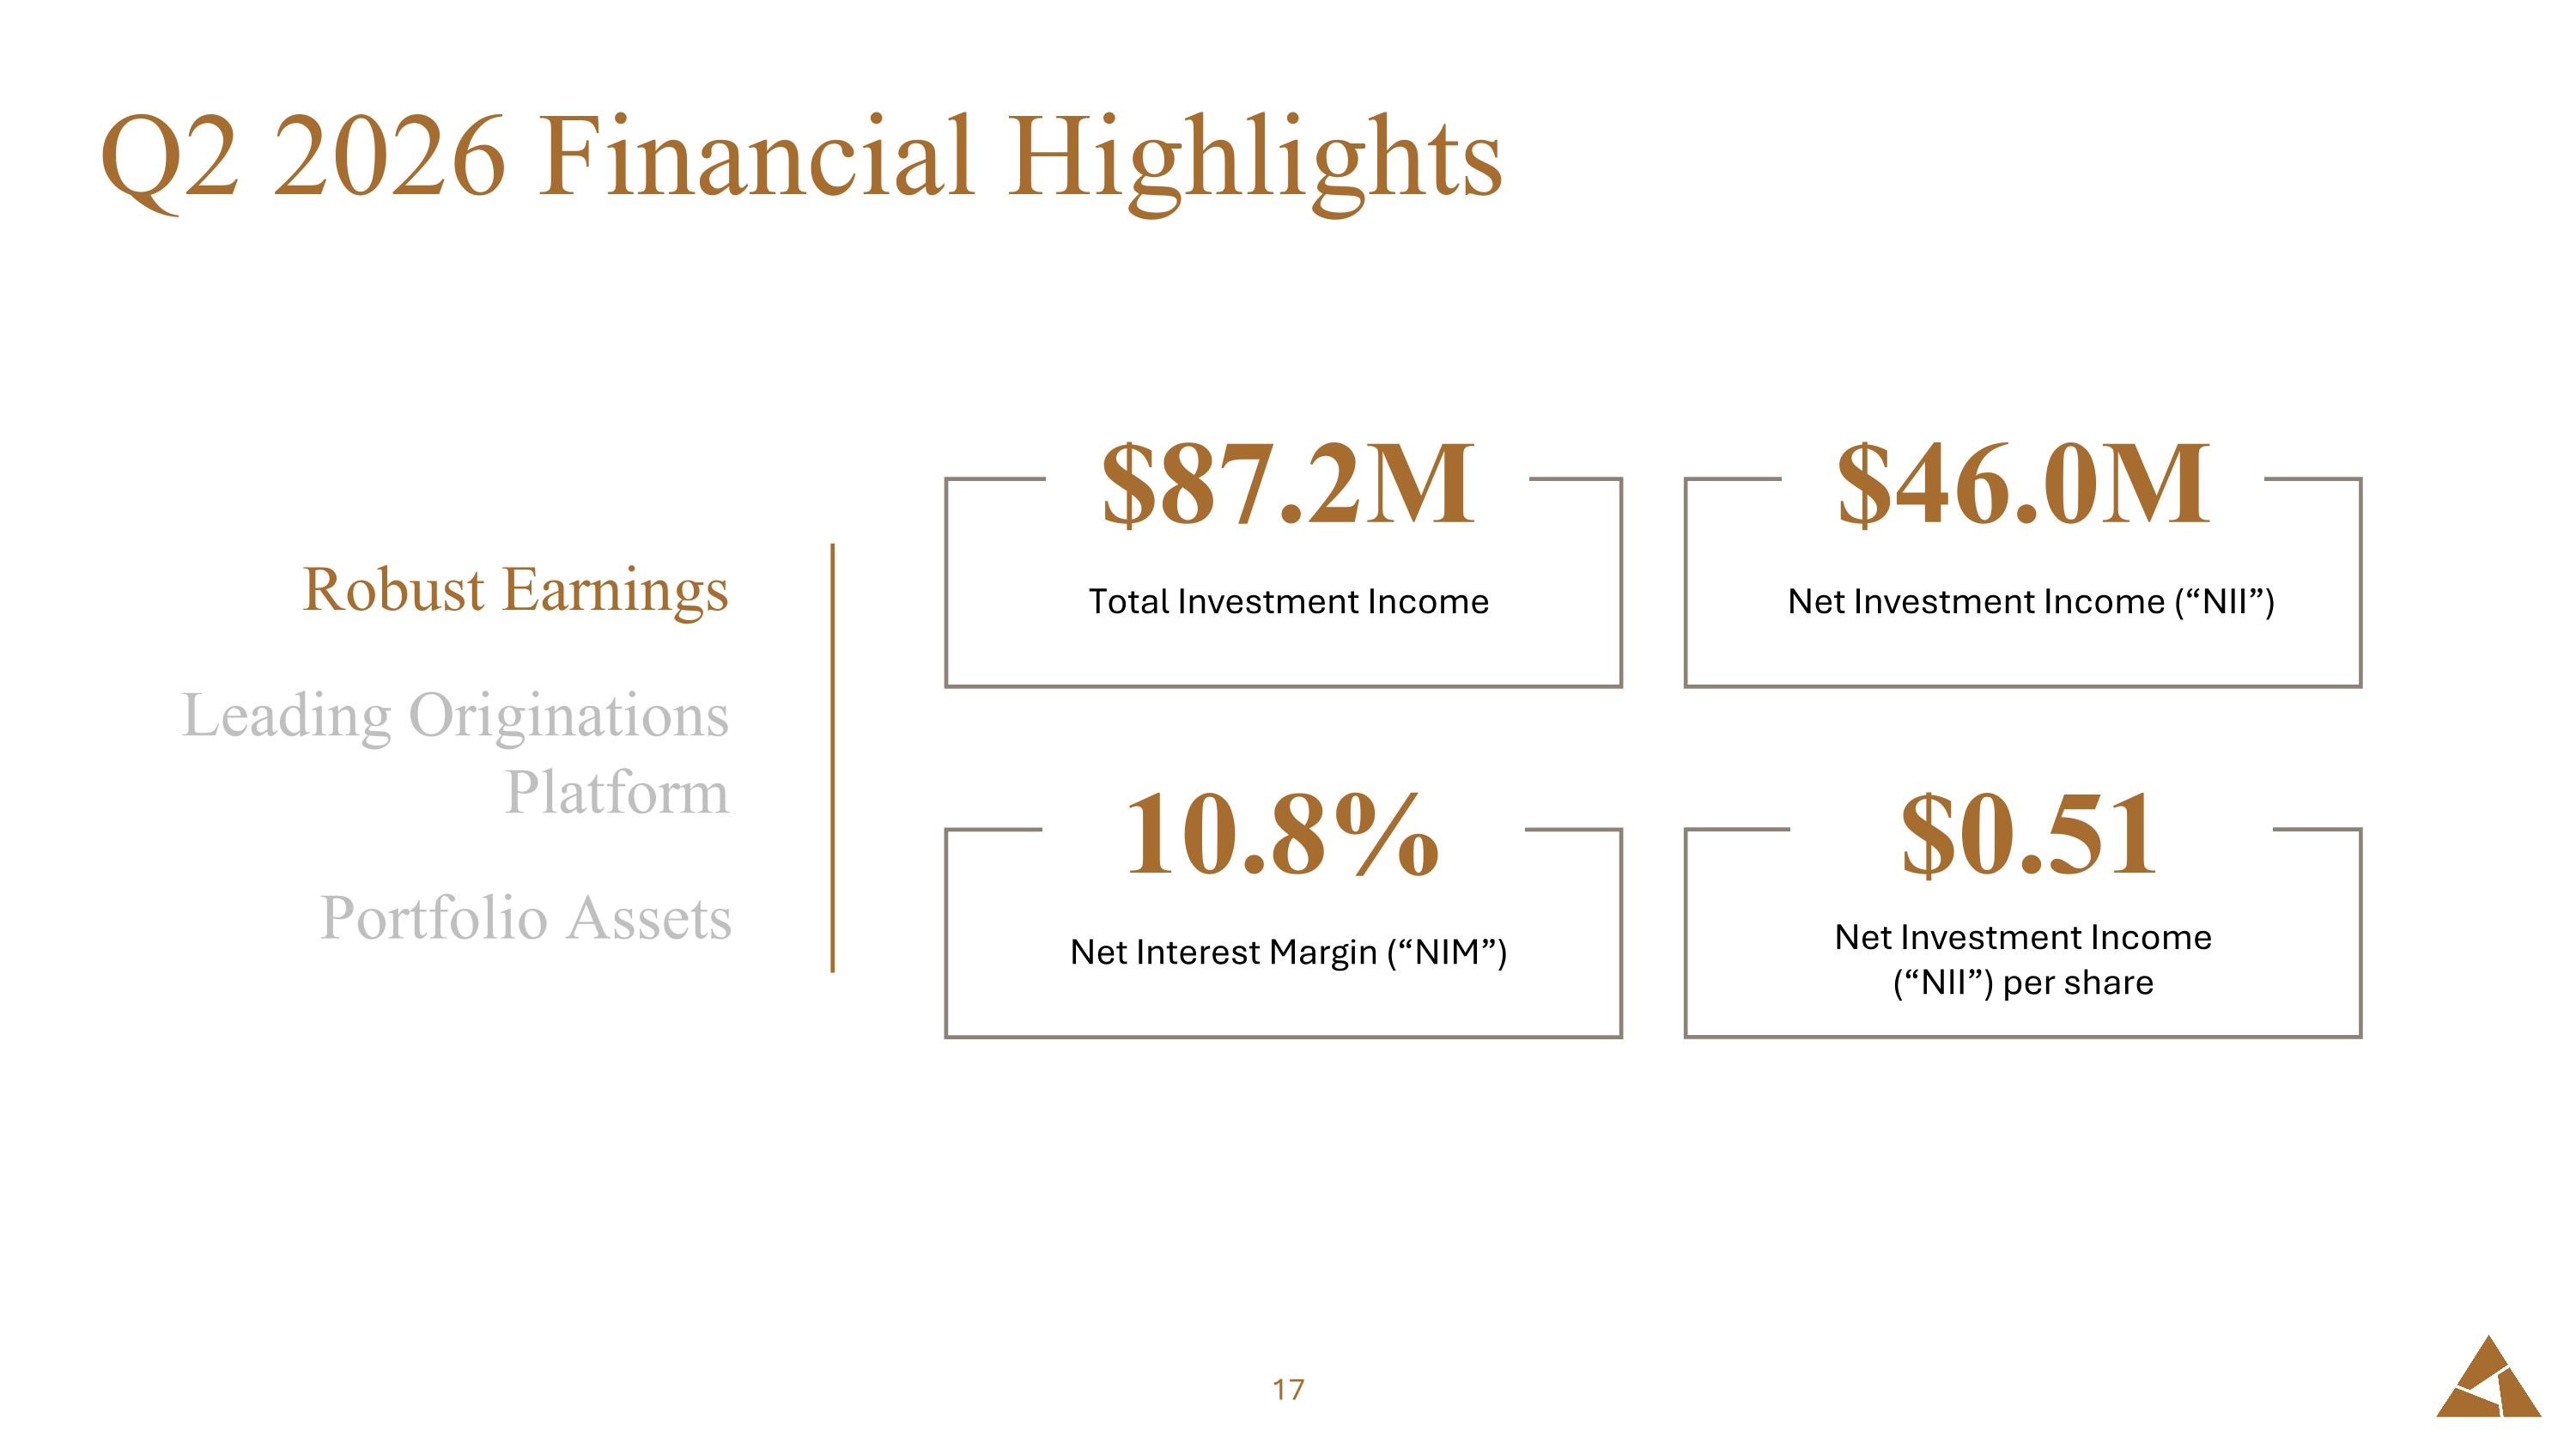
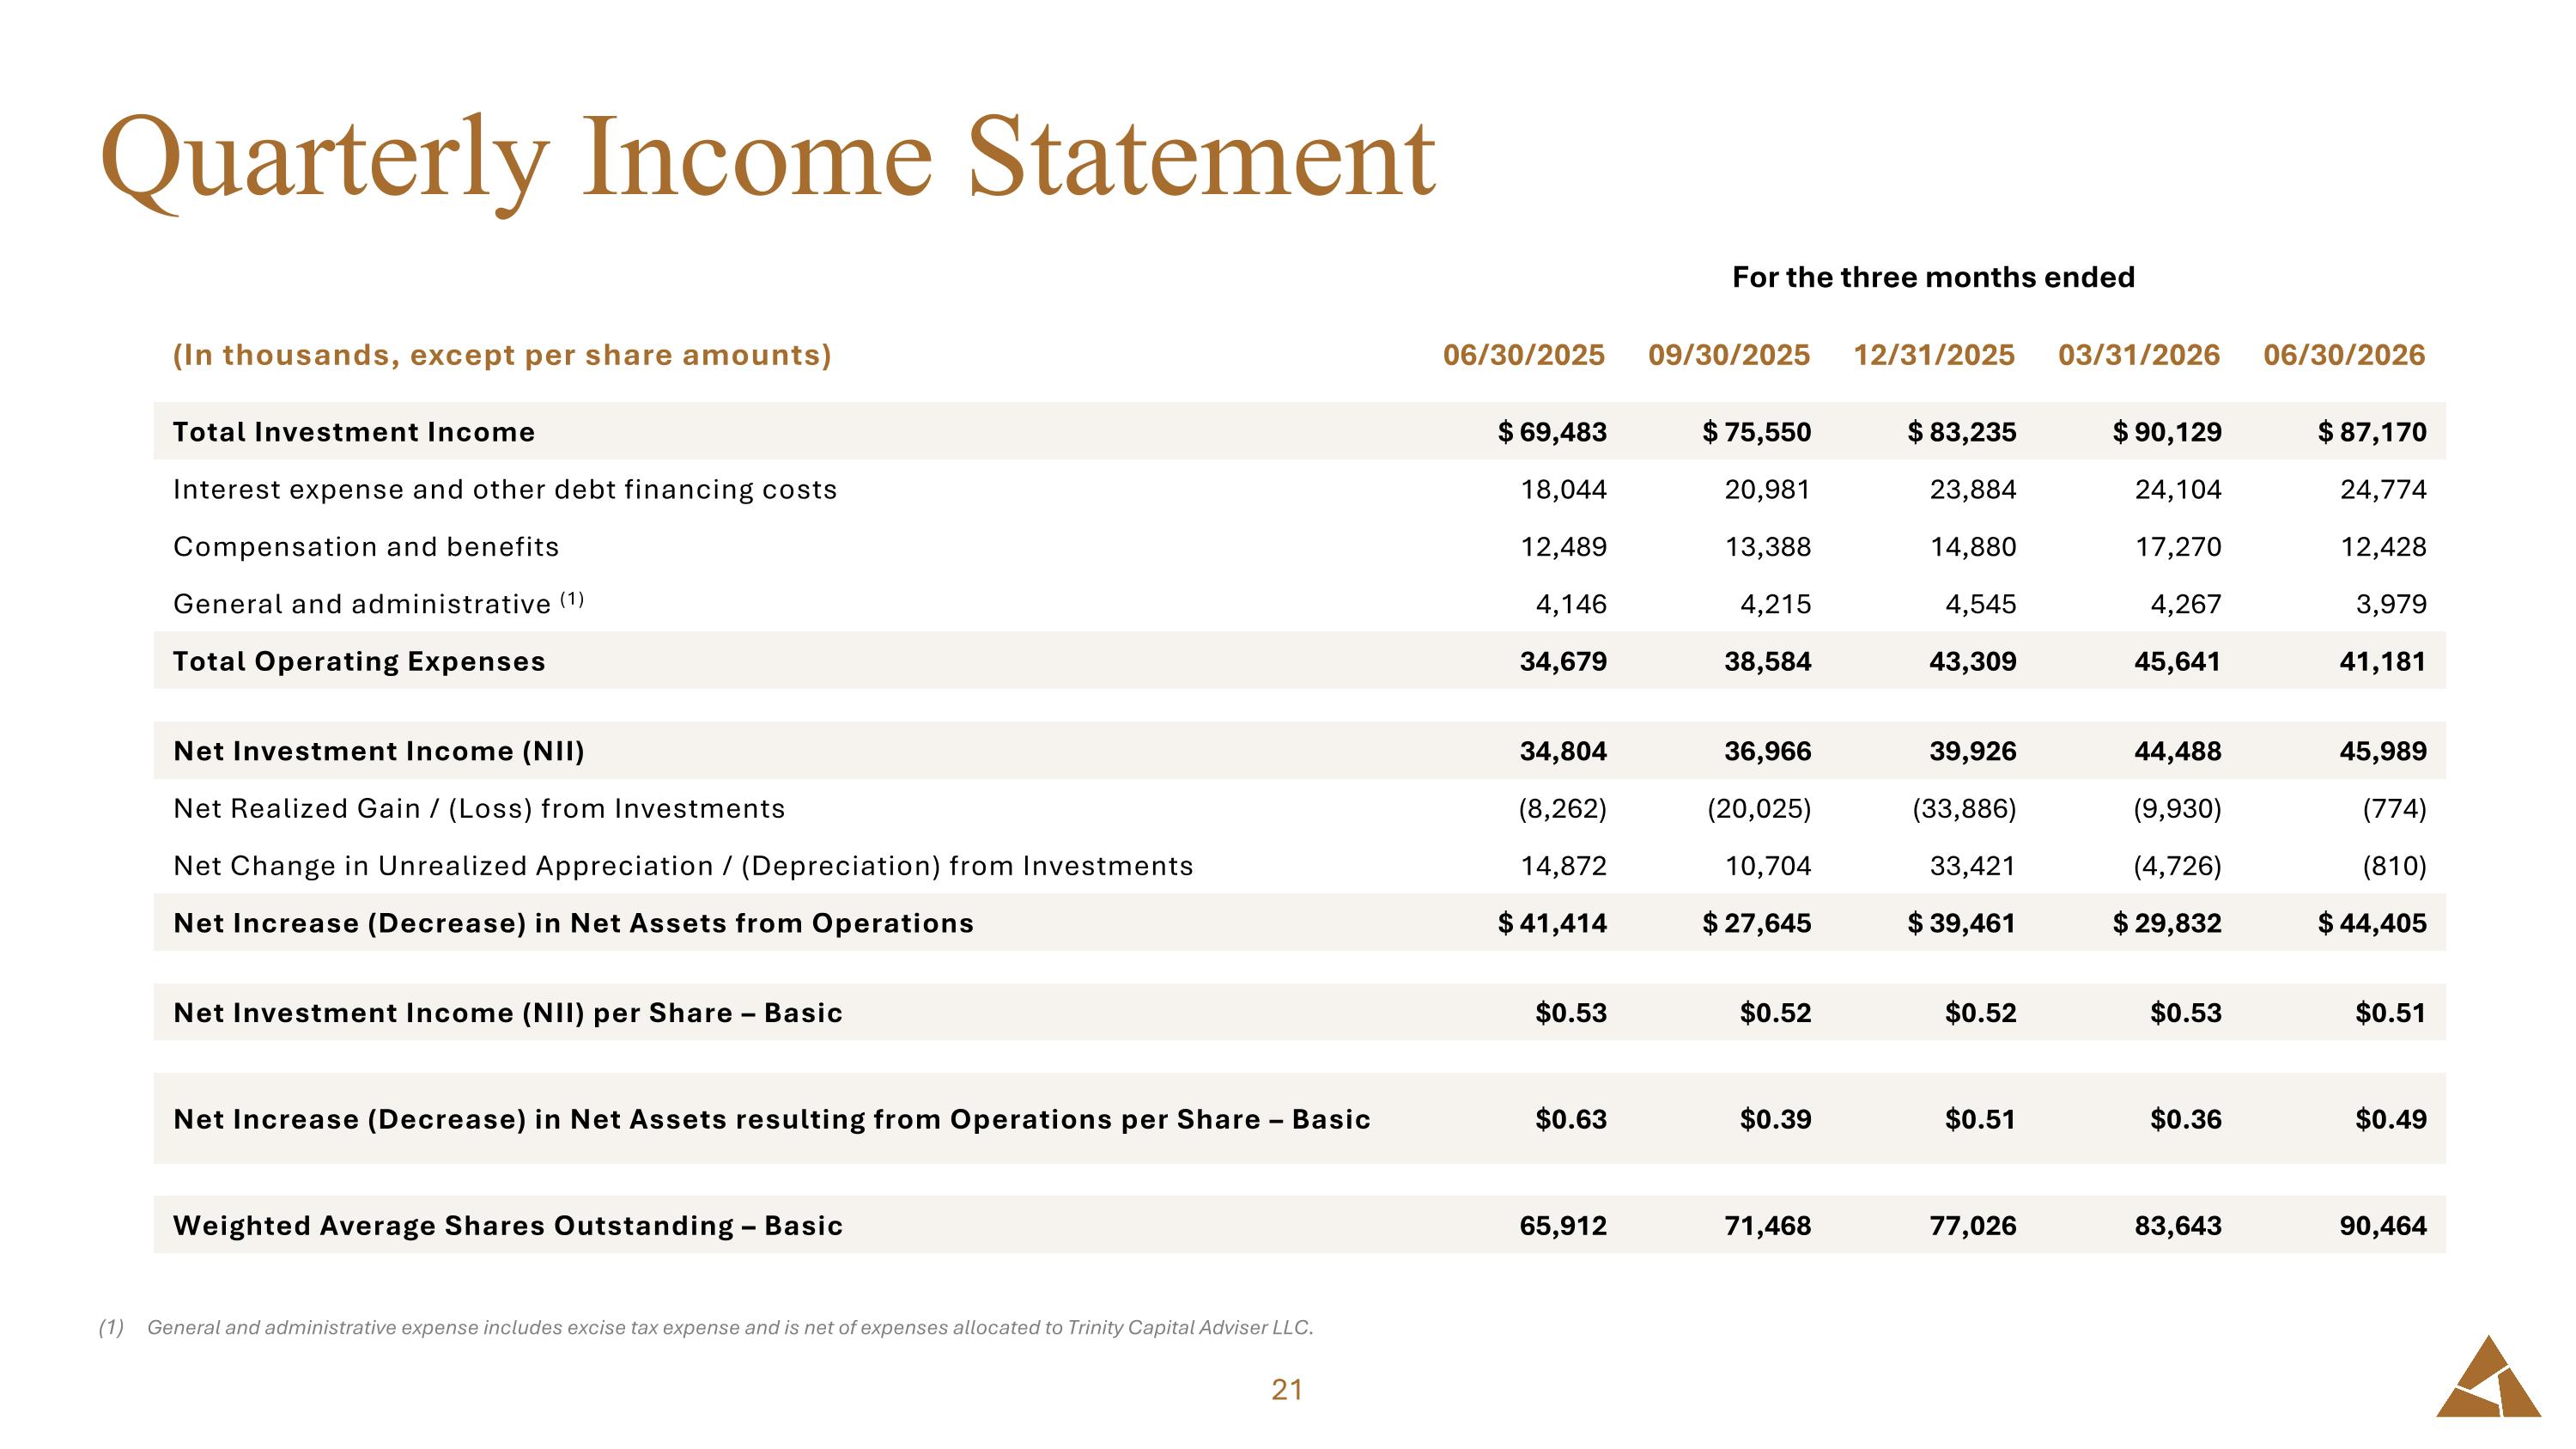
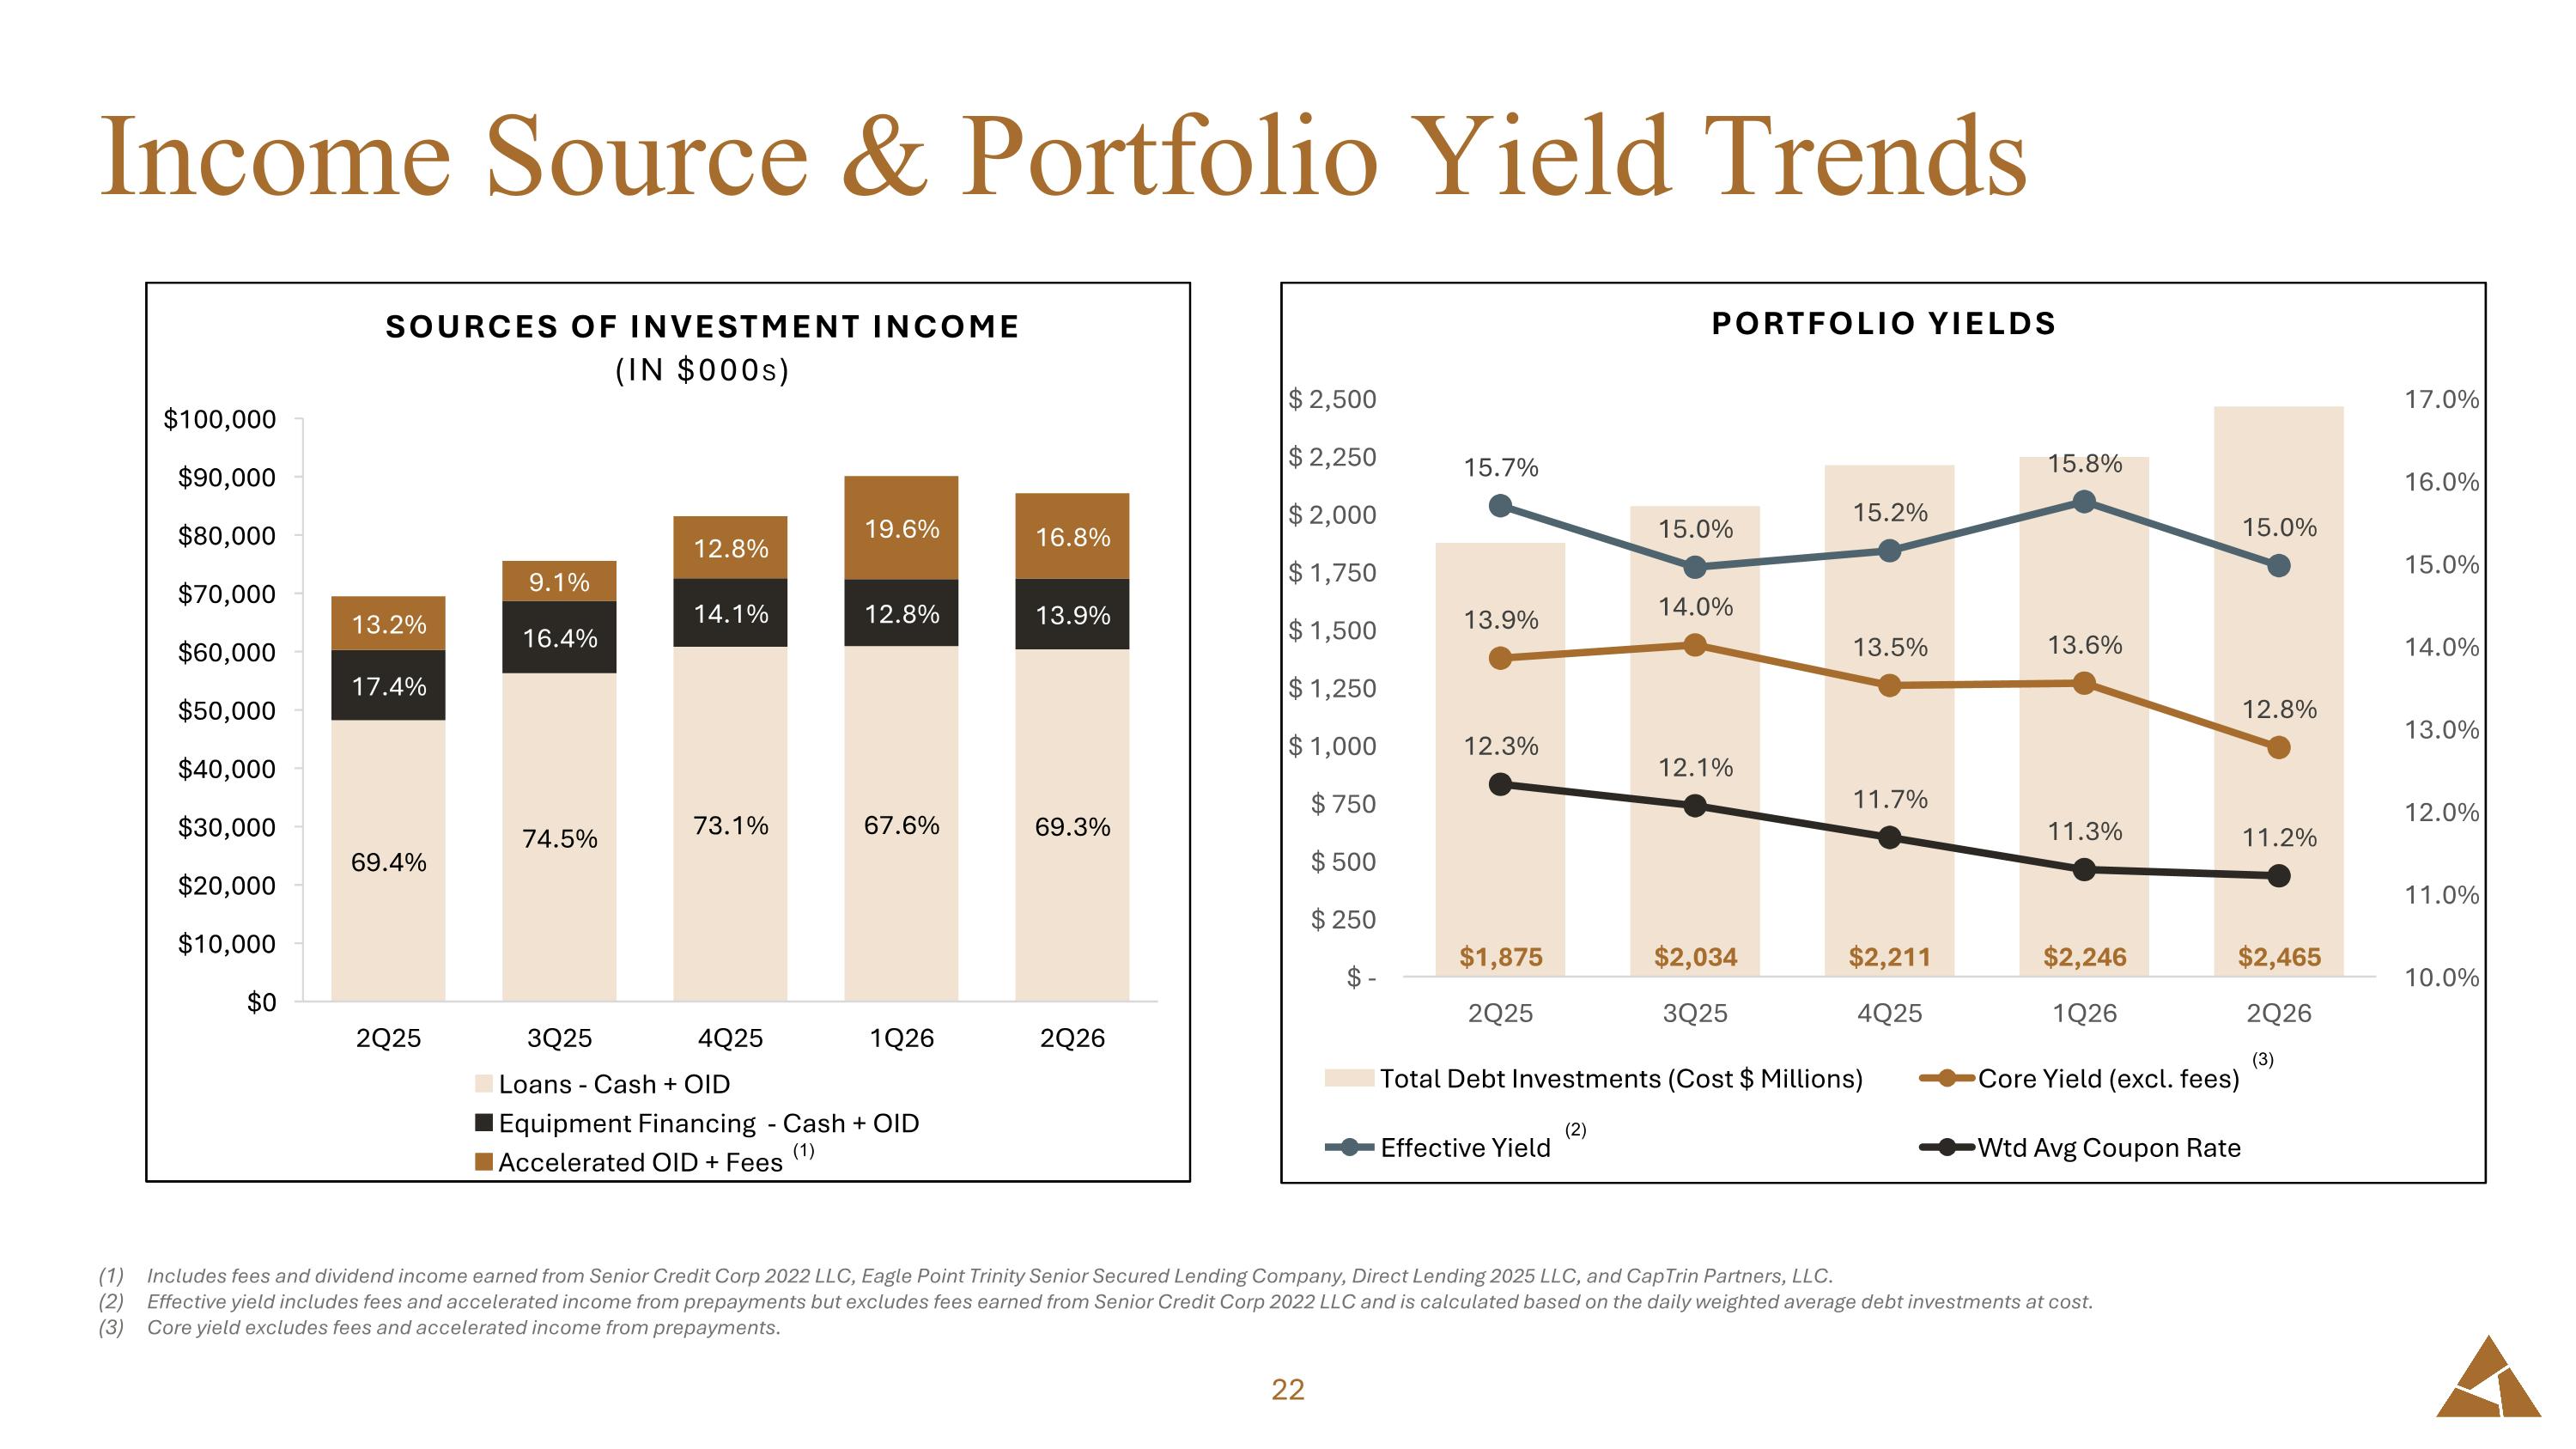
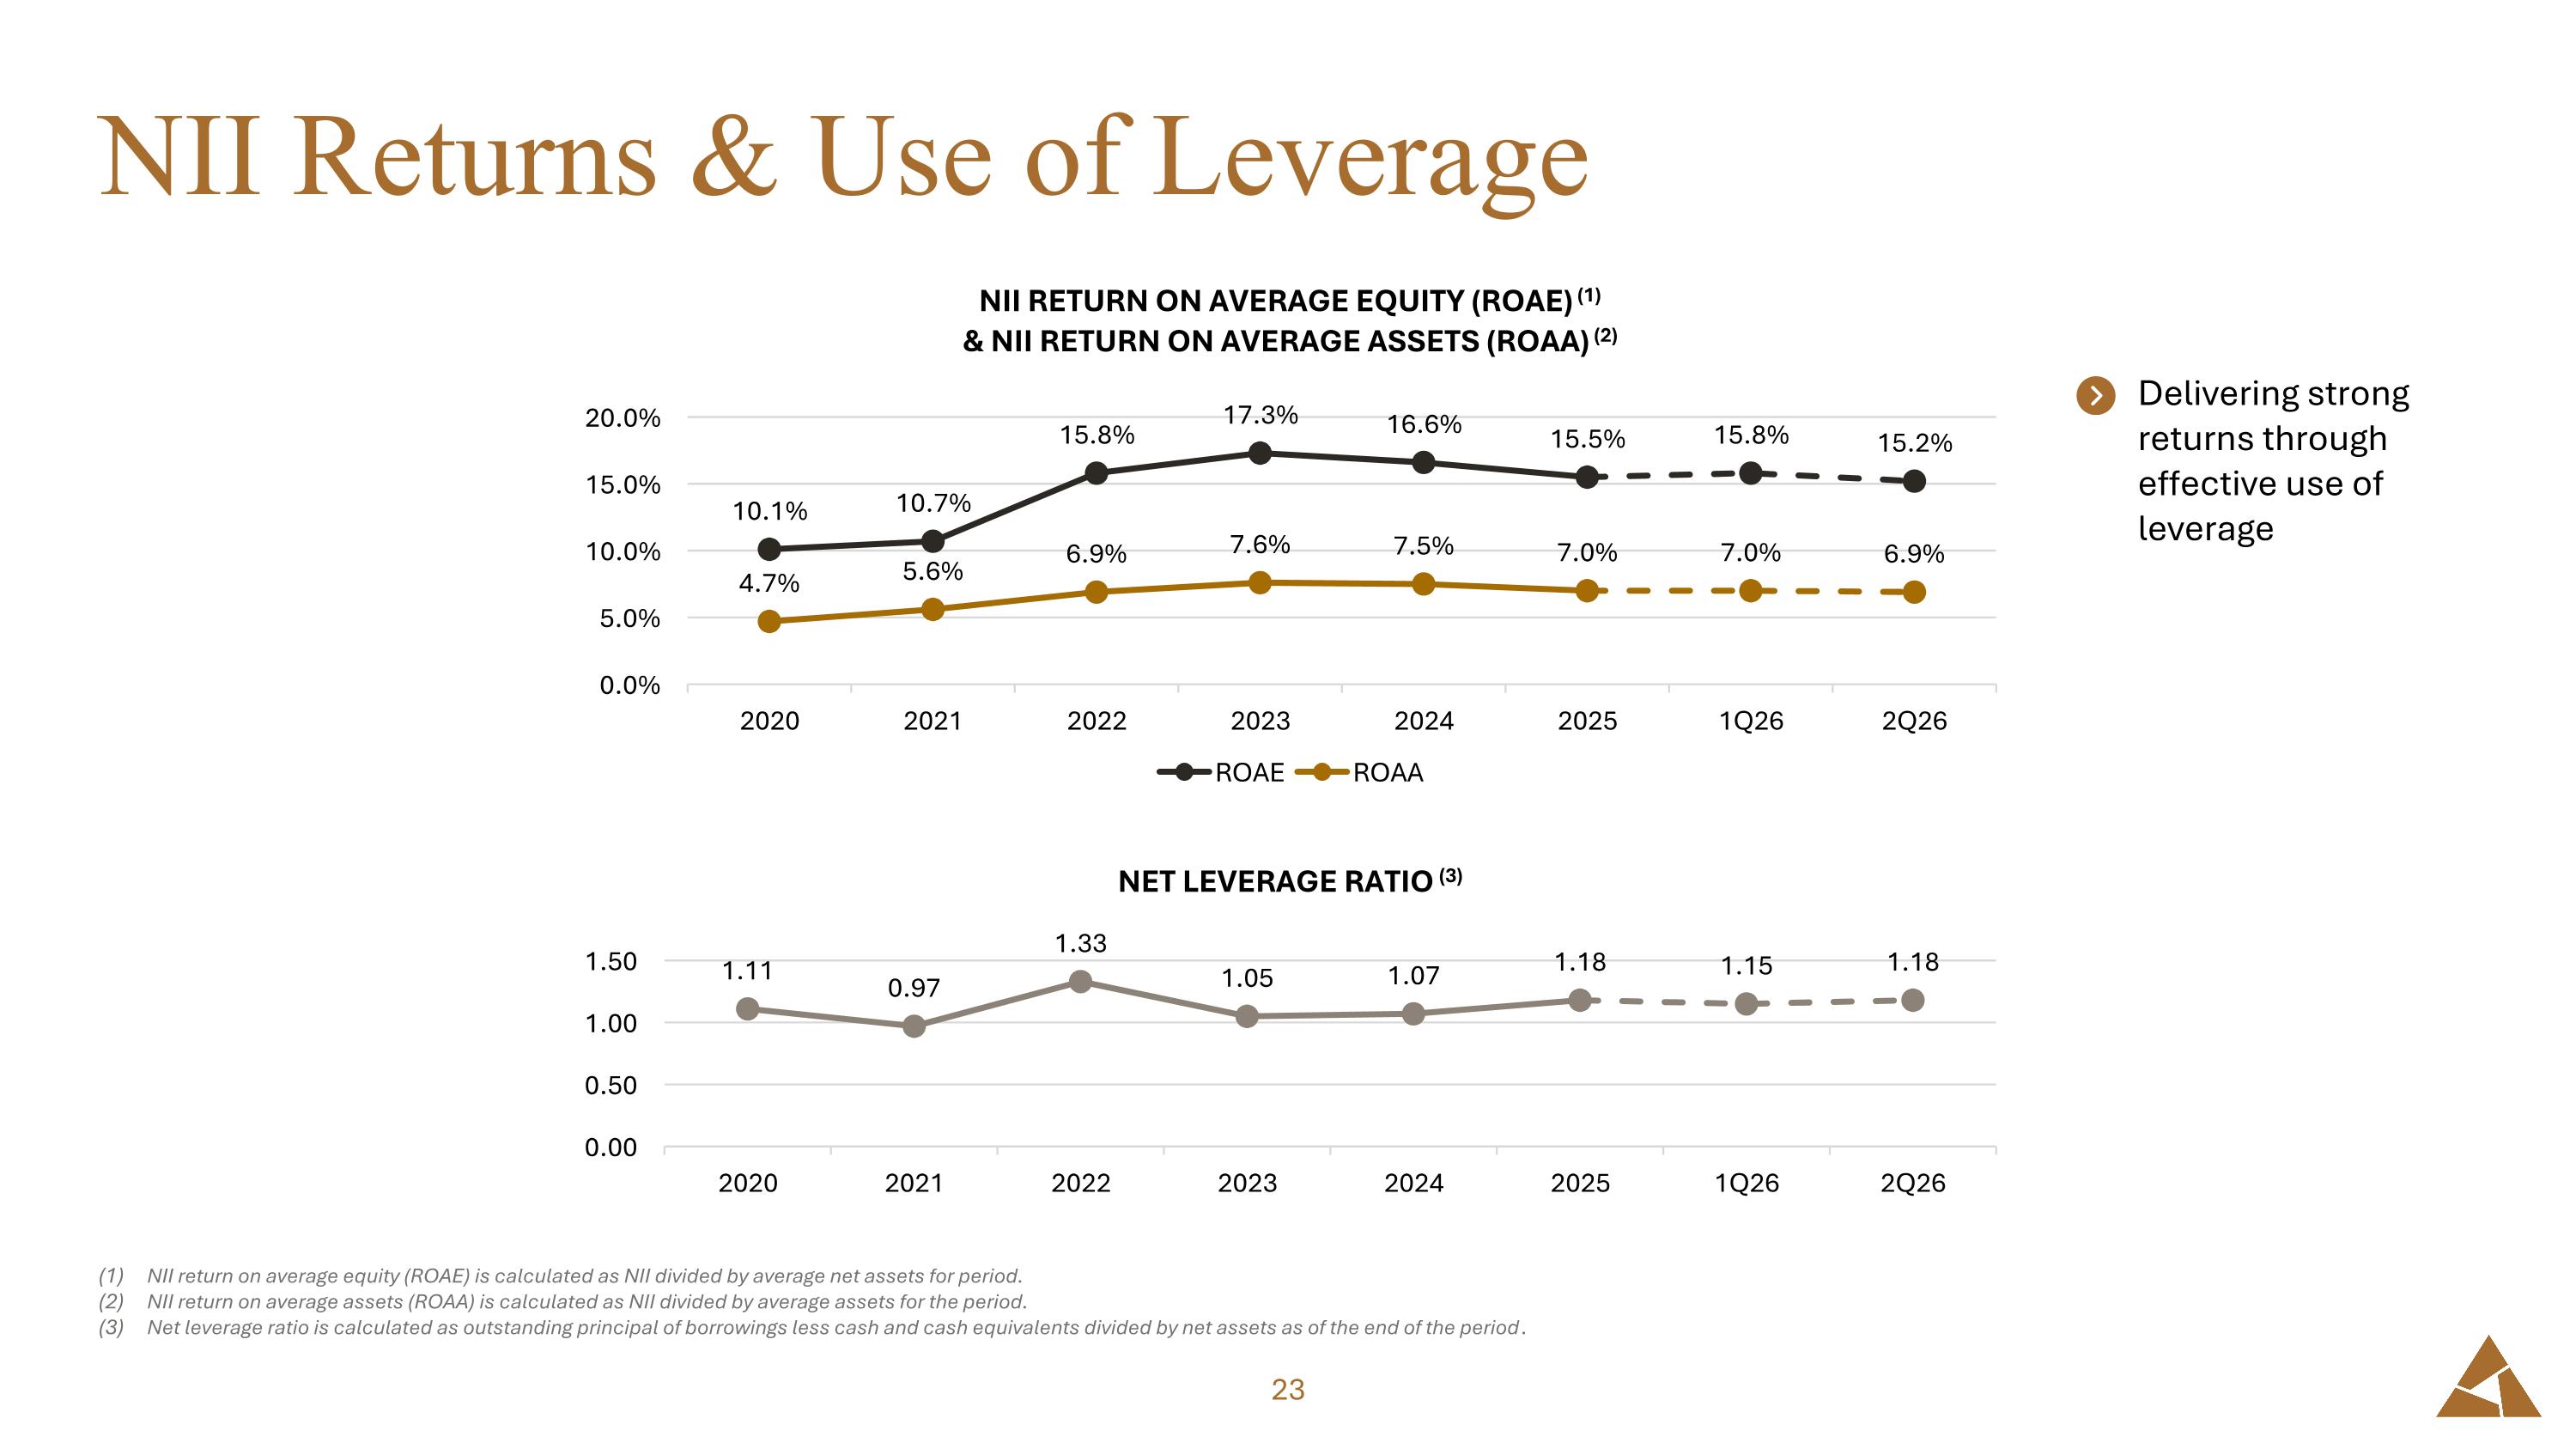
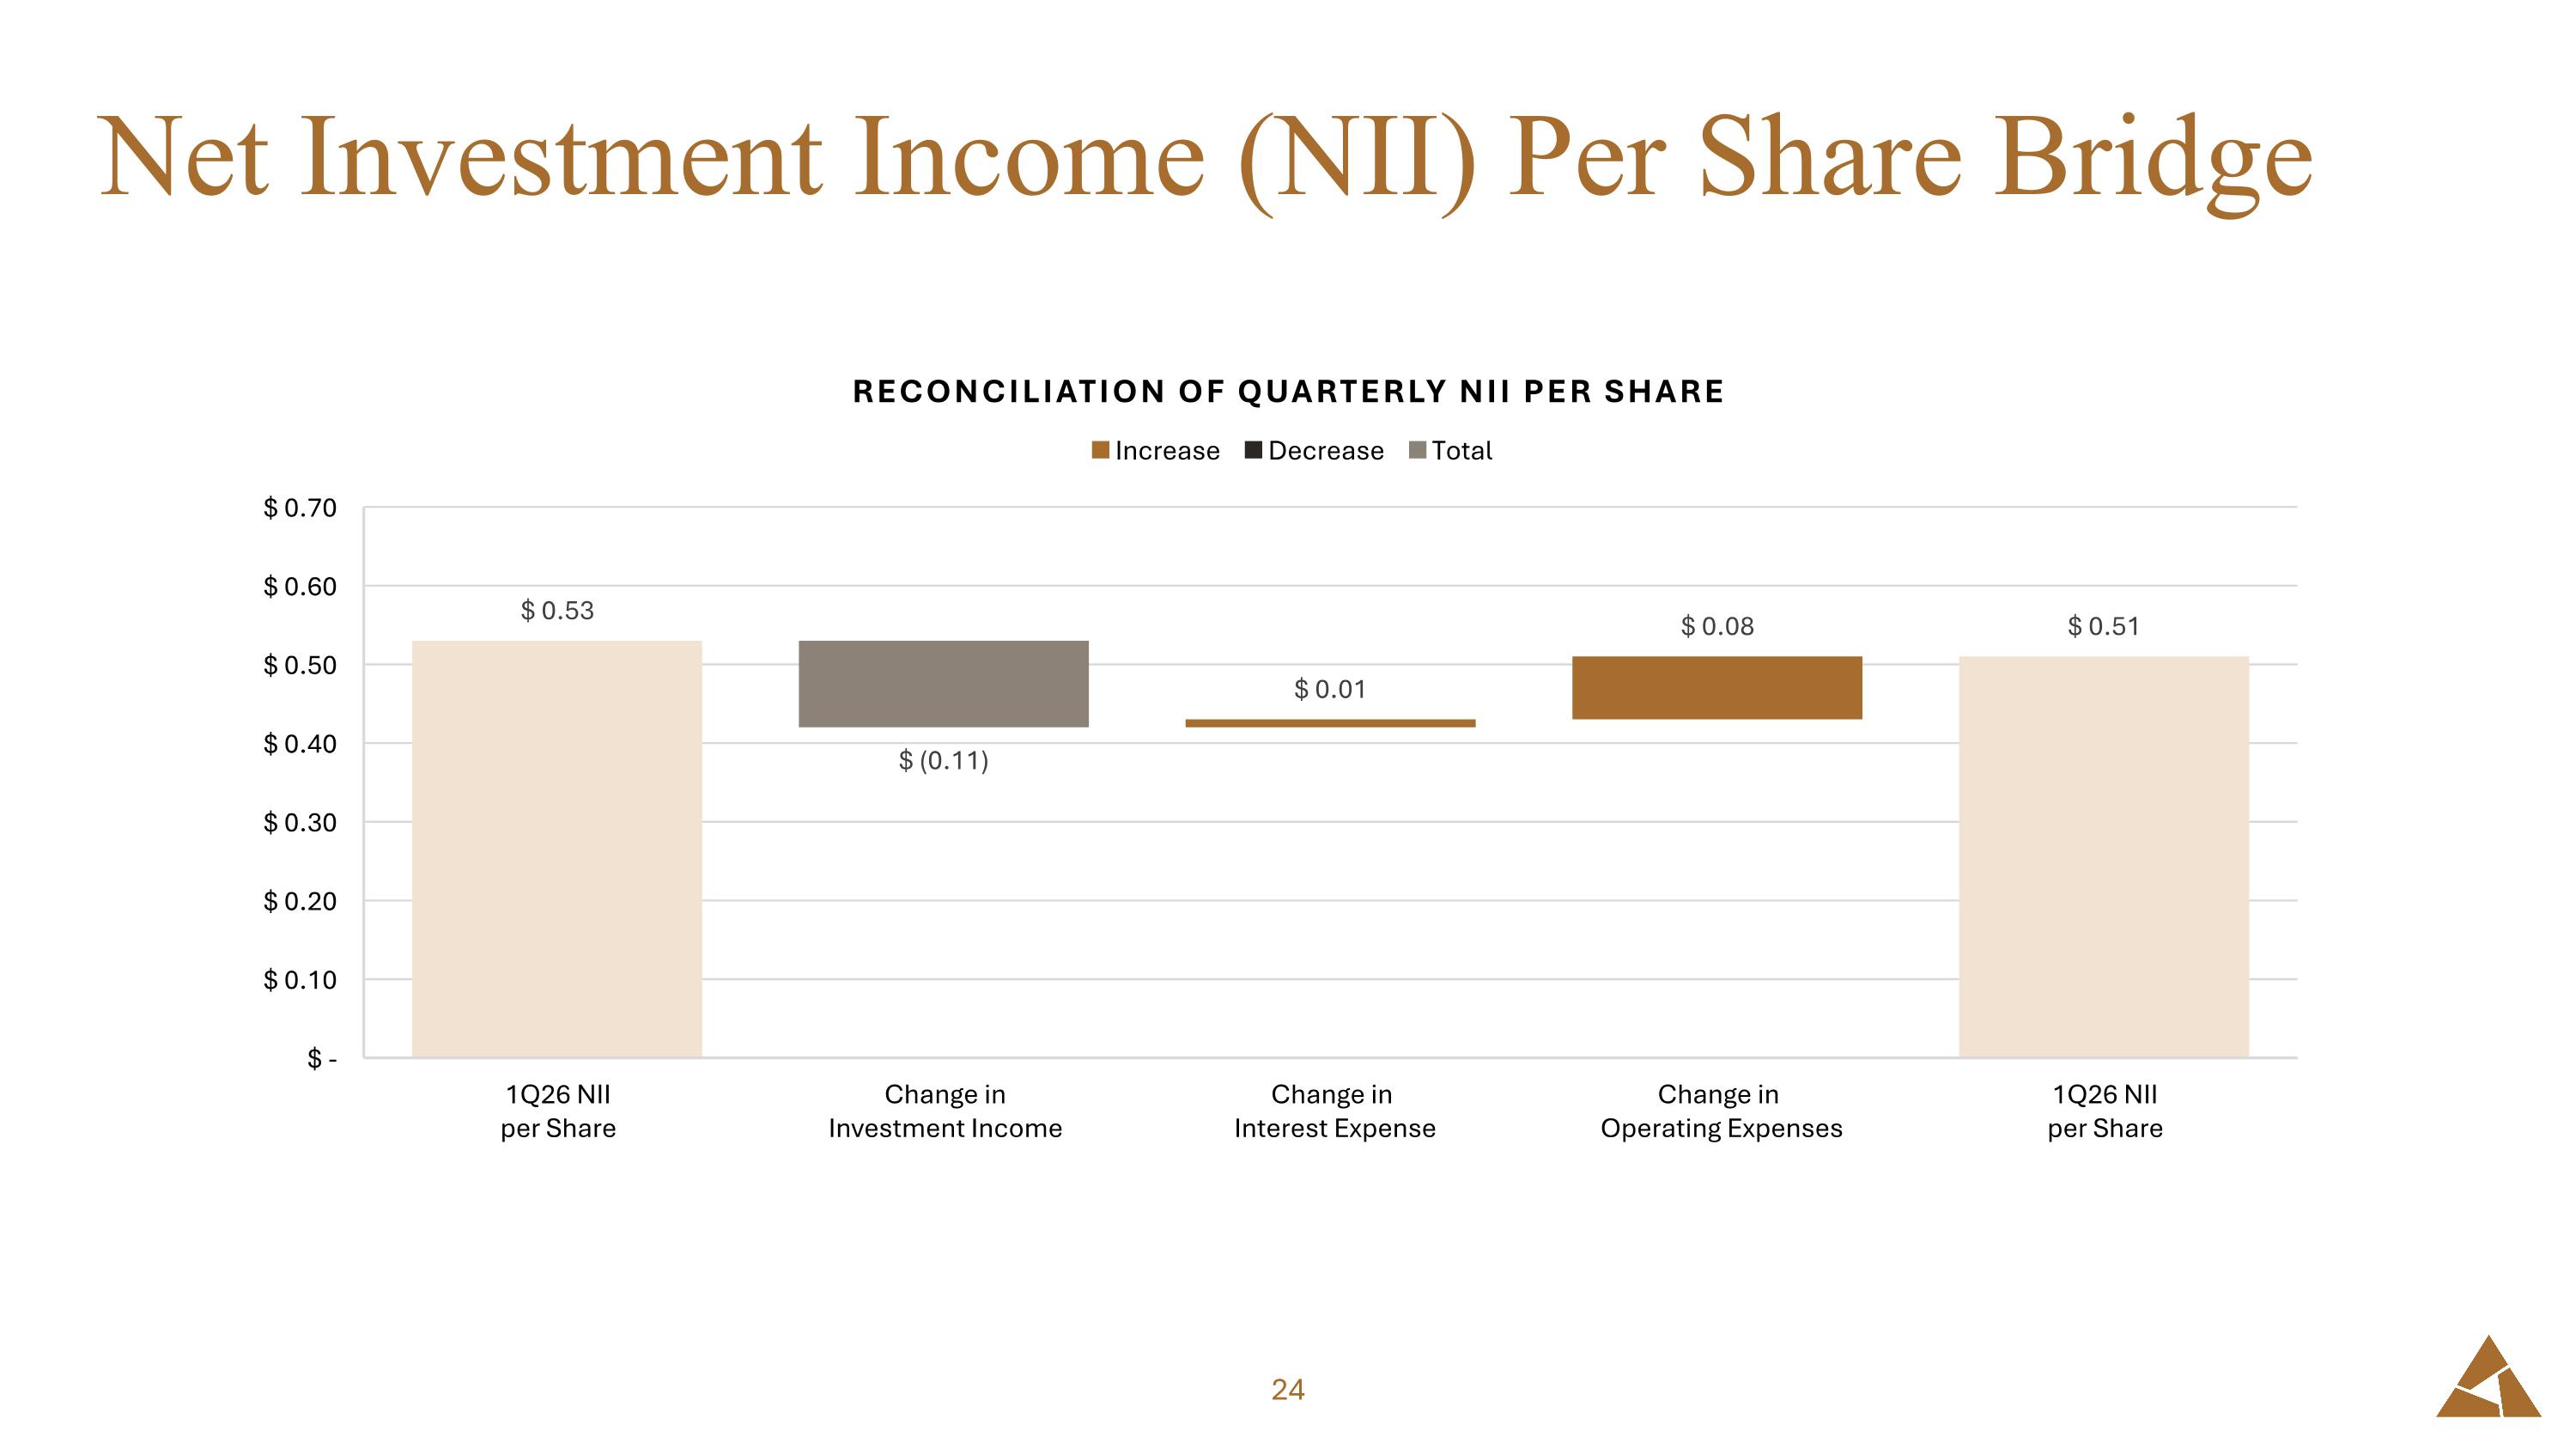
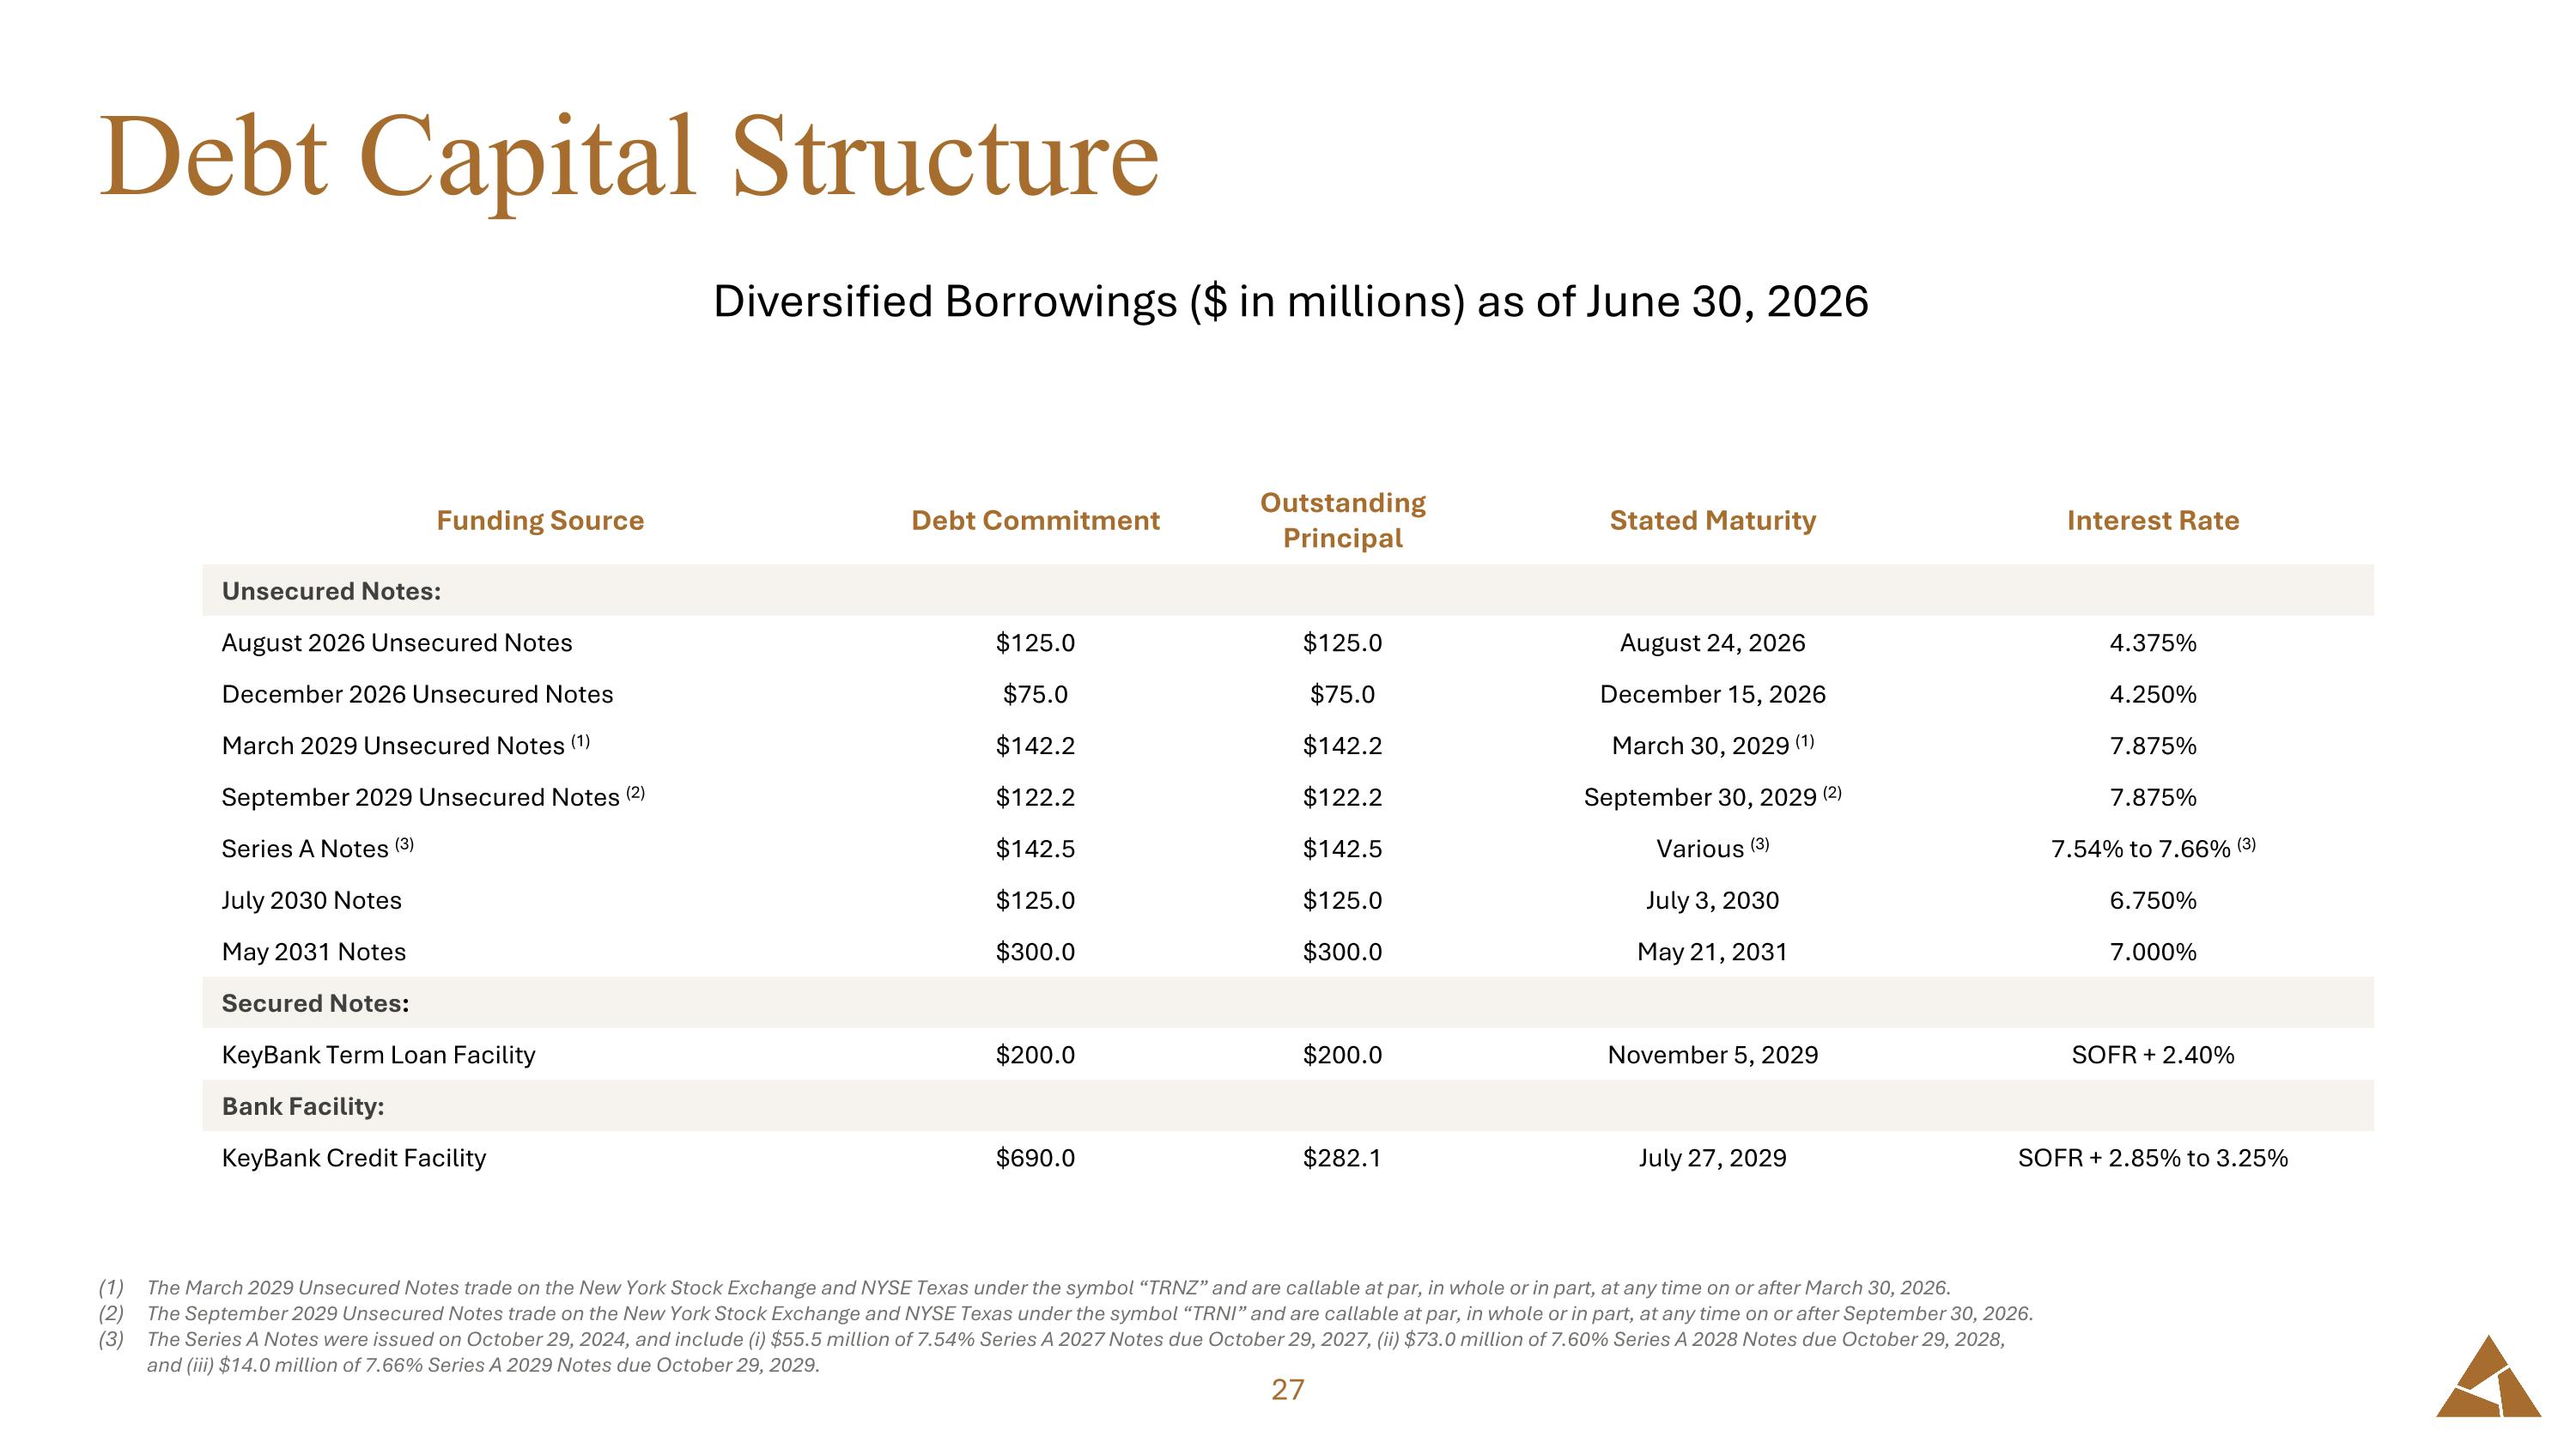
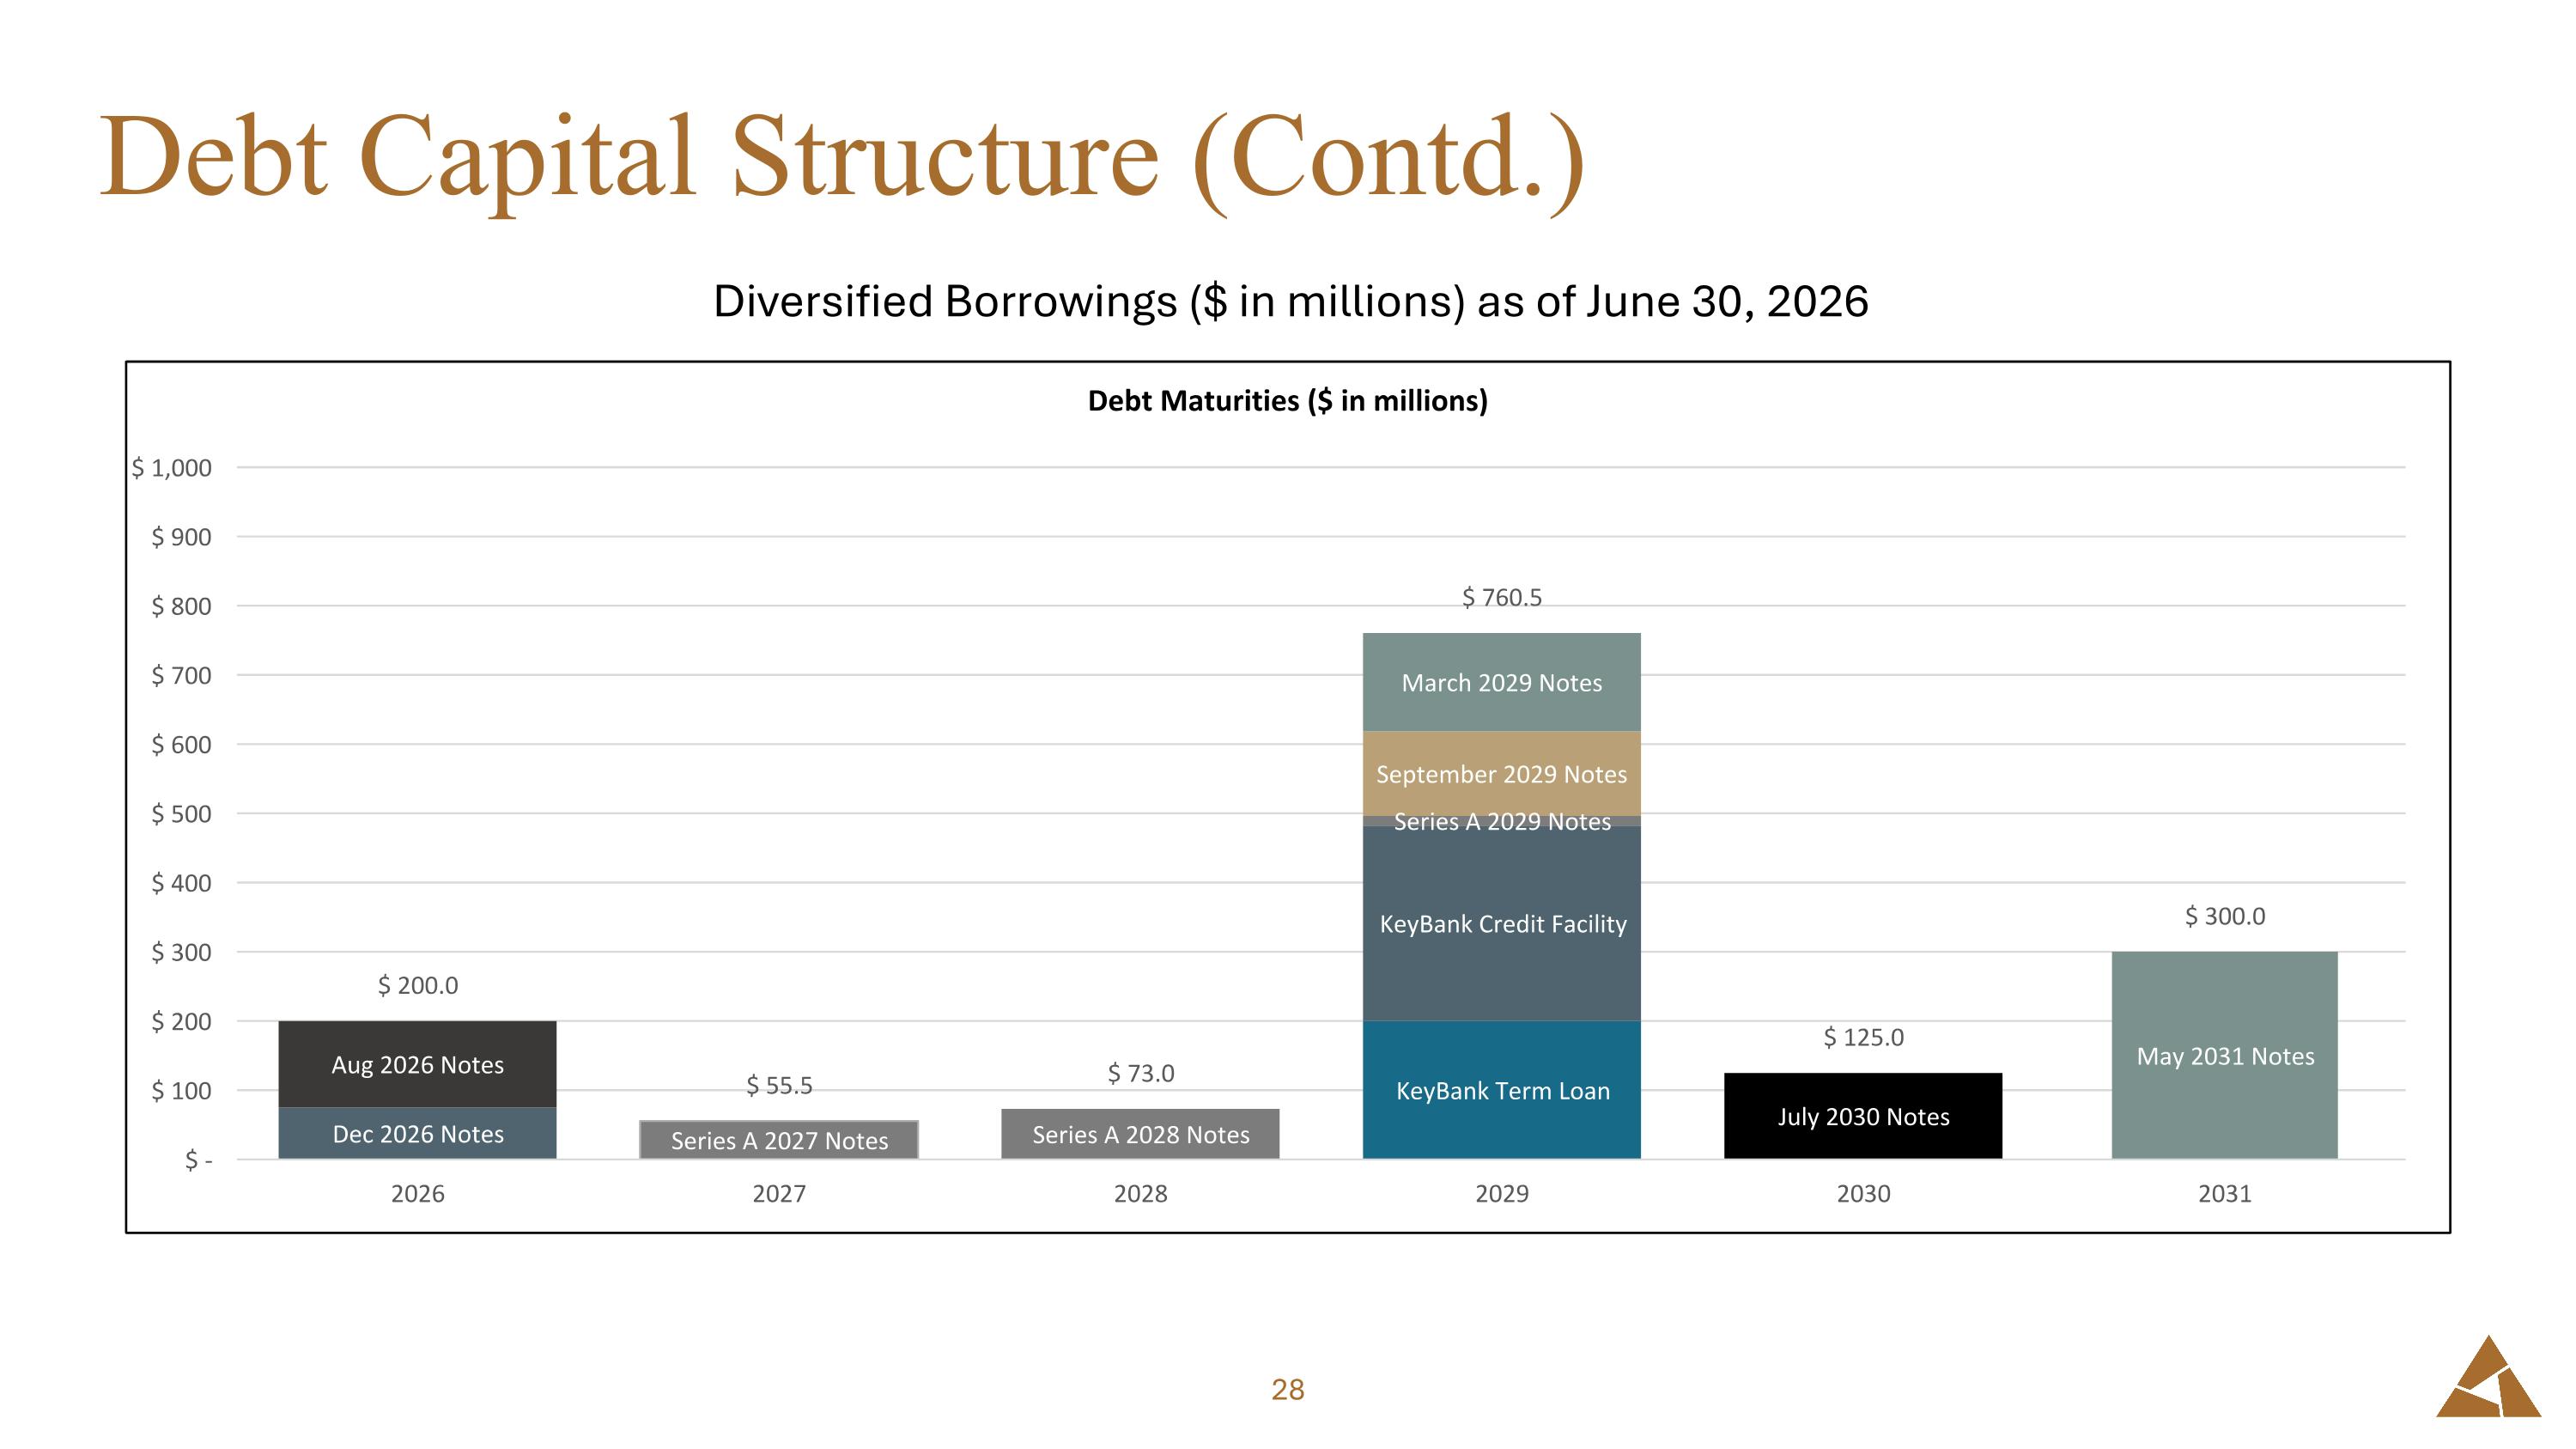
Thank you, Sarah. our financial performance remains strong in Q2. We generated $87 million in total investment income, a 25% year-over-year increase, and a $41.6 million in net investment income, or 51 cents per share, representing 100% of our quarterly distribution. Our quarter-over-quarter decrease in net investment income per share primarily reflects lower dividend income compared to Q1, which included a non-reoccurring dividend from one of our equity investments. Additionally, Q2 origination activity was back-end weighted, meaning the full income benefit of our record fundings will be more fully reflected in Q3. Our net assets grew 9% to a record $1.3 billion, up 37% year-over-year. NAV per share increased $0.20 to $13.47, up 1.6% quarter-over-quarter, driven primarily by accretive ATM issuances. This accretion more than offset the modest net unrealized and realized depreciation. On the capitalization front, Q2 was an active quarter. In May, we closed our inaugural investment-grade public bond offering of $300 million five-year senior unsecured notes, which adds long-dated fixed-rate debt to our liability stack and extends our maturity profile. We raised $100 million to our equity ATM program and averaged 24% premium to NAV, which is directly accretive to our existing shareholders. Net leverage was 1.18 times at quarter end, consistent with her target range, and total platform liquidity increased to $939 million, driven in large part by the close of our SBIC funds. And lastly, a few other metrics worth highlighting. Estimated undistributed taxable income stands at approximately $66 million, or $0.71 per share, equivalent to more than four months of distributions. We continue reinvesting this spillover for shareholders while maintaining consistent and meaningful dividends. Our 15.2% return on average equity and 15% effective portfolio yield are among the highest in the BDC sector. And PIC remains immaterial at 1% of income. And now our COO, Jerry Harder, will walk you through portfolio performance from here.
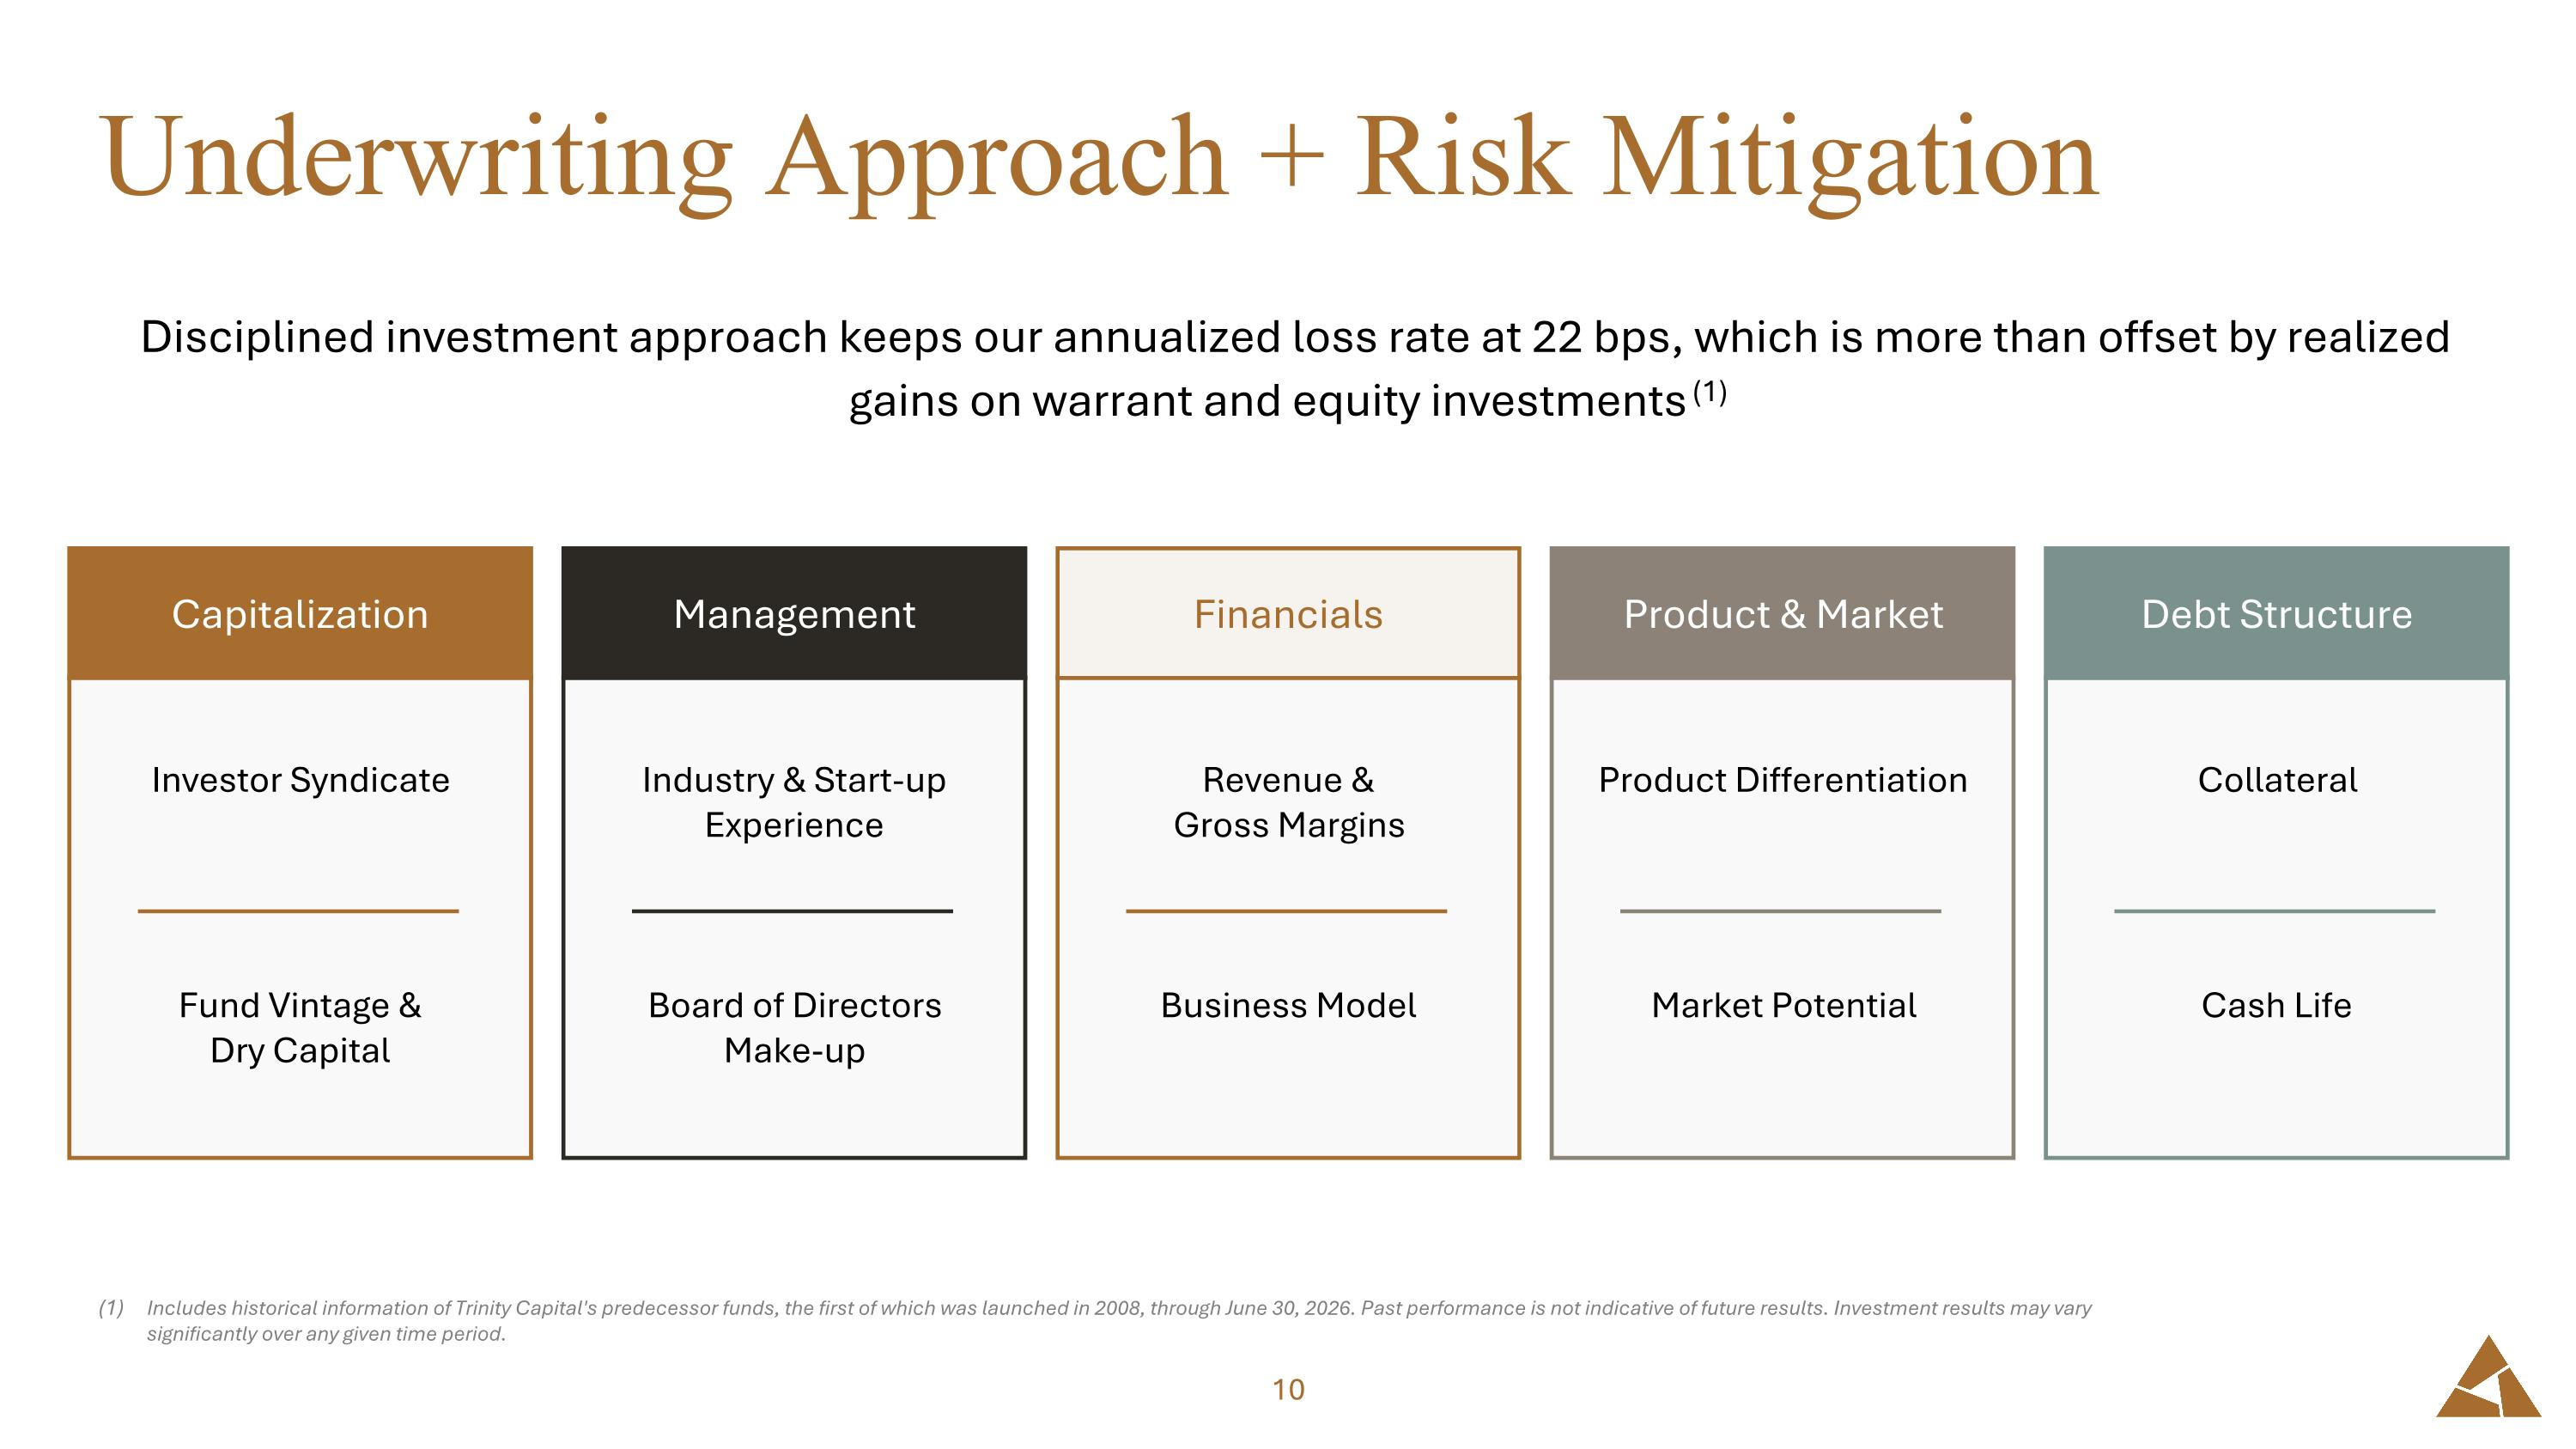
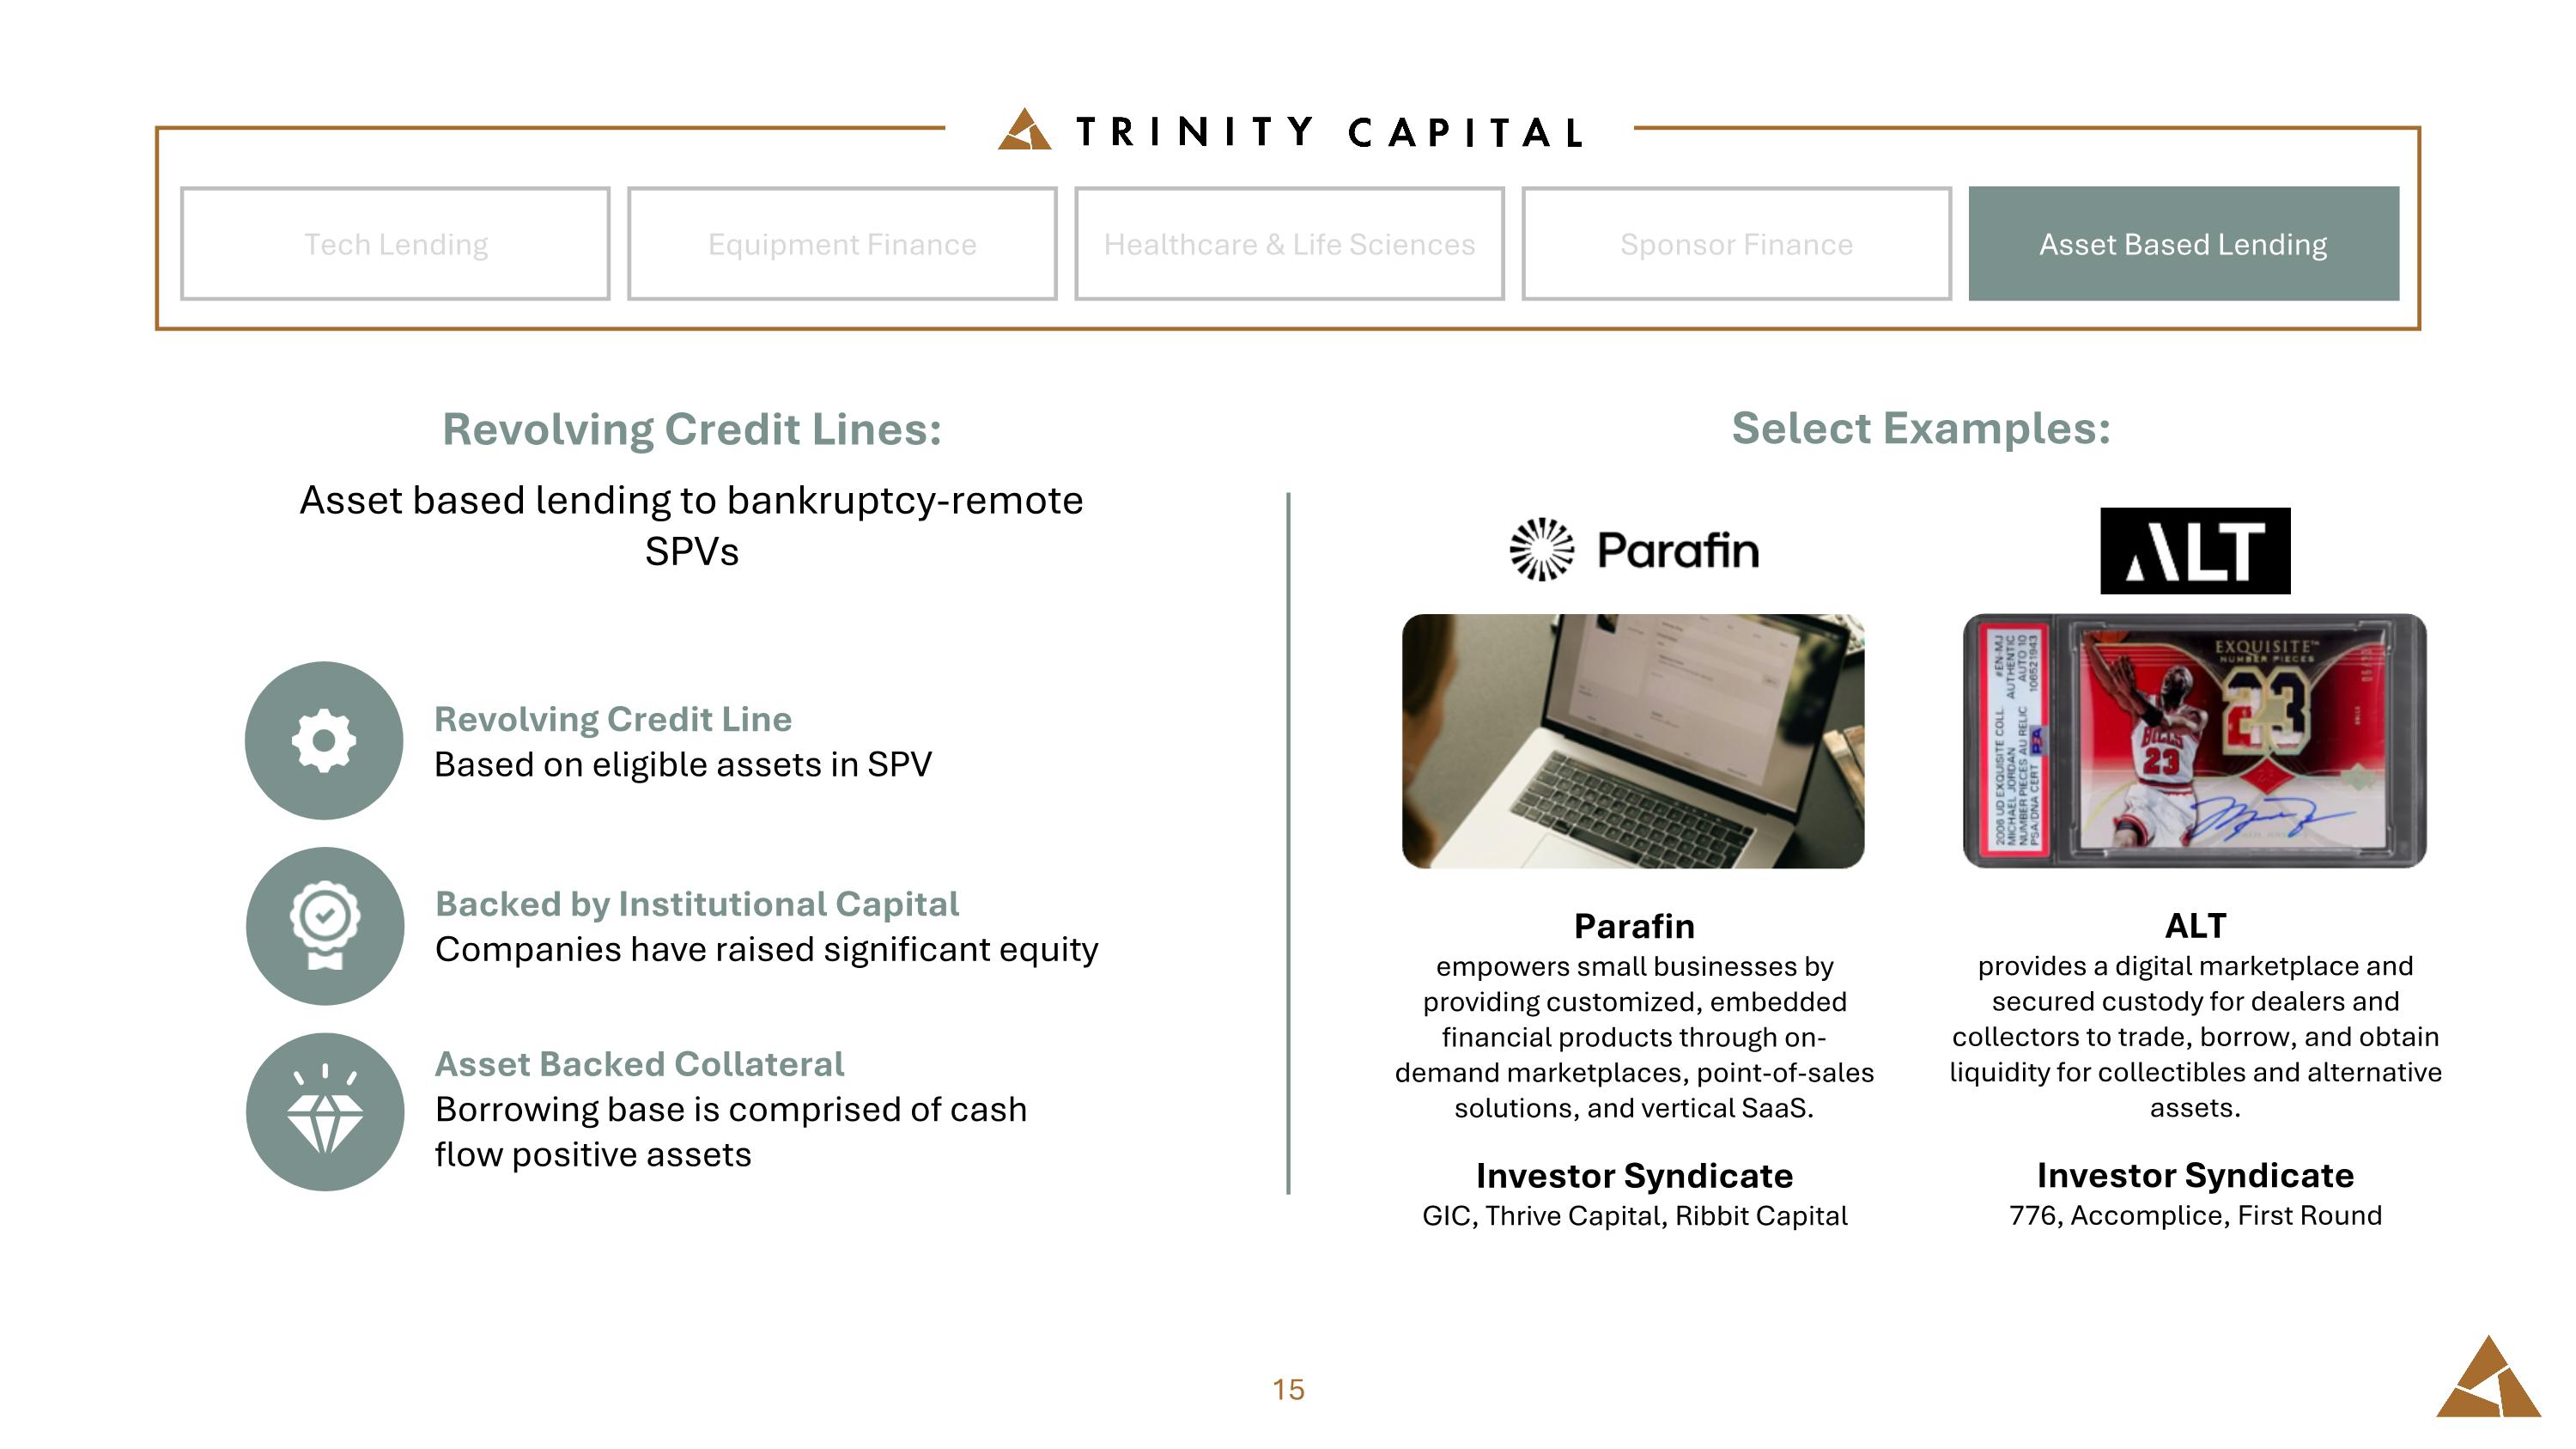
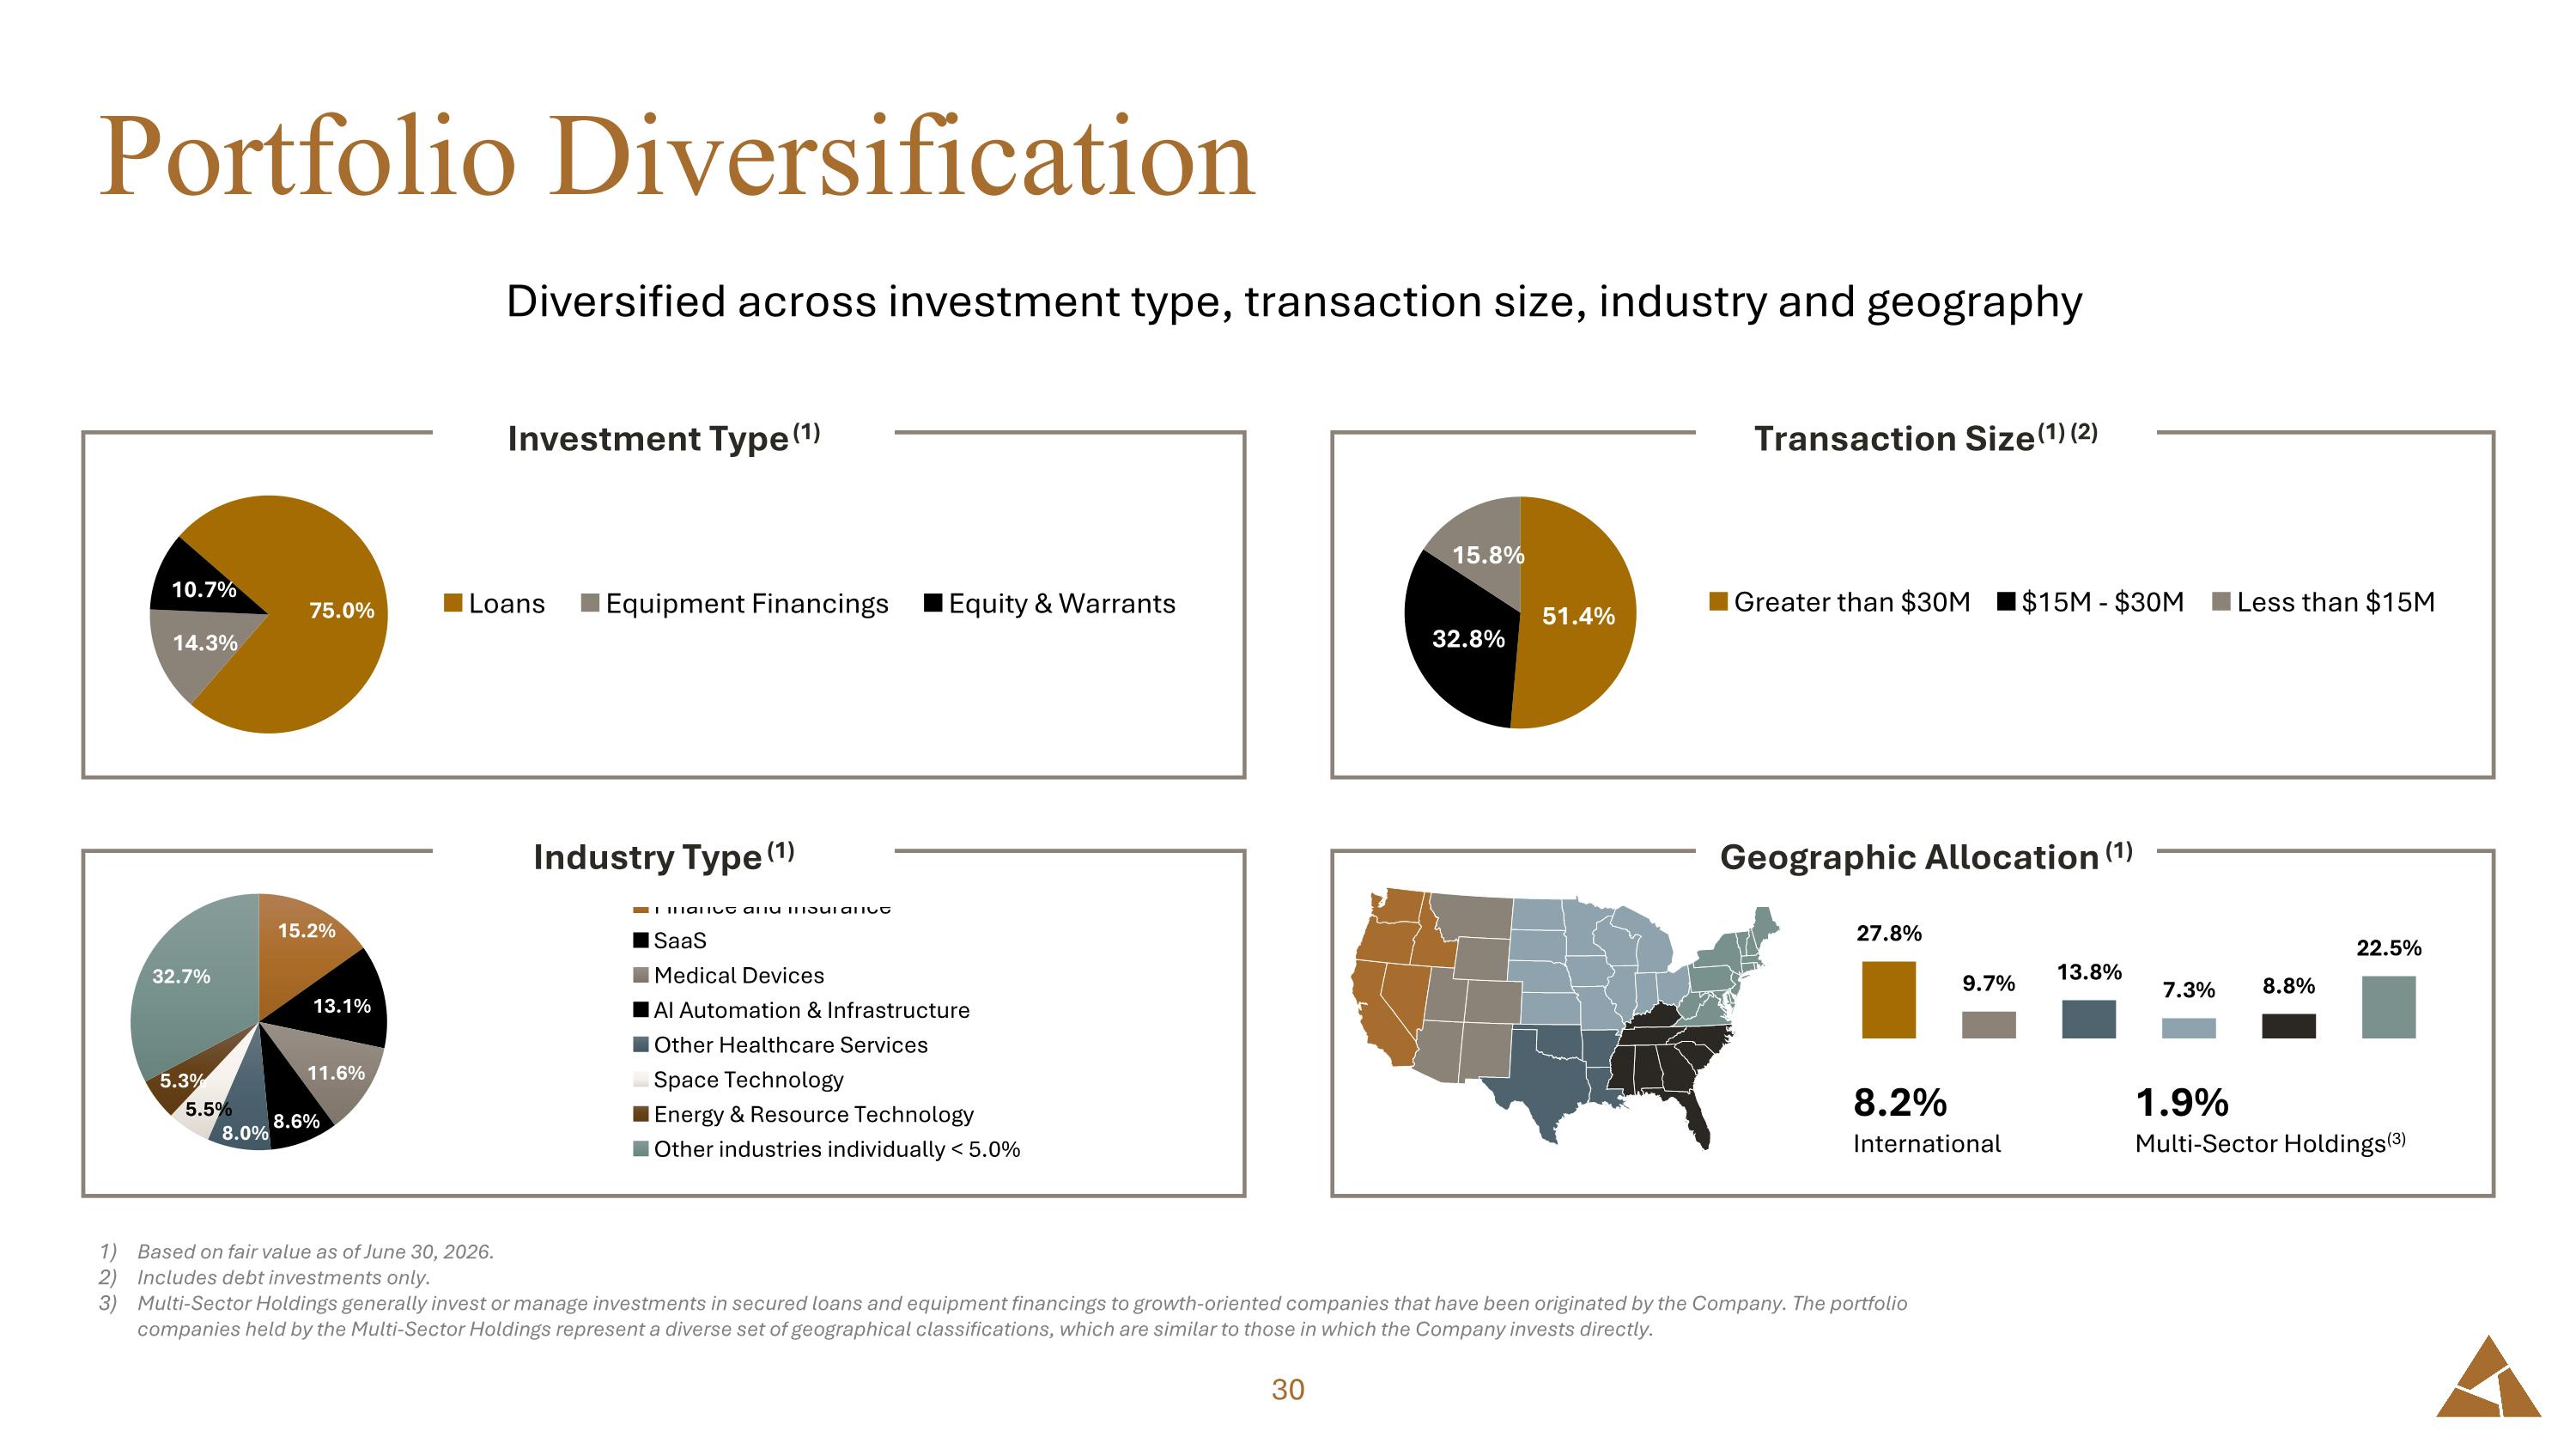
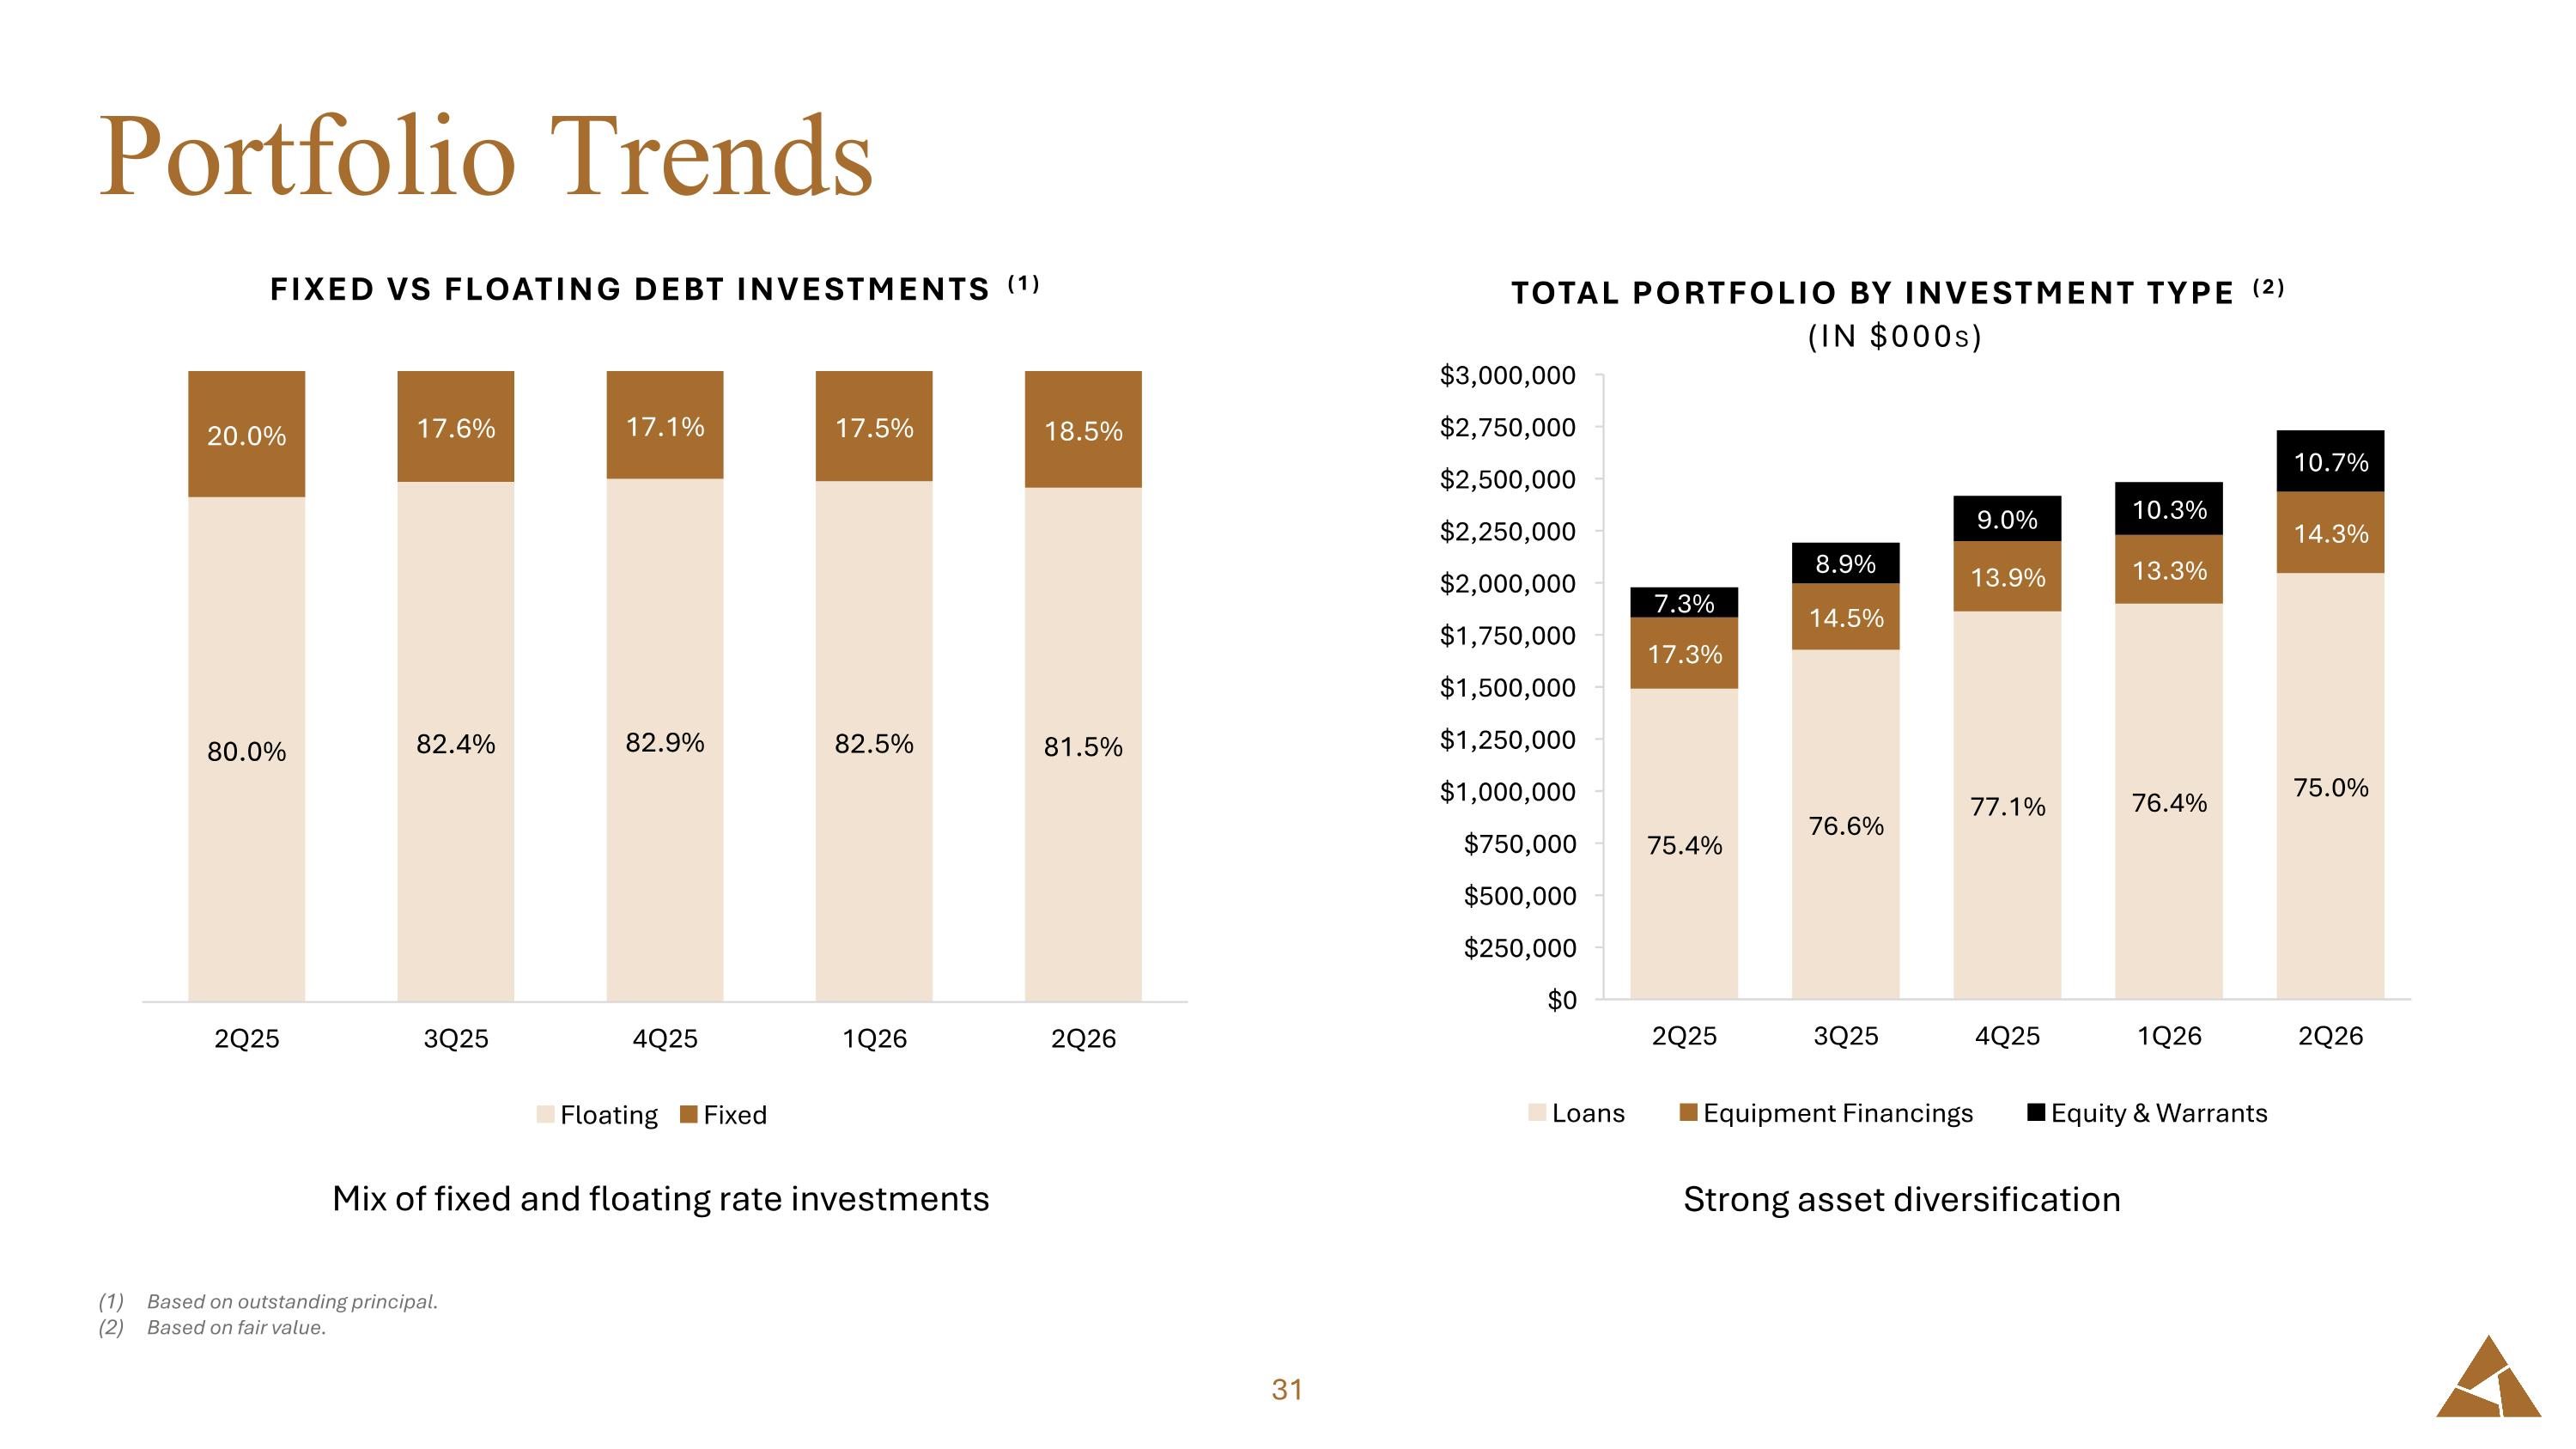
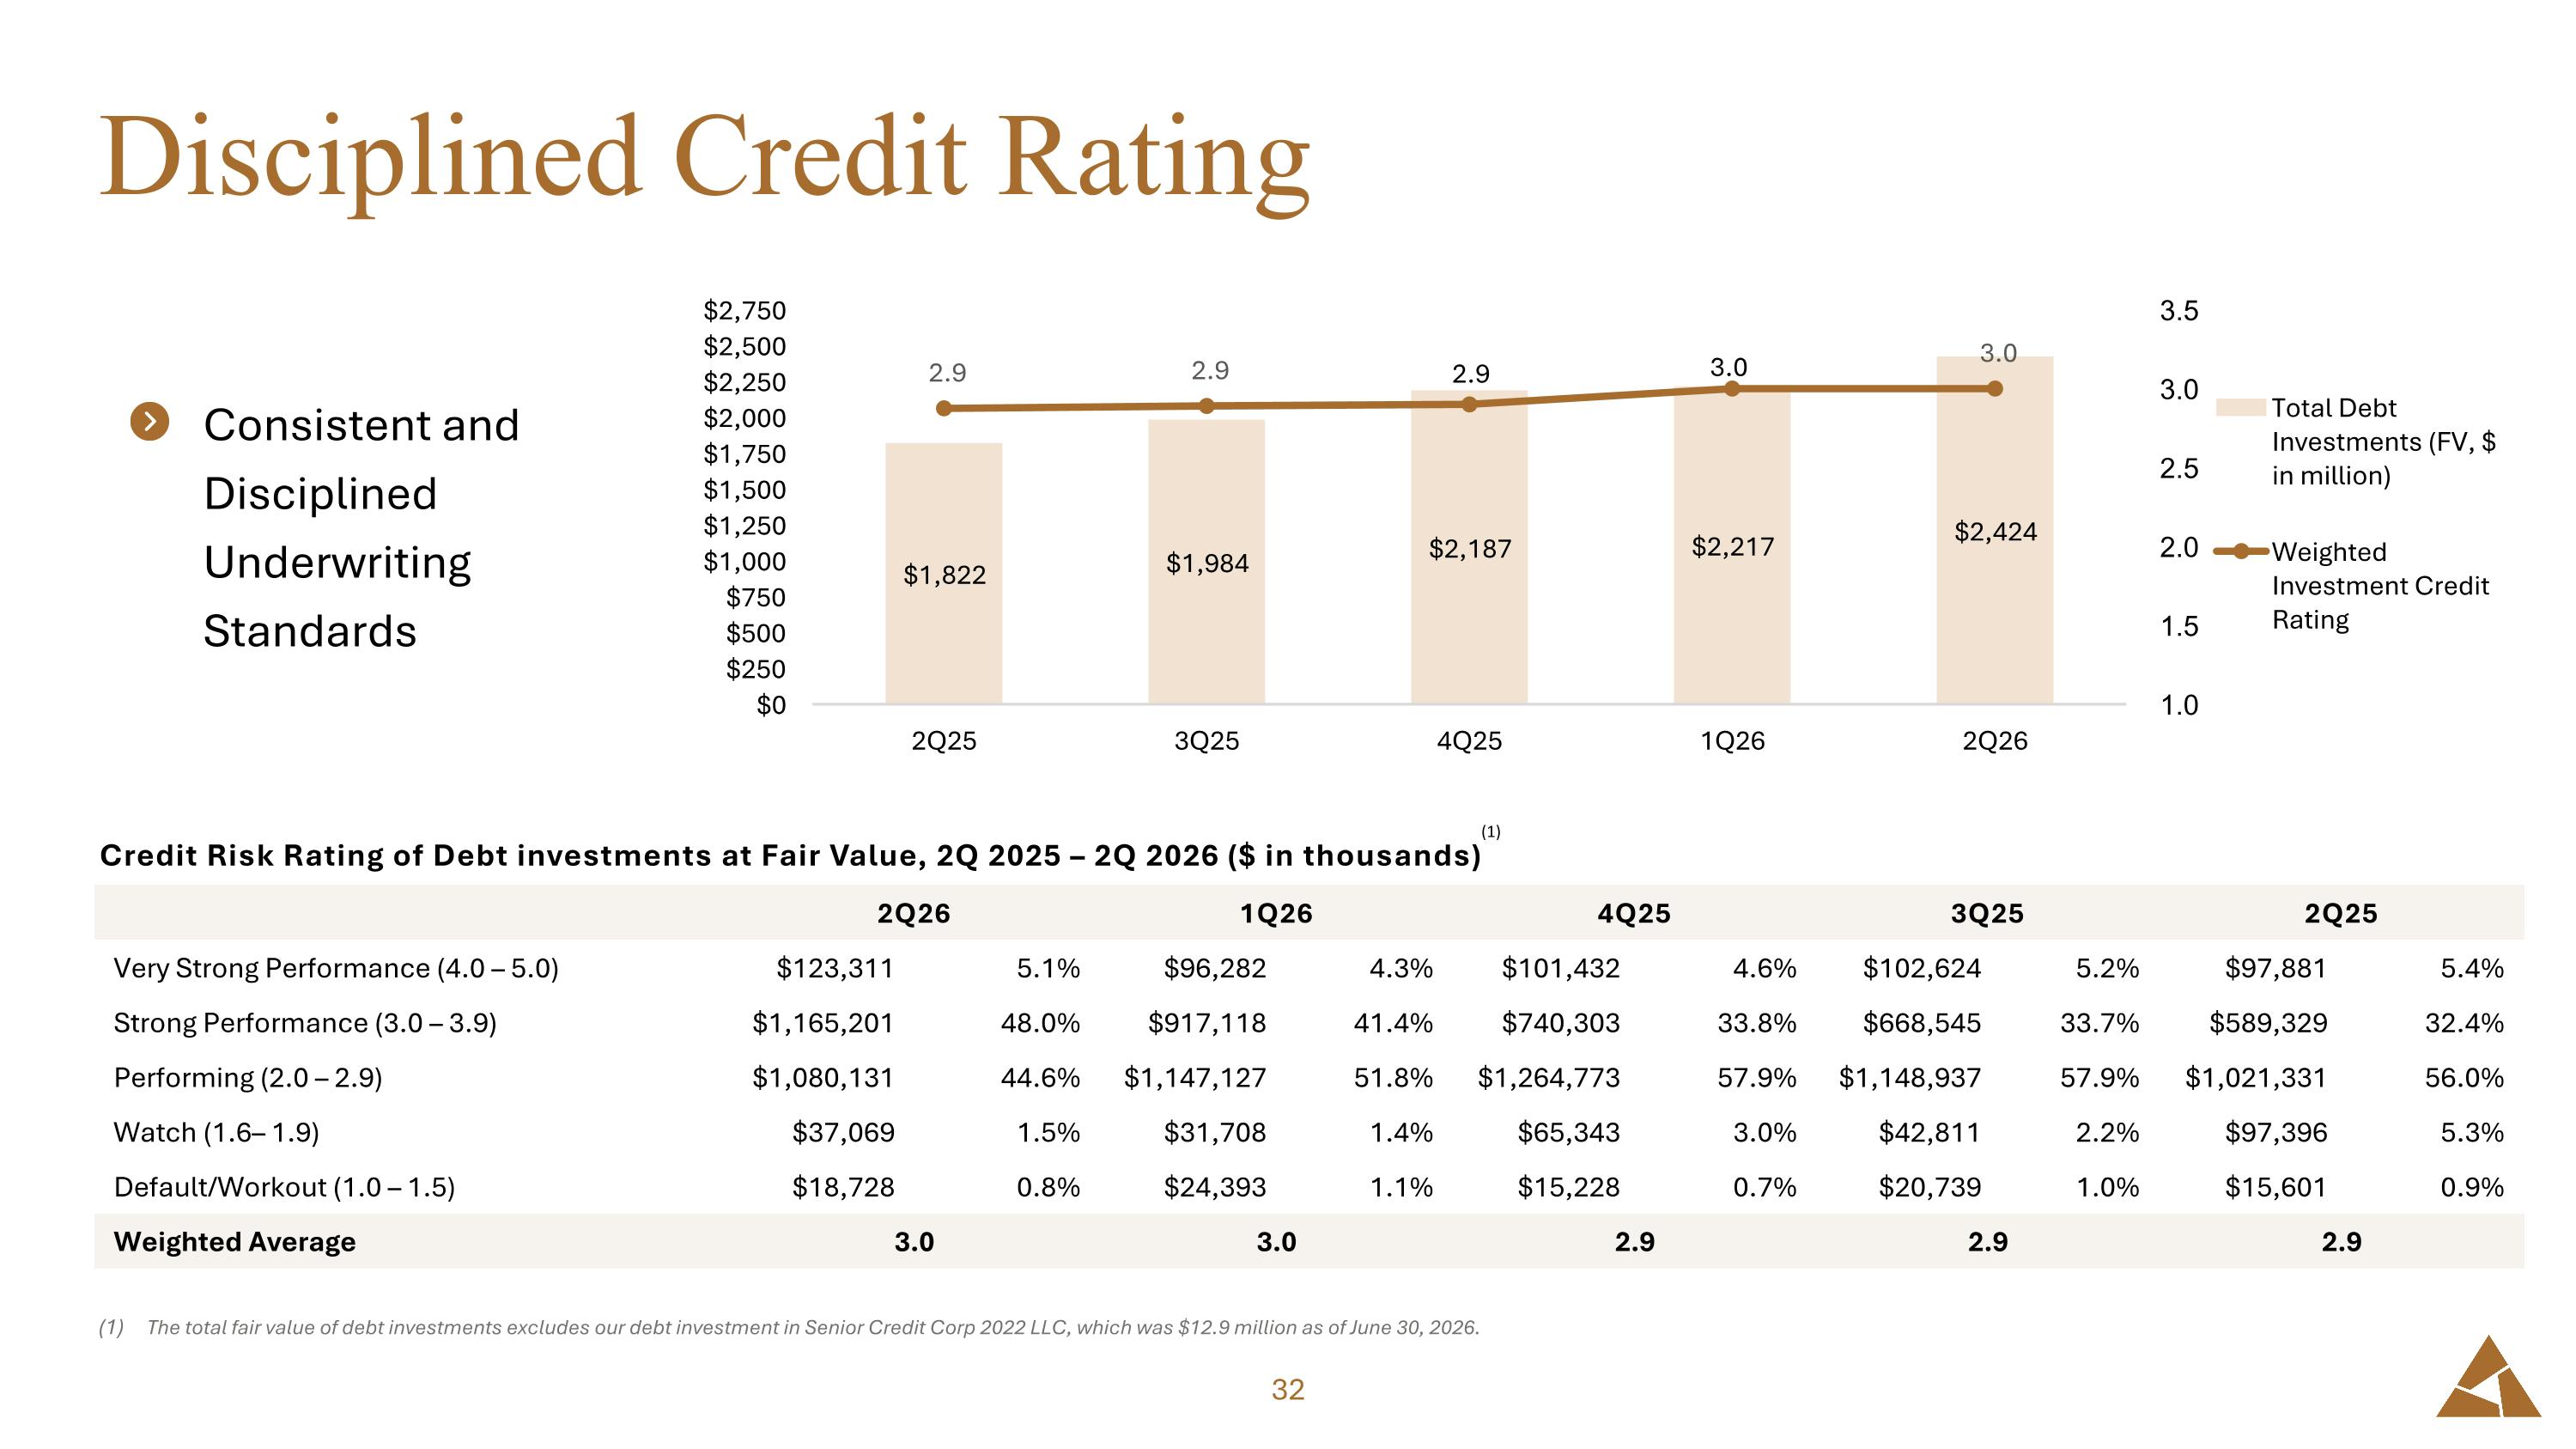
Thank you, Michael. Our portfolio continues to perform well and remains highly diversified. Across 22 industries, no single borrower exceeds 4% of total exposure, and our largest sector concentration, finance and insurance, is 14% at cost, and spread across 17 companies. We believe diversification and strong underwriting are excellent risk mitigators. Portfolio quality held steady quarter over quarter. 99% of debt investments at fair value are performing, and our average internal credit rating remained consistent at 3.0 on our 1 to 5 scale, reflecting broad-based strength across the book. Q2 included minimal net realized losses and net unrealized depreciation. As a reminder, asset valuations are conducted each quarter with independent third-party valuation firms, reviewed by our independent auditor, and approved by our board, a multi-layered process designed to give investors confidence in the marks on our balance sheet. The number of companies on non-accrual remained at 5, with no changes to the non-accrual list from Q1. As of June 30, non-accruals represented less than 1% of the total debt portfolio, a level we continue to manage actively. Net of refinancings, early repayments totaled approximately $108 million in Q2, which continues to be elevated relative to historical averages. Early repayments are inherently difficult to predict but often reflect portfolio company strength, borrowers reaching a point where they can access the broader capital markets on their own terms by achieving key milestones or completing equity raises. The timing lag between repayments and redeployment of capital into new earning assets can create a near-term drag on interest income, though this is partially mitigated by prepayment penalties and the acceleration of fees and OID at payoff. Overall, we are encouraged by our portfolio churn. As our loan book continues to refresh in a beneficial way, 70% of the portfolio at cost has been originated since the start of 2025, with pre-2024 vintages now below 8%. And the average duration of realized loans currently stands at 30 months. In our eyes, portfolio turnover signals portfolio health, as new deals typically imply longer cash runways and fresher equity support. First lien coverage remains strong at 89% of total principal, secured by first position liens on enterprise value, equipment, or both. For enterprise value-backed loans, the weighted average LTV was 24%. In net of refinancings, Q2 fundings broke down across our five verticals as follows, 37% to sponsor finance, 26% to equipment finance, 18% to tech lending, 10% to asset-based lending, and 5% to health care and life sciences, with the remaining 4% syndicated to off-balance sheet entities. Our portfolio remains defensively positioned, firstly in bias, low LTVs, and discipline underwriting, built for consistency across cycles. That foundation is what allows us to keep delivering on what matters most, reliable dividends, NAV stability, and long-term value creation. With that, we'll open the line for questions. Operator, please go ahead.
Operator
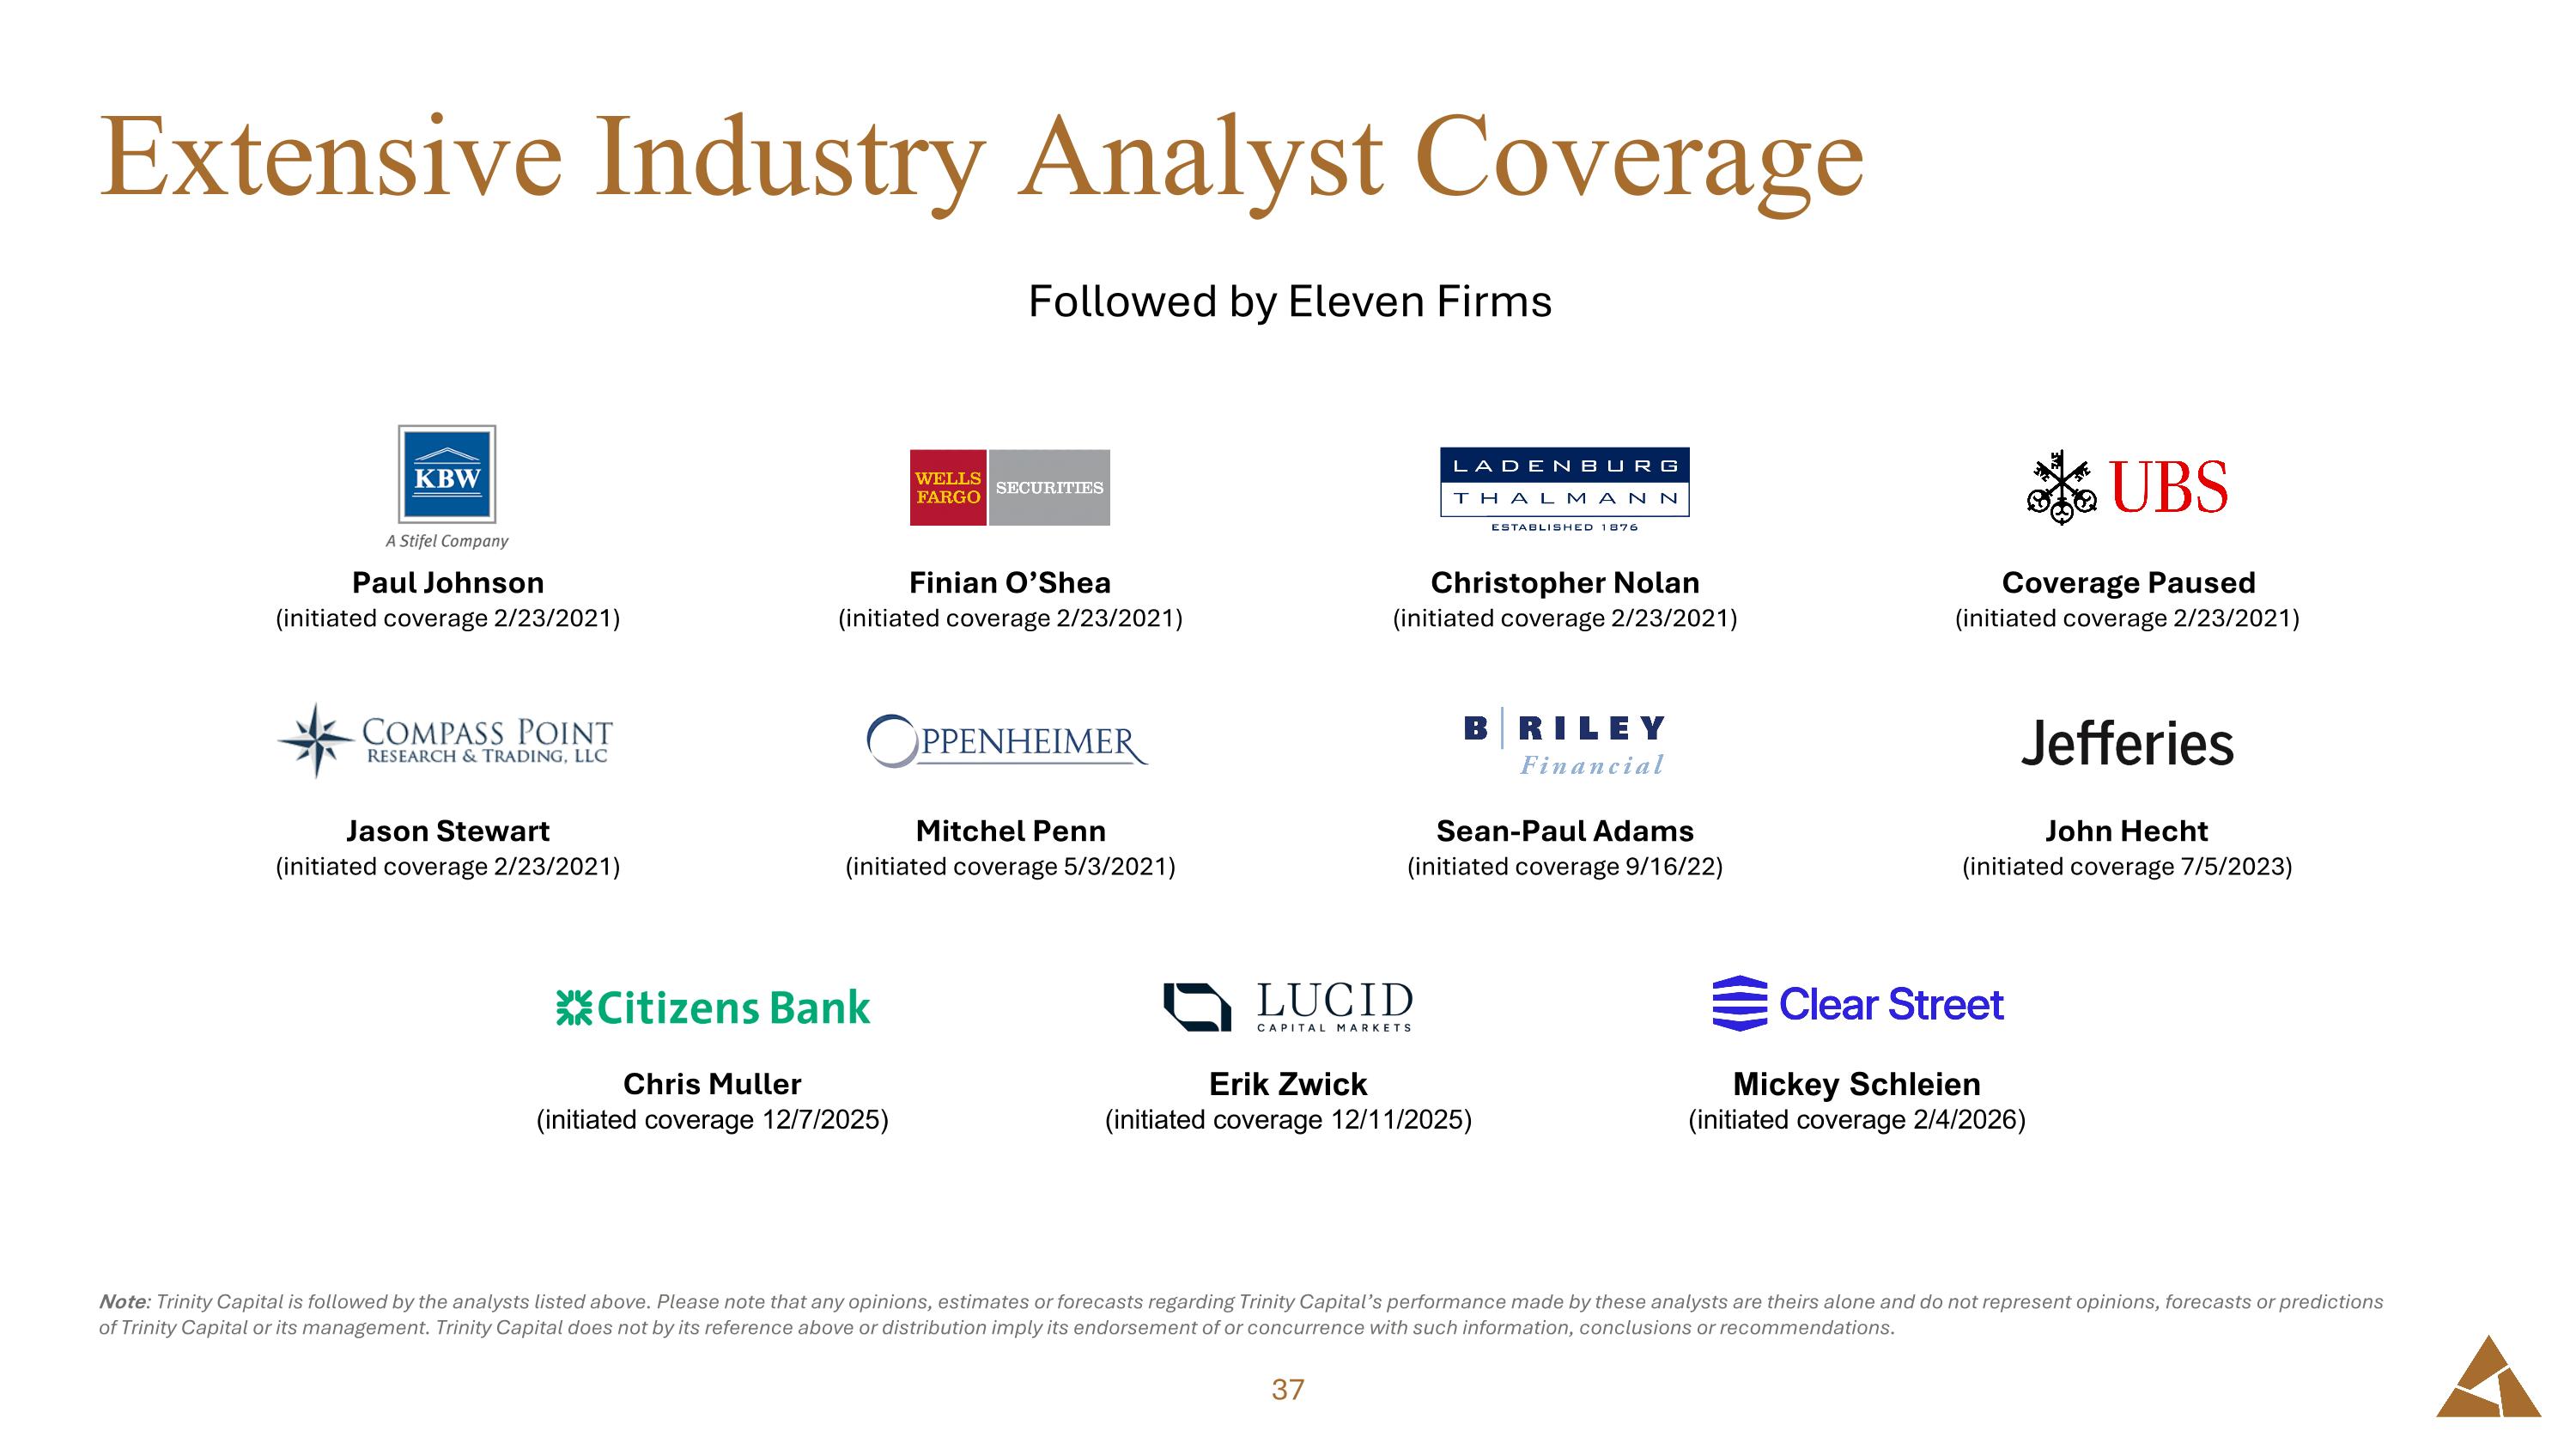
Thank you. If you'd like to ask a question, press star 1 on your keypad. To leave the queue at any time, press star 2. Once again, that is star 1 to ask a question. Our first question today comes from Finian O'Shea with Wells Fargo. Your line is now open.
Hey, everyone. Good morning. I want to start out on the JV, sort of a two-parter. The Senior Credit Corp. to start, it looks like the investment period was extended there, seeing if that's something normal or should we expect it to sort of sunset, raise another one kind of thing. And then separately, the SBIC, it looks like you've got that started in the ground. Any guide on what the, you know, top line fee contribution might be on that vehicle? Thanks.
Hi, Finn. It's Sarah. I'll hit your JV question first. So, you are correct that we did extend the investment period of Senior Credit Corp. 2022 through the end of this year based on mutual agreement with our JV partner. We're exploring various options for that vehicle in order to continue it. So it remains to be seen exactly what will happen there, but it is functioning well. It's been a successful partnership for us, and so we do intend to continue to syndicate deals to that vehicle through the end of this year.
And then, hey, Finn, the second question on the SBIC fund, you know, that was – we did something unique there. We raised all third-party capital, primarily from banks for that, and, you know, we've just closed on it, and we need to go out and deploy it so that we can generate the management fees and incentive fees, which are market, I mean, like a 2-in-20 type split, and we'll provide some incremental, you know, pretty significant incremental upside via the RIA over time. But we've got to get that money out the door now that we've closed on it.
Well, I appreciate that. Then just the top line, the activity sort of held up at, you know, good levels, a little bit different geography in the other fee income. Any context on the nature of activity there?
Is it normal prepays or sort of other types of amendment fees? yeah i mean this quarter um you saw prepayment fee income slightly down compared to the prior quarter a lot of that is due to you know the seasoning of those deals that do pay off um and also from a funding perspective a lot of our you know our record fundings this quarter was back end weighted during the quarter so you'll see the the benefit of that portfolio growth fully realized in the next quarter.
Yeah, typically when we see, you know, strong to kind of overperforming payoffs, that ends up adding incremental income, you know, because we're pulling through fees and prepayment fees. We just happen to have some older loans pay off where we didn't get that same benefit. And they happened at the very beginning of the quarter. And we couldn't put that money to work until the end of the quarter. So we had a little bit of a timing issue and missed out on some interest income.
Okay, it's helpful. And if I could backtrack. I forgot to throw one in on the JVs. The CAP Southwest partners also in the ground, is that the payout or interest or dividend rate to you?
Is that the expected rate or was it sort of a late funding and what sort of yield should we expect next quarter otherwise? us yeah i mean it's still ramping um it's not fully leveraged um but our return for that jv should be very similar to the rest of our core yields um you know 13 or 15 percent great okay thank you thank you our next question comes from eric quick with lucid capital your line is now open Thanks.
Hi. First one, just taking a look at the investment risk rating table in your press release, looks like there was a pretty nice increase in those loans kind of in those top two categories, the three to five rated. I'm curious if there was any kind of larger loans that were re-rated or if it was, you know, more broadly across the board. And if so, you know, what were some of the contributing factors to the improvement there?
Hey, thanks for your question. This is Jerry, and perhaps Ron can chime in. It was actually a pretty quiet quarter from a risk standpoint. So, you know, I think in the performing and strong performing, I think that's reflective of onboarding new credits.
And, you know, we're very pleased with the quality of those investments.
You know, as we noted, the, you know, the lower part of the risk table has been very steady. and improving. So we think credit's in a very good place right now.
Yeah, this is Ron. I'll add just a little bit to that. There were a few credits that you see in that performing category, get upgraded to strong performing. It's kind of nice, along with our strategy on the vertical side. One was an equipment deal, one was Swans for Dance, and one was tech lending out of the UK. So diversified improvement within the portfolio as well.
Thanks for that. The color there, and as you mentioned, nice to see that the kind of lower risk gratings continue to be stable. I guess that's consistent, non-accruals, same number of, I think, five credits there. Any potential progress towards resolutions of any of those credits in the near term over the next couple quarters? Could see any changes, anything rolling off?
This is Ron again. We're actively working all five credits, as you would imagine. And the quick answer is hopefully over the next few quarters, you'll see some activity we'll be able to share with you. But, you know, nothing too tangible to report today. But working them all.
Good to hear. Thanks for taking my questions.
Operator
Thank you. Our next question comes from Jason Stewart with Compass Point. Your line is now open.
Thanks. Thanks. On the equity warrant positions, these are largely non-yielding, and they're, I guess, becoming increasingly large at 12% of the portfolio. What level are you comfortable with this part of the portfolio becoming, and are there any methods or strategies that you're contemplating to work that percentage lower?
So nearly 50% of those are actually earning right now. And so the other 50% are going to be either small diversified positions we've taken into companies we're invested in where we get a right to invest. And we've seen that over time be a great strategy for us. And then warrants, right? And the value of these going up is really reflective of some solid companies that are mature, late stage, heading towards an M&A or IPO, and they're gaining value. They're getting investment. And so, you know, these assets yielding, that's great for us. And the others continue to build value. They're backed by the strongest PE groups and VC groups in the country. And we think when the market turns towards more IPOs and M&A activity, we'll continue to see that those provide incremental upsides to either cover losses for trend or provide incremental income to trend shareholders.
Okay. All right. That's a good color there. Question on the expenses. I mean, it looks like pretty good operating leverage and a good expense number in 2Q. Can you just give us some context on how to think about that going forward, given the growth and originations? I mean, record originations and sequentially lower comp is pretty impressive. How should we pull it together for the rest of the year?
Yeah, I think the Q2 numbers are probably a good number to start with going for the second half of the year. I mean, we built this platform to scale, so we've been investing in advance with hiring originators, PMs, and the credit team, and investing in the platform through the infrastructure.
Operator
Thanks, Jason. thank you and as a reminder if you would like to ask a question please press star and one on your keypad now we'll move next to christopher nolan with ladenberg thalman your line is now open hey guys um with the acquisition of vsl are you going to increase the portfolio exposure to equipment financing uh so interesting enough that's a uh that business originates, you know, middle market equipment leases.
That does not require much or anything from our balance sheet. We have lines of credits with banks where we're able to make a margin or spread or arbitrage, if you will. And then it's really a syndicate desk. So it generates a lot of fee income. We do intend to grow that business significantly over time across the country. And And that's going to be incremental upside as those fees are primarily generating origination fees. And then those leases are offloaded to syndicate of banks that they have in place. And so it doesn't require much balance sheet, and it can create a lot of income for us over time.
Good stuff. You've got a lot of balls in the air strategically in terms of all these funds and so forth like that. How should we look at the expense run rate going forward?
I mean, Mike touched on it a little bit right there. We, and we've said this before, we're always about a year in advance with regards to hiring. We have a one-year, three-year, five-year plan that we're executing on right now. We've built the team. We've invested in the systems so that we can make sure we have the originations and direct pipeline that we can then downstream into our fund management business, which we're building slowly and yet over time, and that will provide incremental income for investors. But as a, you know, we're more strategic, like an asset manager, obviously not your typical BVC. This is an operating company. We're thinking about growth in advance and hiring and making sure we have a team in place to execute on that plan.
Finally, any plans to do any special distros to lower that spillover income?
I think that if we are successful continuing to build the pipeline, if we're successful continuing to build our fund management business, which can generate new nav and income, I would love the problem with being forced to give our shareholders, and everyone sitting around this table right now, more money. Great.
Operator
Thank you. Our next question comes from Chris Muller with Citizens Capital Markets. Your line is now open.
Hey, guys. Thanks for taking the questions today, and nice to be on with you this afternoon. So I guess looking at effective yields, they dropped 80 basis points in the quarter, which was the same as core yield, so it doesn't seem like a fee impact played into that. So can you just talk me through that dynamic that's pushing overall yields lower? Is it just the timing mismatch that you guys talked about?
Yeah, you know, it's a combination of a number of things. I mean, the product mix, you know, on this quarter, very noted, you know, this is a strong sponsor finance quarter deployment. The prior quarter, you had a lot of life sciences. So that's, you know, that's impacting some of those sponsor finance deals or higher quality, lower spreads. And, you know, yeah, some of that was one time non-recurring fees in the prior period. You know, prepayment income is flowing through in our effective yield and dividend income as well. So income from, you know, the RIA should offset that long-term. So we feel really optimistic about, you know, our strong, you know, industry-leading effective yield.
Yeah, and some of that, even with, you know, with regards to some of those stronger deals Mike's talking about, that's going to be our PE-backed lower middle market business that can drag down kind of overall yields. But, you know, our goal and our strategy has always been to build these verticals and then align the right type of capitalization with each of these vehicles. And so we are and have been working on making sure that we're aligning our leverage and cost of capital with the type of risk we're taking. And over time, as each of those verticals scale, we'll see margins at appropriate levels that help us make sure we're not having a drag on earnings.
Got it. That context is very helpful. And then I guess looking at NII, it's just covering the base dividend now, but we have two rate hikes priced in through mid-year 27, and it sounds like the portfolio growth in 2Q is not fully reflected yet. So are there any one-timers that impacted 2Q there that we should be aware of? And how are you thinking about the trajectory of NII in the back half of the year?
Yeah, I mean, I think Kyle mentioned we're going to continue to grow that investment income, continue to cover the dividend. And there wasn't a whole lot of non-reoccurring income in Q2 prepayments. We do expect to continue to be elevated in the current market. And depending on when we can redeploy that and depending on the type of deal or seasoned vintage of those deals prepaying in that quarter, you'll see that flow through.
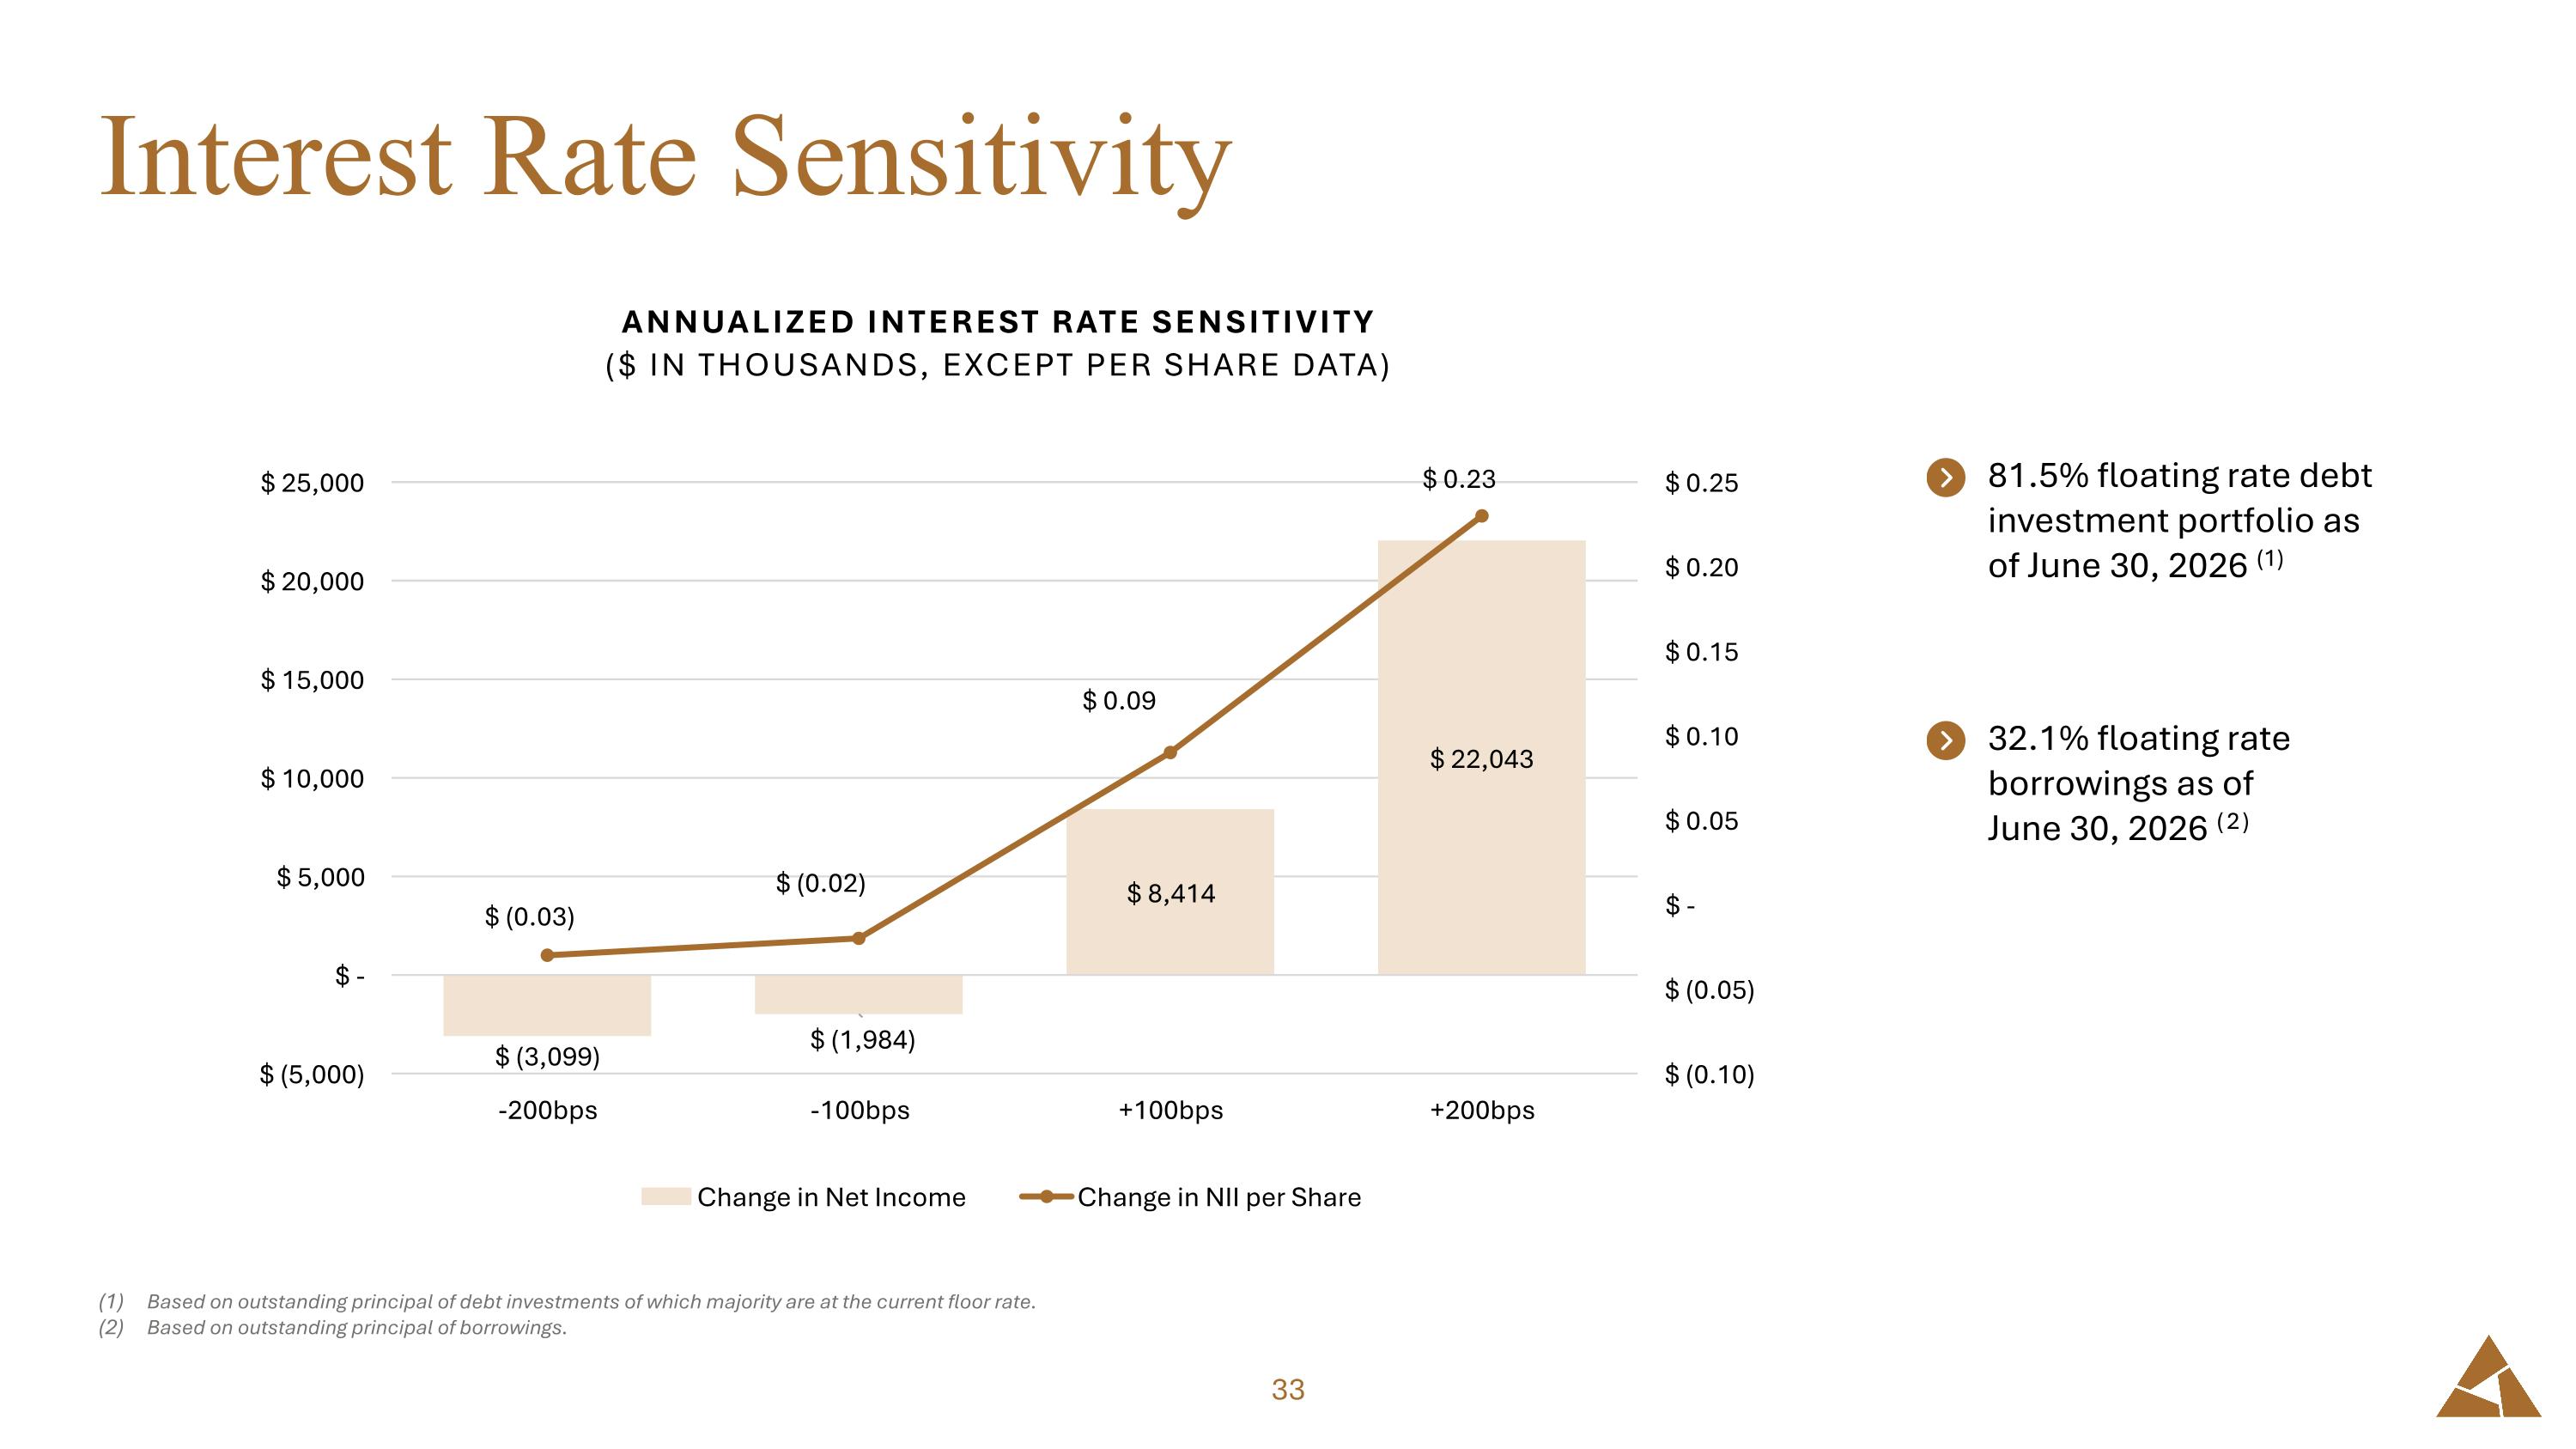
Yeah, I think I mentioned it earlier with Finn's question, but we did have significant payoffs. They happened real early in the quarter. They did not provide us with the pull-through kind of back-end fees and prepayment fees that we typically see because they were older, more mature loans. And then we funded a record quarter, but it happened a lot. A lot of it happened late in the quarter, so we just saw less income coming in. So we had – there's just a bit of a gap in timing that threw that off a little bit. And then, you know, just to repeat, like, you know, our main lever on increasing earnings per share over time is going to be our fund management business. and the management fees and incentive fees. And so, you know, growth is really important because it gives us the ability to go out and raise capital and third-party capital that we can manage and generate new fee income as we downstream those assets. And so, you know, I don't see, you know, we're not going to see, like other BDCs, you know, the cost of debt. It's going up. We already have a relatively high cost of debt. And, you know, we disclose how the impacts of rate increases or decreases affect us. And, you know, it just doesn't affect us like everyone else in the same way. And so I don't see that being something that's going to be detrimental regardless of which way rates go for us. And there might be some benefits there with certain moves.
So that's all very helpful. I appreciate you guys taking the questions today. You bet.
Operator
Thank you. This concludes today's question and answer session. I will now turn it back to CEO Kyle Brown for closing remarks.
On behalf of the Trinity Capital team, thank you for joining us today. This has been a strong quarter by nearly every measure, and we're excited about where we're headed. We continue to work hard for our shareholders. We look forward to updating you on Q3 results on November 4th. Have a great day. Thanks.
Operator
Thank you. This brings us to the end of today's meeting. We appreciate your time and participation. You may now disconnect.