Operator
Thank you for standing by, and welcome to American Airlines Group's fourth quarter and full-year 2025 earnings conference call. At this time, all participants are in a listen-only mode. After the speaker presentation, there will be a question-and-answer session. To ask a question during the session, you will need to press star 11 on your telephone. To remove yourself from the queue, you may press star 11 again. I would now like to hand the call over to Neil Russell, Vice President, Investor Relations. Please, go ahead.
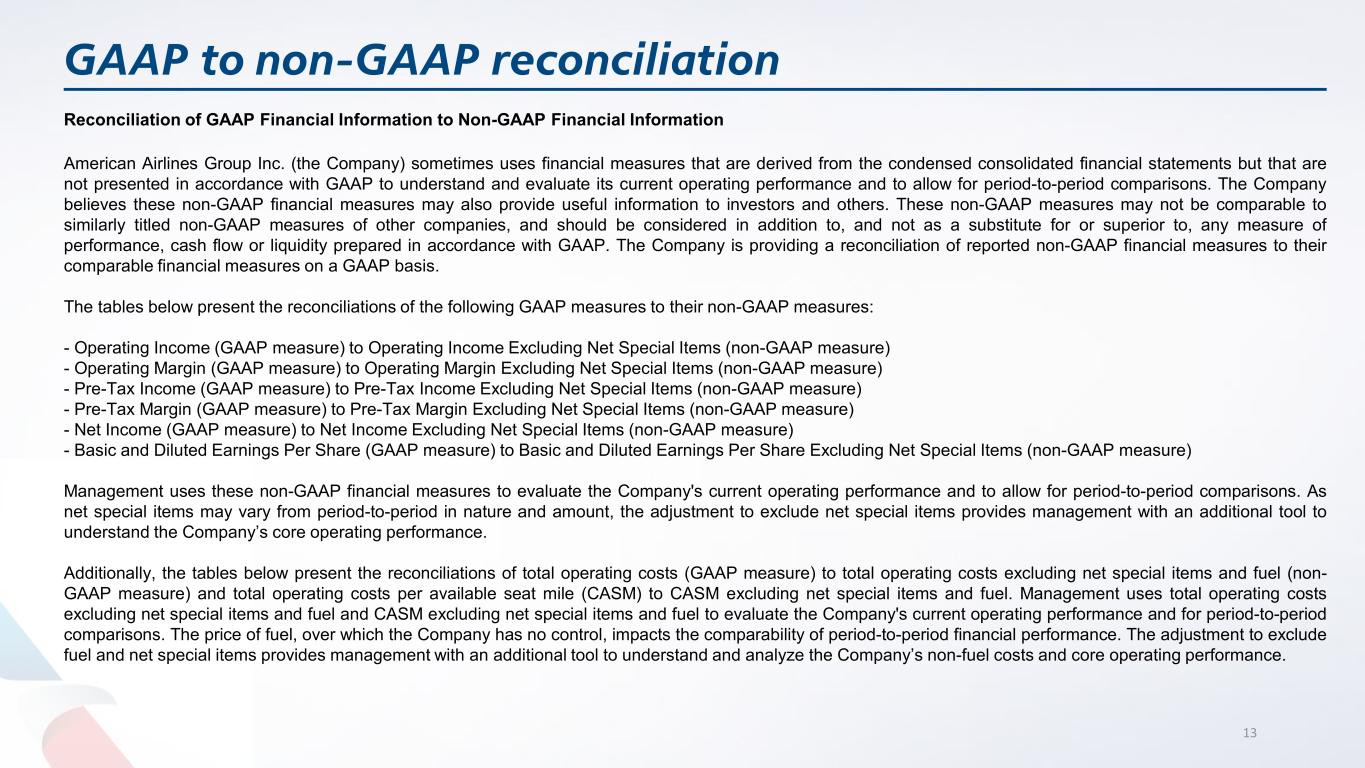
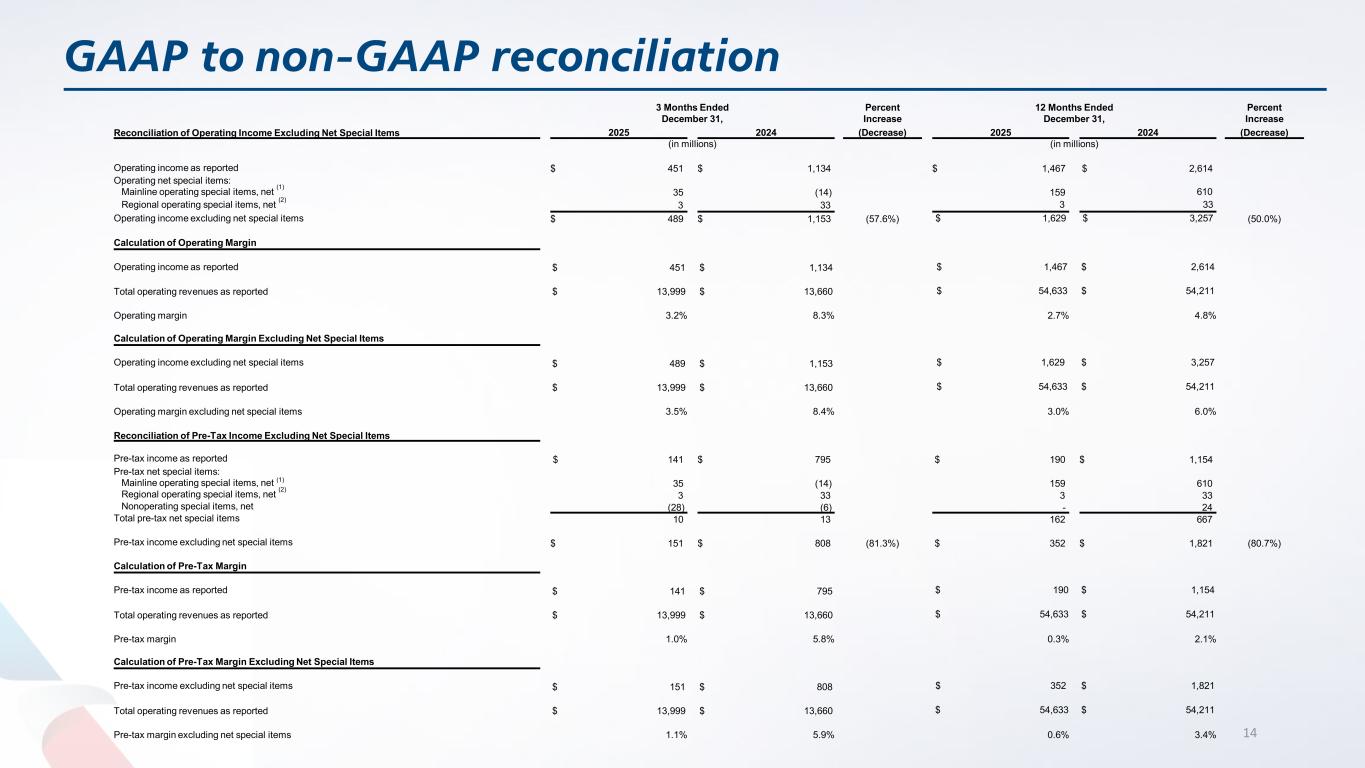
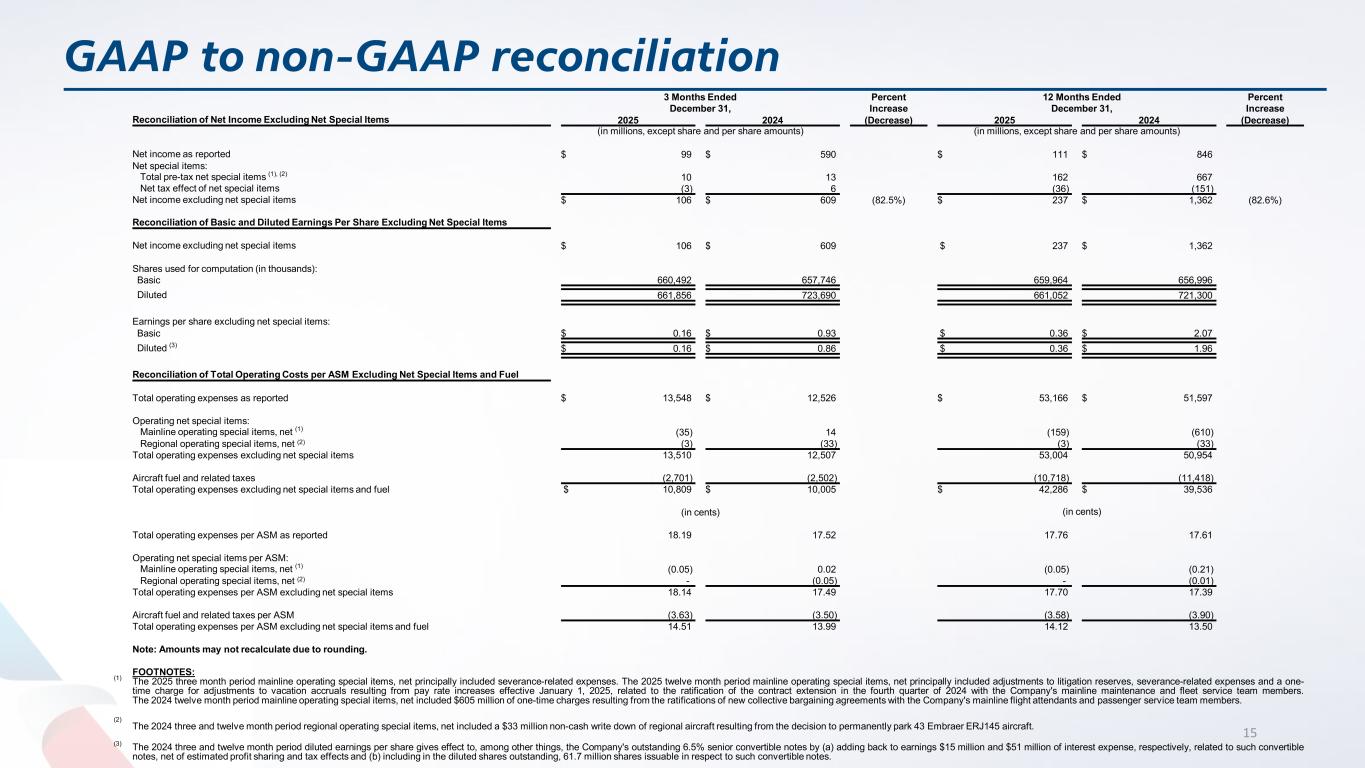
Thanks, Latif, and good morning, everyone. Welcome to the American Airlines Group Earnings Conference Call. On the call with prepared remarks, we have our CEO, Robert Isom, and our CFO, Devin May. In addition, we have a number of senior executives in the room this morning for the Q&A session. After our prepared remarks, we will open the call for analyst questions, followed by questions from the media. video. To get in as many questions as possible, please limit yourself to one question and one follow-up. Before we begin, please note that today's call contains forward-looking statements, including statements concerning future events, costs, forecasts of capacity, and fleet plans. These statements represent our predictions and expectations of future events, but numerous risks and uncertainties could cause actual results to differ from those projected. Information about some of these risks and uncertainties can be found in our earnings press release that was issued earlier this morning, Form 10-K for the year-end of December 31st, 2024, and subsequent quarterly reports on Form 10-Q. Unless otherwise specified, all references to earnings per share are on an adjusted and diluted basis. Additionally, we will be discussing certain non-GAAP financial measures which exclude the impact of unusual items. A reconciliation of those numbers to the GAAP financial measures is included in the earnings press release and investor presentation, each of which can be found in the Investor Relations section of our website. A webcast of this call will also be archived on our website.
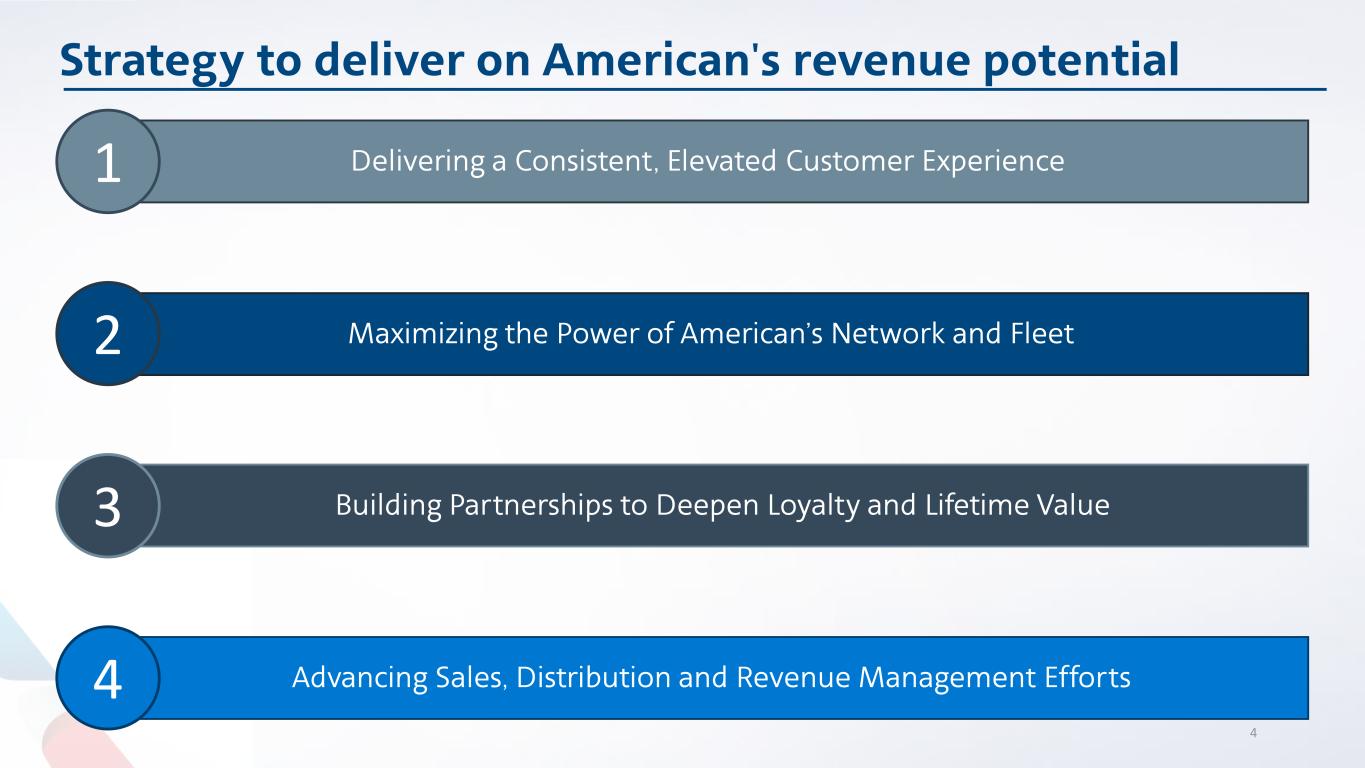
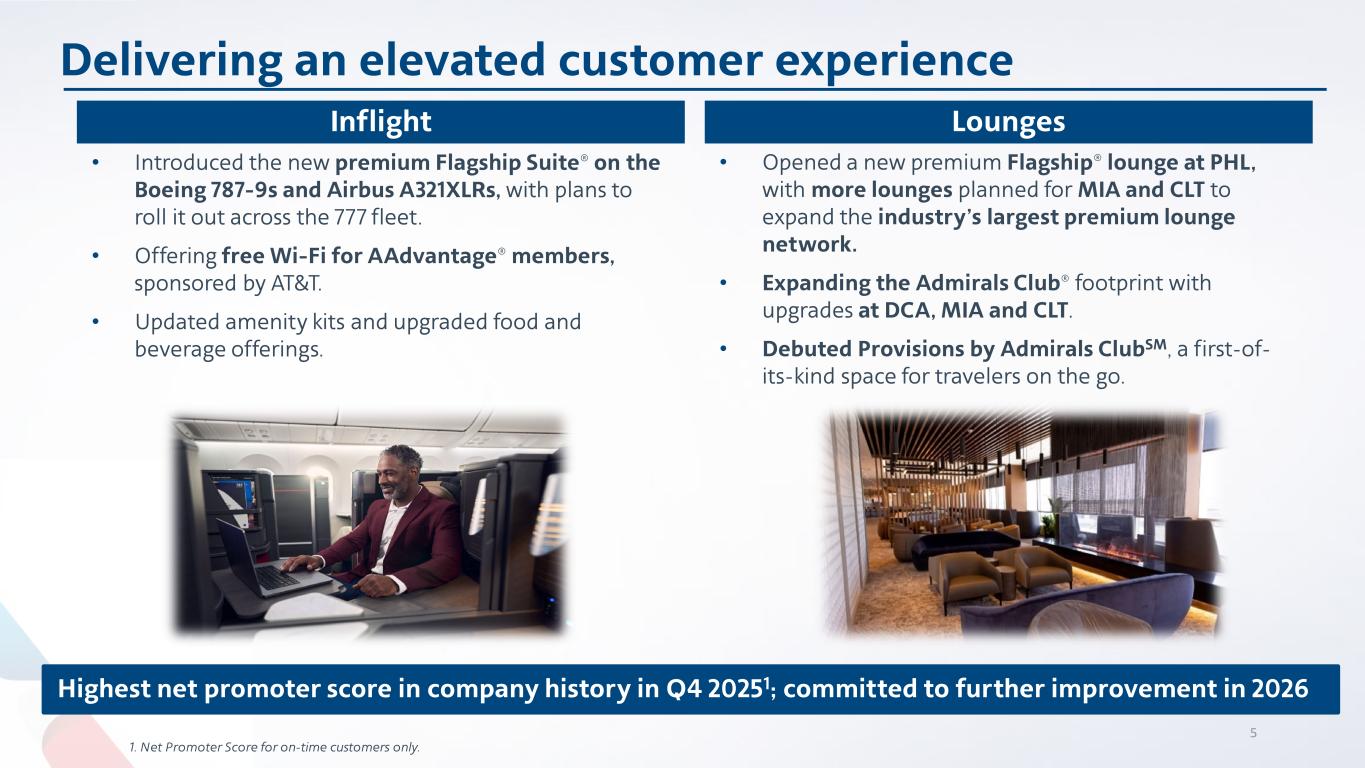
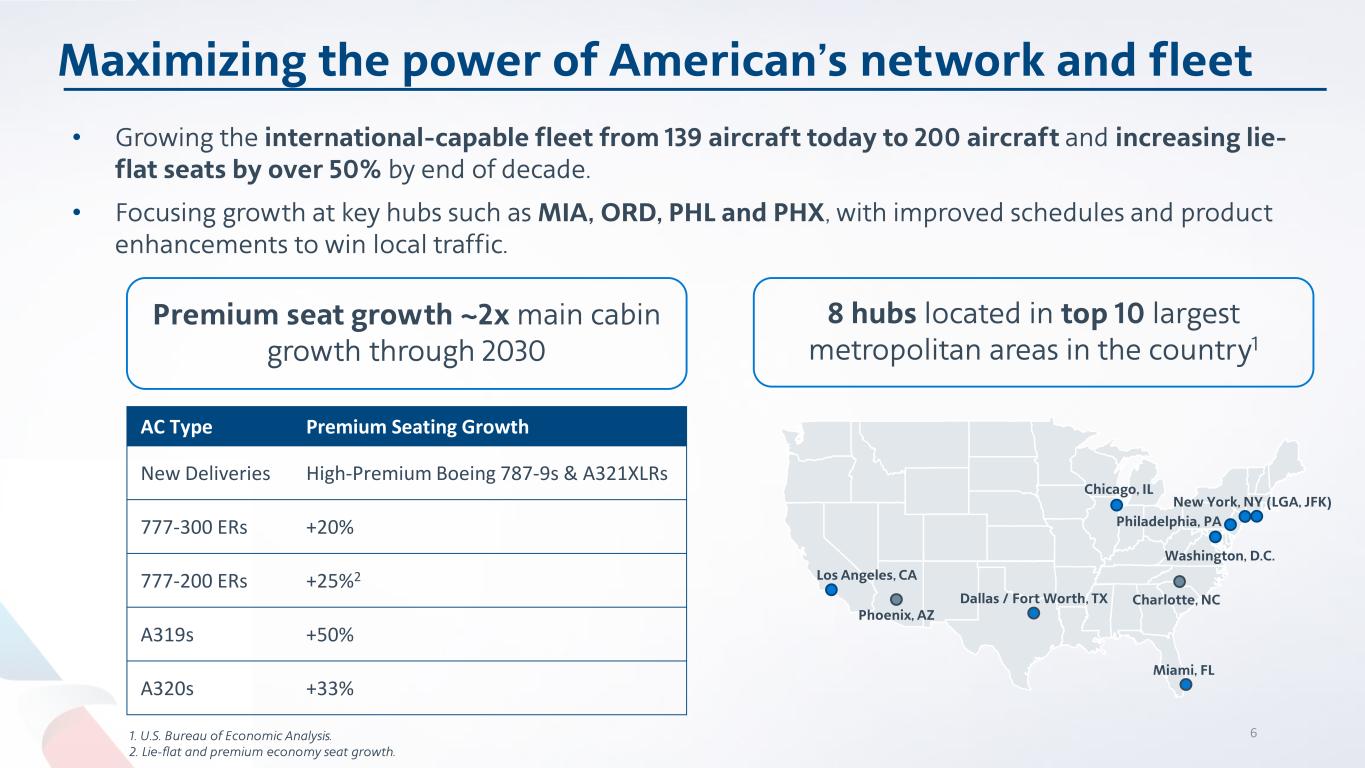
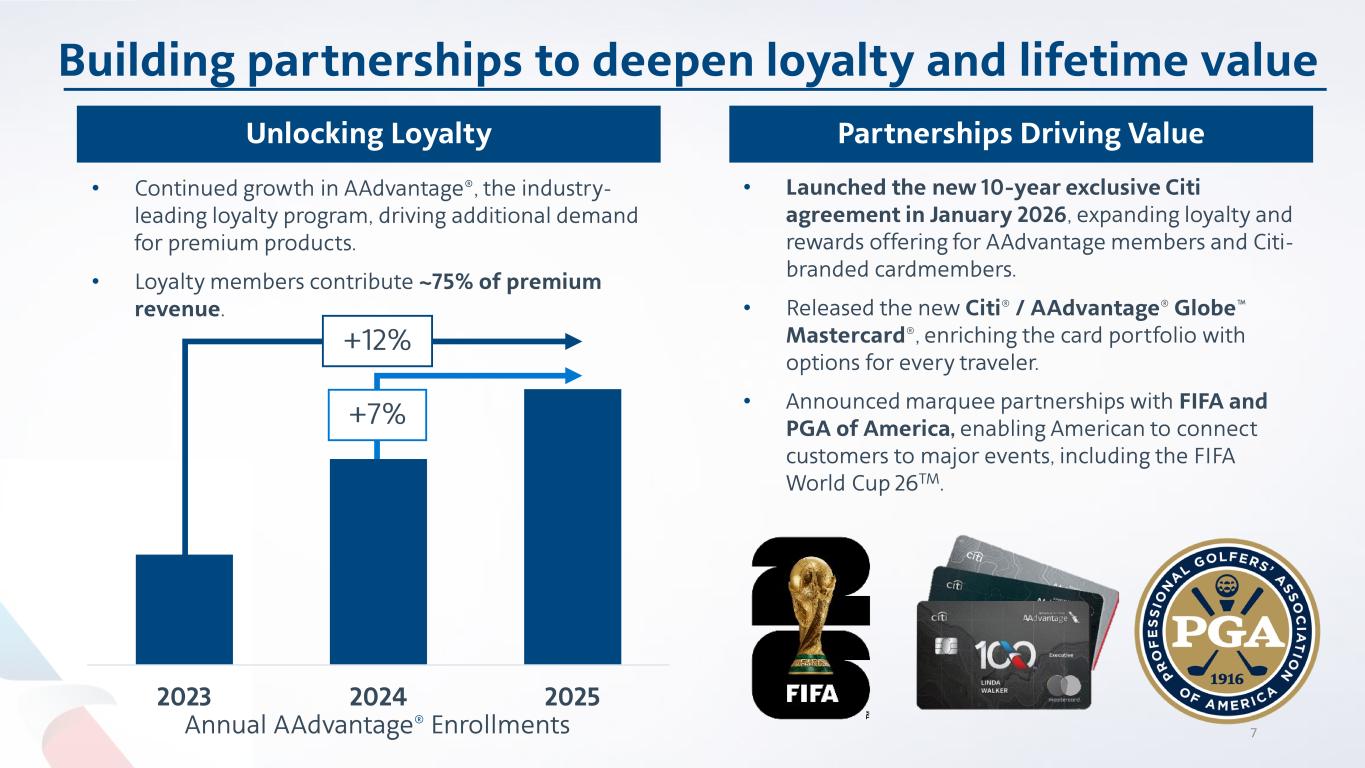
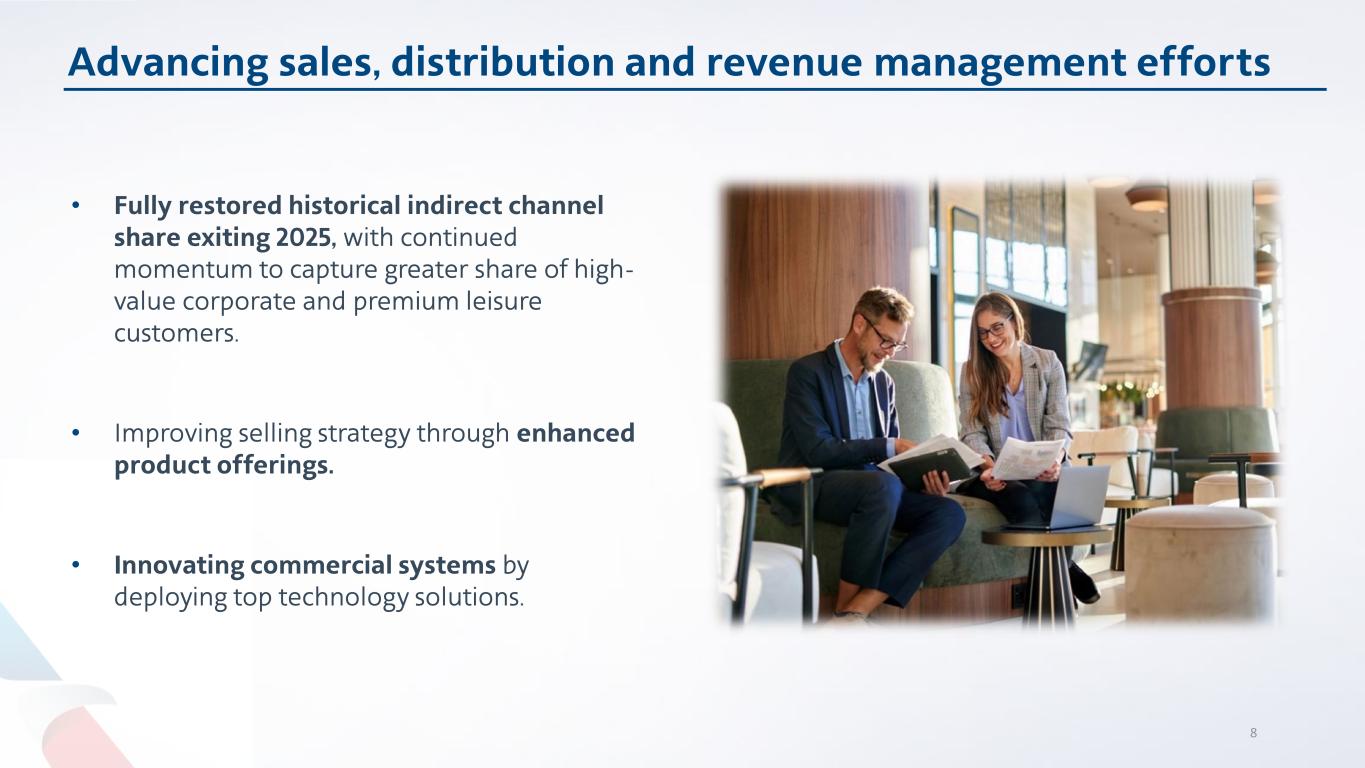
The information we are giving you on the call this morning is as of today's date and we undertake no obligation to update the information subsequently thank you for your interest in American and for joining us this morning with that I'll turn the call over to our CEO Robert Isom good morning everyone as we close out 2025 I'm extremely proud of the hard work and perseverance of the American Airlines team throughout the fourth quarter and the full year thank you to each of you your commitment to excellence is what makes American the premium global airline our customers trust thank you for navigating 2025 with resilience and for taking care of our customers throughout the holiday period and i especially want to recognize the tremendous efforts of our team this past weekend and this week as we work through winter storm fern ensuring our customers and team members remain safe during this challenging weather event the impact of the storm is as significant as we've ever seen at american ice and freezing rain have significantly reduced operations especially at dfw and charlotte our largest hubs for multiple days over the past four days we've had to cancel more than 9 000 flights making this the largest weather-related operational disruption in our history we expect at least two more days of elevated cancellations before returning to normal operations later this week. While 2025 wasn't the year anyone in the industry thought it would be, and no matter the unique challenges American faced, we did the hard work to build a solid foundation for our future. Our balance sheet is the strongest it's been in years. On the labor front, over the last 30 months we've successfully negotiated ratified agreements with our pilots, flight attendants, mechanics, fleet service agents, passenger service agents, reservations agents, and more recently, our flight crew training instructor and simulator pilot groups. Our fleet is in excellent shape. Thanks to the significant investments we've made, we have low capital requirements and no required aircraft retirements for the foreseeable future. Over the next few years, we will continue to expand our international fleet and premium seeding through new deliveries and retrofit programs additionally we fully restored our historical sales and distribution indirect share with our focus now on further growth in 2026 and beyond now we turn to the page to a new year and a momentous chapter in our history as we celebrate american centennial i'm excited about the opportunities that lie ahead for american as we begin to see the benefits of our work in 2026. Our strategy to deliver on America's revenue potential centers on four key areas. Delivering a consistent, elevated customer experience. Maximizing the power of our network and fleet. Building partnerships that deepen loyalty and lifetime value. And continuing to advance our sales, distribution, and revenue management efforts. While this has been a multi-year effort, 2026 will be the year these efforts start to bear We're off to a fast start based on the booking trends we've observed in January, all-time records for the first three weeks of the year. Starting with our first focus area, delivering a consistent, elevated customer experience. We strive to create an experience that customers value and that our team members are proud to deliver. In the fourth quarter of 2025, our net promoter score for on-time customers was the highest in our company's history and is expected to see even more improvement in 2026. We continue to invest in the customer experience of premium products and services that differentiate American. Our new flagship suite product sets the industry standard of luxury for long-haul travel and has delivered leading customer satisfaction scores since its inauguration. We're expanding this product across our international capable fleet, including on the new Boeing 787-9s, the new Airbus 321XLRs, and the retrofits of our existing 777 aircraft. We're proud to offer the industry's leading lounge network, including the most premium lounges. We opened our newest flagship lounge in Philadelphia last year, and we also announced plans to bring new flagship lounges to Miami and Charlotte. We're also making significant investments to our Admiral's Club lounges, including the renovation of our Concourse D lounge at DCA and the introduction of provisions by Admiral's Club at Charlotte, a first-of-its-kind lounge concept for travelers that are on the go. We are also enhancing the onboard experience with the introduction of mattress pads for added comfort, upgraded food and beverage offerings, and other thoughtful touches throughout the journey. Rolling out this month, Advantage members will enjoy complimentary high-speed satellite Wi-Fi on our narrow-body aircraft, dual-class regional jets, and our new premium Boeing 787-9s, sponsored by AT&T, reinforcing connectivity as a core aspect of the customer journey and a benefit that our members value. The early feedback shows increased satisfaction, especially among younger generations. American will offer more free, high-speed satellite Wi-Fi on more aircraft and on more flights than any other carrier in the world. We also know that reliability and disruption management are key drivers of customer satisfaction and revenue production, and we're taking steps to improve our reliability. First, we're transforming the way we operate at DFW to prepare for future growth at our largest and most profitable hub. Moving to a new 13-bank structure is designed to increase customer connection opportunities, reduce air traffic delays, and allow for quicker recovery during irregular operations, all while providing more on-time arrival certainty to our 100,000 customers traveling through DFW each day. Importantly, we expect this change will open the door to future expansion in a market with significant economic and population growth. In the coming years, we'll see the completion of a new Terminal F, along with further enhancements and gate expansion at two other terminals. Once completed, American will operate the largest single carrier hub in the world at DFW. We're also investing in our schedules and in technology to ensure more on-time arrivals, fewer missed connections, and a smoother travel experience. We're bolstering our ability to get customers and their bags to where they're going on time and we expect these changes will have a meaningful impact on customer satisfaction scores. Our second focus area is maximizing the power of our network and fleet. We're a premium global airline with the strongest network in the U.S., the most important aviation market in the world. Eight of our hubs are located in the 10 largest metropolitan areas in the U.S. We're maximizing the power of our network, global reach of our partners to connect more people to more places than any other airline. Our current domestic growth plans for 2026 are focused on scaling hubs where we can grow our local share and fully utilize existing infrastructure, particularly in Philadelphia, Miami, and Phoenix. We'll also be rounding out our schedule in Chicago. Improved schedules combined with product enhancements are helping us win local high-value customers. Our fleet order book has a diverse mix of aircraft size and operational capabilities. This provides the opportunity to grow our hubs, invest in our local markets, and expand servers globally. Our international offerings in 2026 will include new routes to premier destinations like Budapest and Prague and growth with our international joint business and one-world partners. We remain on track to increase our international capable fleet from 139 today to 200 aircraft by the end of the decade. We expect continued improvement in premium unit revenue, supported by growing demand and increased premium product availability. With our current order book and the announced reconfigurations of our 777-200, 777-300, A319, and A320 fleets, we'll deliver significant premium seat growth over the coming years, nearly twice the rate of main cabin seats. Our lie-flat seats are expected to increase by over 50% by 2030. Building partnerships that unlock loyalty and lifetime value is the third area of our focus. American invented airline loyalty, and the Advantage program continues to lead the industry. We offer more value per mile, countless ways to earn and redeem miles, and more ways to engage with Advantage members, including complimentary Wi-Fi that started this month. Advantage enrollments increased 7% year-over-year, marking our greatest number of annual enrollments, with Chicago leading the way, up nearly 20% year-over-year. 2025 marked a record year for our co-branded credit card program, with spending on our cards up 8% year-over-year. This momentum sets the stage for our exclusive 10-year co-branded credit card partnership with Citi, which went into effect on January 1st. In the fourth quarter, we successfully transitioned in-flight and airport acquisition channels from Barclays to Citi, and our focus in 2026 now shifts to card conversions. The Citi partnership gives our customers the most straightforward and seamless path to status in the industry. With a Citi co-branded credit card, members earn loyalty points for every dollar spent, creating more benefits for customers to engage with American. Our partnership with Citi is designed to drive long-term growth in credit card acquisitions and spend, and the upside is significant. These efforts, combined with the strength of our Advantage program, will deepen engagement, enhance customer loyalty, and deliver meaningful long-term value to American. Lastly, we remain focused on the continued advancement of our sales, distribution, and revenue management efforts. As we close the year, we had restored our indirect channel share, an important milestone but not the end of our initiative. As we move into 2026, we will continue to deepen the relationships that we've built with our corporate and agency partners and capture greater share among high-value corporate travelers and premium leisure customers. Across the commercial organization, we see significant opportunities by sharpening our fair product architecture and continuing to improve our revenue management processes and technology. In the fourth quarter, we made changes to our basic economy product to drive clear segmentation while still offering a better basic product than any of our competitors. Throughout the year, we will continue evaluating our premium offerings, particularly our extra legroom product, which is a compelling option for corporate customers. And finally, we will continue innovating our commercial systems through the deployment of best-in-class technology solutions. And lastly, I want to acknowledge that this week marks the one-year anniversary of the tragic accident of flight 5342. We remain committed to supporting everyone affected by that tragedy through our Office of Continued Care and Outreach, and I want to commend our team for handling this difficult situation in an exemplary way. Devin will now share more about our financial results in the 2026 outlook.
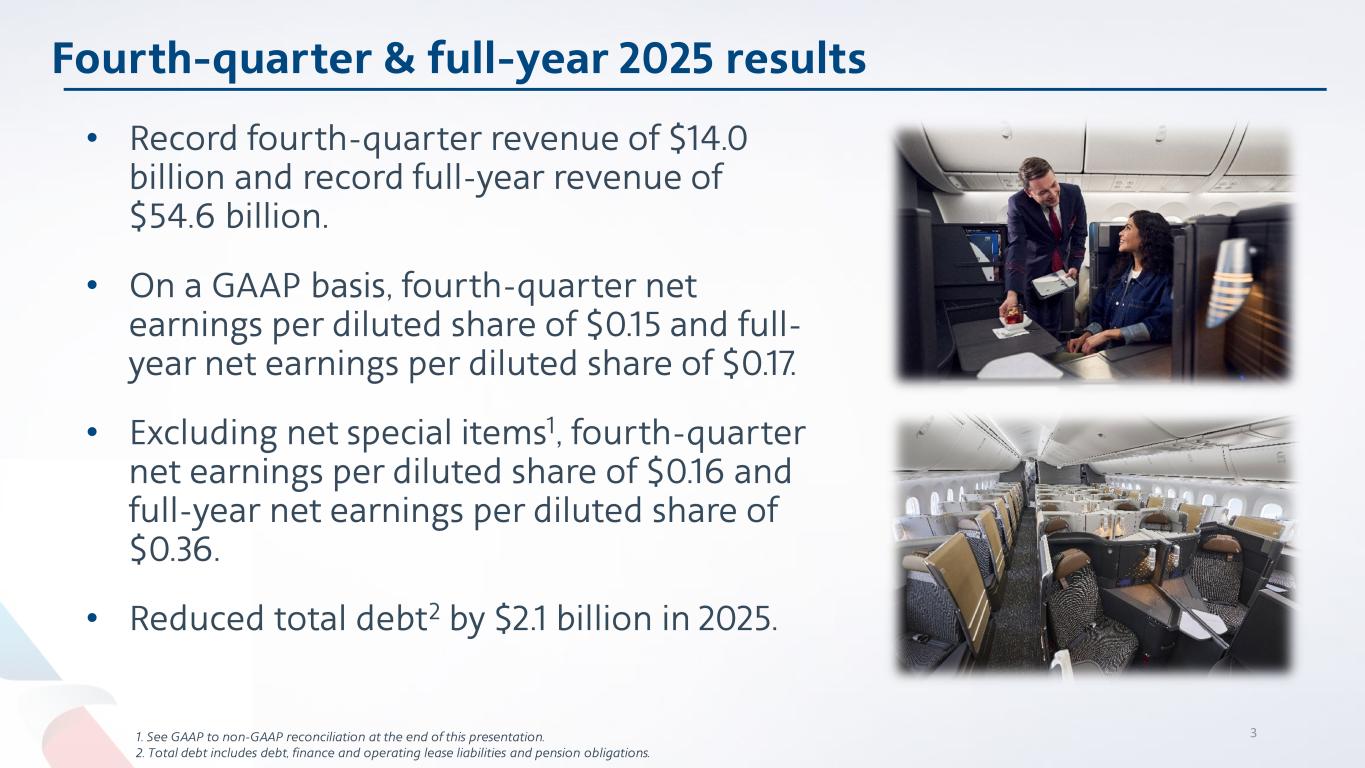
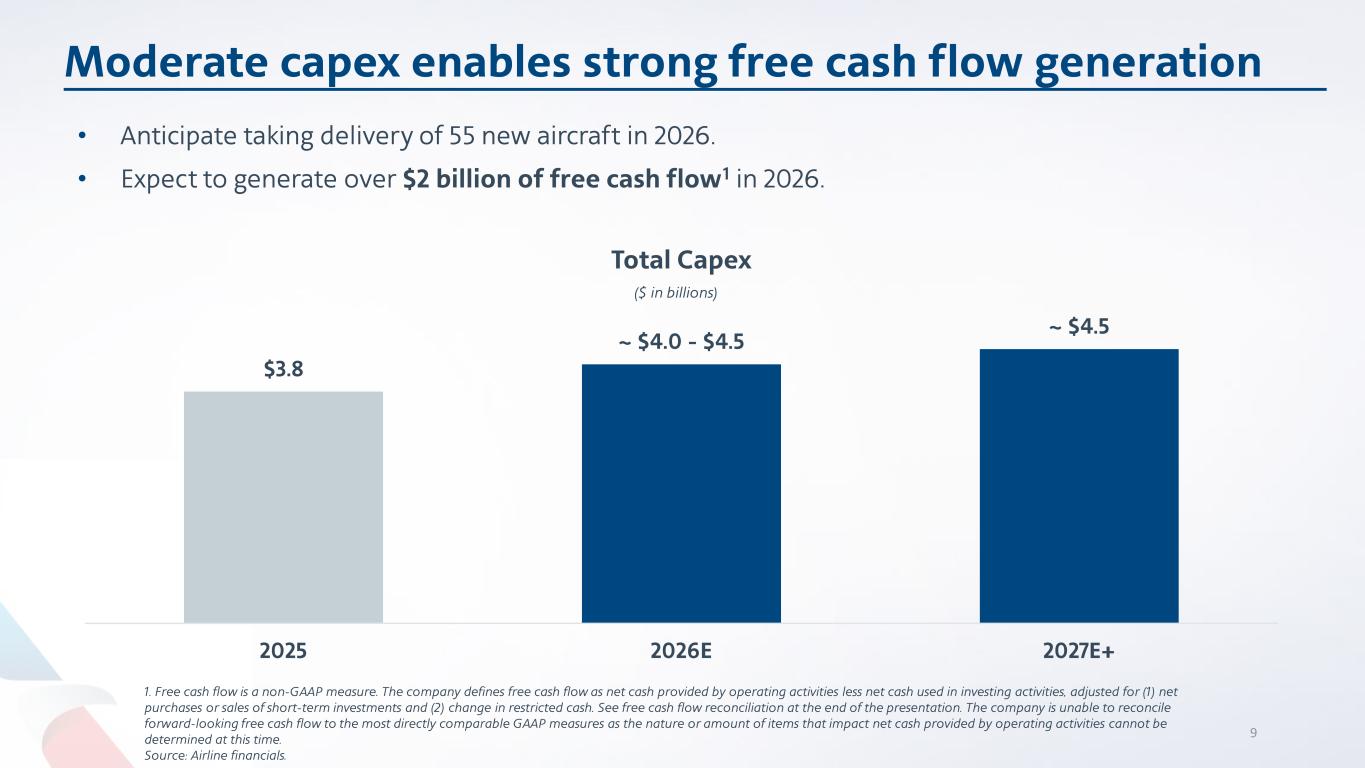
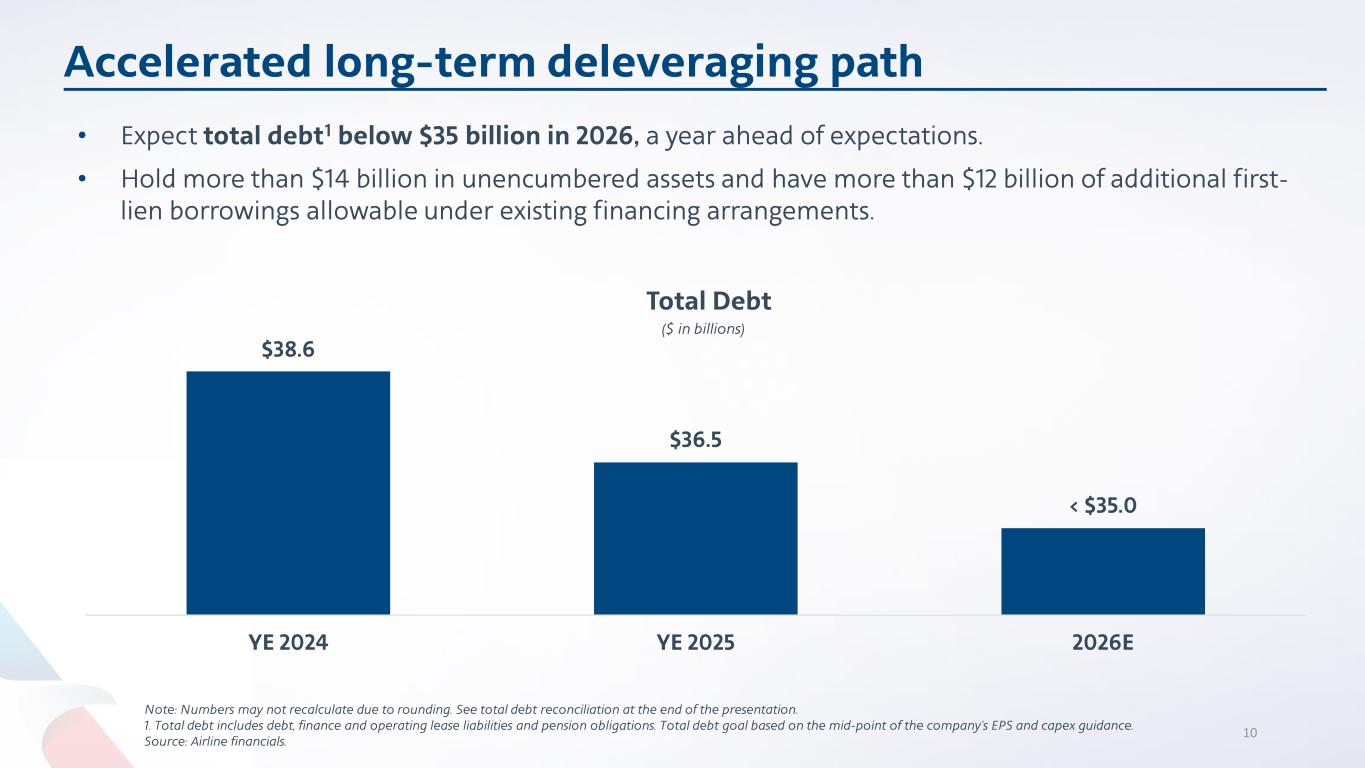
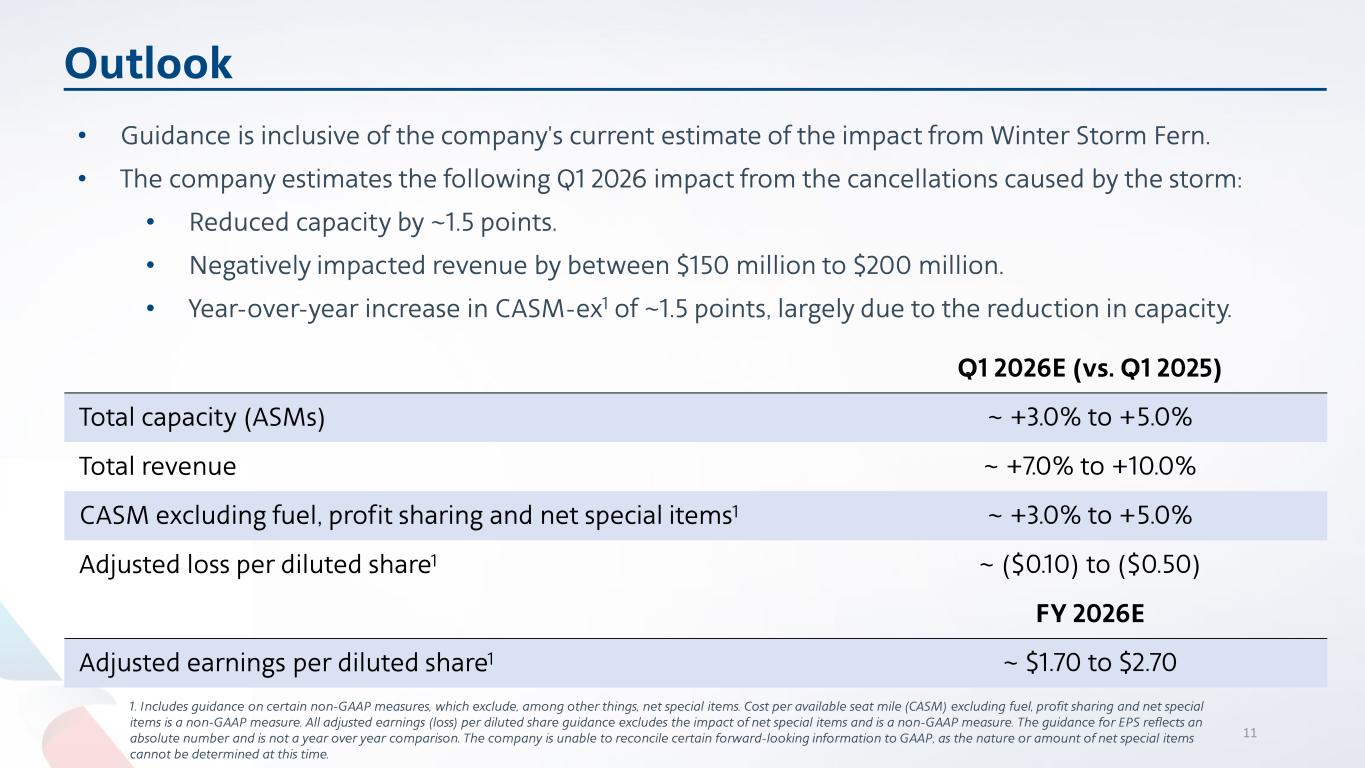
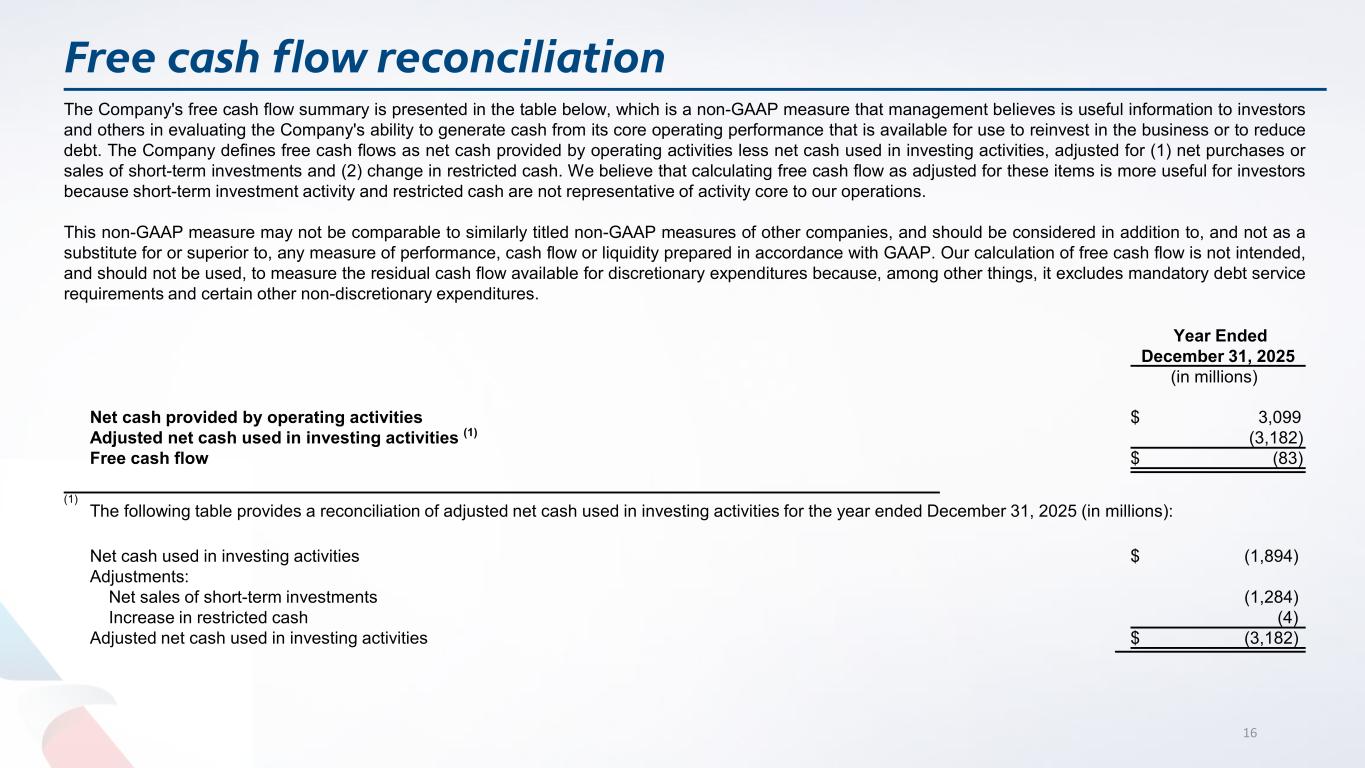
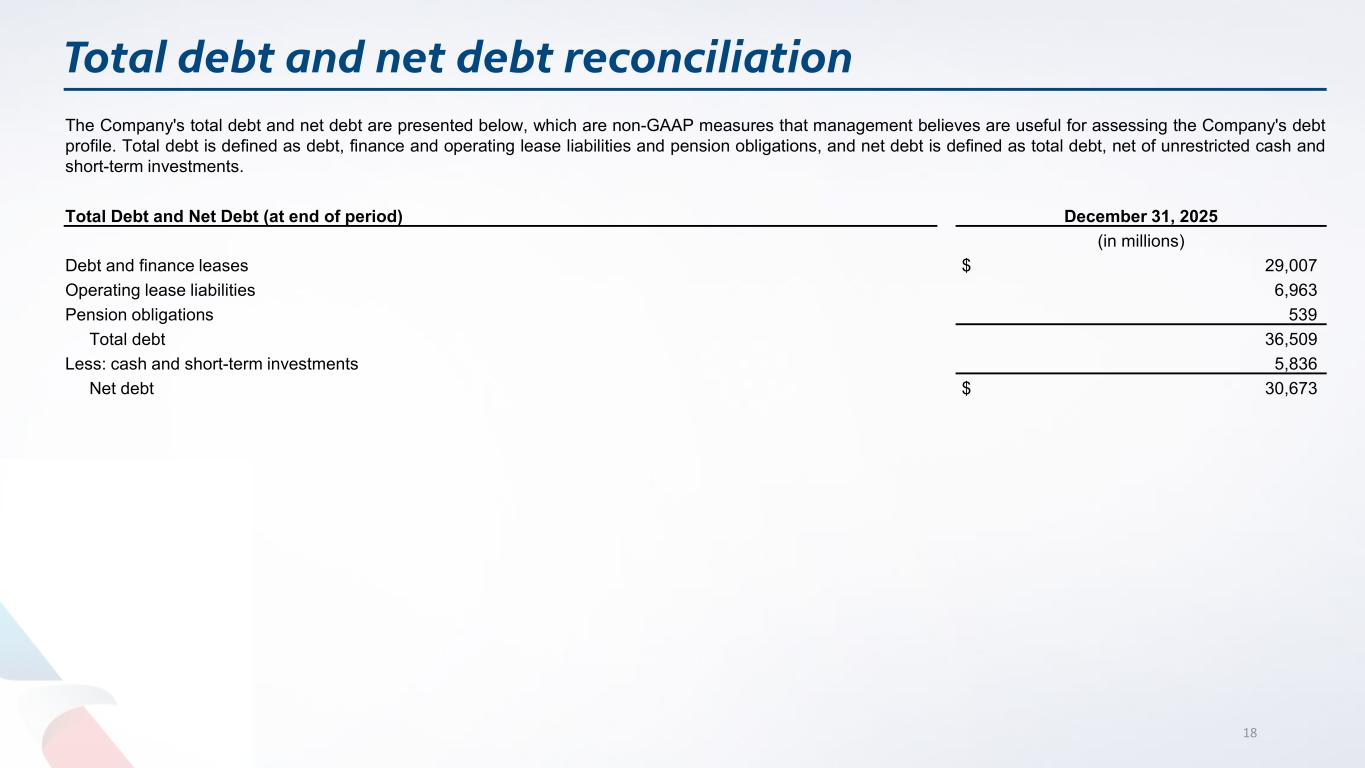
Thank you, Robert. Excluding net special items, American reported fourth quarter adjusted earnings per share of $0.16, and full-year adjusted earnings per share of $0.36. These results came in below our guidance, primarily due to the prolonged government shutdown, which impacted revenue by approximately $325 million. The impact of the government shutdown was largely concentrated in the domestic entity, where American has the largest exposure, especially our hub at DCA and its relative weighting towards government-related traffic. This disruption was temporary, but it impacted revenue in November and December. Following softer-than-expected bookings late in the fourth quarter, bookings strengthened meaningfully in January. System-wide revenue intakes for the first three weeks of 2026 are up double digits year-over-year. Premium continued to outperform main cabins throughout the quarter, a trend that has remained consistent all year, underscoring the strength of the premium customer and demand for the premium products we offer. Our fourth quarter year-over-year premium unit revenue outpaced Main Cabin by seven points. We continue to see strength in our indirect channels with managed corporate revenue up 12% year-over-year, which has strengthened further so far in 2026. Looking ahead, we expect premium unit revenue momentum to remain strong in 2026, but also expect Main Cabin to deliver strong year-over-year improvement, assuming a stable macroeconomic backdrop. Year-over-year unit revenue for the domestic entity had inflected positive in September and remained positive before the impact of the government shutdown. Excluding the government shutdown, year-over-year domestic unit revenue would have been positive for the quarter. Our international entities performed in line with the guidance we provided in October. Atlantic unit revenue was up 4% year-over-year, and it was our most profitable region during the quarter as seasonal demand trends and demand for our premium offerings continue to strengthen in the fourth quarter. Once again, unit revenues in Latin America remained under pressure during the quarter. We expect this to be a continued headwind for the first half of 2026. As we have said in the past, Americans' presence in the region, the premium services we offer, and the scale we have in Miami and our other southern hubs allow for profitable results in this environment and a continued long-term competitive advantage. And finally, Pacific unit revenue was slightly down year over year, but showed sequential improvement from the third quarter, supported by strength in the premium cabins. Looking to Q1, we expect domestic unit revenue to get back on trend and be nicely positive for the quarter, driven by both strength in premium and main cabin demand. We expect international unit revenue performance will be mixed with continued strong transatlantic performance and flattest unit revenue in the Latin America and Pacific entities. As Robert mentioned earlier, American is continuing to invest in expanding our premium offerings across the customer journey. We are already recognized among the U.S. network carriers for having the highest rated and most consistent products across our long-haul fleet, and we expect to expand that product further in 2026 with 10 additional A321XLR deliveries and the full utilization of our our 11 premium Boeing 787-9s. Additionally, our Boeing 777-300 retrofit has started, and customers will enjoy a 20% increase in premium seats as the retrofitted aircraft roll out this year and next. These efforts will continue in future years with retrofits on the Boeing 777-200, the A319, and the A320 fleets. With these investments in our existing fleet, along with our new deliveries, we expect our premium seat growth will outpace our non-premium offerings each year for the remainder of the decade. Now, on to our earnings outlook for 2026. Our guidance today reflects our preliminary estimate of winter storm fern. Our guidance always includes a completion factor assumption for winter weather, but as Robert mentioned earlier, the impact of this storm is unlike anything we have ever experienced. For the first quarter, capacity is projected to be up three to five percent year over year as we maximize the value of our network through stronger schedules in many of our hub cities this is inclusive of approximately a point and a half impact from winter storm fern our 2026 capacity plan includes significant growth in philadelphia miami and phoenix as we take advantage of near-term opportunities and utilize existing facilities our growth for the year is expected to be evenly balanced across domestic and international entities. We expect first quarter revenue to be up between 7 and 10 percent year over year, driven by improvements in the domestic entity from expected growth in corporate passenger volumes and as demand continues to recover as we lap the challenges experienced in the first quarter of 2025. This includes an estimated revenue impact of between $150 million to $200 million dollars from the ongoing winter storm fern first quarter chasm x fuel x profit sharing and net special items is anticipated to be up between three and five percent as we absorb the flight attendant boarding pay an additional benefit that went into effect in the second quarter of 2025 and as we staff ahead of the summer to support peak growth the chasm x impact from winter storm fern is approximately one and a half points We remain confident in our ability to deliver the most efficient capacity in the industry as we continue our multi-year effort to re-engineer the business. This transformation leverages technology and streamlines processes to enable an improved customer and team member experience while driving a more efficient business. These efficiencies enable our mainline work groups to operate at their highest productivity levels, partially mitigating the impact of contractual labor rate increases and other inflationary pressures. In 2026, we expect an additional $250 million of savings from these efforts versus 2025, bringing our cumulative operating savings to nearly $1 billion since 2023 and total working capital improvements of nearly $900 million, meeting the expectations set at the start of the program. With this first quarter guidance, inclusive of the impact of Winter Storm Fern, we expect to deliver an adjusted loss per diluted share of between $0.10 and $0.50. The guidance range for the quarter is slightly wider than what we traditionally use as we continue to evaluate the impact of this extraordinary weather event. For the full year, we expect adjusted earnings per diluted share of approximately $1.70 to $2.70. Lastly, turning to CapEx and the balance sheet, In 2026, we expect to take delivery of 55 new aircraft. Based on our current expectations, our 2026 total capital expenditures are expected to be between $4 and $4.5 billion, consistent with our prior guidance. Based on these earnings and capital projections, we anticipate free cash flow generation of more than $2 billion for the full year. We continue to make significant progress and strengthen our balance sheet. At the start of 2025, we committed to reducing total debt by approximately $4 billion to less than $35 billion by the end of 2027. During 2025, we reduced total debt by $2.1 billion, bringing our total debt to $36.5 billion. At the midpoint of our EPS and CapEx guidance, we would hit our 2027 goal to have total debt below $35 billion a year ahead of schedule in 2026. And with over $2 billion of free cash flow this year, we expect that by year-end, we will have our lowest level of net debt since the end of 2014. I'll now hand the call back to Robert for closing remarks.
Thanks, Devin. This year marks our 100th anniversary, a remarkable milestone that reflects a legacy of innovation, resilience, and caring for people on life's journey. We've been innovators since the beginning. We invented the first reservation system and the first revenue management system, the first airport lounge, and the first airline loyalty program, which continues to lead the industry today. From our humble beginnings as a mail carrier between Chicago and St. Louis, today, American Airlines is a premium global airline that connects more of the U.S. to the world powered by a proud team of over 130 000 aviation professionals unmatched in talent and spirit with a proven ability to adapt innovate and always strive for better i've been in this business for a long time and i'm incredibly excited about what lies ahead for american the foundation we built in 2025 combined with our go forward strategy positions us to deliver sustainable growth and create long-term value for our customers, team members, and shareholders. America's tagline for our centennial year is, Forever Forward. It embodies all the things that we've accomplished over the past 100 years and all the opportunities in front of us. From elevating the travel experience and strengthening our network to unlocking loyalty and driving efficiency we're executing on the strategy and initiatives that will drive value and shape our next 100 years as a premium global airline thank you for your interest in american airlines and operator you may now open the line for questions thank you as a reminder to ask a question you will need to press star one one on your telephone to remove yourself from the queue you may press star 11 again.
Operator
To allow everyone the opportunity to participate, you will be limited to one question and one follow-up. Please stand by while we compile the Q&A roster. Our first question comes from the line of Connor Cunningham, Amelius Research. Please go ahead, Connor.
Hi, everyone. Thank you. I was hoping we could talk about the hub structure a little bit. You have a bunch of fresh eyes looking at it right now, and clearly there's a lot of questions about what's happening in Chicago. So I was hoping you could talk about how you view profitability by hub and then where you see the most upside from your hub standpoint in 2026 and beyond.
Hey, thanks, Connor. And I'll just, you know, dive right into Chicago. We've been flying to Chicago for 100 years, and it was where our first flight took place, in fact, and it's going to be part of our system, you know, for the next 100 years. When we look at Chicago, it's strategically important. And it is something that we're going to grow back to where we were prior to the pandemic, to 500 flights. We feel that's rounding it out. That gets us to where we think that we need to be. And I'm really pleased with what I see from the results so far. Local customer mix is up 20%. Loyalty acquisitions up 20%. Co-branded credit card acquisitions up 20%. So we're making sure that we're doing best for our customers. And when it comes to Chicago, we would expect that it returns to the average profitability of our hub network. It's going to be our third largest hub, and we're going to keep at work taking care of our customers and making sure that it performs as best as it possibly can.
Awesome. And then maybe we could talk a little bit about just the cost trajectory in 2026. I mean, you quantified what you expect from 1Q just from the storms, and that's helpful. But it seems like 1Q is going to be your high watermark. So just how you think about the shape of the cost curve in 26 would be helpful.
Hey, thanks for the question. You know, the construct we've given in the past is that at around mid-single-digit capacity for this year, we would expect our unit cost to be low single-digit growth. And that's what we would have experienced here in the first quarter. You know, we expected unit cost growth in that 2% to 3% range prior to winter storm fern. So that's where we'll be for the year. I think, you know, quarter to quarter it might move a little bit up or down depending on what's happening with the timing of certain maintenance events. But if we end up at mid-single-digit capacity, I would expect low single-digit chasm. As always, though, we'll be flexible with capacity depending on the demand and competitive environment we find ourselves in.
Operator
Thank you. Our next question comes from the line. Katie O'Brien of Goldman Sachs. Your line is open, Katie.
Hey, good morning, everyone. Thanks for the time. So maybe just on the premium growth rate, I know you've shared that premium seed growth rate will be double main cabin seats for the end of this decade. And I think you've previously noted, you know, that's driven by 20% premium seed growth and 50% live flat growth through 2030. I'm just wondering, what does that look like in 2026, you know, how much seed growth is driven by premium, how quickly are you growing those live flat seeds, and how does this factor into your full-year revenue outlook? Is there a mixed shift benefit included, and how should we think about that?
Thanks, Katie. I'm going to hand that off to Nat Pieper, our Chief Commercial Officer.
Katie, good morning. On the premium side, You know, our premium performance in Q425, premium RASM, was superior to non-premium by seven points, both domestically and internationally very strong. And as we look forward into 26, by entity, you'll continue to see our premium mix improve. We're taking delivery of A321XLRs, our more 787-9P configuration, P standing for premium. And we'll continue to deploy more premium seats into international markets. By entity, just quickly, if you think on the transatlantic side, demand there continues to be really strong across both products. All parts of our business, Heathrow, rest of Europe, et cetera, and our joint business partners seeing similar things. Premium holding up well in the Pacific as well as in our deep south Latin market, too. So you're going to continue to see richness. We see a lot of depth in the premium market, and we're really excited about Americans' product evolving, the customer experience investments we're making all tuned to that premium traveler.
Great, Matt. Great to hear from you at your new gig. Maybe just one for Devin. You pulled forward your debt reduction target by a year once again, now expecting to be less than $35 billion by the end of this year instead of $27 billion. I think when I asked you at my conference last December, you said you'd contemplate what the right medium-term or longer-term leverage target would be once you got to under $35 billion. I know we're not there quite yet, but with the target approaching, how are you thinking about the balance sheet and when the potential buybacks start to figure into the calculus again? Thanks for all the time.
Hey, Katie. Listen, we are really pleased with the progress we've made on the balance sheet, not just over the last year, but really over the past three or four years. And, you know, we talk about the priorities. They remain the same. We focus first on taking care of our customers and making the right investments there, taking care of our team members, and then any investments we need to make back in the business. And then beyond that, any free cash flow that we're producing, we are putting into the balance sheet. And that's what's allowed us to achieve this goal and achieve this goal a year early. But we still have a lot of work to do before we shift our focus to any sort of shareholder remuneration. We need to get inside of three times net debt to EBITDA. That was our longer-term stated goal. We want to get to a double B-flat credit rating. So some work to do still on the ratings and metric side, but really happy with the progress we've made so far.
Operator
Thank you. Our next question comes from the line of John Godden of Citi. Your line is open.
Hey, guys. Thanks for taking my question. I wanted to ask a little bit about full-year guidance. I think the narrative that we've heard from other airlines so far is that the year started out very strong and we've seen what what people have interpreted as a bit, you know, conservative guidance in light of that. It sounds like you guys see similar trends based on how things have started the year. I just was hoping to kind of dialogue about how you would characterize your full-year guidance and areas where you think, you know, there may be some conservatism, if that's how you see it at all.
Hi, John. Maybe I'll just start with the first quarter, which I think is really a 50-50 forecast at this point. We've attempted to capture the impact of Winter Storm Fern, but we'll know more about that impact over the next week or so, which is why we provided a little bit wider range here in Q1. I'd say for the full year, though, probably similar comments to what we've heard from I think if bookings continue at their current pace, this guide could prove to be conservative. But we'll see how the year plays out. Right now, we're a month in, and we're comfortable with this range.
Got it. And if I could just follow up on a little bit of the Chicago commentary earlier, you know, completely appreciate your perspective on Chicago. One of the data points that was put out there by one of your competitors was the fact that you guys are potentially losing significant amounts of money in Chicago. I know you typically don't talk about hub level profitability, but I just wanted to give you a chance to kind of address that if there's anything to address there.
Thanks, John. Look, we're growing back Chicago. Pleased with what we see so far, as I said, customer action has been great. And, you know, we fully expect that Chicago returned to the profitability levels that had been at prior to the pandemic. And I just say this, we're doing all the right things, you know, from that perspective. But we're, you know, look, we're mindful of how we're positioned. And, you know, quite frankly, I wouldn't be out there bragging about profitability in a hub when, you know, 80% of your team members make, you know, a lot less than the market rate. So, you know, we're doing right by our team members. We're doing right by our customers. And we're certainly doing right by the community of Chicago, too. They welcome, you know, this kind of service. And the customers in Chicago, I can tell you, you know, benefit, you know, from competition. So we're pleased with what we're doing. And we're playing our game. and we're going to make sure that we deliver for our customers.
Operator
Thank you. Our next question comes from the line of Jamie Baker of JPMorgan Securities. Please go ahead, Jamie.
Hey, good morning, everybody. So question, another question on the full year guide. Last year, American contributed about 4% of the total big three pre-tax profit pool. based on your disclosures today, and if we just kind of use consensus for Delta and United, that 4% goes to about 12% in 2026. So I get that you may not necessarily think in these relative terms, but when we think of that improvement, how much do you, you know, attribute to the macro, and how much is idiosyncratic to American? And, you know, So, obviously, the Citi deal is a contributor. Is there any way you could parse that implied percentage of big three improvement? That would be helpful.
Thanks, Jamie. Well, I'd say this, that, you know, obviously some of it is due to, you know, a macro environment that is positive. Clearly, we see supply and demand, especially for domestic, coming back, you know, more into sync. and that definitely benefits American. But all the things that we're doing, as Nat mentioned, in terms of premium traffic, our strategy, I think, is paying off, too. So I don't know if it's 50-50 or 70-30, but it's a combination of both. And again, I'm pleased with the strategy we have. We're going to be a really efficient producer of ASMs going forward. And from a profitability perspective, the only other thing I'd just add is, yeah, we expect to be a greater proportion of total industry profitability. And again, we have labor cost certainty. That's built into our numbers.
Yep. Okay. And then very quickly on the firm calculus, that $150 to $200 million revenue impact, can I confirm that that is net of recapture? Or actually, let me ask it differently of the lost revenue in the past week how much do you forecast you recaptured later in the quarter or you just assuming that the totality of that revenue is gone for the foreseeable future Jamie I'll start Devin could help me out on this too like we weren't still in the midst of of assessing where things stand you know we're at 9,000 cancel this gets gonna probably be you know, more than that.
So, you know, that's a couple of days of operation, you know, for the entire quarter. And so the impact has been, you know, certainly that people didn't want to travel to some of the places that are iced in. And, you know, we don't see a lot of that coming back. And the other thing is, you know, there's been a, you know, a freeze on some level of bookings during this period as well. So as we take a look at it, I like what I see in February and March in terms of the bookings that we've seen as we really round out January. I think a lot of that is probably, you know, foregone revenue and, you know, the fact that we've got a perishable product in terms of, you know, some people want to fly to some places on certain days.
Operator
Thank you. Our next question comes from the line of Michael Linenberg of Deutsche Bank. Please go ahead, Michael.
Yeah, hey, good morning. I want to just get back to Dallas, and, you know, as you think about building that into the largest airline hub, actually single airline hub in the world, when I look at this last year and I look at your op stats, it's been a tough year, but it does seem like that Dallas has had more than its fair share of bad weather. And, you know, I'm not here to sort of predict what I think weather's going to be like in Texas over the next few years, but, you know, you do have knock-on effects as that hub builds out. But as you think about building that out, does that at all factor in your calculus, you know, and how it can impact the entire system, maybe whether there just being so much of your system being driven by the Dallas operation?
Thanks for that question. I just say this, that winter storm fern, it is something that is relatively unprecedented. I won't say that it's never happened before, but we get this kind of storm, you know, once every five to ten years in DFW. And having been here, you know, for over ten years, that's been my experience. We recover as quickly as we can. But over the long term, you know, DFW is the fastest growing, one of the fastest growing metro regions in the country. And the product that we're putting out is fantastic. As we think about growing, though, reliability is key. So one of the things that we're doing this coming year is reassessing how we bank our operation and pulling down the peaks quite a bit. So you'll see us convert to a 13-bank operation, yet still have presence in local markets that's, you know, equal to the biggest banks anybody else, you know, flies. At the same time, we're making sure that our facilities can keep up with that. You've heard about the new DFW Terminal F, which is just progressing at a great rate. But we'll be opening up a new satellite on Terminal C later this year and also on Terminal A. So we're going to make sure that we have the facilities, the schedule that works for it. And the final piece is we're working on airspace as well. So we're always going to have to take care of irregular operations events, and we'll thaw out here. don't worry about that. And Mother Nature has a way of hitting everybody, you know, equally over time. But I really like what we're doing in terms of making sure that we're as reliable as possible. And then also, we're going to continue to invest in making sure that our irregular operations recovery is the best in the business.
Okay, thanks for that. And then just to follow up on the Dallas, as you build that out, sort of where, and maybe this is for Nat as well, just where you know, the connect versus local split is today, and as you add, you know, you build that up, where does that, what does that evolve to? How does that shift, if at all? Thanks for taking my question.
Thanks, Mike. You know, I think the mix actually stays pretty similar. We're going to be more, create more utility for local customers with different alternatives, but I think the way we manage Dallas as it goes to a thousand departures eventually is the cornerstone of our network. And you hit the nail on the head in asking the question. I look at it as trying to maximize revenue for America across our entire system. And having an operationally reliable DFW, the engine behind everything we have in the domestic U.S., it really becomes a no-brainer. So, we're really excited about the potential and the enhanced utility for local DFW customers.
Operator
Thank you. Our next question comes from the line of Scott Group of Wolf Research. Please go ahead, Scott.
Hey, thanks. Good morning. So, can you just help us think about overall capacity growth for the year? And then I guess with what I think you'll say is something north of GDP, like what's the confidence in sustaining strong RASM throughout the year with more elevated capacity? And maybe just help us think about how much the new credit card helps on RASM this year.
Hey, Scott. Yeah, for capacity for the year, we didn't give a guide to, but I would expect for the first quarter, as we said, it's going to be up in the three to five range. Ideally, we would have been a little higher than that. I would expect a similar level of capacity growth right through the summer peak. And then as we always do, coming out of that summer peak, we'll adjust capacity depending on the competitive and demand environment that we're seeing. But if it holds and if kind of our expectations hold, we'll probably have capacity for the full year around mid-single digits. We like the opportunities we have. We've talked a lot about growth opportunities in Philadelphia, Miami, Phoenix, along with rounding out our schedules in Chicago. And we do think even with this level of growth, we'll have a supportive environment for positive unit revenue throughout the year.
Just one quick note on the loyalty side, too, as part of your question. You know, as the Advantage program continues to grow, enrollments are growing, extremely rapidly for us. And Advantage members are the lion's share of our premium revenue, the lion's share of our flown revenue. And as we continue to grow that program, it just engenerates loyalty to American, and that's going to translate into higher unit revenue as well.
Just a quick follow-up. So when you guys announced the new card and gave us a multi-year earnings contribution from that, is there a reason to think 26 is, you know, So is that a linear growth in 26, or is it any front-end motive in any way?
No, I'd say it's all pretty linear. It's never going to be perfectly linear, both in terms of remuneration that we get. Sometimes it'll come in a little chunky, depending on different bonuses that might be there. And also just in the impact of the P&L. It won't be perfectly linear, but it will be, you know, fairly linear over the next five years.
Operator
Thank you. Our next question comes from the line of Christopher Stathuopoulos of Susquehanna Financial Group. Please go ahead, Christopher. Your line is open.
Good morning, everyone. Thanks for taking my questions. On ORD, I heard a target of, I think it was 500 flights. So where does that sit? And assuming that's, I'm not sure if that's for this year or next, but how should we think about that within the context of the midpoint of the guide? And then at 500, does that put you back at profitability for that hub?
I'll just comment again. We anticipate getting back between 500 and 550 flights. That'll happen this summer. And we're on track and meeting the goals that we had established for ourselves. And again, Chicago is strategically important, and at the end of the day, it's going to help overall system profitability, but we fully expect that Chicago will return to its position as one of our, you know, mid-level profitability hubs.
Okay. And then on the $1 billion in savings realized, if you could talk about opportunities going forward, I think in the past you've spoken about technology or AI in benefiting areas such as MRO and procurement? Maybe if you could expand on that in other potential areas.
Yeah. You know, this is something we've been at for over three years now, just really trying to re-engineer our business for efficiency and making investments that drive productivity and a better customer experience. I'll say no major change. Obviously, we'll lean into the latest technologies like AI and the opportunities it brings, both areas like tech ops and reservations. A lot of the work, though, just continues to be streamlining processes and making regular-way technology investments that drive improvements across our labor line with productivity improvements that are improvements for our customers. We also focus heavily on procurement, where we think we've built the best procurement team in the world that's driving really significant savings as well as working capital improvements. And so this is a continuation of a years-long effort. It's a mindset for the company. It's an area that Robert and I get to meet on with leaders across the company every month. We think we're best in class, and we'll continue to focus there. Thank you.
Operator
Our next question comes from the line of Raymond James. Your line is open, Savi.
Hey, good morning. I wonder if you can talk a little bit about operations. You know, clearly, Fern is just an outlier here, but some of the investments that you're making in DFW, you know, when do you expect to see that? And in Chicago, not necessarily, you know, there seems to be a lot of flights being added just industry-wide in Chicago. And just any thoughts on kind of how that operation might impact, but really looking at it at a high level, but also wondering if, you know, the level of flying in Chicago is a concern.
So I'll just start with DFW again. We have this facilities project that is going on that's been in the works for some time right now, new terminal F, which is going to be American's terminal, new satellites on terminals A and C. Those are progressing really well. I think that they're going to be really spectacular from a customer experience perspective and enable DFW to get to over 1,000 departures, and we're really pleased with that work. And regarding Chicago, again, I'll just say that we're flying to the places that our customers want to go, and it warrants rounding the schedule back out to between 500 and 550 flights, and really look forward to putting forth a great product this summer. We've done it before.
We'll we'll do it again and you know that's that's what i have to say on that front i can't really speak to what others are doing i guess robert my question is coming from operations i have no doubt that there's appetite in chicago for american um to kind of kind of come back there in a big way i'm just kind of curious about one like the changes you're making at dfw you know how you expect that to improve operations throughout the year like when we will see the biggest benefits, and two, if kind of the level of operations that are going to happen in Chicago this summer, not just American, if there's a concern in terms of if the airport can handle that.
Well, Savi, in terms of what we're doing in DFW, it's not only the facilities work, but it's technology we're bringing to bear. So whether that's making sure that we have the appropriate solutions to disruptions during during the summer with smart gating and connect assist. We have new block time targets, which means we've assessed how we're building things out all into this 13 bank schedule. We really think that that's going to show performance throughout the entire year, but I would expect a notable benefit during the summer. And for Chicago, you know, look, this is a lot of growth for us, again, but it's only getting back to where we were. So we're putting a tremendous amount of time and effort to making sure that we're ready and that all of our partners are ready to go as well. So we've got all eyes on it and, you know, ready for the growth that we have planned for Chicago this summer.
Our next question comes from the line of Atul Mahaswari of UBS. please go ahead at all good morning thanks a lot for taking my question I also have a question on the full year guidance it sounds like to get to the midpoint of the range you're not necessarily assuming current booking strengths to persist a could you confirm that and then B which is the high end of the range would you need the current demand to you know continue at these levels or would that drive even more upside over and above the high end of the rates. Thank you.
Yeah, I think you're interpreting our comments correctly, that we've seen really strong bookings in the first part of the year. If bookings continue at this level, we would probably be a lot closer to the high end of the guide. We haven't built that in for the entire year. You know, to come in, you know, above the high end, it would probably require some acceleration of what we're seeing right now.
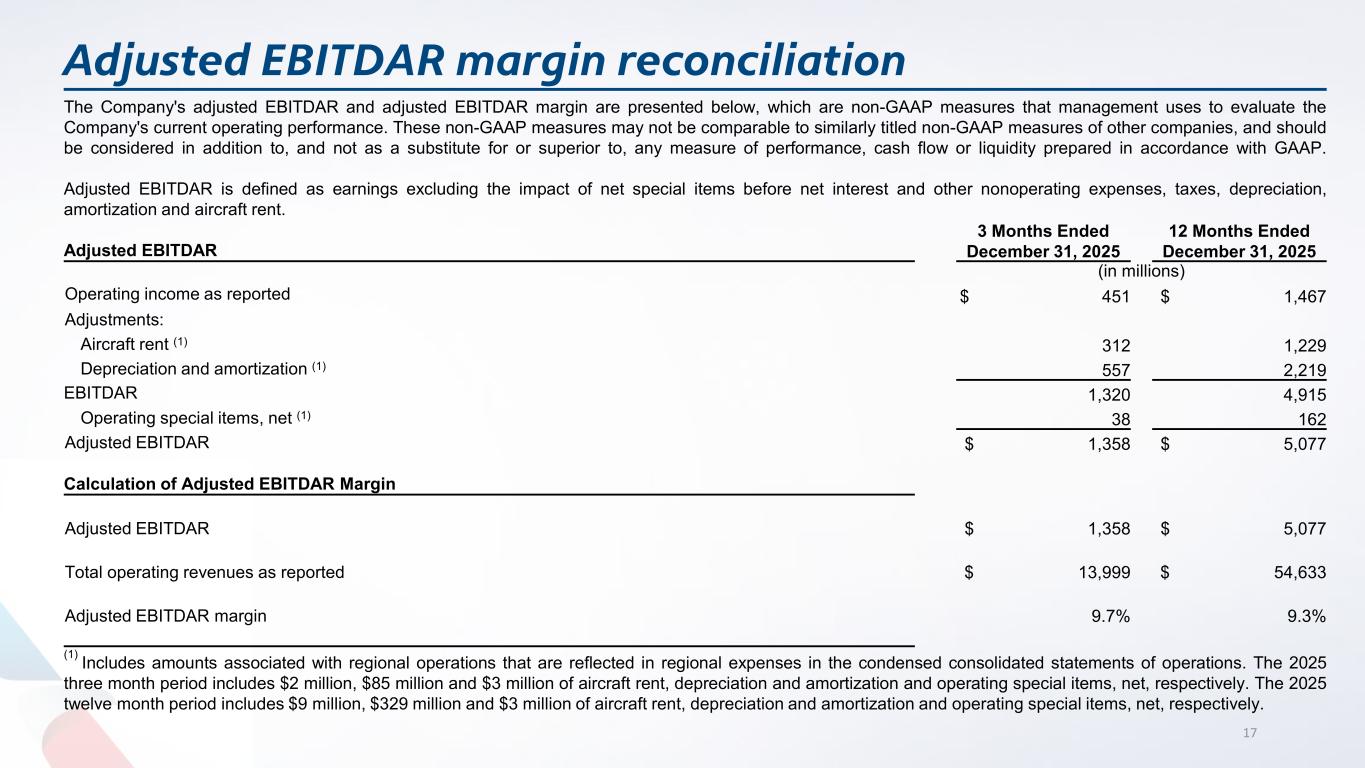
Got it. That's helpful. And let me follow up. As you look out, you know, over the next few years, what do you think is a sustainable long-term margin rate for Americans, either with respect to EBITDA margin or the pre-tax margin, whatever you want to pick? And relative to where you land in FY26, what are the key drivers that get you to that long-term sustainable margin rate?
Well, what we're working on is this. we're going to continue to be the most efficient producer of capacity in the business. And I feel great about what we're doing. And Devin highlighted some of the things that we've embarked on with re-engineering the business. But our focus right now is delivering on our revenue potential. And that's gonna push margins, we believe, the most. So it starts with delivering a consistent, elevated customer experience. You've heard us talk about a lot of things we're doing, Whether it's from a facilities perspective, reconfigurations of our fleet, the new flagship suites and flagship lounges, everything that we do for our customers is being looked at in a way to enhance that. On top of that, we have a network that is getting back to scale and size. And I feel that where we're flying is where people want to go, and we're going to make sure that we maximize the power of that network, and it's powered by the youngest fleet that's out there. You know about the work that we're doing with Citi with the relaunch of our co-branded credit card relationship. I feel great about the Advantage Loyalty Program and that being the best in the business. And then ultimately, we're going to sell and market our product and make sure that we stay on top of our share and our ability to really drive performance through sales, marketing, and revenue management. All that combines to put us in a position where we anticipate margin growth. I think that that then fuels free cash flow production, a stronger balance sheet, and getting really American back on track with where we had hoped we'd be a couple years back. So that's what I expect and appreciate the opportunity to expand on.
Operator
Thank you. Our next question comes from the line of Duane Fennecworth of Evercore ISI. Your line is open.
Hey, good morning. I just wanted to ask you about your window into government travel. Obviously, there was a fair bit of noise in the fourth quarter, and we have some noise, at least in the last week, from Mother Nature. But are you seeing signs of stabilization or growth in the government segment as we begin to comp really severe Doge impacts last year?
Okay, I'll handle that. Yeah, look, what I can tell you is that our government traffic in the fourth quarter was down about 50 percent, and that's largely driven by the government shutdown. As we move into the first quarter, it's just too soon to see how that's going to come back, but we've built into our forecast assumption that we'll have to be out there and working hard to win back government business. But over time, you know, I would anticipate that the government traffic returns. You know, Washington is always going to be really important. And I do believe that our Washington national hub, you know, does something for customers that no other, you know, airport can really do. And when government travel comes back, we're going to be the best position to take advantage of it. So I look over the long run as that being the upside to us.
Thanks, Robert. And then just on premium, I don't know if there's any way to frame it on a relative basis, you know, premium as a percent of total seats, you know, where you are today versus your network peers. And as you look at, like, the growth you're lining up over the next few years, where does that, you know, go to?
I think, Dwayne, it's Nat. I think from a network peer perspective, not deep into that. I can speak, though, on the American side, not only taking delivery of aircraft, but mod programs that we've got going on with our A319s, our A320s, 100-plus airplanes in those buckets, and then longer-term, 777 modifications, both the 200s and the 300 fleet. So clearly enhancing the premium product and the offering that we have out there, premium economy continues to be very successful for us, too.
Yeah, in terms of just real numbers, 30% growth as we take a look in premium seeding out towards the end of the decade and 50% growth from a lie-flat international perspective as we move out towards the end of the decade. And, you know, in terms of overall premium revenues, I don't think we're a lot different than our competitors. We see about 50% of our revenue, you know, being driven by premium offerings. And that's something that, again, we've got a product lineup and a strategy that is really directed at meeting those customers' needs.
And the other piece to it as well is just a recovery on the sales and distribution side, which drives premium revenue as well. Getting back to our indirect share, which we mentioned in the script, and then just having a more reliable, better customer experience, more reliable operation suited to that specific segment. We expect to continue to participate actively and grow that share.
Operator
Thank you. Ladies and gentlemen, at this time, the floor is open for media questions. Again, the floor is open to all media questions. please press star one one on your telephone we ask that you please allow to allow everyone the opportunity to participate you limit yourself to one question our first question comes from the line of niraj choksi of new york times your line is open niraj hey thank you um i i was just wondering if uh on the topic of uh fern can you guys help us understand you know what why was Americans so disproportionately affected you know just looking today like United Delta Southwest have very few cancellations and American has about
750 so far oh thanks thanks for the question I can tell you from having spent the night on campus here that the DFW area is a little bit different and let's face it DFW is big in our operation almost a third of our team members that reside in the area, conditions here are still a skating rink. And I'm super proud of what our team has done in terms of getting the operation back. We're trying our best to make sure that we cancel in front and do that in a way that gives customers the most advanced notice. But there's no mistake, and DFW is still in the thick of it, and we've got to thaw out a little bit today. I do think that the sun's going to come out and, you will improve quite a bit so our team members can get back in place. But this fern, it hit not just DFW, but it hit Charlotte and then went up the coast. So it hit our system five out of our nine largest operations, you know, all at the same time. I believe that we've got a couple more days of digging out. I want to apologize to our customers, certainly doing everything we can to make sure that they are taken care of. And then the last thing is, you know, our team. They're the ones who are fighting the elements, trying to make it in. And there's no hiding it. Again, it's an ice rink out there in DFW. And it's safety, safety, safety. So from the perspective of canceling flights, it's done for the purposes of making sure that we don't put anybody in harm's way. We'll work out of this. We're the best in the business at this, and we'll be back on track as we get towards the end of the week.
Operator
Thank you. Ladies and gentlemen, this concludes the Q&A portion of the call. I would now like to turn the conference back to Robert Isom for closing remarks. Sir?
Thanks, Lateef. And I'd just like to say thanks for dialing in. We know who we are. We're a premium global airline. We're out there every day, even in these ridiculous weather conditions, caring for people on life's journey. We have a focused plan this coming year to deliver on our revenue potential. And it starts with making sure we have a fantastic customer experience. We're gonna maximize the power of our network and just love the areas that we're gonna be growing this year. We have a loyalty proposition that's second to none and relationship with Citi is really gonna kickstart value production this year. And we're gonna keep up the momentum in terms of selling our product effectively, making sure that we regain and hold our share with all of our customers. And at the end of the day, we have a fantastic team. We do a great job of producing an efficient level of capacity and making sure that we're taking care of our customers. So I appreciate the interest and look forward to delivering for our customers and our shareholders.
Operator
This concludes today's conference call. Thank you for participating. You may now disconnect.