Operator
Good day, and thank you for standing by. Welcome to the Howard Hughes Third Quarter 2025 Earnings Conference Call. Please be advised that today's conference is being recorded. I would now like to hand the conference over to your speaker today, Joe Valane, General Counsel. Please go ahead.
Good morning, and welcome to the Howard Hughes Holdings third quarter 2025 earnings call. With me today are Bill Ackman, Executive Chairman; David O'Reilly, Chief Executive Officer; Ryan Israel, Chief Investment Officer; and Carlos Olea, Chief Financial Officer. Before we begin, I would like to direct you to our website, www.howardhughes.com, where you can download both our third quarter earnings press release and our supplemental package. The earnings release and supplemental package include reconciliations of non-GAAP financial measures that will be discussed today, in relation to their most directly comparable GAAP financial measures. Certain statements made today that are not in the present tense or that discuss the company's expectations are forward-looking statements within the meaning of the federal securities laws. Although the company believes that the expectations reflected in such forward-looking statements are based upon reasonable assumptions, we can give no assurance that these expectations will be achieved. Please see the forward-looking statement disclaimer in our third quarter earnings press release and the risk factors in our SEC filings for factors that could cause material differences between forward-looking statements and actual results. We are not under any duty to update forward-looking statements unless required by law. I will now turn the call over to our CEO, David O'Reilly.
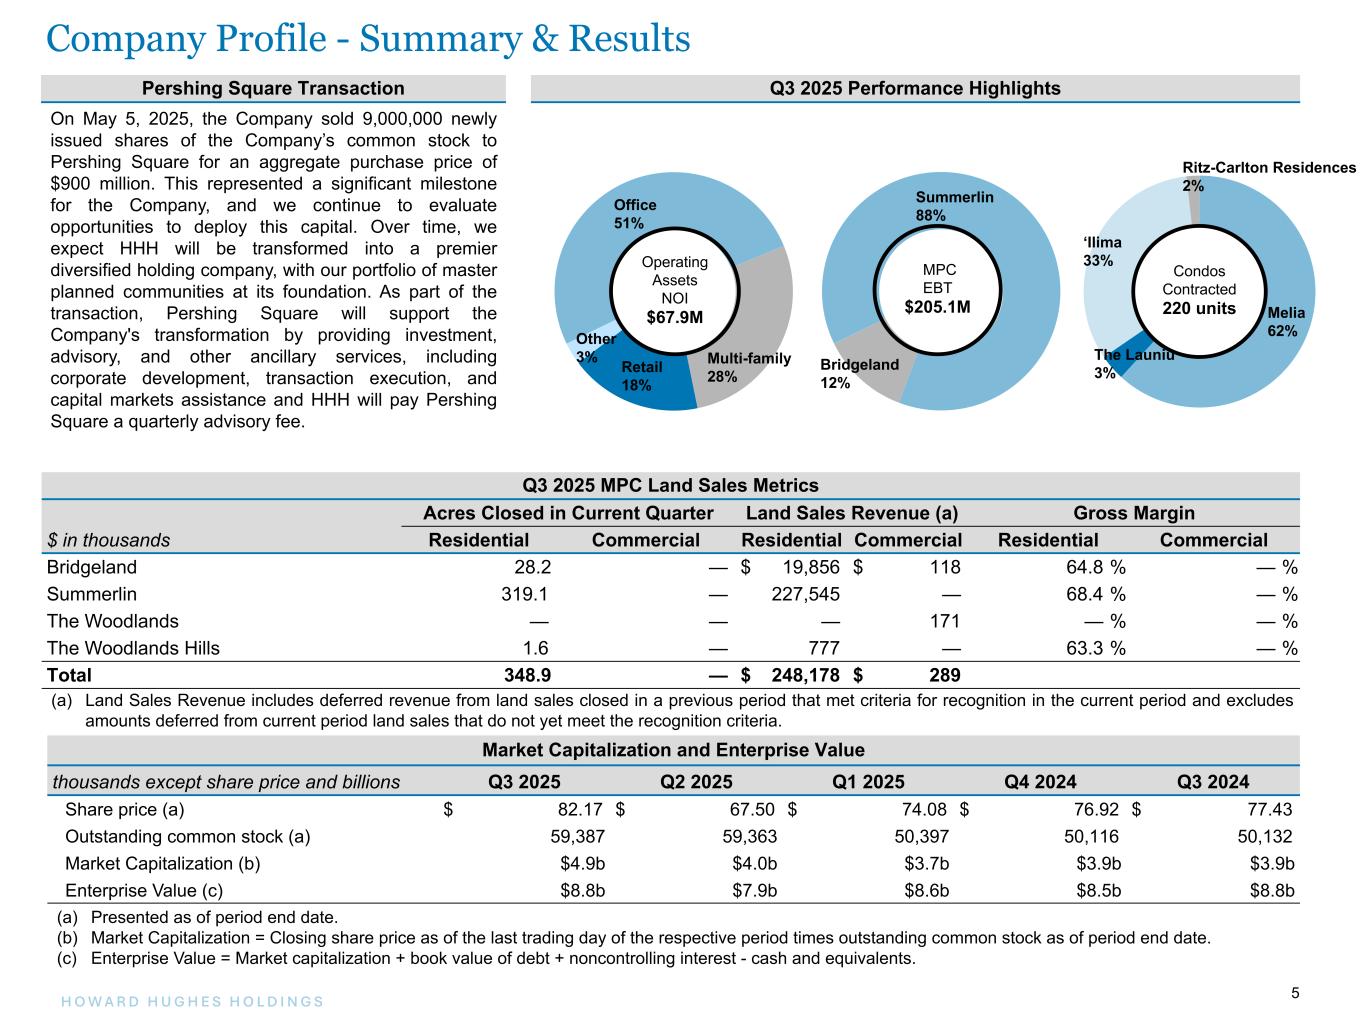
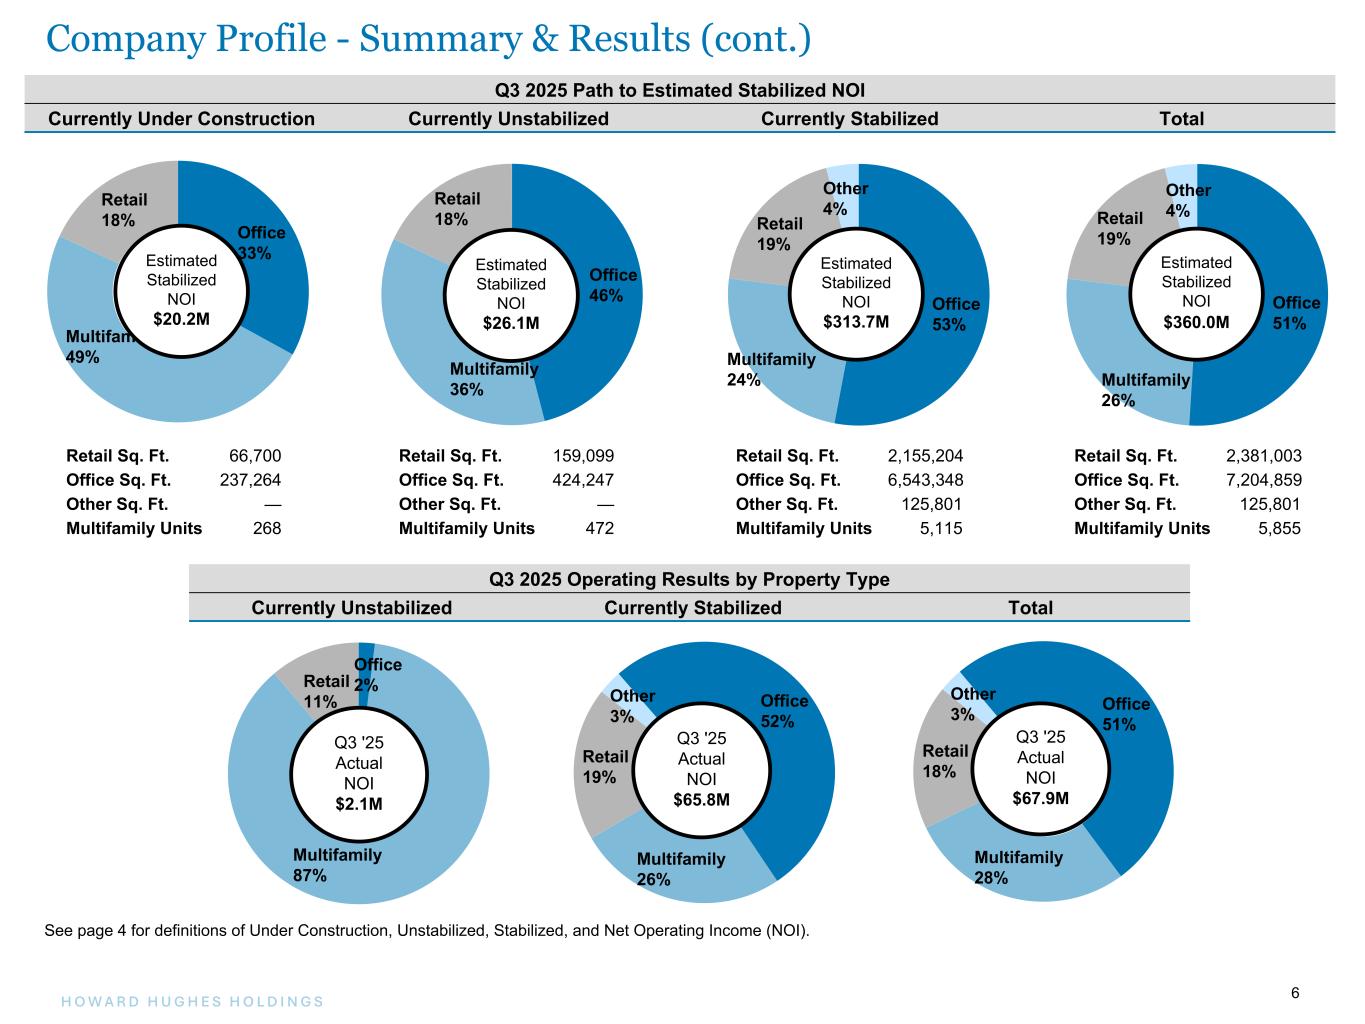
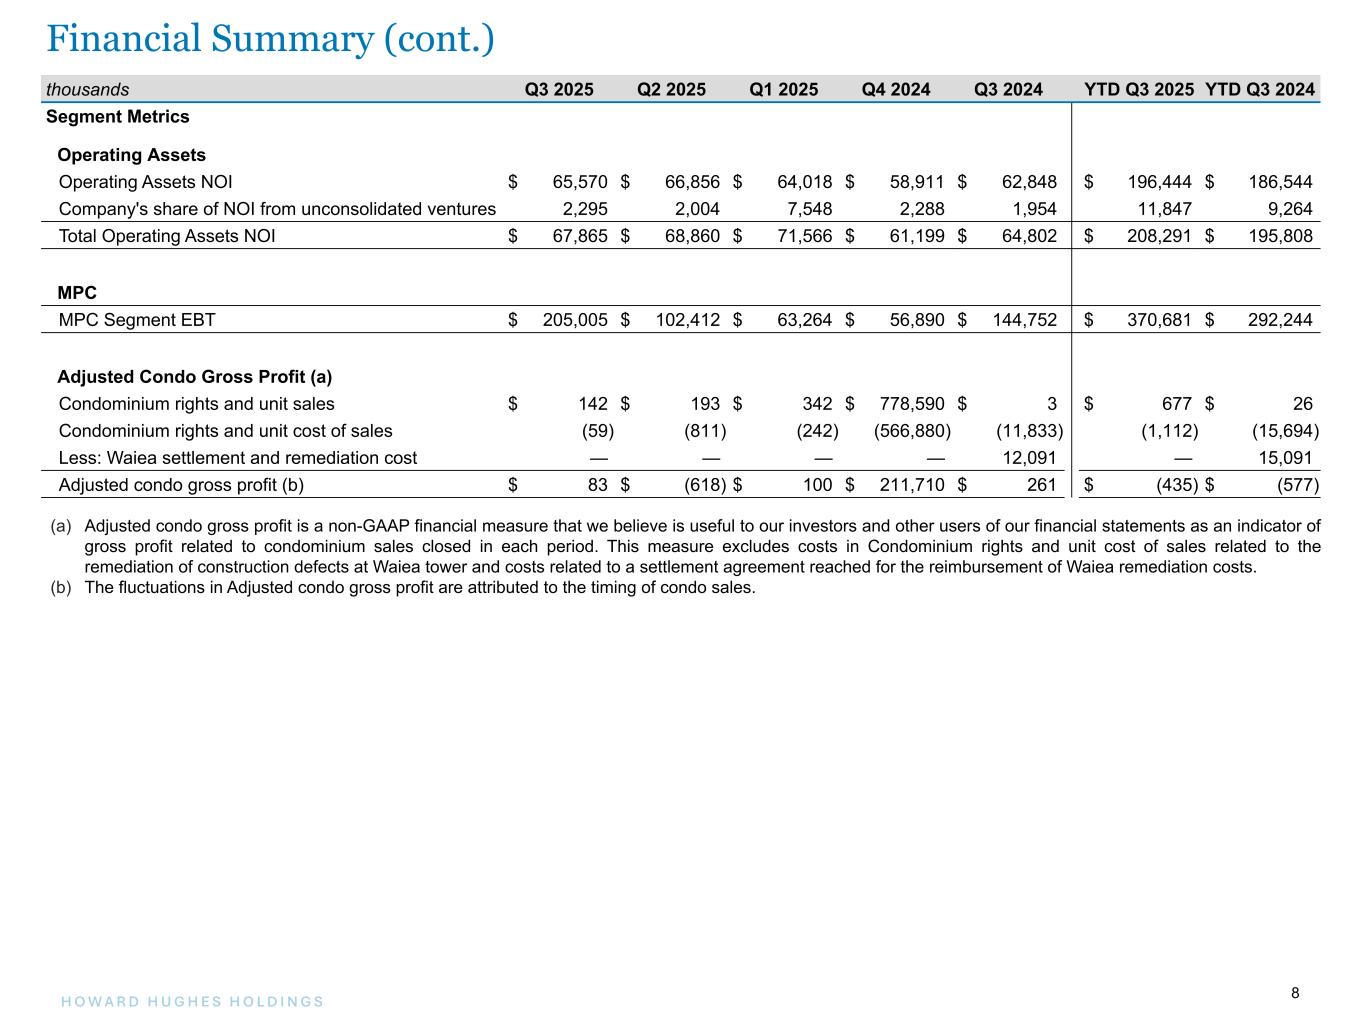
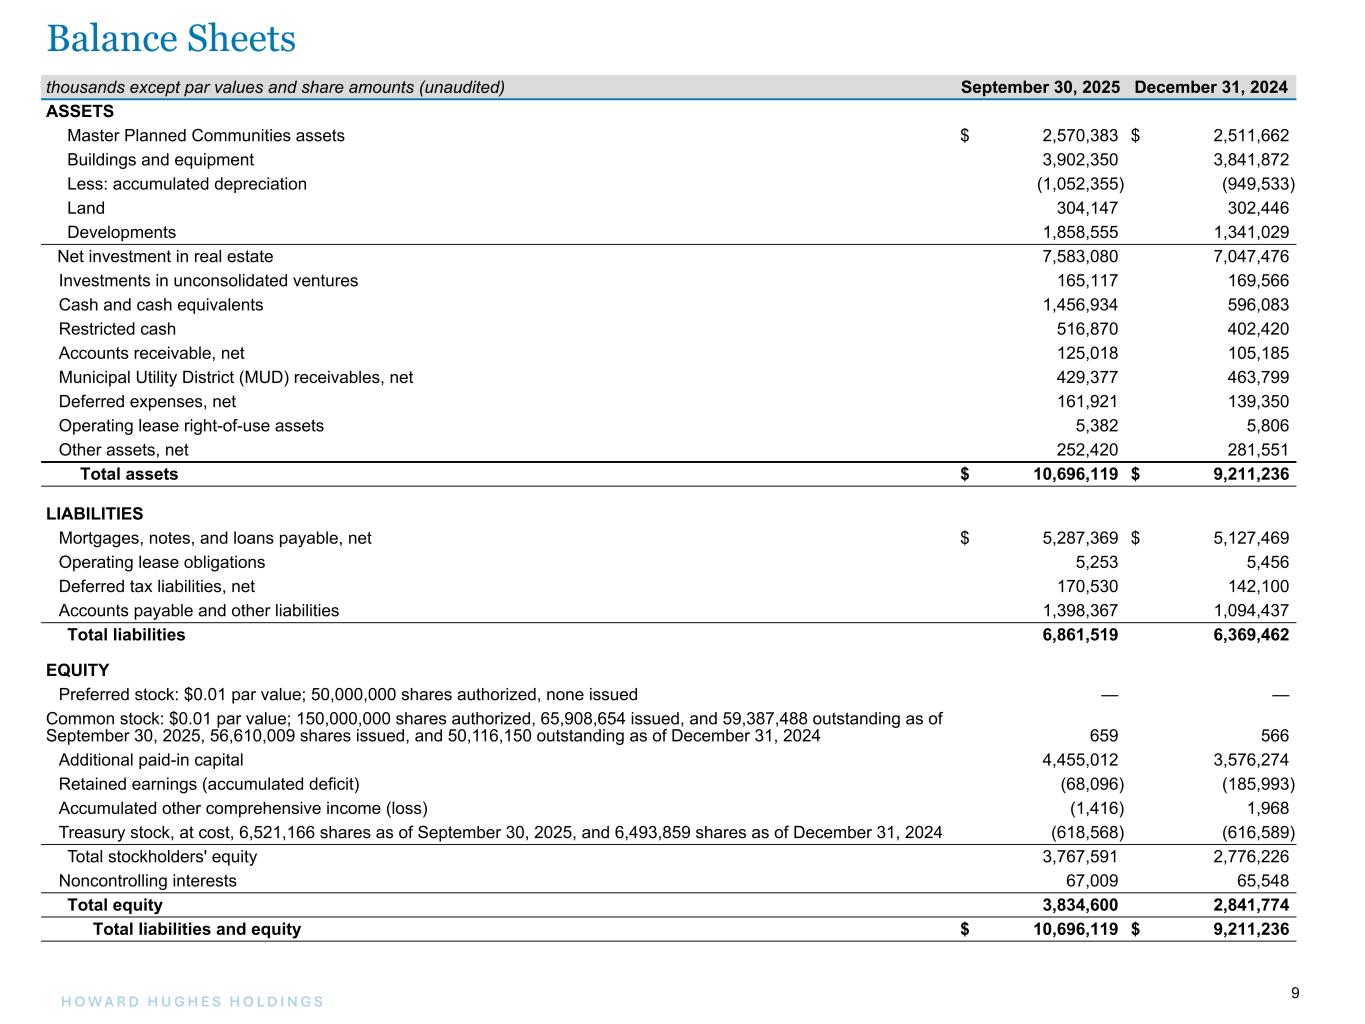
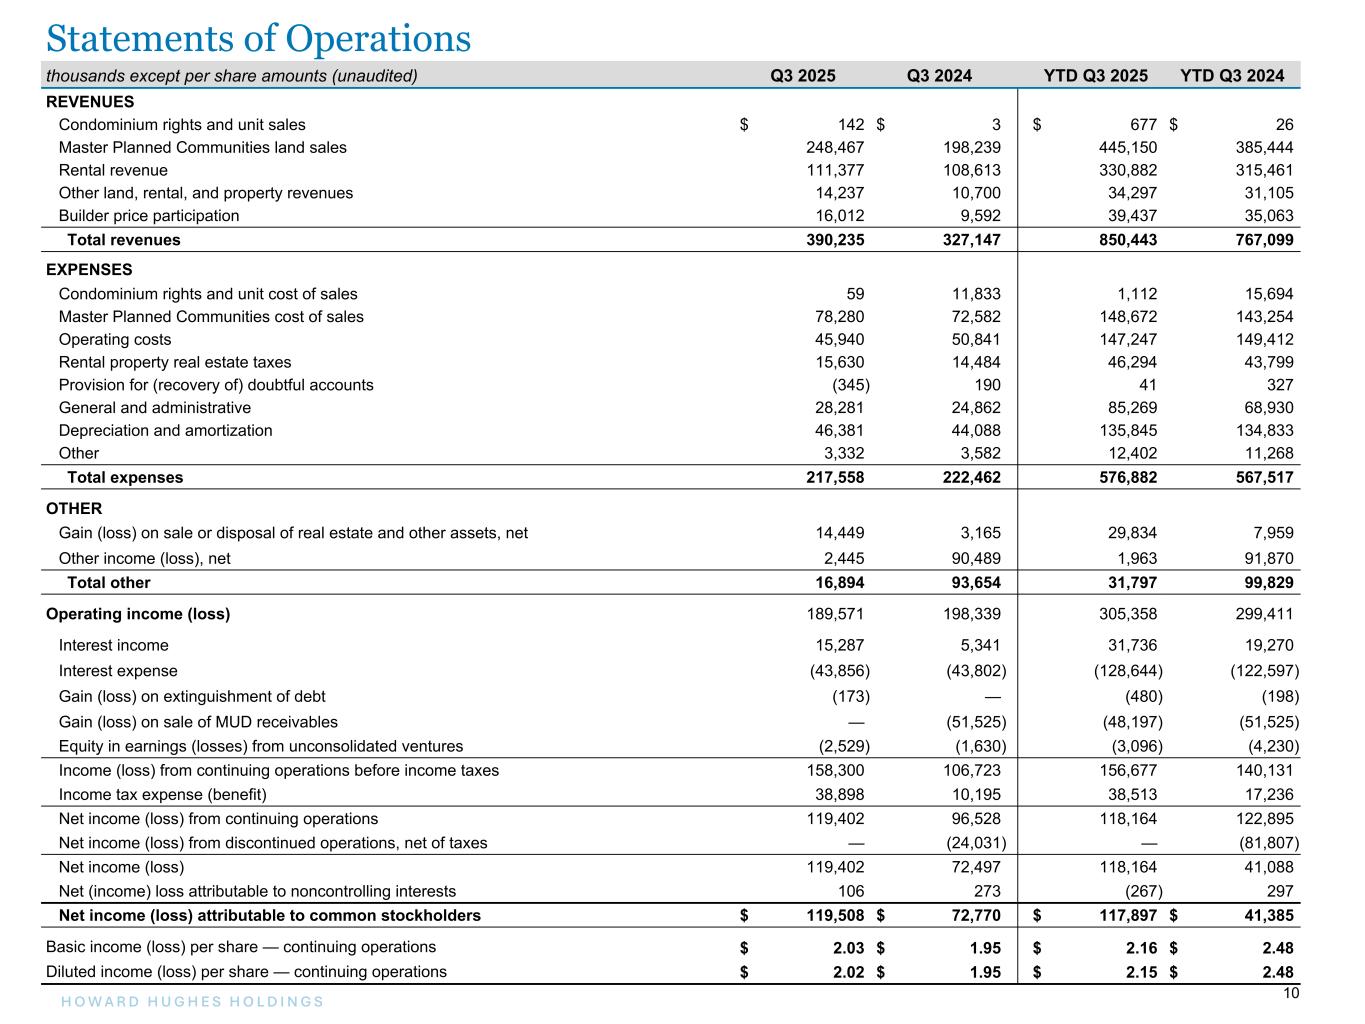
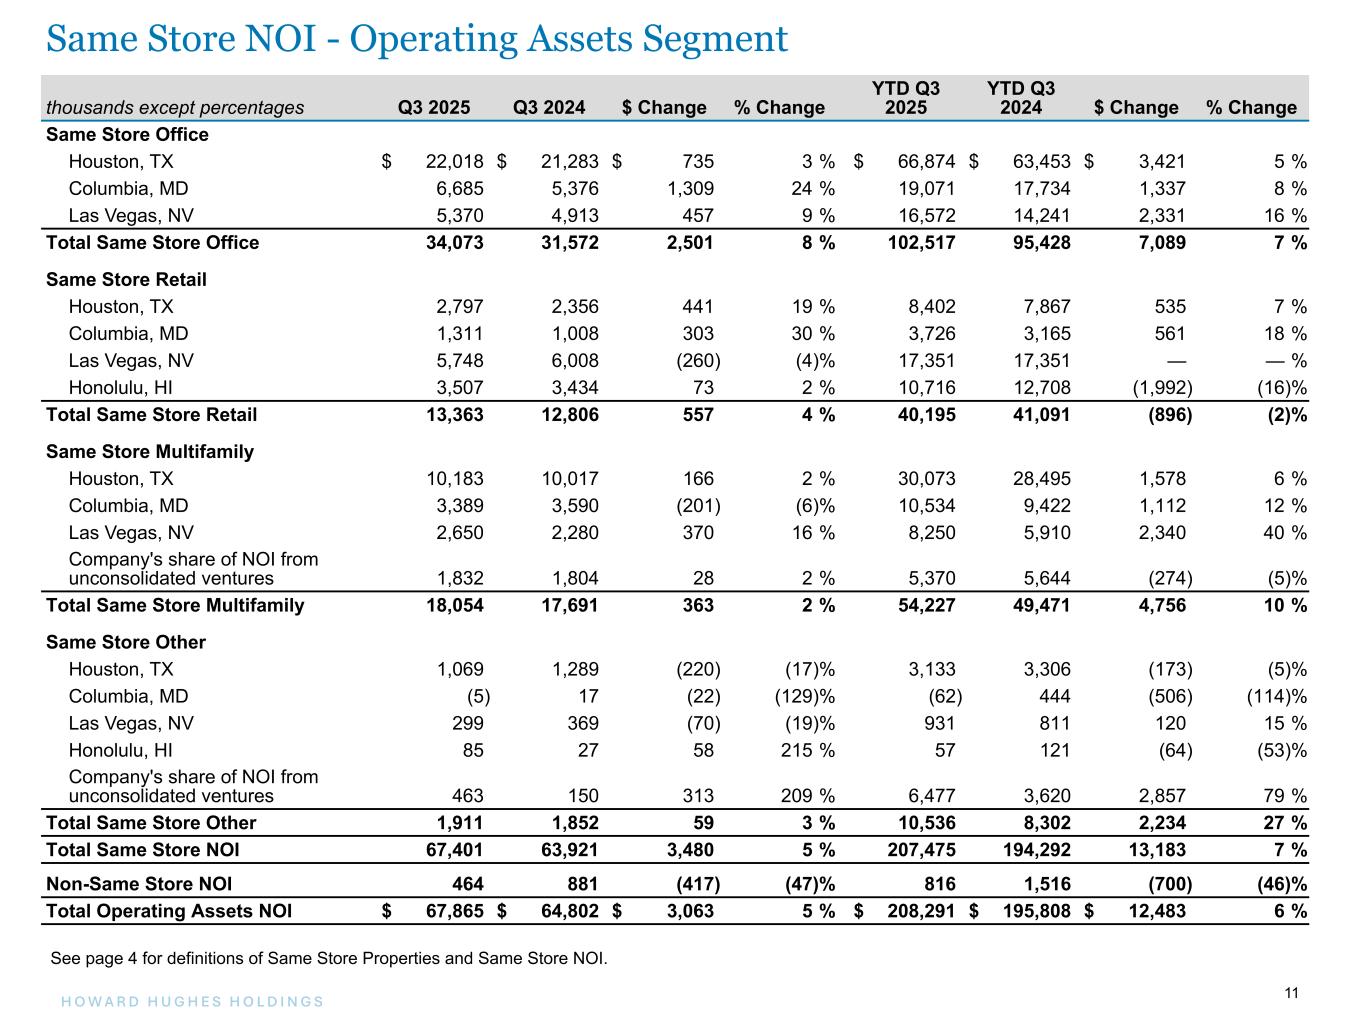
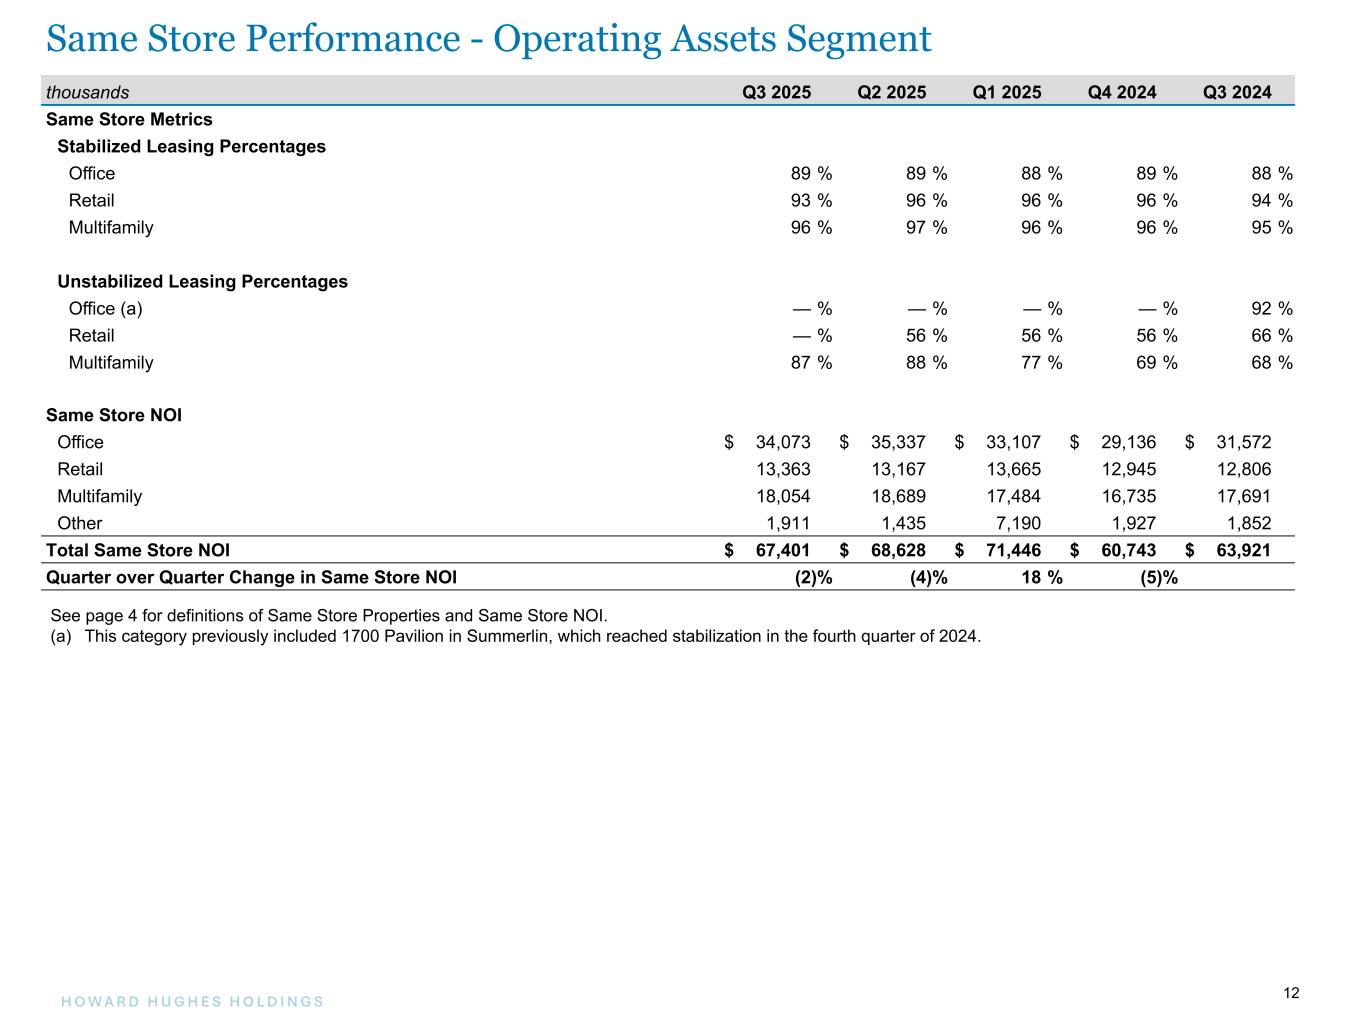
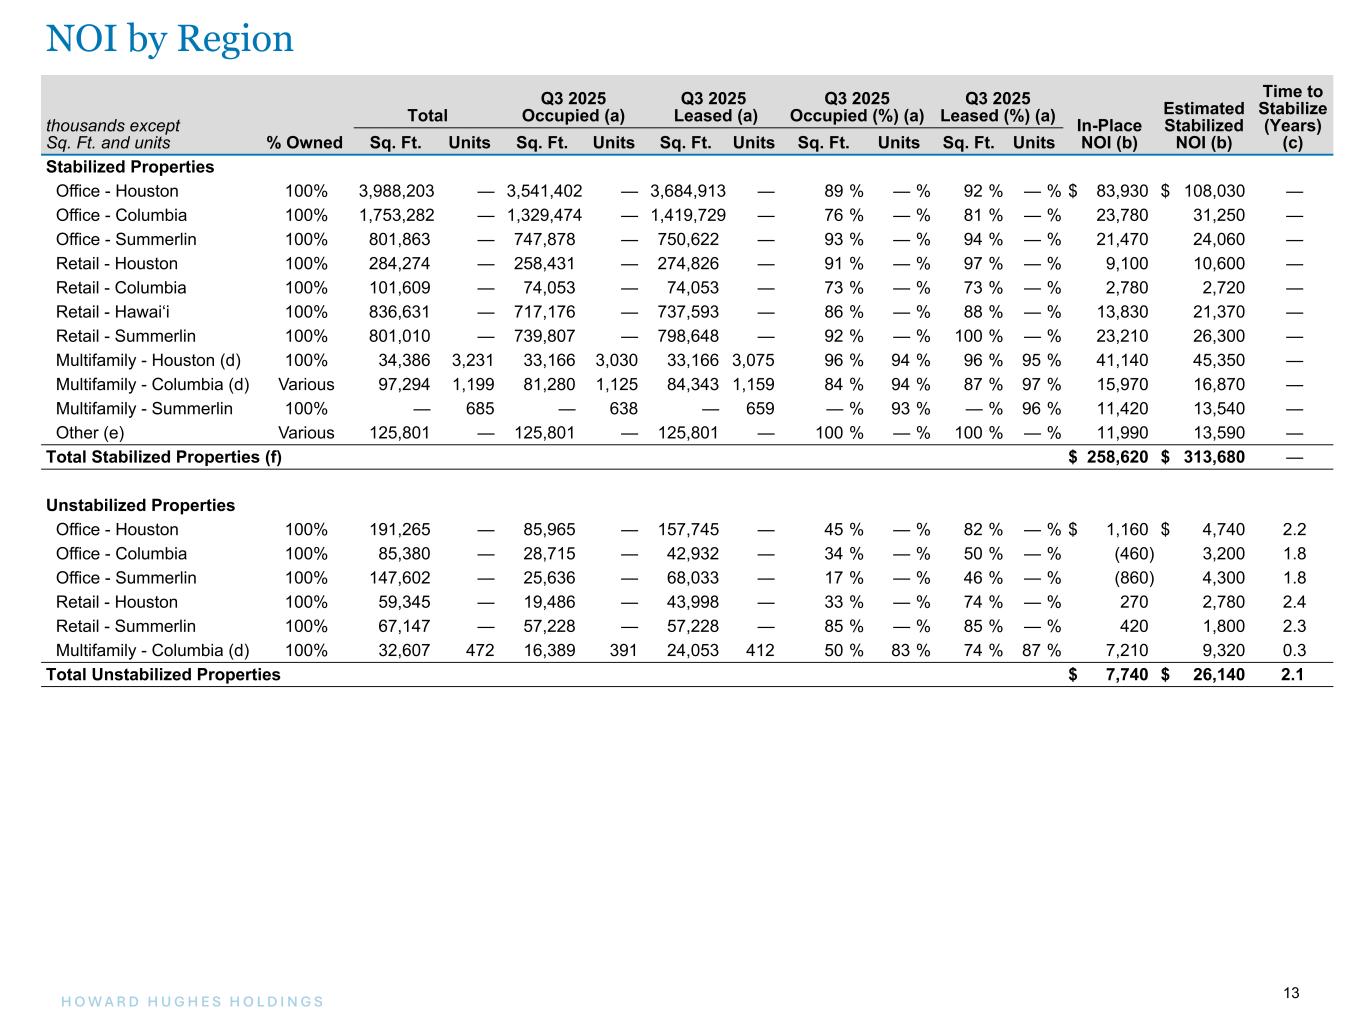
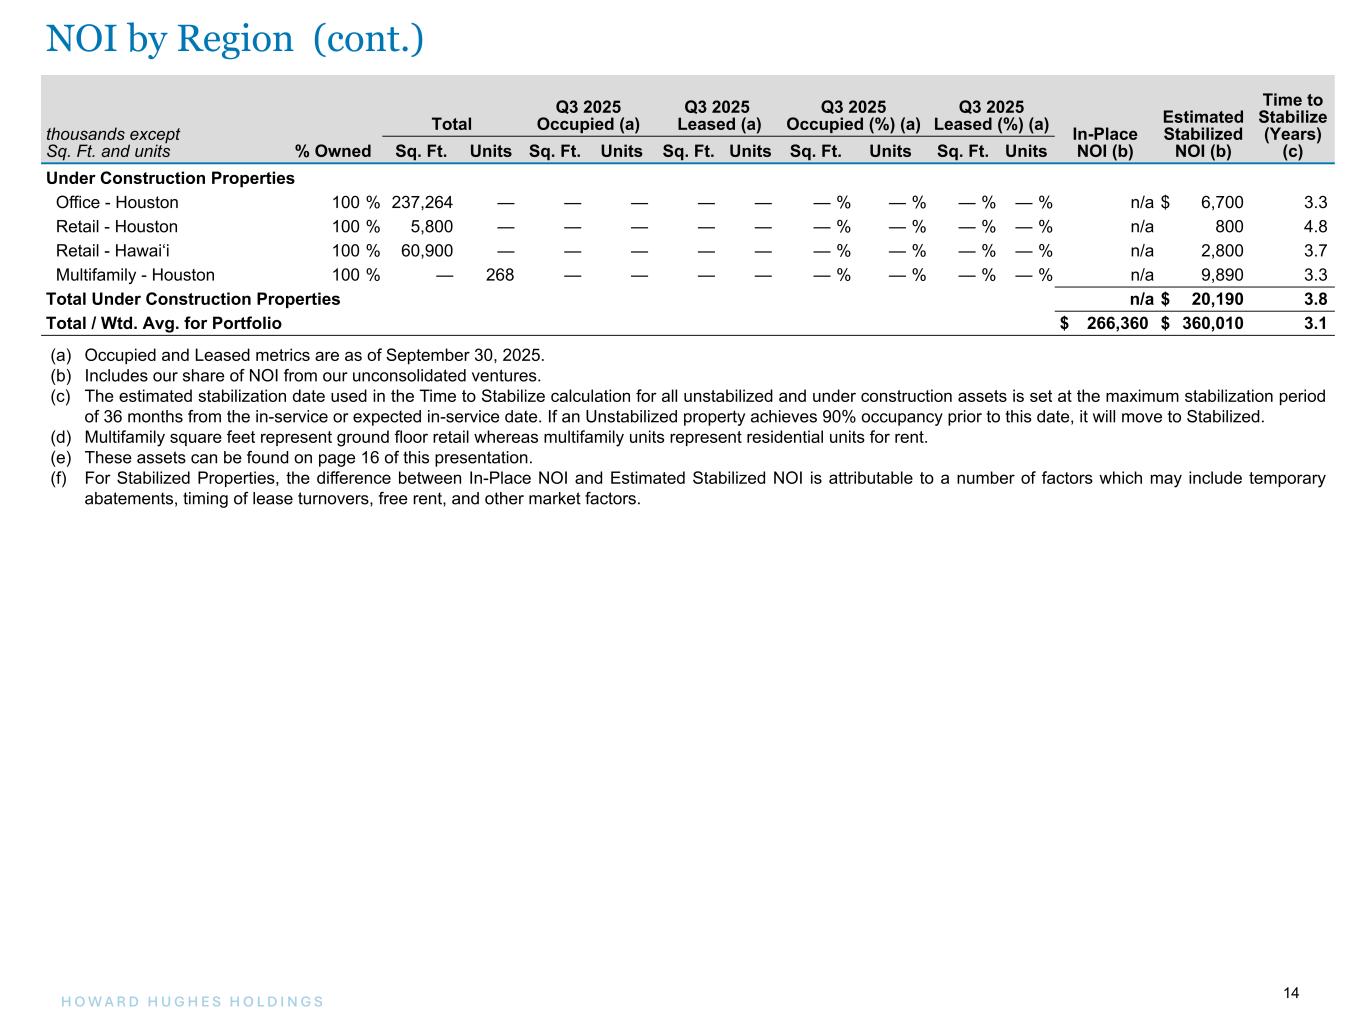
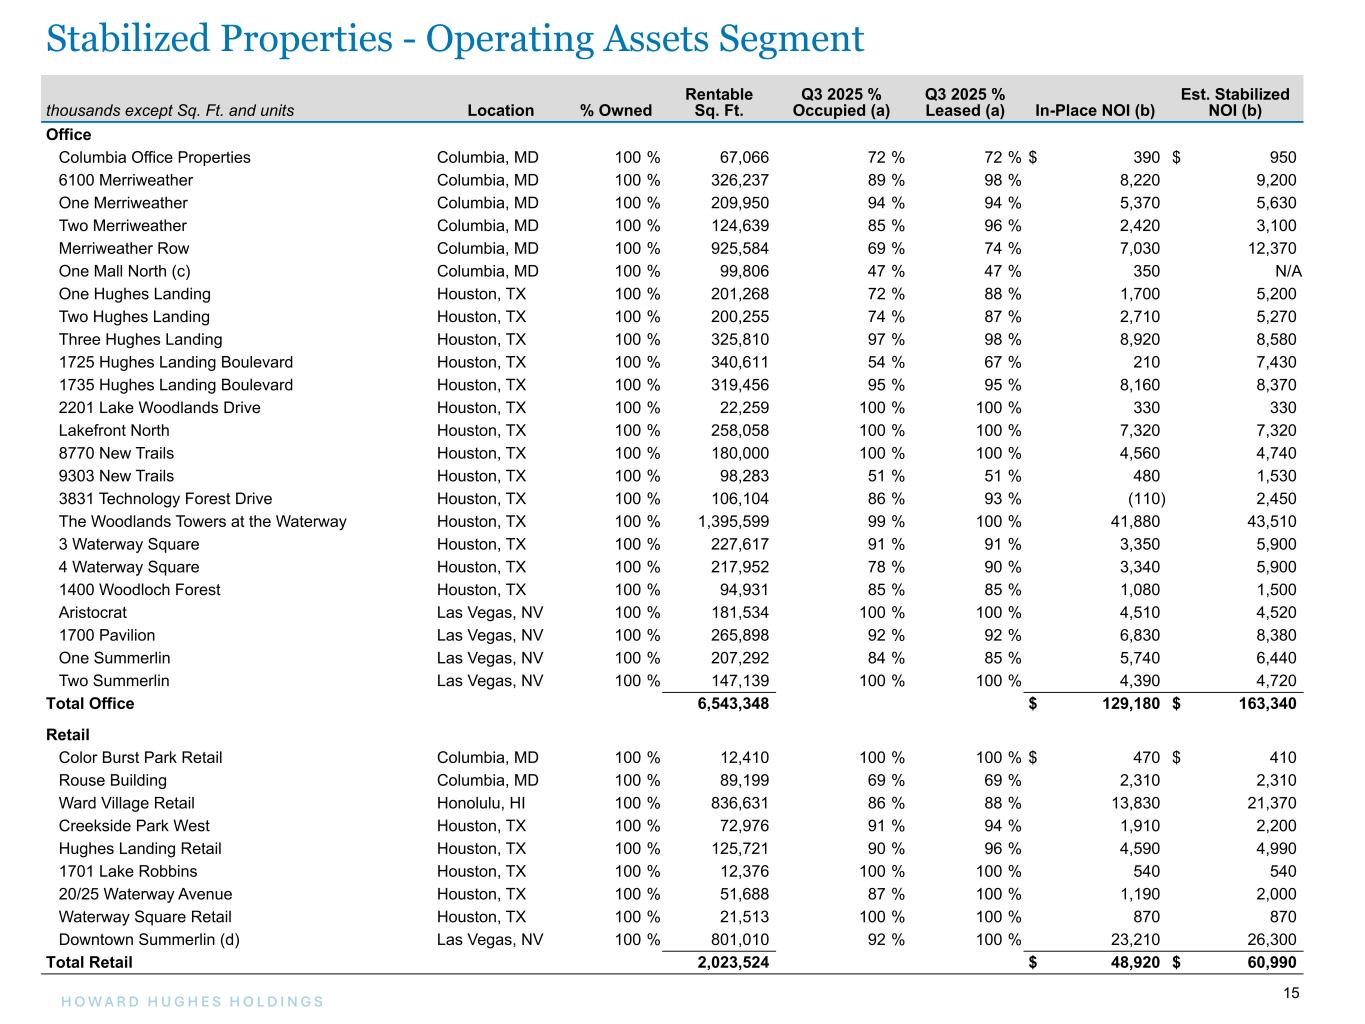
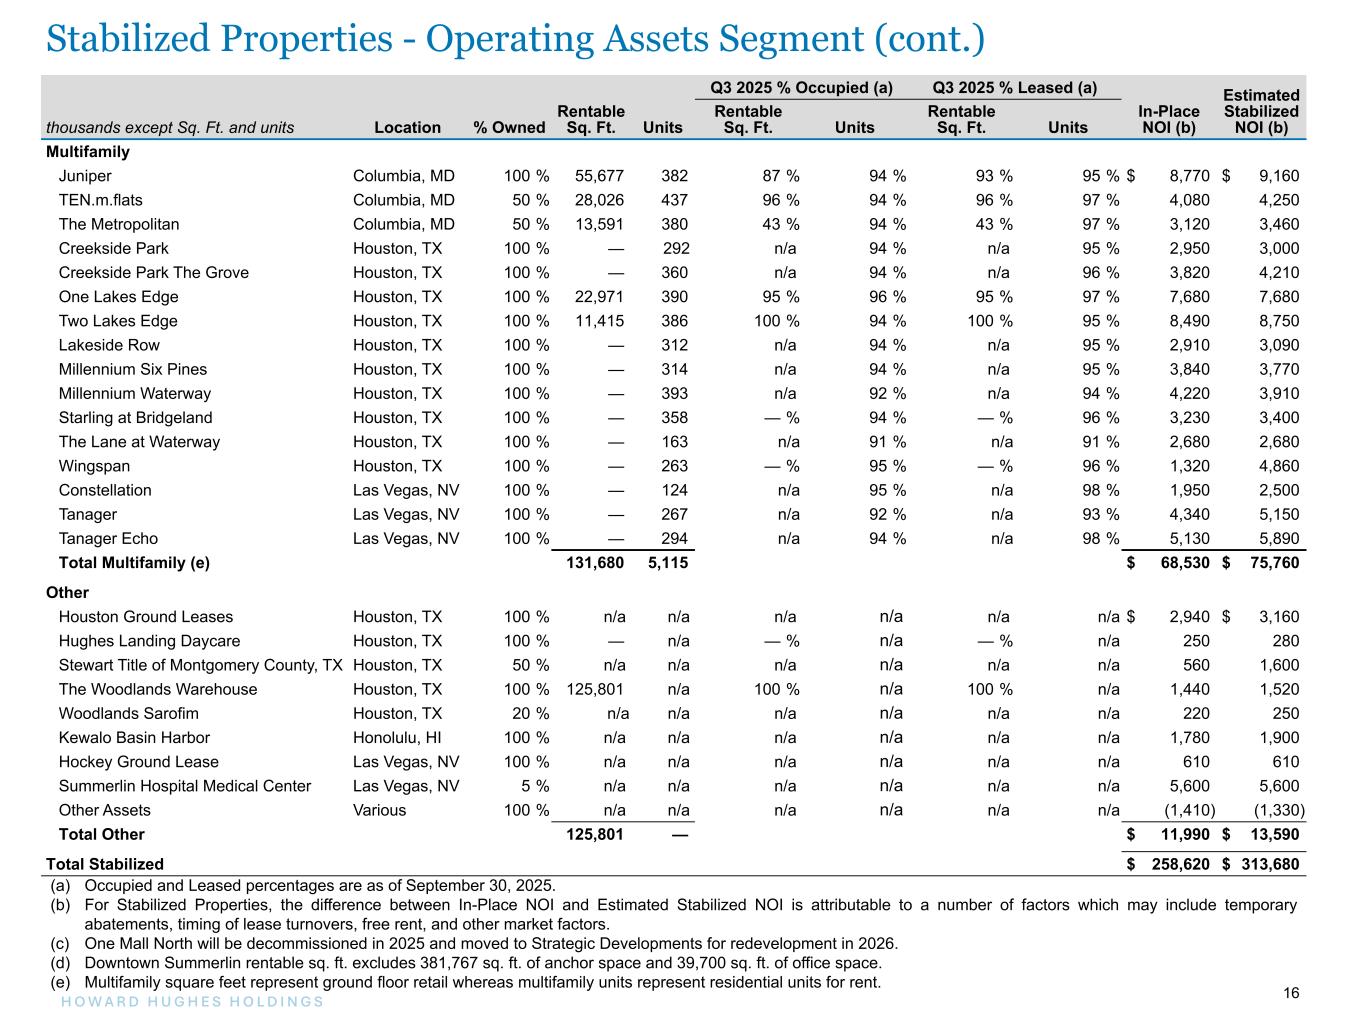
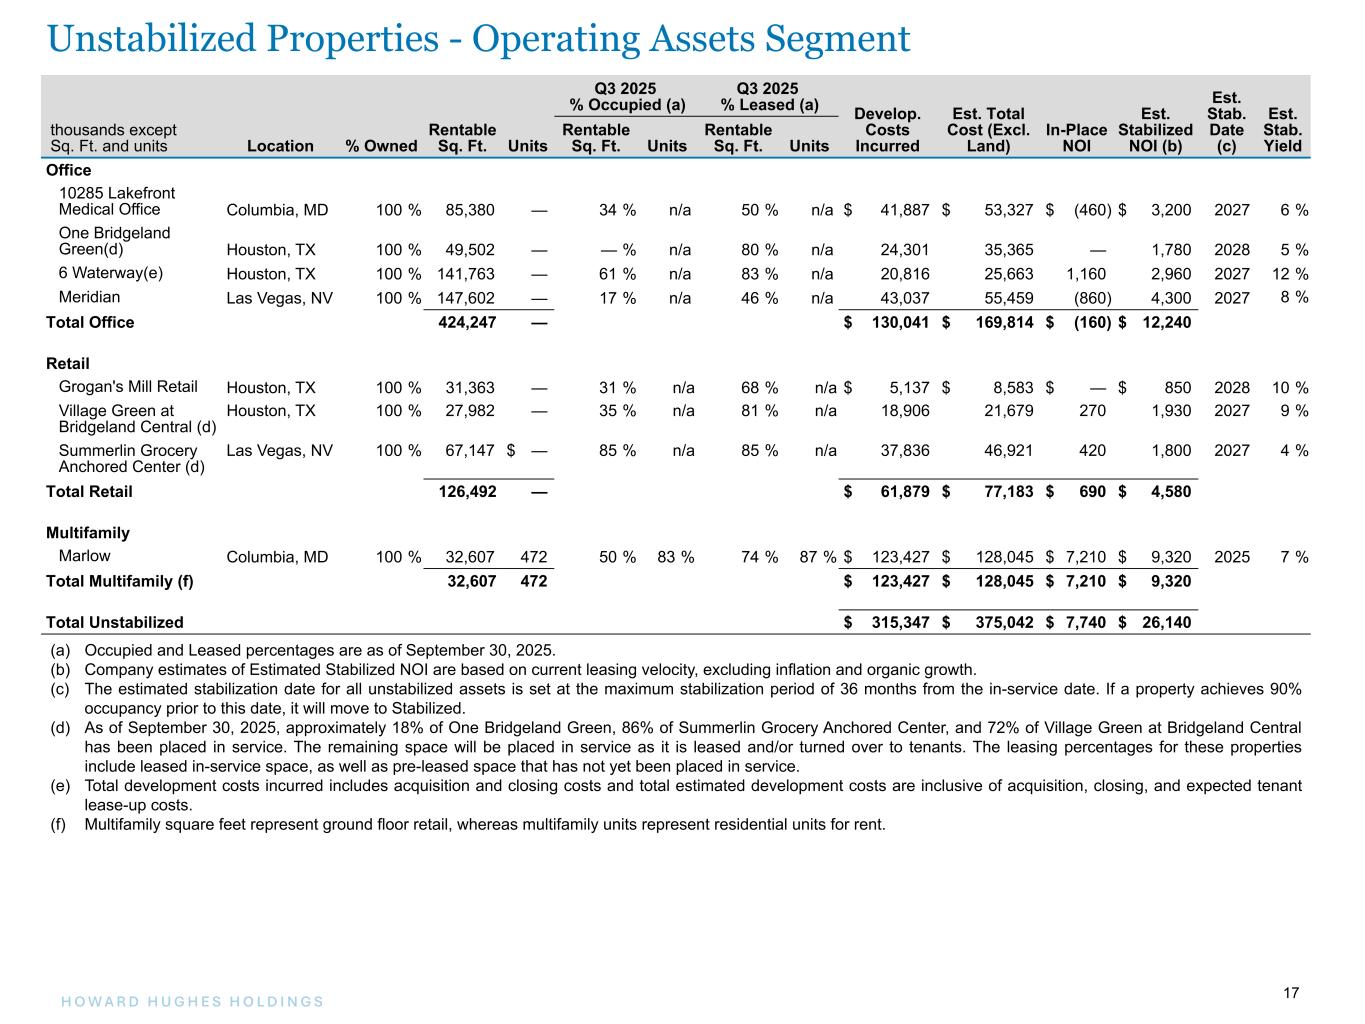
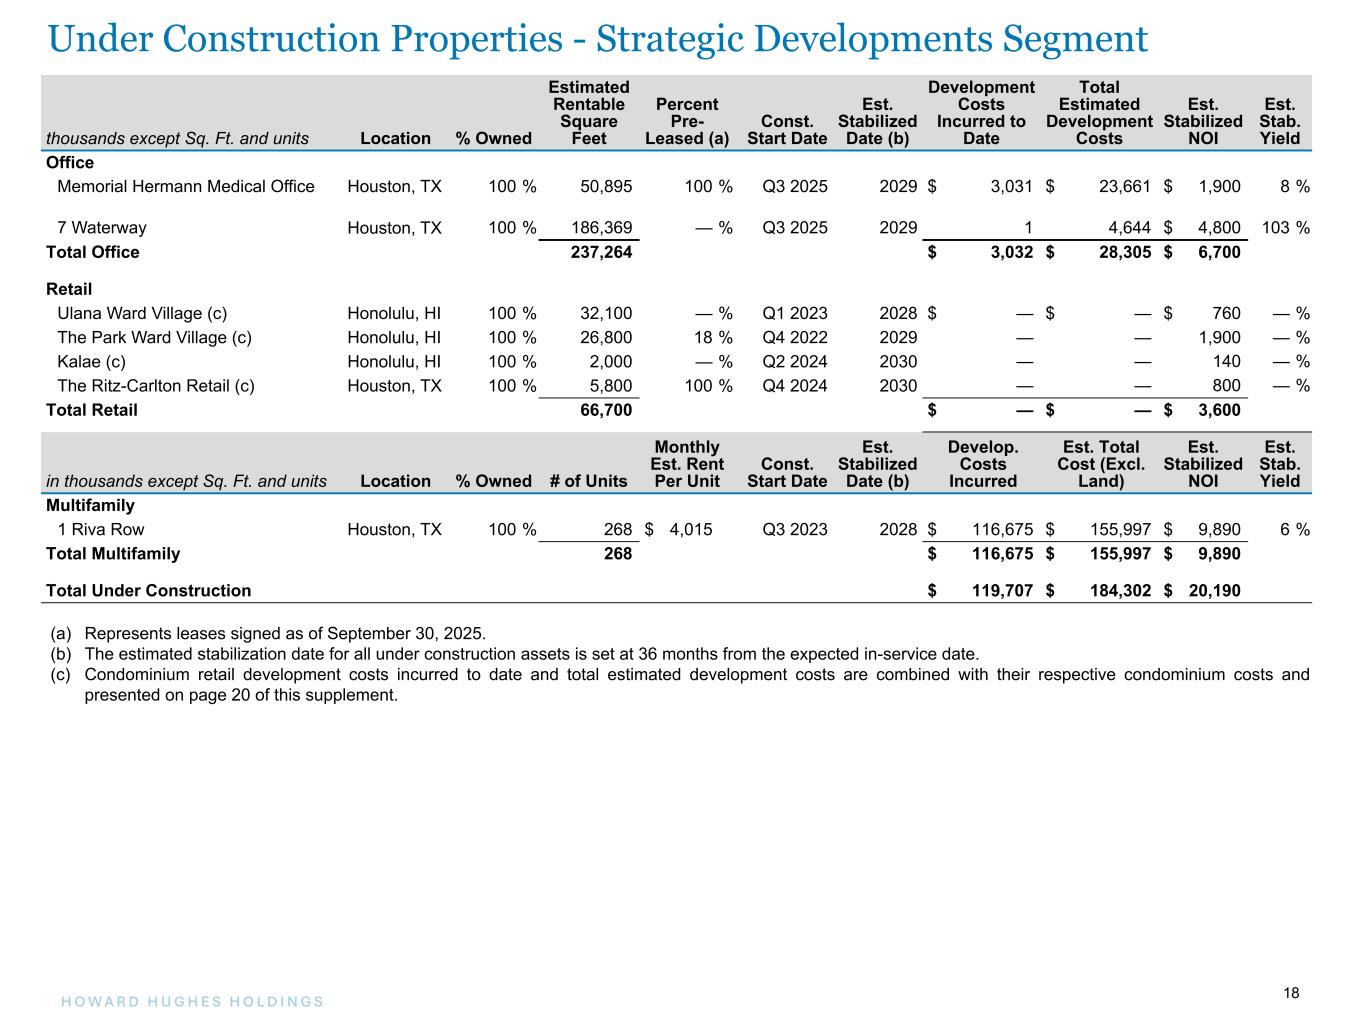
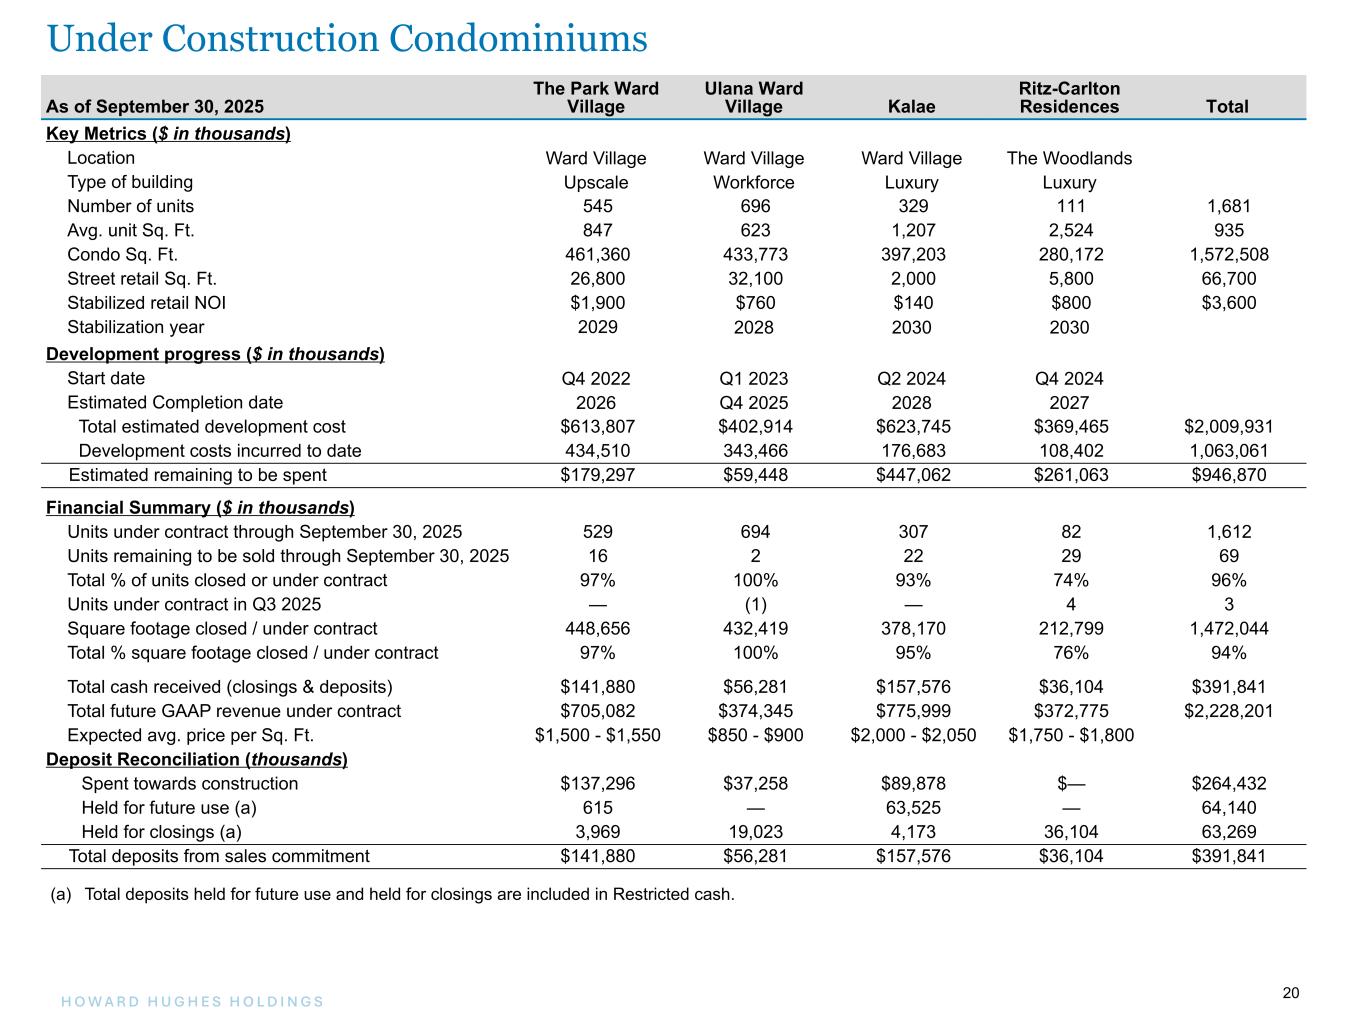
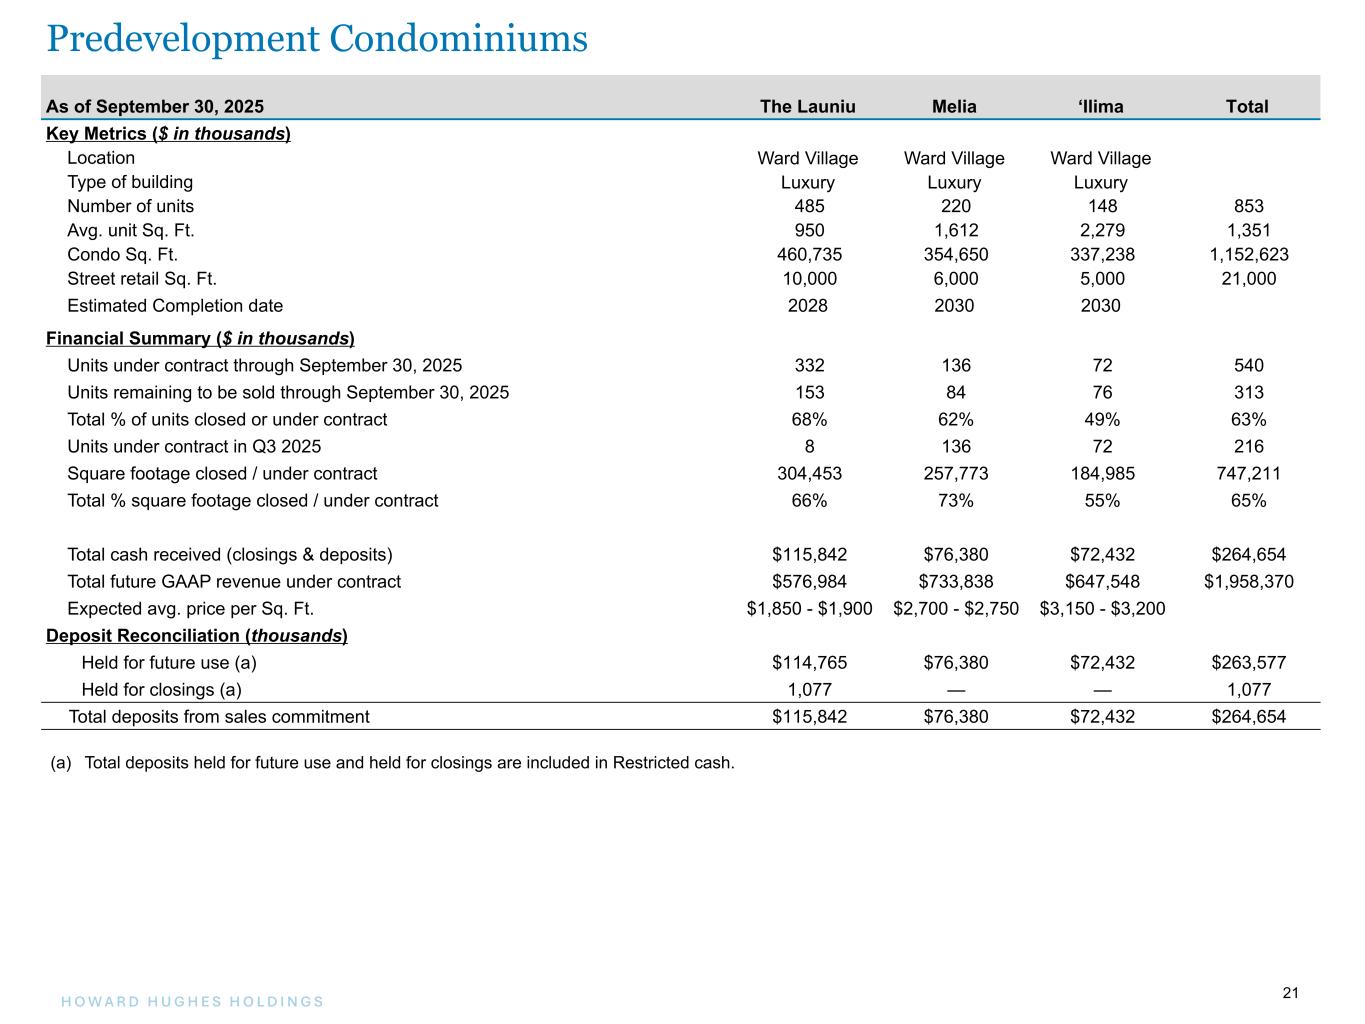
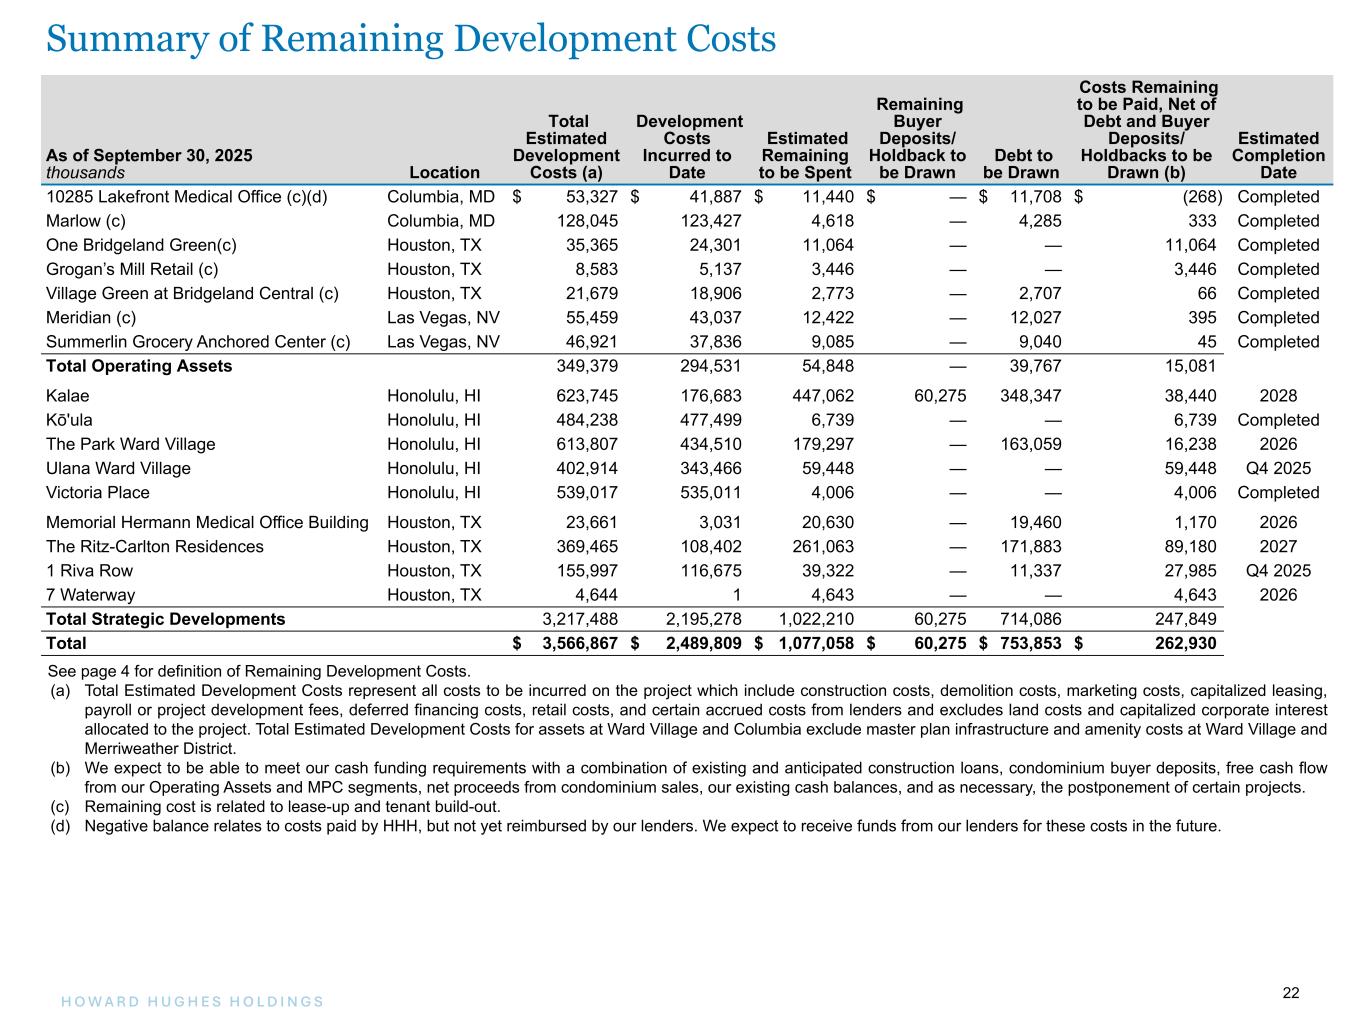
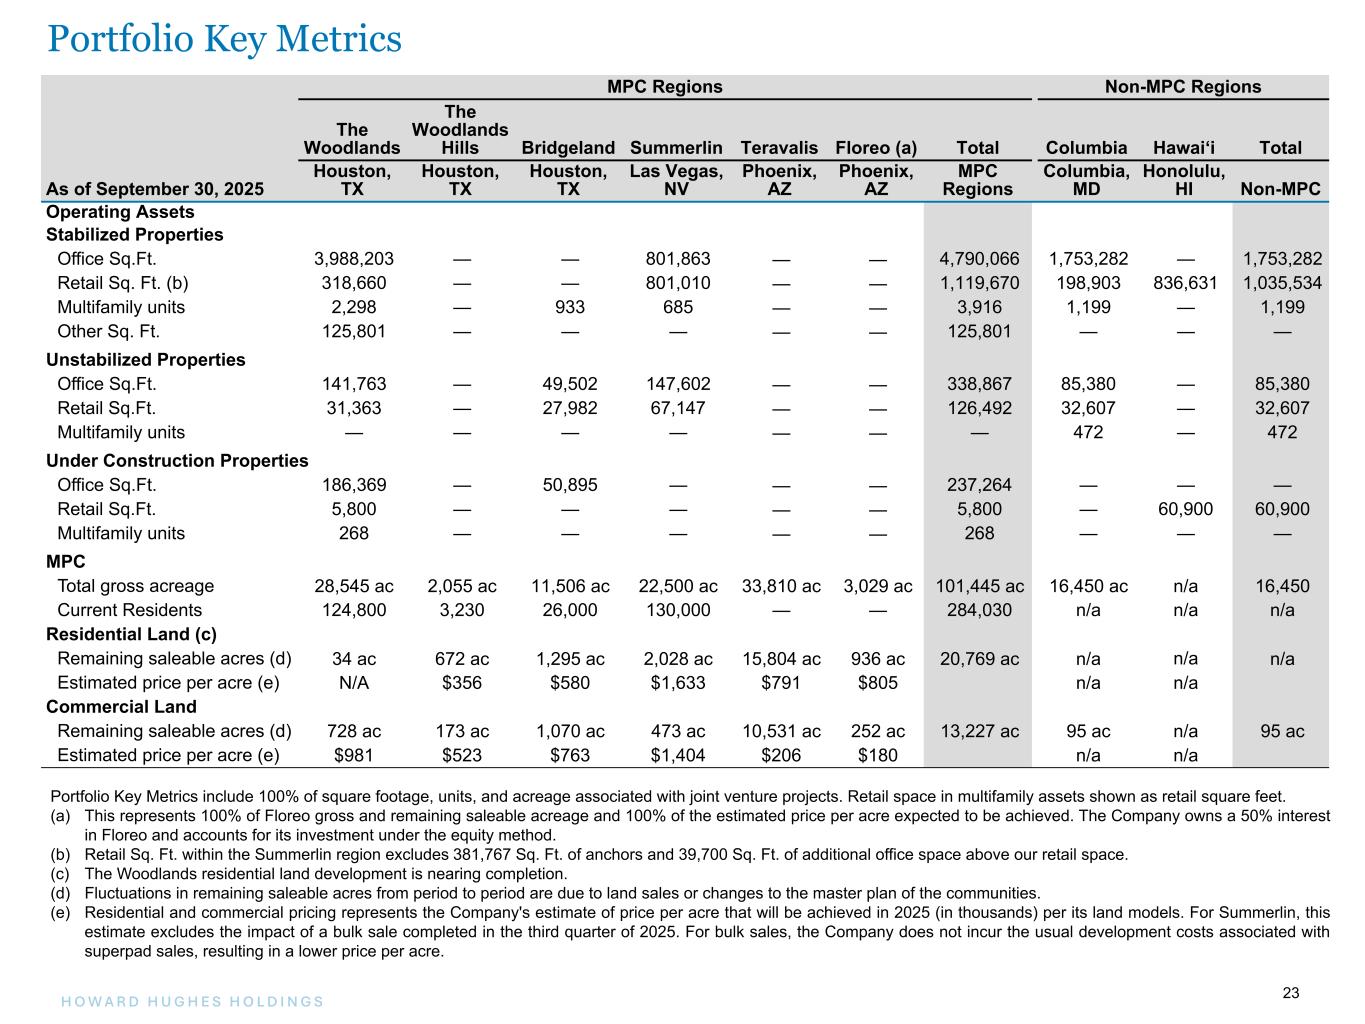
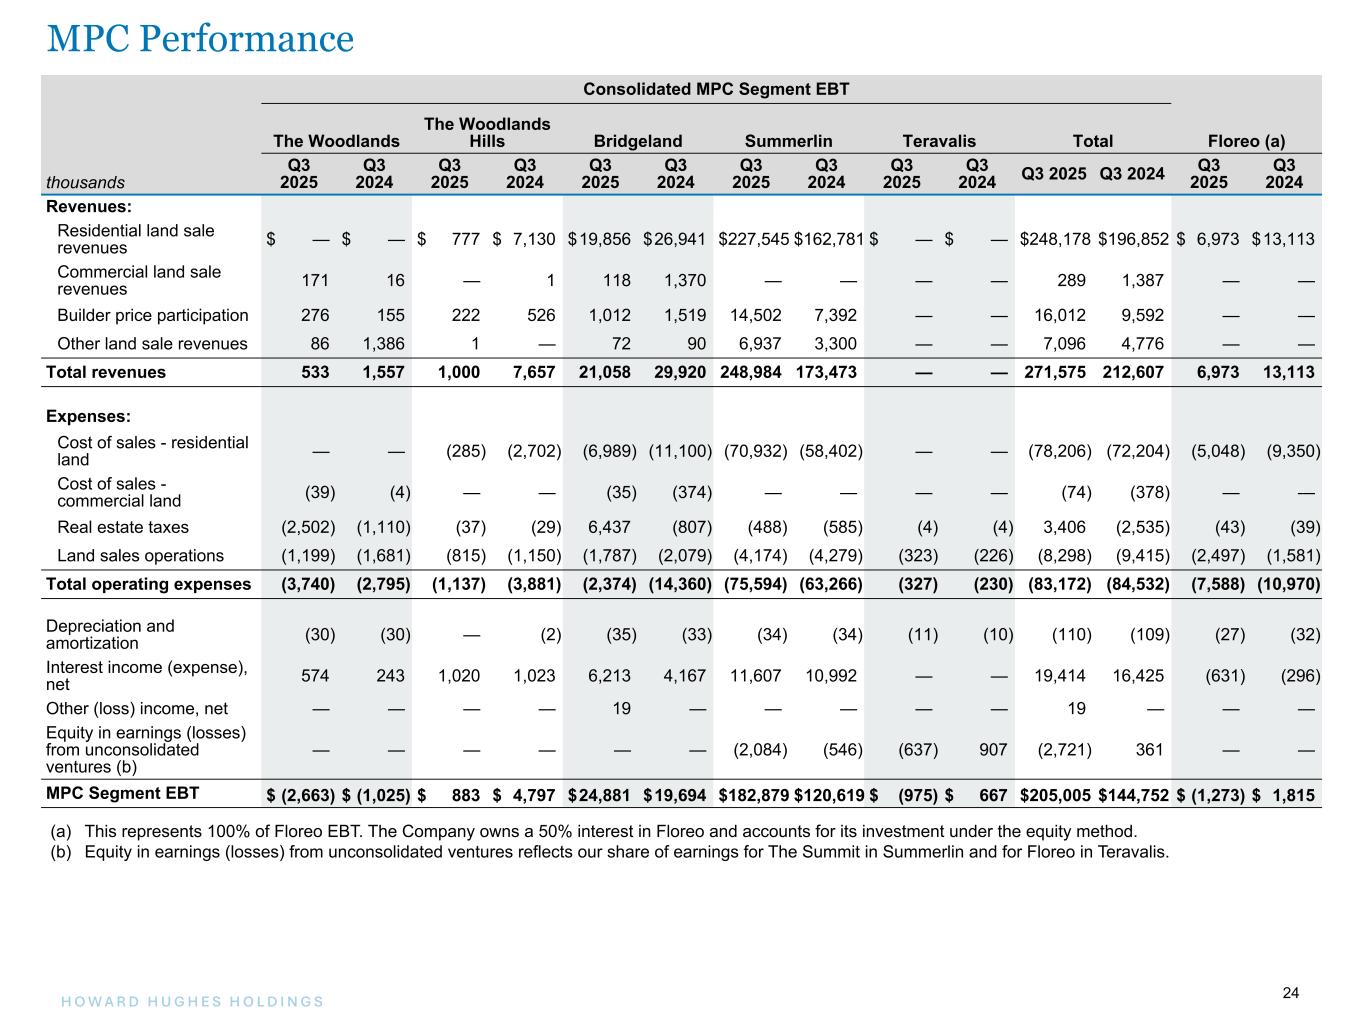
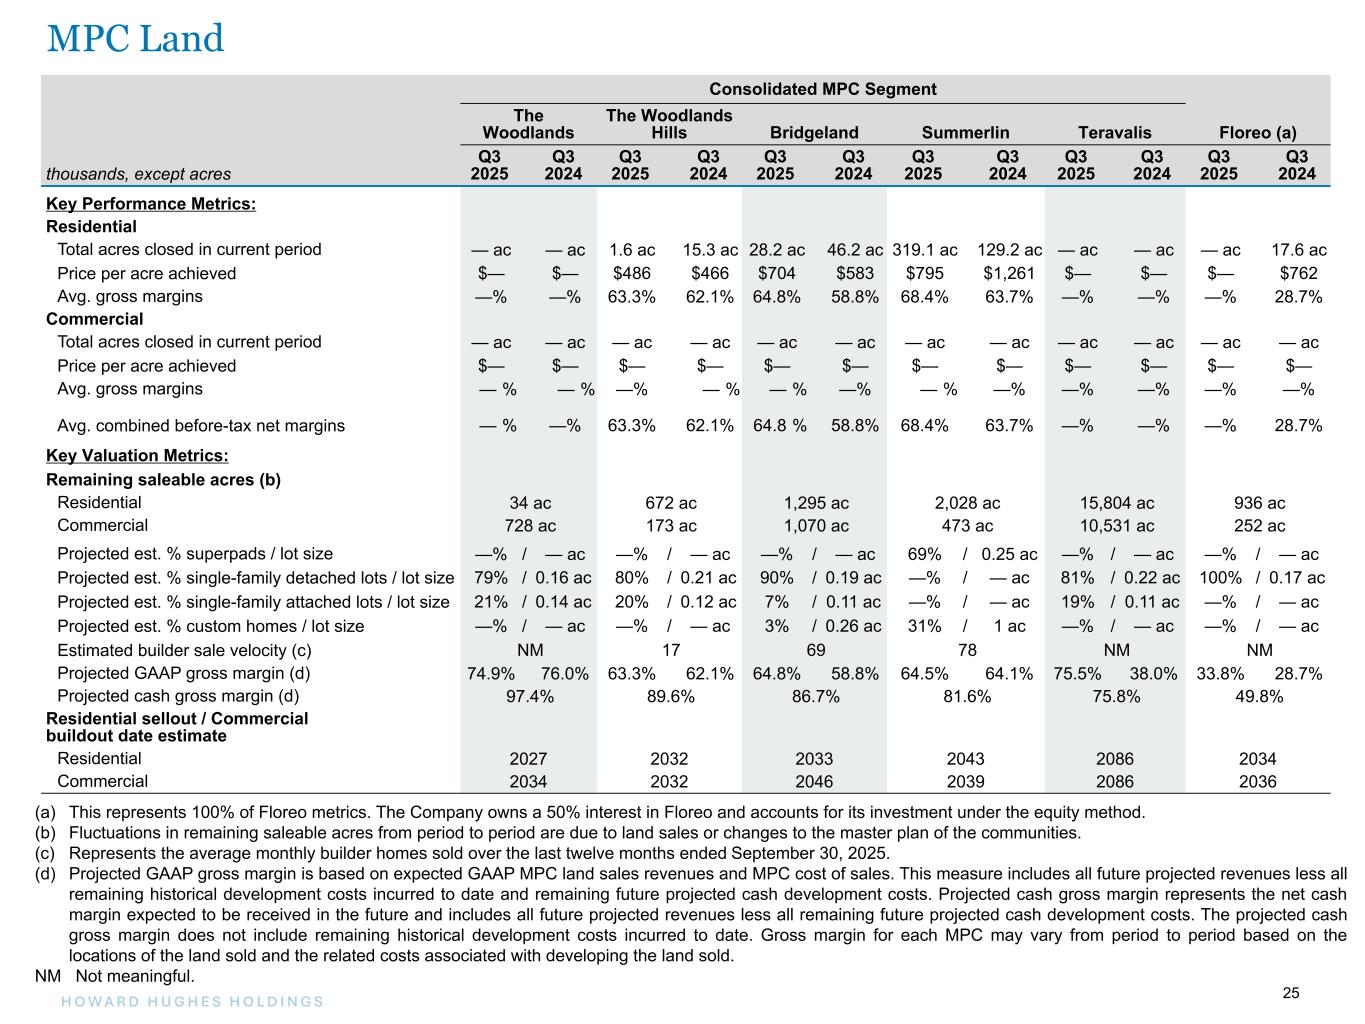
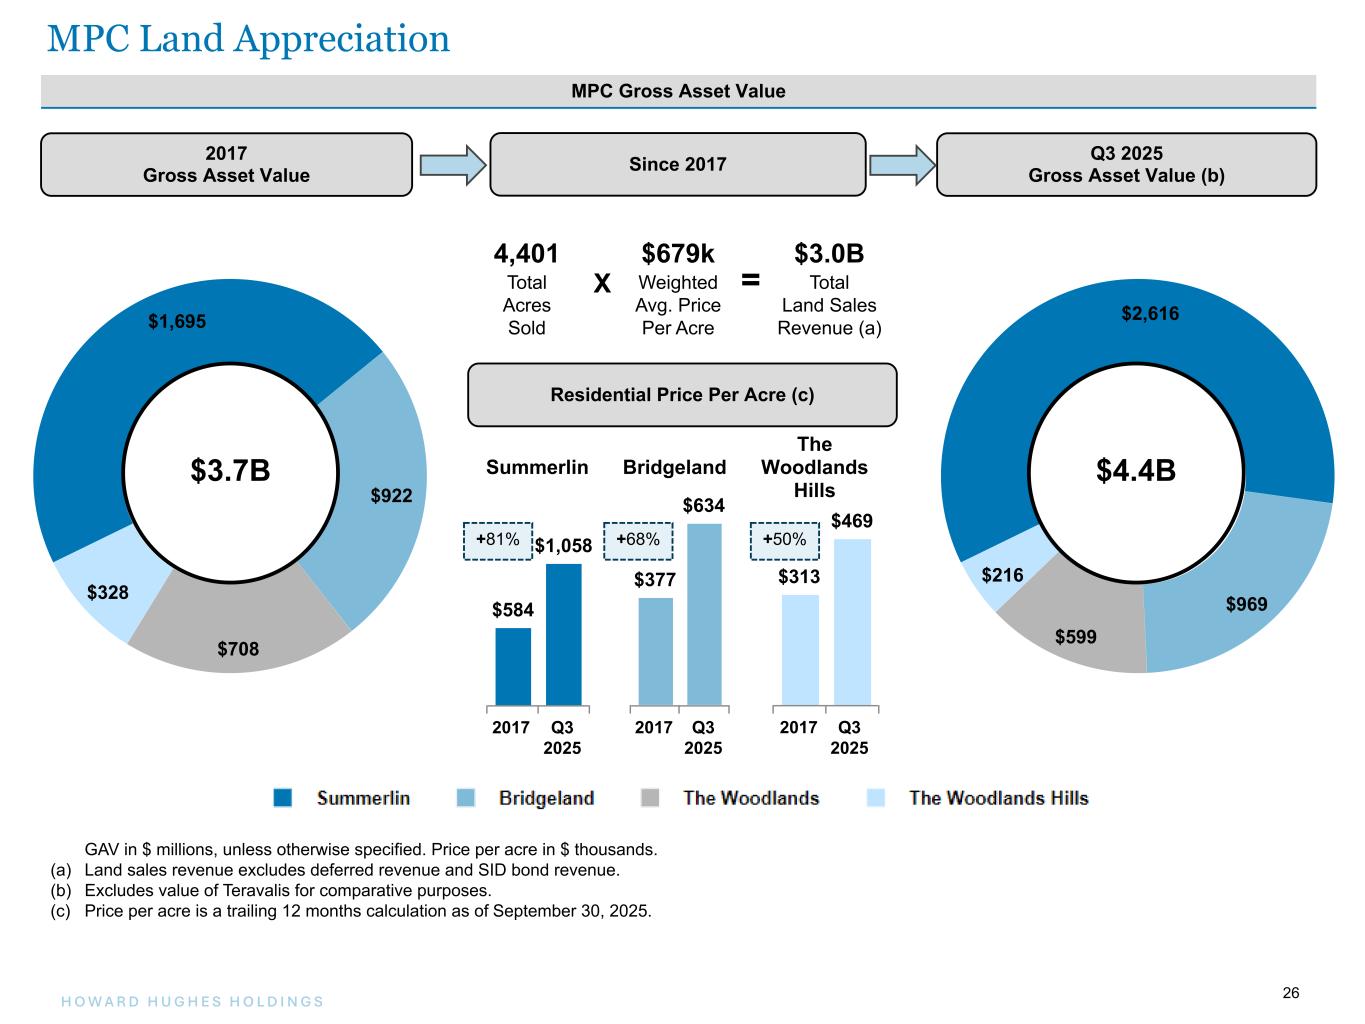
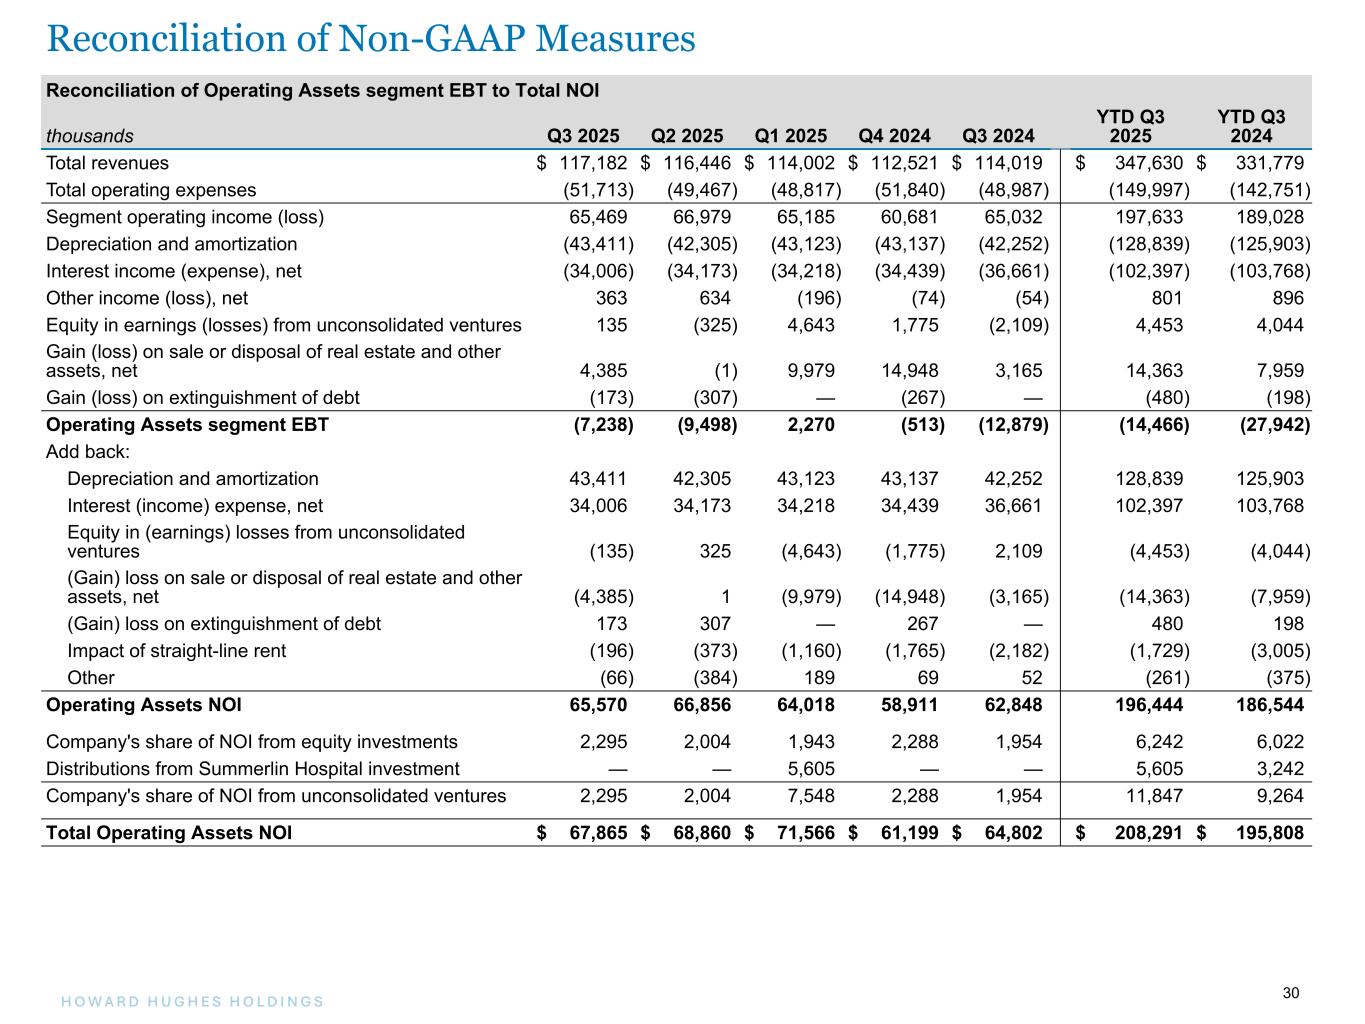
Thanks, Joe, and good morning, everyone. I'm going to start with a quick overview of the quarter and some highlights for Howard Hughes Communities. Carlos will walk through guidance and our cash flow outlook, before handing it over to Bill and Ryan to share updates on our holding company strategy. We delivered another strong quarter across every business segment, underscoring the strength of our real estate platform and the value of our transformation into a diversified holding company. Starting with our MPC segment. We had a record quarter, generating $205 million EBT, driven by strong land sales in Summerlin. We sold 319 acres at roughly $795,000 an acre. That included a single 231-acre bulk sale of raw undeveloped land sold at a 75% margin, but below our average price per acre since it required no upfront infrastructure. Excluding that one transaction, the rest of our land averaged about $1.7 million per acre. We earned more than $14.5 million in builder price participation, reflecting continued home price growth in Summerlin. In Bridgeland, land sales remain steady, and we're gearing up for the grand opening of Teravalis in Phoenix later this month. Model homes are open, builders are active, and momentum is strong at Floreo. While broader national headlines point to slower home sales, we are once again seeing the opposite in our communities, delivering strong results to counter current headlines. Our perpetual cycle of value creation and self-funding model, combined with limited competition continues to give us a major edge. As a result, we expect to finish the year with record high residential land sales, record pricing, and a record full year MPC EBT. Given this performance, we're once again raising our full year MPC guidance. Moving to operating assets. NOI grew 5% year-over-year to $68 million, driven by leasing momentum across the portfolio. Office NOI was up 7%, thanks to strong activity in Colombia and the expiration of some large abatements. We signed 55,000 square feet of new or expanded office leases and the stabilized office portfolio ended the quarter 89% leased. Multifamily NOI grew 2% as new projects in Summerlin and Bridgeland continued leasing ahead of plan. Our stabilized multifamily portfolio is now 96% leased. Retail NOI was up 9% year-over-year, led by great performance at Ward Village and Merriweather District. Our stabilized retail portfolio remains above 90% leased. Turning to strategic developments. We reached a new record with $1.4 billion in condo presales, led by Melia and Ilima, our 12th and 13th towers at Ward Village. Both are off to an incredible start and already collectively 57% presold. The Launiu in Ward Village and the Ritz-Carlton Residences in The Woodlands are now 68% and 74% presold, respectively. Beyond condo sales, we broke ground on the Memorial Hermann Medical Office Building in Bridgeland, the first step in what we expect will become a 1 million square foot medical district. And right after quarter end, we completed 1 Riva Row, a 268-unit luxury multifamily property along The Woodlands Waterway. That project sets a new bar for multifamily living in the area and will meaningfully contribute to NOI once stabilized. What's most exciting is how the cash flow generated across our communities is reinvested right back into value-creating developments. Projects like Ilima and Melia at Ward Village, or 1 Riva Row in The Woodlands, each one is a perfect example of how we recycle capital to grow both future cash flows and long-term net asset value across our portfolio. It's been a busy and rewarding quarter across Howard Hughes Communities, and I couldn't be prouder of how our teams continue to execute. With that, I'll hand it over to Carlos.
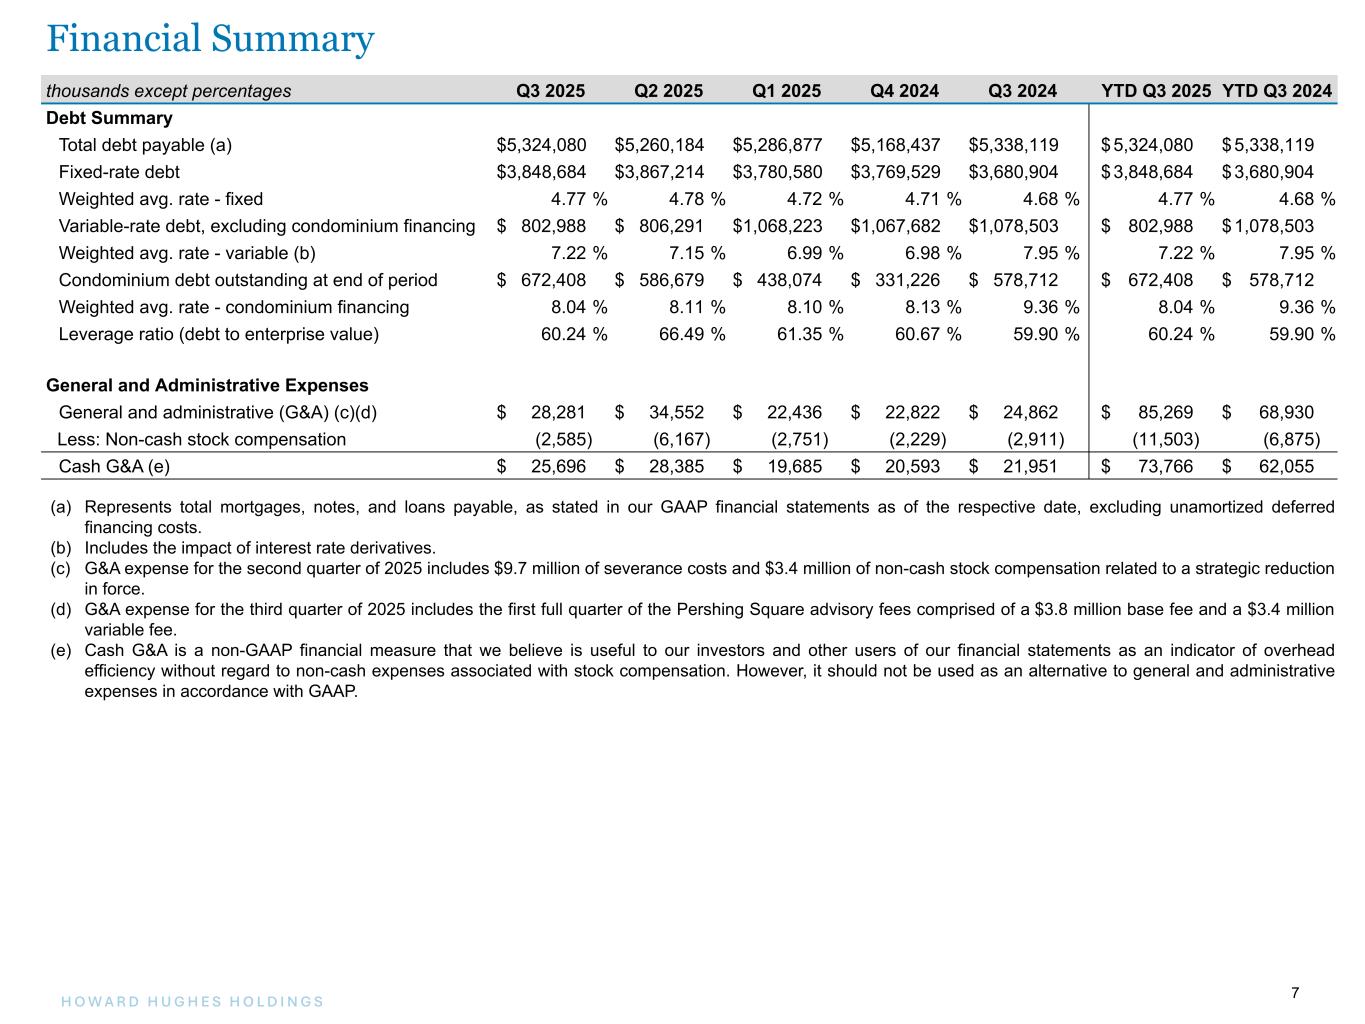
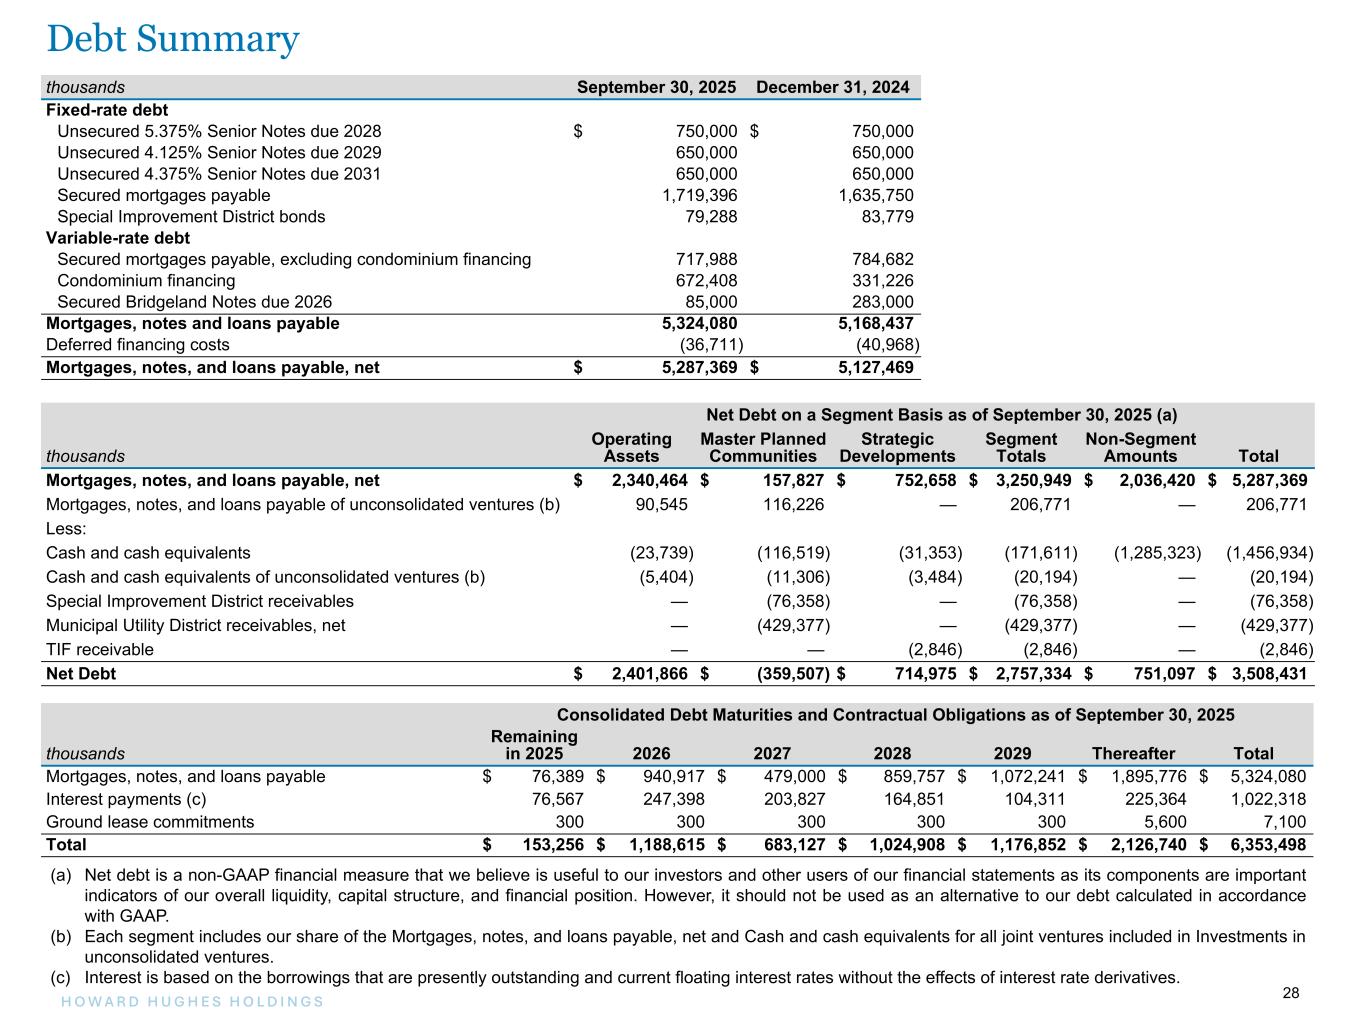
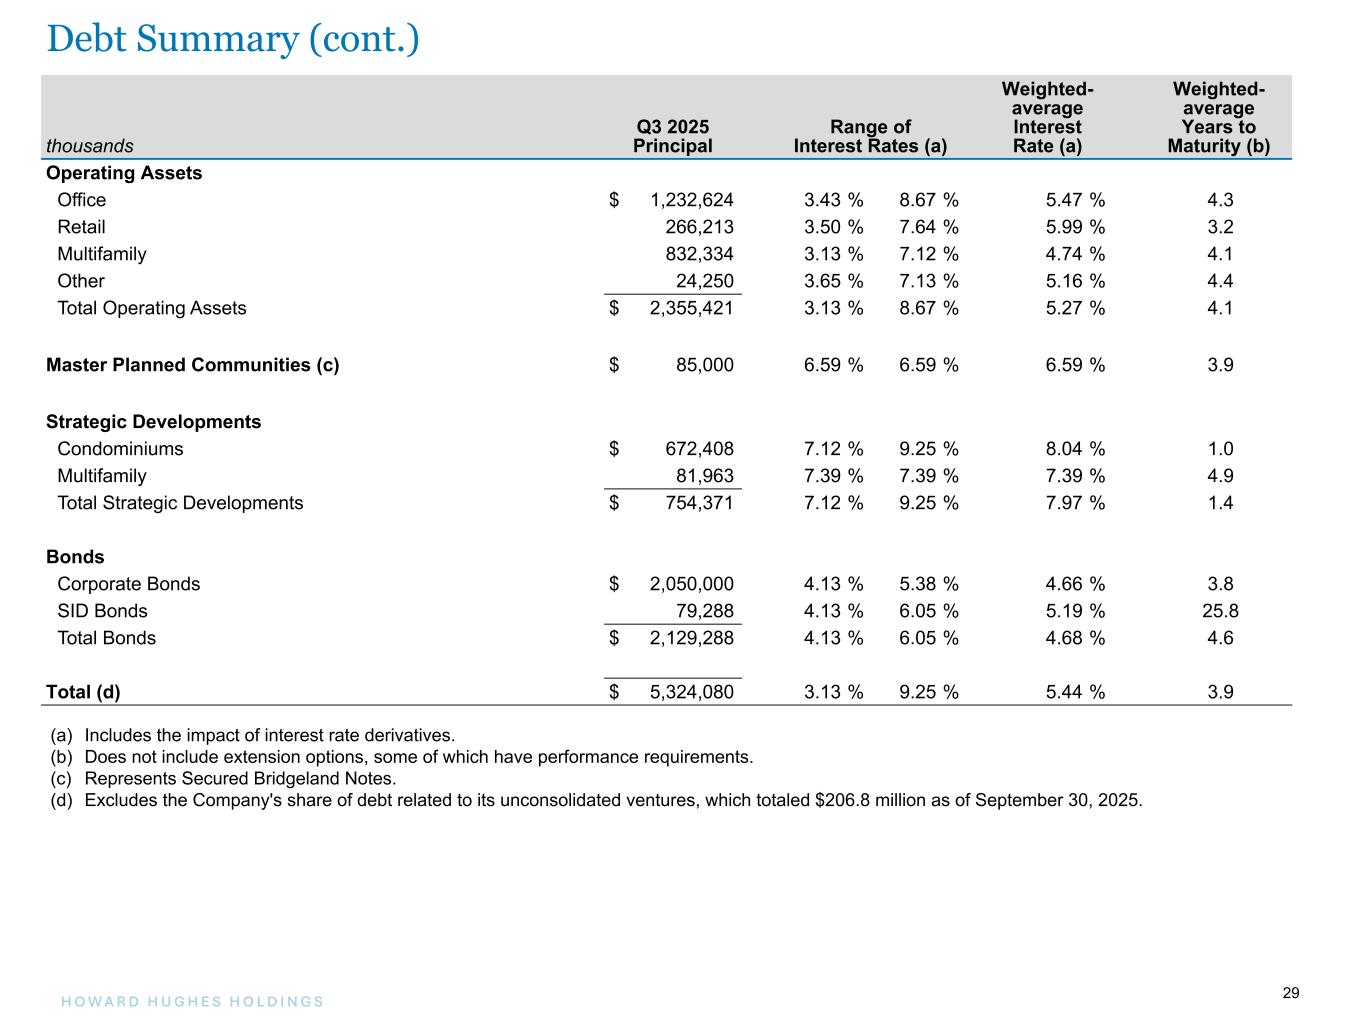
Thanks, David, and good morning, everyone. I'll start with the recent financings, followed by guidance updates and our view on cash flow generation. We refinanced about $114 million of near-term maturities during the quarter, pushing them out into 2026 and beyond, including loans at 3831 Technology Forest, Wingspan, and 6100 Merriweather. As a result, our 2025 maturities are down to just $76 million, which we expect to refinance before the end of the year. Turning to guidance. Strong land sales across our MPCs led us to raise full year EBT guidance to $450 million at the midpoint, up $20 million from prior guidance. 2025 will be another record-breaking year. Now not every year will look like this, but it shows the power of our model when all cylinders are firing. Land sales bring residents, residents drive demand for retail and office, and that demand pushes land values even higher. Operating assets also performed well this quarter, so we're reaffirming full year NOI guidance of $267 million, which is another company record. Our ability to control supply within our MPCs with little to no outside competition continues to be a key advantage. On condos, we're adjusting our full year revenue target slightly down $15 million to $360 million, reflecting a small timing shift for Ulana closings into early 2026. Ulana remains fully sold and is expected to deliver at breakeven. More importantly, our future pipeline is stronger than ever with $1.4 billion of presales this quarter across Melia, Ilima, and the Ritz-Carlton Residence at Woodlands. These projects will generate meaningful cash flows over the next 5 years. On G&A, we're maintaining guidance between $76 million and $86 million with a midpoint of $81 million. That excludes approximately $13 million of anticipated noncash stock compensation, $10 million of severance expenses, and $4 million related to Pershing Square variable advisory fee incurred year-to-date. However, it does include $10 million for Pershing Square's base advisory fee, which we've largely offset through earlier workforce reductions and other cost efficiencies. Finally, given our outperformance, we are raising adjusted operating cash flow guidance to $440 million or $7.86 per diluted share, up $30 million from our prior outlook. What's important is what we do with that cash flow, is reinvested into our communities to generate even greater value. The projects David mentioned from new condominium towers like Melia and Ilima to value creation developments like 1 Riva Row are exactly where that cash goes, driving higher net asset value and future cash flow generation. With that, I'll hand it over to Bill and Ryan.
Speaker 4
Thank you, Carlos. So my update is really an update about our progress in acquiring an insurance company that will become a base really for the transformation of Howard Hughes into a diversified holding company. Good news is that we've made substantial progress. We've identified a target. We've done a significant amount of due diligence. We've done a significant amount of due diligence. We've come to an agreement on price. The seller has begun drafting definitive agreements. We are still deep in the due diligence process. It is possible that something would emerge that would cause us not to go forward. But based on the work we've done to date, I'm actually growing confident that the transaction will be completed. And I would say we may be in a position to announce something as early as end of year or possibly in the first quarter. So we're pleased with that progress. I look forward to sharing more details, but a significant development for the company for sure, assuming we can execute on this transaction. That's really my only announcement. The only other point I would make with respect to what Carlos said, our priority with respect to the cash flows that are generated from our real estate subsidiary are to invest whatever required to continue to build kind of the best places for people to live in the country. The good news is even after that reinvestment of cash into equity to build downtown office buildings, apartments, the next condominium project, we project that Howard Hughes will generate substantially more cash than we can even spend in that division of the business. Over time, that will generate cash that we can flow up to the holding company that will give us more flexibility in building out our diversified holding company strategy. With that, why don't we open it for questions.
Operator
Our first question comes from Anthony Paolone from JPMorgan.
Speaker 5
The first question is about superpad sales, which have been quite successful this quarter. I'm curious about your thoughts on the trade-off between increasing those sales and the net present value of taking the discount without the need for additional infrastructure versus holding onto them, taking them a bit further, and selling more groups of lots instead of superpads.
Tony, thanks for the question. It's David. Look, I think that this was a rare situation where we had a piece of land. And if you remember from the time when you were in Summerlin, it's what we used to call the back bowl. It was due south of the Summit development. It was a particular piece of land that had an unusually high expense of bringing infrastructure to. And in this unique situation, by selling that superpad at a lower net price per acre or lower gross price per acre, but higher net price per acre, we were able to generate great cash flow for the company. In general, going forward, we don't have another parcel like that. So you should expect us to transact on superpads going forward, consistent with the way we have the past several quarters at a much higher gross and net price per acre.
Speaker 5
Okay. Got it. And then just my other question just shifts more over to Bill and thinking about this, the insurance company that you've got teed up. Should we anticipate that like after doing a deal like the one you're contemplating, that uses up the bulk of your sort of capital today? Or do you think you'll have more capacity thereafter to do more deals? And just wondering kind of where this leaves you.
Speaker 4
Sure. We believe that it will utilize the available cash we have injected into the company. The reason we are prioritizing insurance as our first initiative is that it presents an opportunity for us to add substantial value. If we consider the Berkshire Hathaway model, we estimate that around 70% to 80% of the company's value derived from launching an insurance strategy, which allowed for greater flexibility in investments. Historically, Buffett wrote very little risk relative to capital and invested a small portion of assets relative to capital, focusing about two-thirds of those investments in common stocks successfully. The advantage of the insurance business is that it generates a significant amount of cash; you don't need to issue stock for every transaction. You write premiums and collect cash, which you can then invest to earn returns while hopefully profiting on the insurance side as well. By integrating Pershing Square's investment expertise with a skilled management team overseeing a diversified insurance platform, we believe this asset can compound and grow, contributing significantly to the company's long-term growth and our intrinsic value. As our real estate subsidiary generates cash not required for its operations, this will provide us flexibility to invest in other assets over time. However, insurance will clearly be our top priority.
Operator
Our next question comes from Alexander Goldfarb from Piper Sandler.
Speaker 6
So 2 questions. First, David, only 57% presold on the new condos in Hawaii, I'd expect better out of you guys, just kidding. As far as Ward Village goes, where do you stand on the existing entitlements? And meaning how many more can you build? And what is the status on Phase 2? Is that something that you could see approvals for and launch in the next few years or is Phase 2 of Ward Village something that's maybe 5 or 10 years out?
Alex, great question. Look, I would say that we're thrilled with our 57% presale of over $1.4 billion this quarter and see continued momentum as those projects are super unique and on the best remaining development site in the South Shore of Oahu. In terms of the initial entitlements, we had through the master development agreement at Ward Village. Beyond these 2 towers, Melia and Ilima, there is one more site that will use the remaining square feet. Beyond that, we do have approval for incremental square feet, and that incremental square feet could be between $2 million and $4 million depending on the zoning upsizes we get by reinvesting into the community. So we're already well underway in predevelopment of incremental towers in addition to what we had by right under our original master development agreement.
Speaker 6
Okay. That's helpful. And then, Bill, following up on Anthony's question. I realize, obviously, there's a lot of confidentiality, but just big picture, can you just give us some color? Is this pure B2B, as you described before? And is everything in this entity clean? Or are there businesses that you'd want to exit or any legacy policies or legacy lines that need to be settled or anything like that?
Speaker 4
I would say it's a very clean transaction for us. It's a platform, a diversified insurance company platform that really fits the criteria we've outlined. There are no business lines that we need to exit, and it's not a consumer-facing insurer.
Speaker 6
And can you indicate whether it's domestic or Bermuda or somewhere offshore?
Speaker 4
I would say it's a combination of many insurers operating both as a domestic practice and an offshore practice.
Operator
Our next question comes from the line of Jon Petersen from Jefferies. Look, I would say it's a very clean transaction for us. It's a platform, a diversified insurance company platform that really fits our outlined criteria. There are no business lines we need to exit, and it's not a consumer-facing insurer. Could you indicate whether it's domestic or Bermuda or somewhere offshore? I would say it's both, as many insurers operate with a domestic practice and an offshore practice.
Speaker 7
Curious if you could maybe just give us a little more commentary on the Ritz-Carlton Residences at The Woodlands and how that is trending relative to your initial underwriting and then opportunities for other condo projects across the portfolio? Clearly, Ward Village has been a big success and your kind of translating that over to The Woodlands. But where else might we see future condo projects across your portfolio?
Speaker 4
I'll take the first part of your question. So this has been a bit of a tussle between me and David O'Reilly in the sense that the team designed an absolutely spectacular project, first of its kind in The Woodlands. And I took a look at this project, and I said, we're giving it away at these prices. And I said, you know what, the community just needs to see this thing built before. So you know what, don't sell any more than half the units. That was our deal, and then I stepped off as Chair of the Board. And unbeknown to me, David has been sneaking out a few units because he achieved prices that he just felt he obligated to sell. That's really the answer.
But we're hitting record prices.
Speaker 4
Yes, David has continued to emphasize the tremendous value of this project. For buyers in the market, I compare it to the quality seen in premier properties like 220 Century Park South, a Robert Stern design in New York City, which fetched very high premiums. This building is similar, being the first condominium in The Woodlands. We have decided to be careful in how we sell the units. We could have sold the entire project in presales, but in Hawaii, where we have established reputation for quality, the strategy is to sell almost all units before even starting construction. However, given that this is a unique project in The Woodlands, we believe it’s better to sell the units gradually until the project opens. I hope David will hold back some units so we can demonstrate the potential sales once people see the finished product.
No doubt. We're about 75% sold now. We have a little over a year before we're ready to welcome our first residents into those units. And we're optimistic that the remaining units that we're holding back right now will be able to sell upon completion when people can see, touch, and feel the incredible quality that we're going to deliver. To the second half of your question, John, there are a couple of sites in addition to the Ritz-Carlton site for future condo projects in The Woodlands, and we're evaluating those in real-time, determining where we think deep demand will be, what price per foot that is, what size of units are, etc. And we're also evaluating a couple of sites in and around Summerlin, where we could leverage the expertise and skill of our team in Ward Village across the rest of our portfolio to deliver great cash flow results for the company.
Speaker 7
Okay. All right. That's very helpful. And then maybe I think...
Speaker 4
I got a question for David. What's the spread in price per square foot we've achieved on the later sold units versus the first sold units in the Woodlands? How much of the price per square foot has gone up on a kind of comparable unit?
One of the challenging parts with the Bob Stern design is that there are very few comparable units. Generally, from our initial sales to where we are today, we've seen prices around $350 to $400 a foot.
Speaker 4
And the average sale price now is what per square foot?
Speaker 4
That's just a precise number. You understand the point. This is the kind of asset that I believe can generate the maximum profit. We're not like a typical developer that needs to sell all the units before obtaining a construction loan. Therefore, we can be strategic about the sales pace to maximize the net present value of the project.
Speaker 7
Okay. All right. That makes sense. And then at Teravalis, I was in the Phoenix Airport recently, saw you guys have some advertisements up there to attract people out to that community. Just curious, I mean, just remind me, like what should we be expecting in terms of MPC land sales maybe in 2026 or maybe if you want to give me a multiyear outlook? Just remind me on where you guys are at on rolling that out.
Yes, absolutely. So we're in a great spot right now. We've sold about 1,000 lots year-to-date in Teravalis, and that will be enough to keep us busy for the near-term future. I think you may be able to see us sell some incremental lots in 2026, but 2027 will probably be a year where we re-up after those lots that we sold this year end up in the hands of residents and homebuyers. We're excited this Friday. We have our official grand opening at Teravalis. We've already sold our first few lots to different residents that will be constructing their homes right now. And we're incredibly excited with the progress that we've seen and how fast those communities come together.
Operator
Our next question comes from the line of Alexander Goldfarb from Piper Sandler.
Speaker 6
David, I realize that it's not the fourth quarter and we have to hold off on guidance, but still, the pace of your increases, especially in the land business has been pretty incredible this year. Is there something sort of a ballpark? I think you're tracking $440 million at the midpoint for '25. Is there something that we should be thinking of for '26? So either, one, we don't get too far ahead of ourselves or maybe the pace that you've delivered this year is sort of a new run rate; is something sustainable?
Alex, I think it is pretty early right now to feel comfortable providing any sort of guidance on 2026 land sales. I think that 2025 has been remarkable. We've raised guidance twice. Clearly, we didn't expect to see this strength when we gave guidance a little bit less than a year ago. I think that at this point, I would not advise anyone to extrapolate this year's results into growing further into the future. I think we're going to take it quarter-by-quarter. We're going to see how many homes we sell in our communities, and we're going to sell just enough land to keep up with that at the highest price per acre we possibly can.
Speaker 4
But it's not going to hurt if rates come down, obviously, continue to come down.
No, I think that we've achieved these results given the quality of our community as people chase higher quality of life, shorter commutes, more connectivity in nature into these master planned communities. Higher rates.
Speaker 4
The more like New York and California move socialist, more people want to go to capitalist states like Texas and Las Vegas.
Speaker 6
units has been strong.
I would tell you that we are selling land to the homebuilders only to keep up with underlying home sales in our communities, and that strategy won't change. We try to keep them at an appropriate supply, which I would argue is between 12 and 18 months of finished lots or vacant developed lots. They're a little bit undersupplied right now. But we like to be a little bit undersupplied than a little bit oversupplied when we have the opportunity.
Operator
Thank you. At this time, I would now like to turn the conference back over to David O'Reilly for closing remarks.
I want to thank everyone again for joining us today. As always, if there's any follow-up or any questions, we weren't able to get to, we are always available and look forward to seeing you all soon. Thank you.
Speaker 4
Thanks so much. Bye-bye.
Operator
This concludes today's conference call. Thank you for participating. You may now disconnect.