Operator
Hello and welcome to Kane Anderson BDC Inc.'s first quarter 2026 earnings call. All lines are in a listen-only mode. After the speaker's remarks, we'll conduct a question and answer session. To ask a question at this time, you'll need to press star followed by the number one on your telephone keypad. As a reminder, this conference is being recorded. It is now my pleasure to turn the conference over to Andy Wedderburn-Maxwell, Senior Vice President.
Good morning, and welcome to Kane Anderson, BDC Inc.'s first quarter 2026 earnings call. Today, I'm joined by Doug Goodwillie and Ken Leonard, co-CEOs of KBDC, Frank Carl, President, and Terry Hart, CFO. Following our prepared remarks, we will be available to take your questions. Today's call may include forward-looking statements. Such statements involve known and unknown risks, uncertainties, and other factors, and undue reliance should not be placed thereon. These forward-looking statements are not historical facts, but rather are based on current expectations, estimates, and projections about the company, our current and prospective portfolio investments, our industry, our beliefs and opinions, and our assumptions. These statements are not guarantees of future performance and are subject to risks, uncertainties, and other factors, some of which are beyond our control and difficult to predict. Actual results may differ materially from those expressed or forecasted in the forward-looking statements. We ask that you refer to the company's most recent filings with the SEC for important risk factors. Any forward-looking statements made today do not guarantee future performance, and undue reliance should not be placed on them. The company assumes no obligation to update any forward-looking statements at any time. Our earnings release, 10Q, and supplemental earnings presentation are available on the financial section of our website at canebdc.com. Now I'd like to turn the call over to Doug Goodwillie.
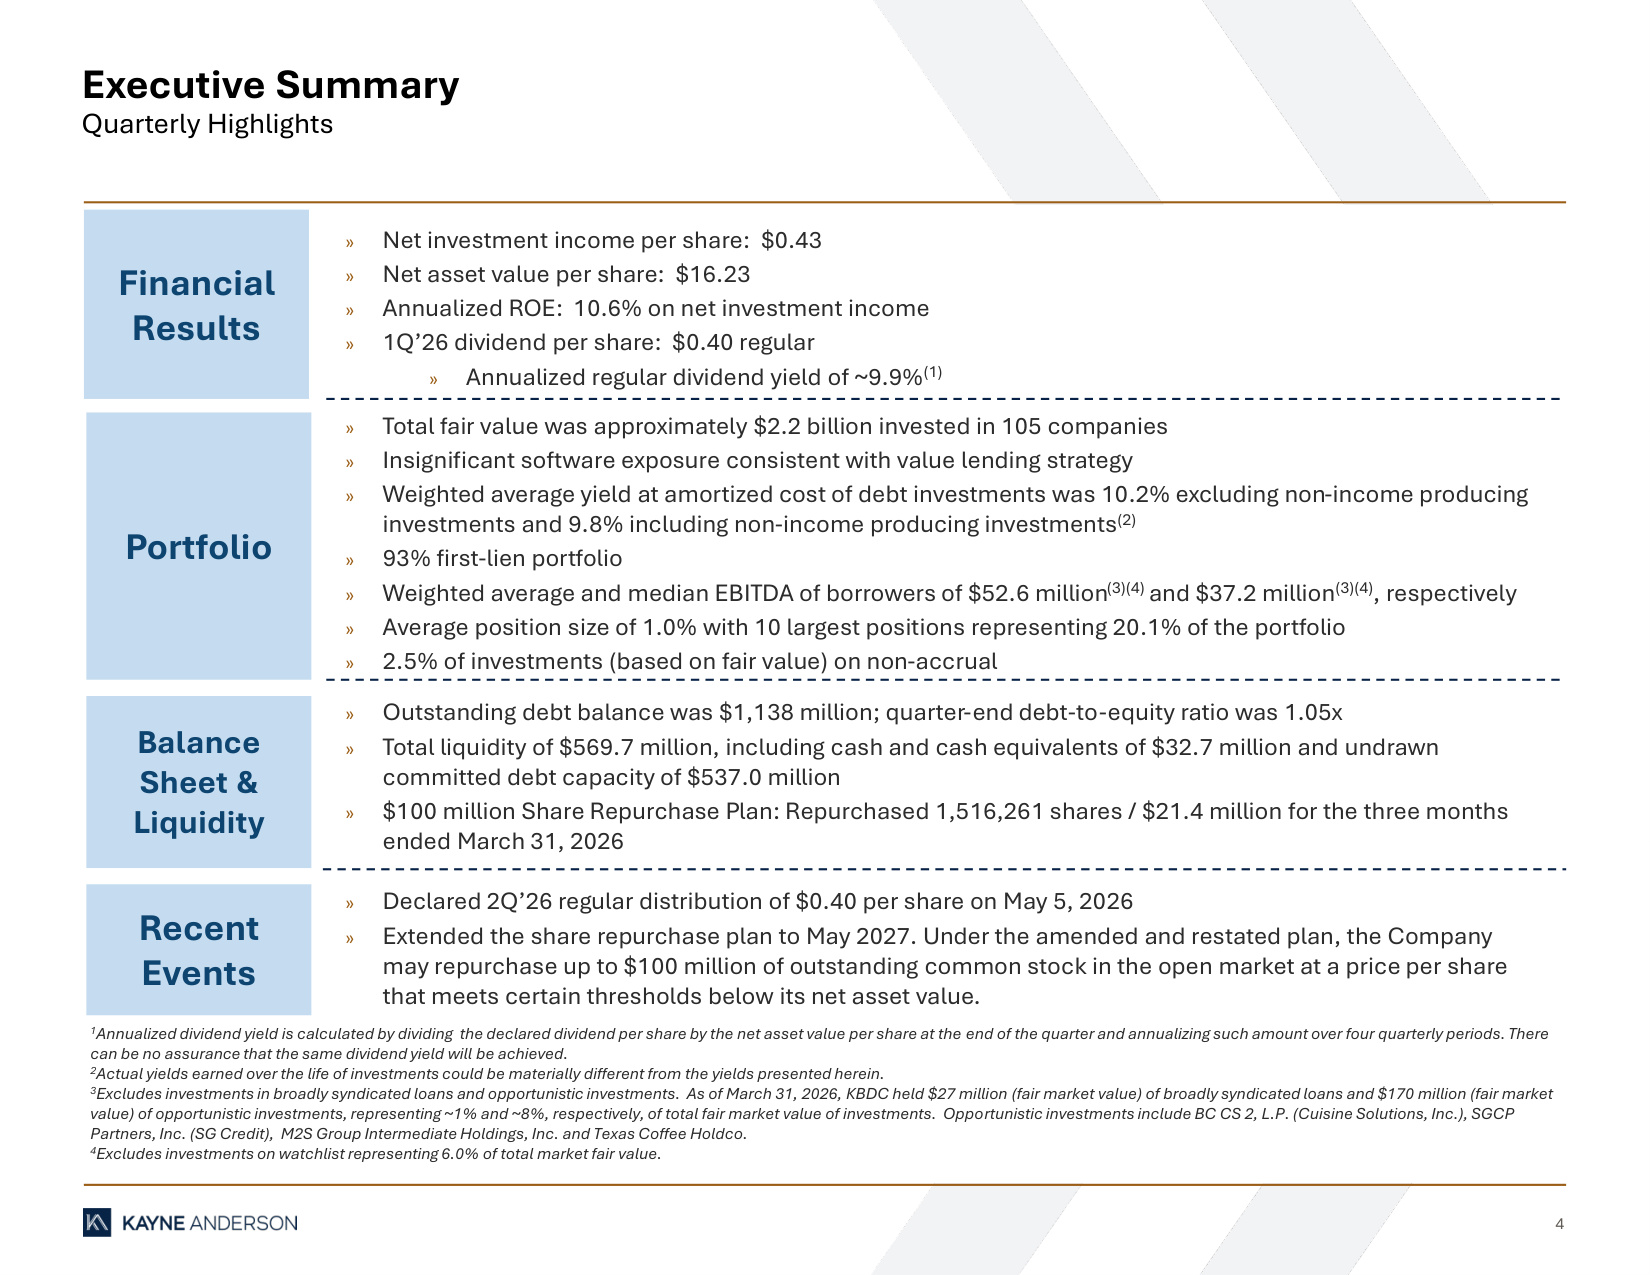
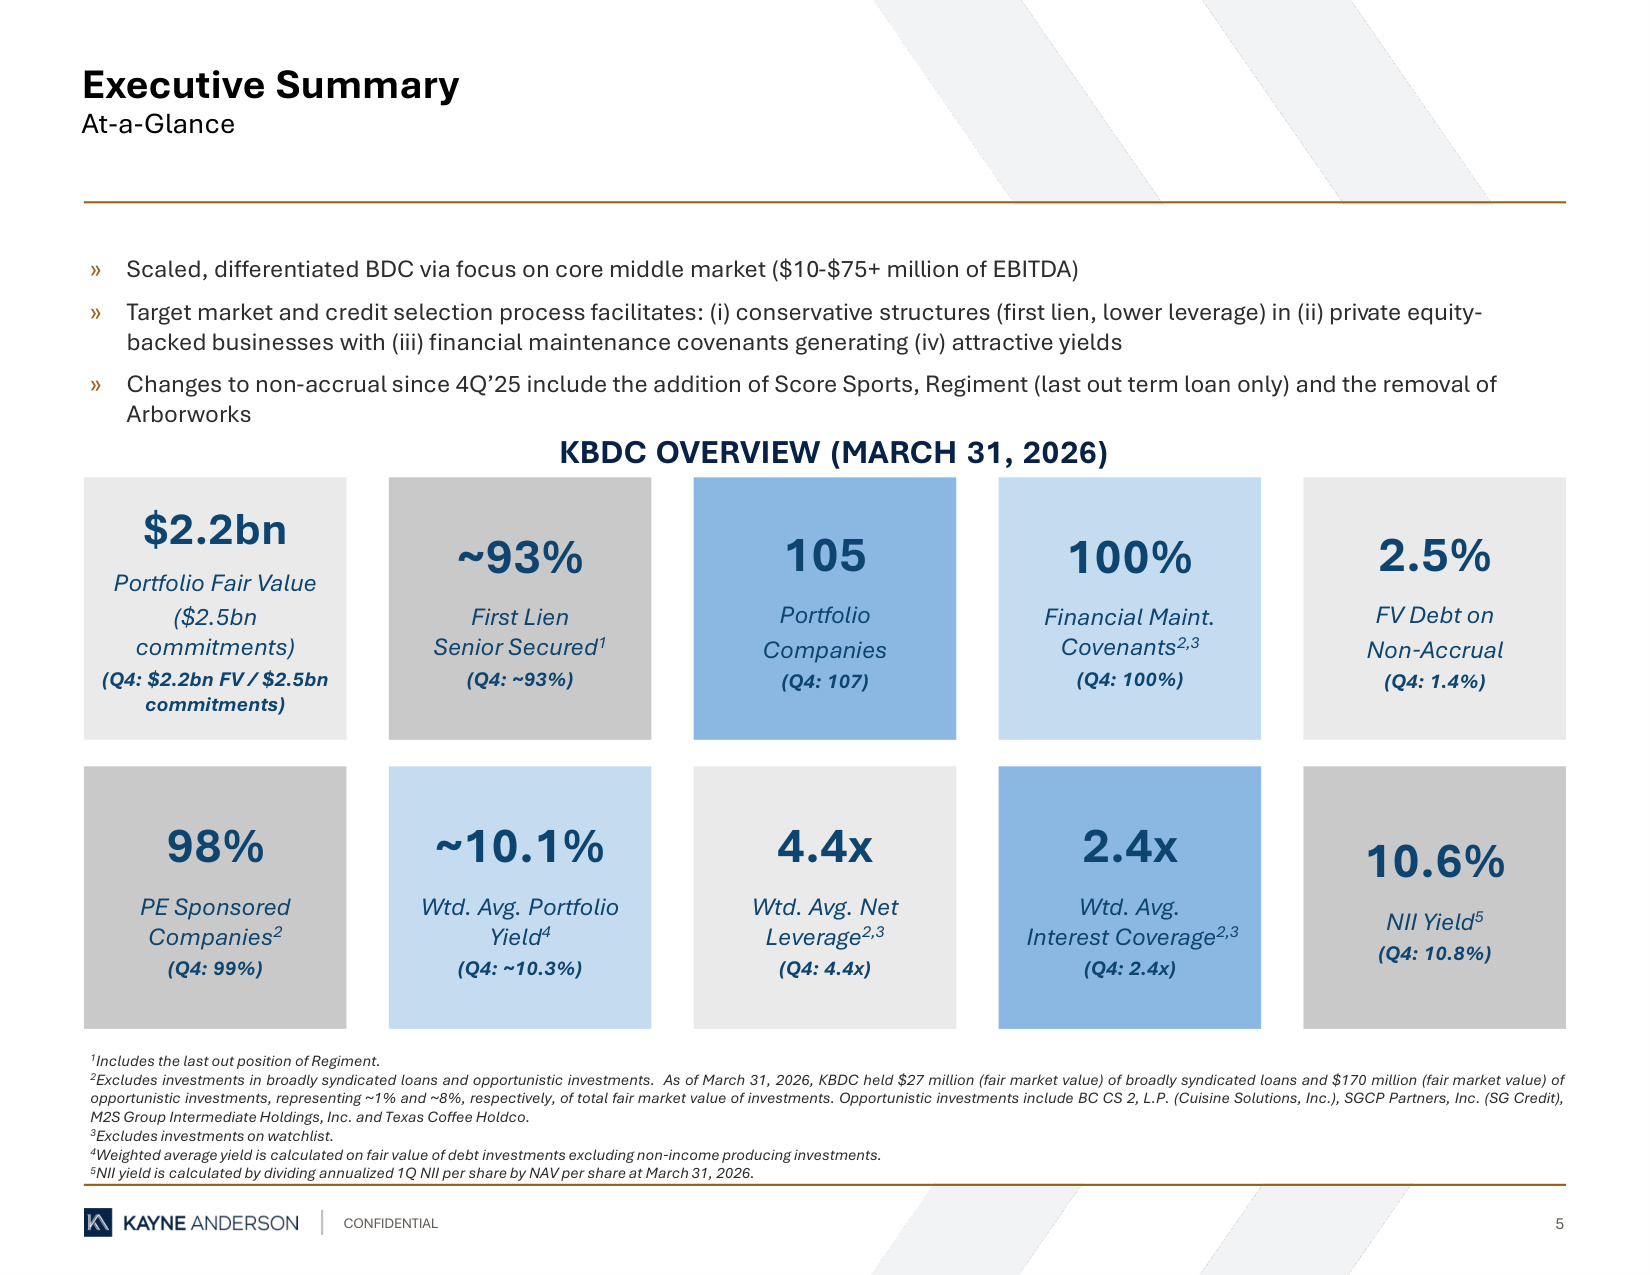
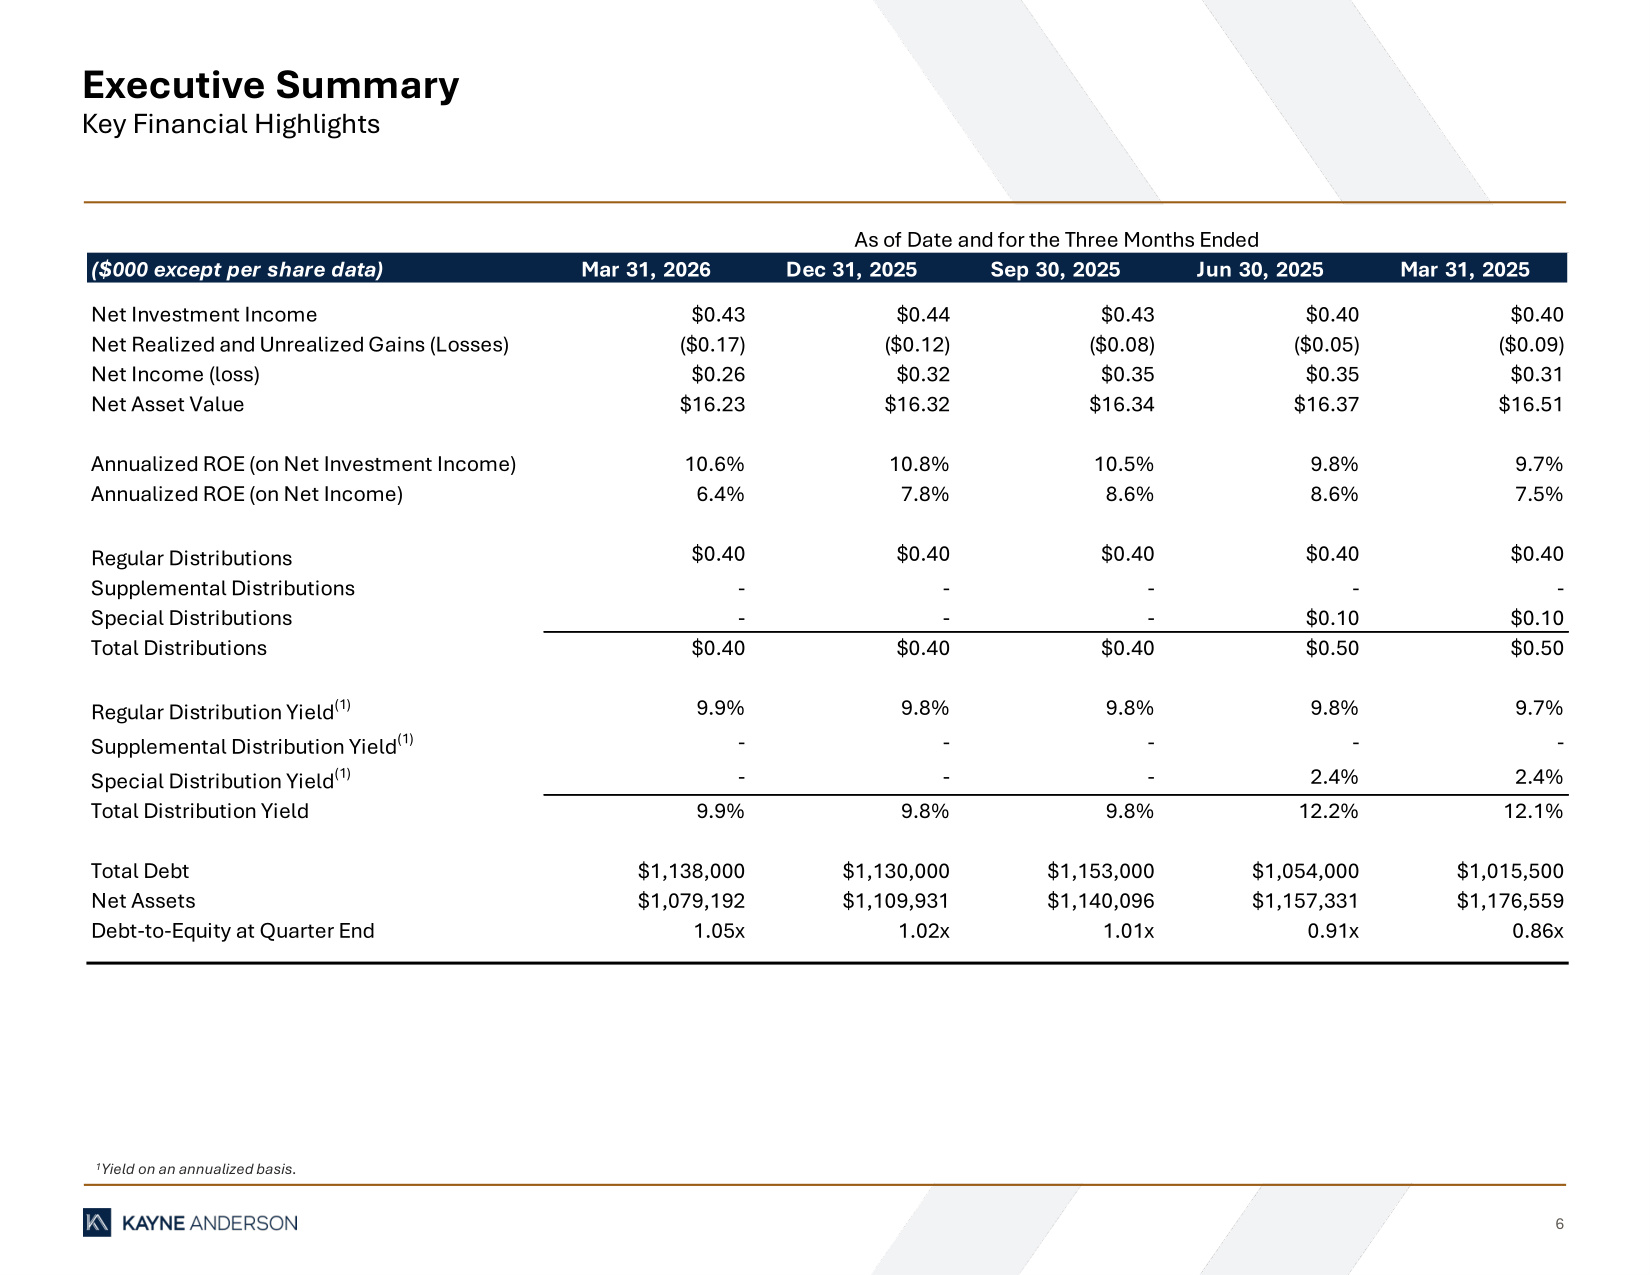
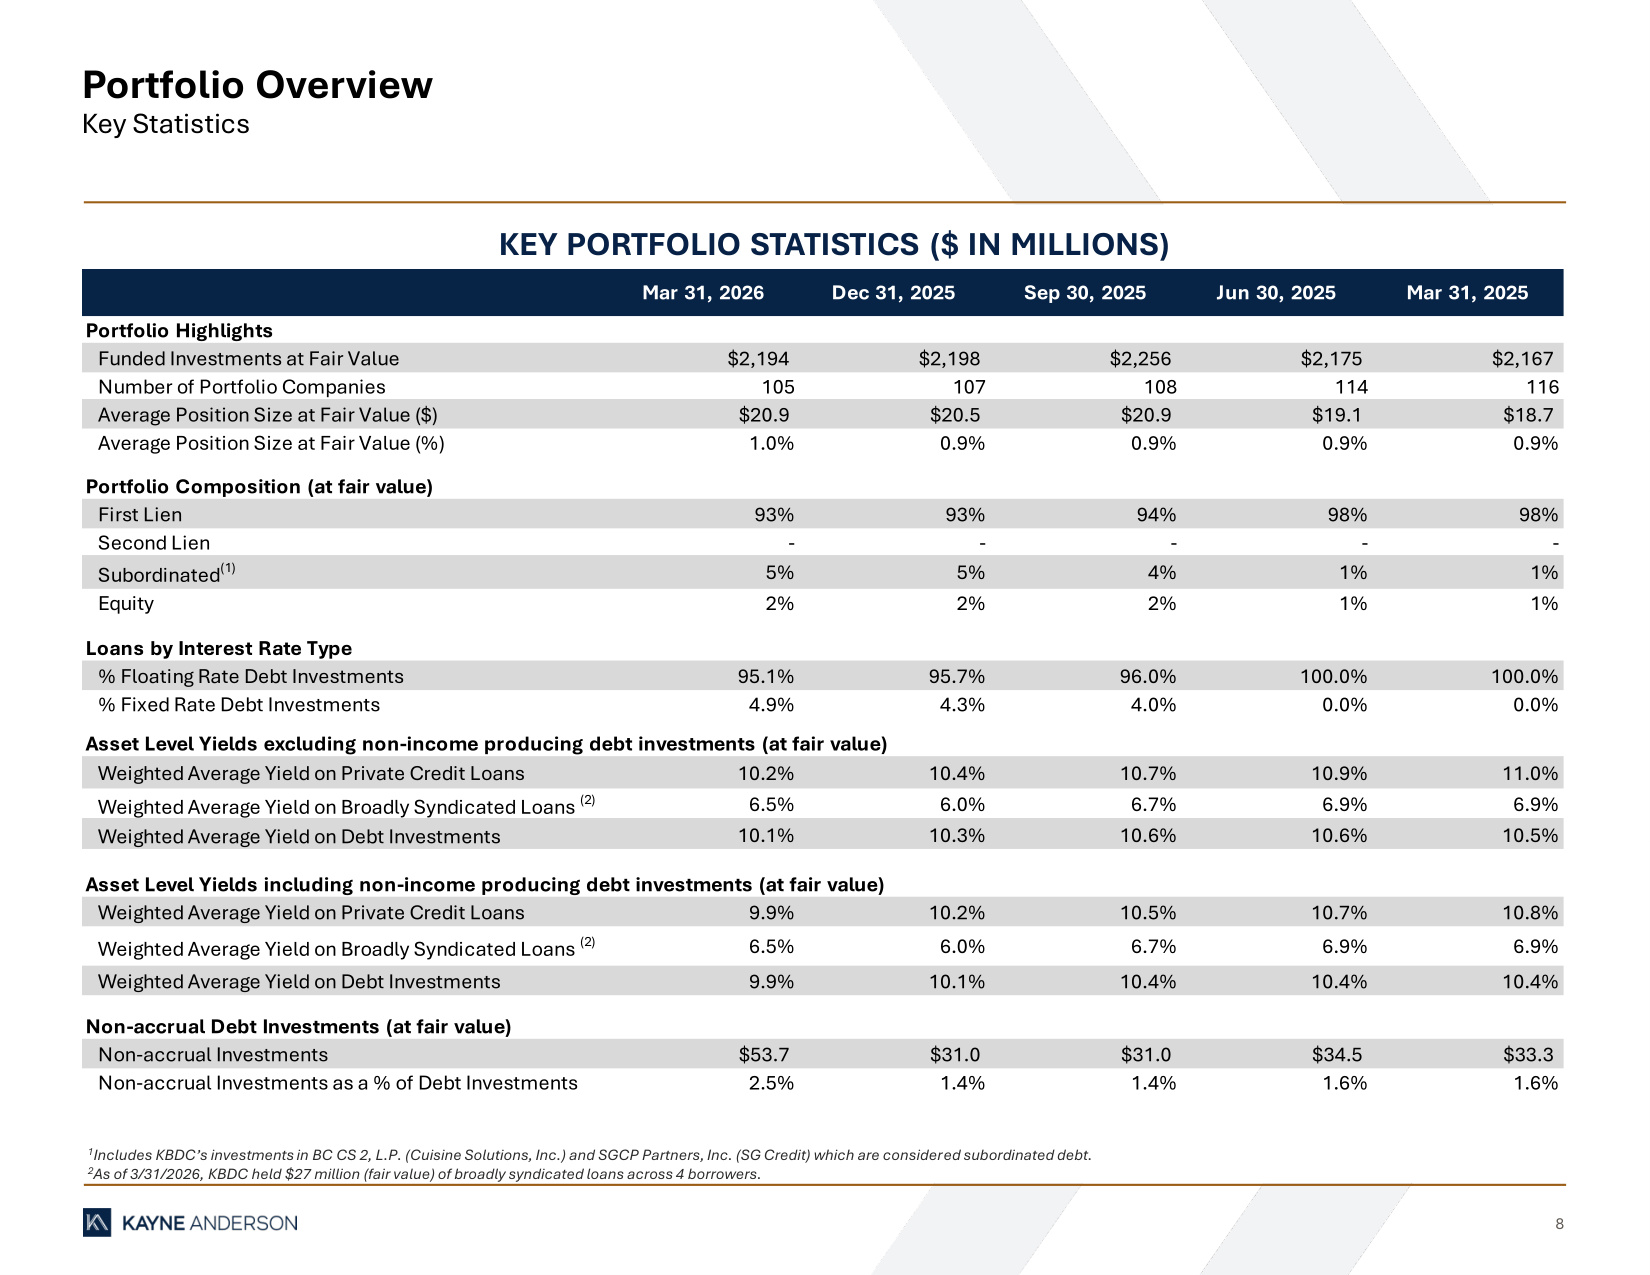
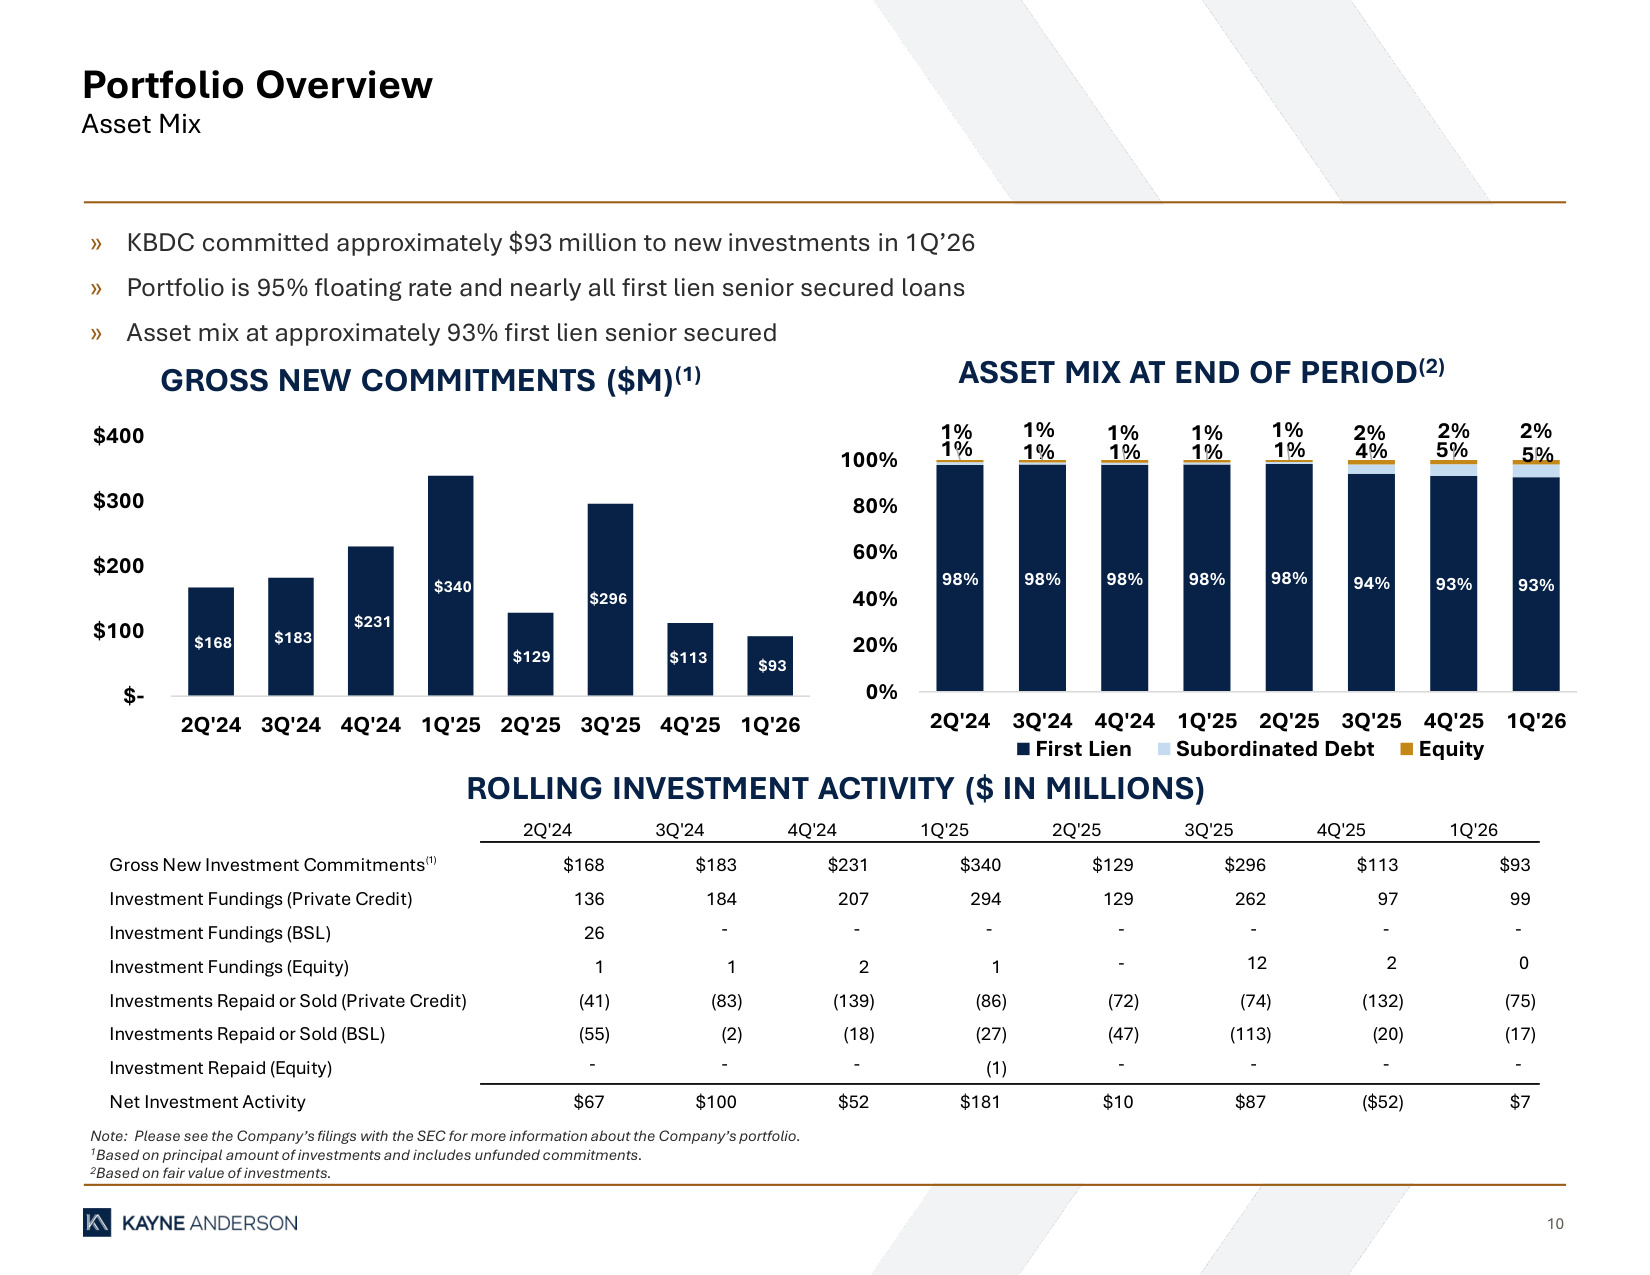
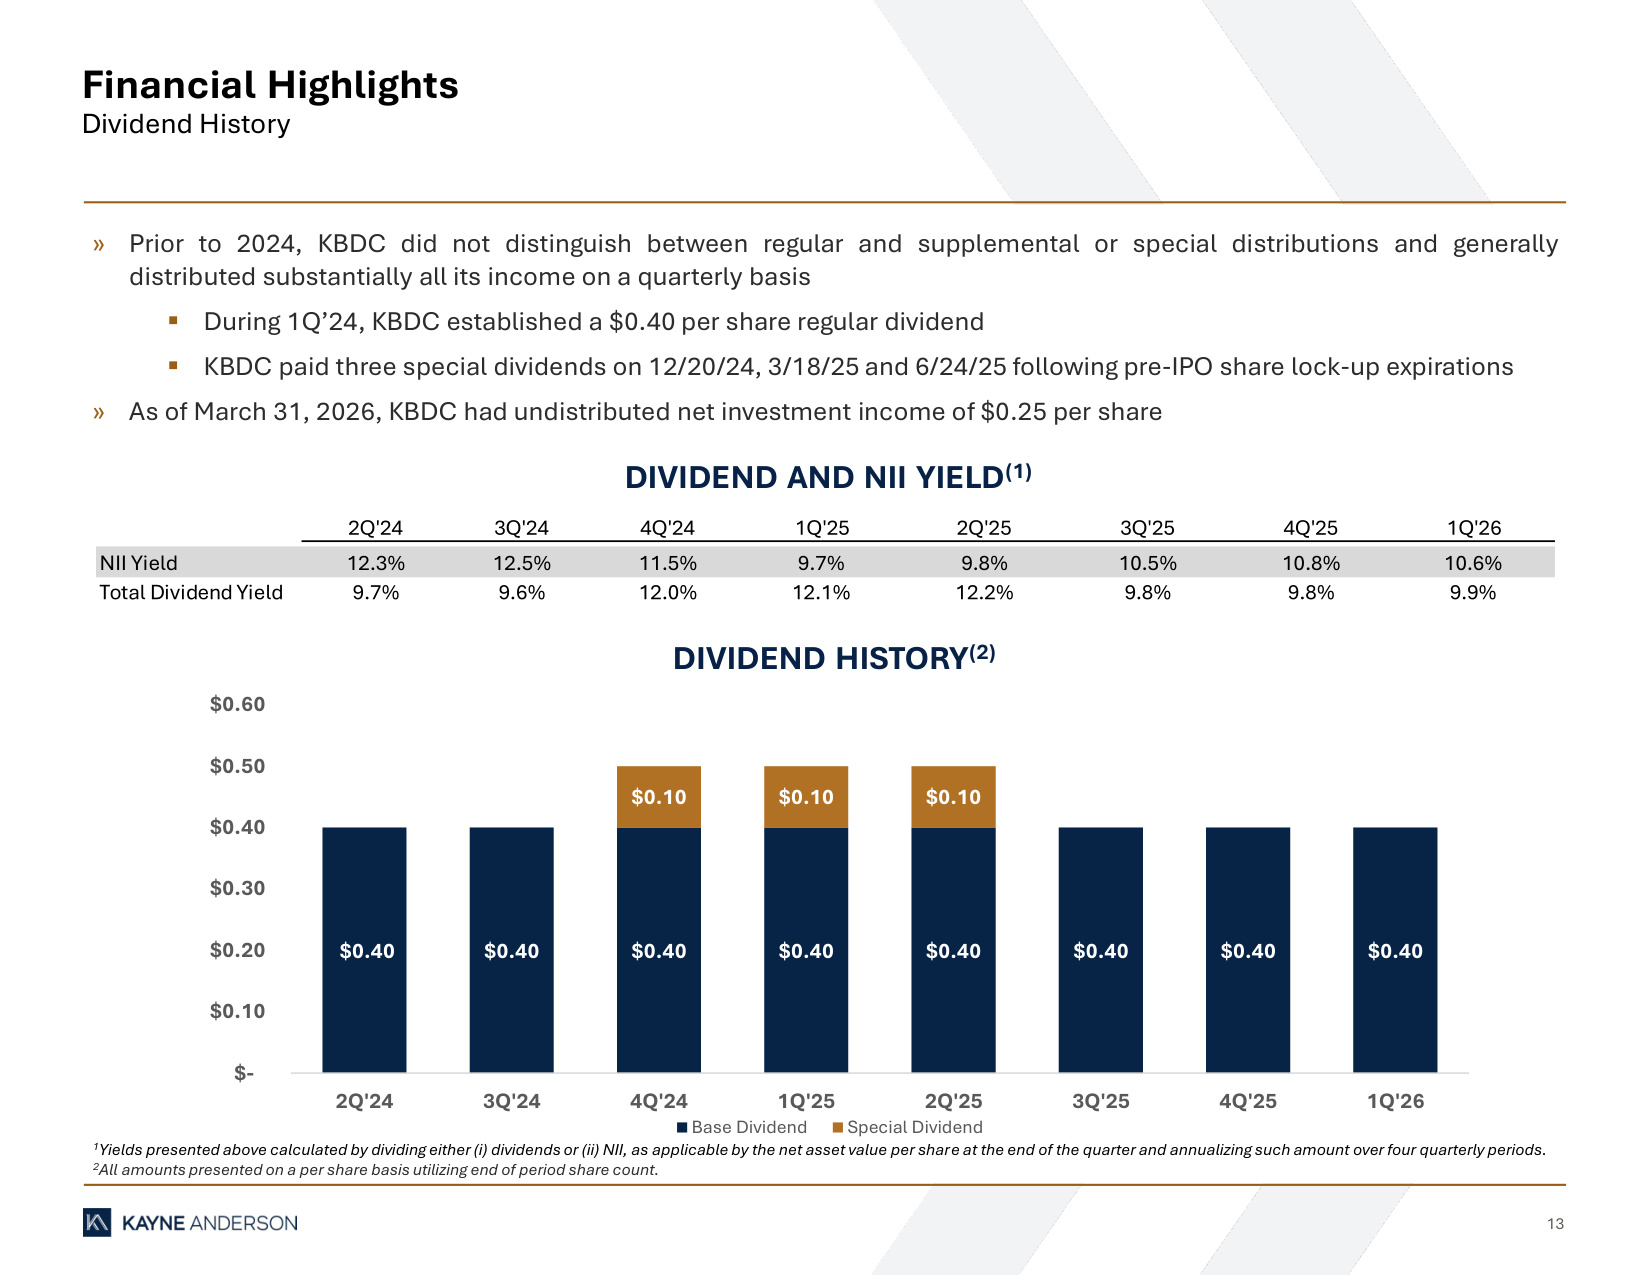
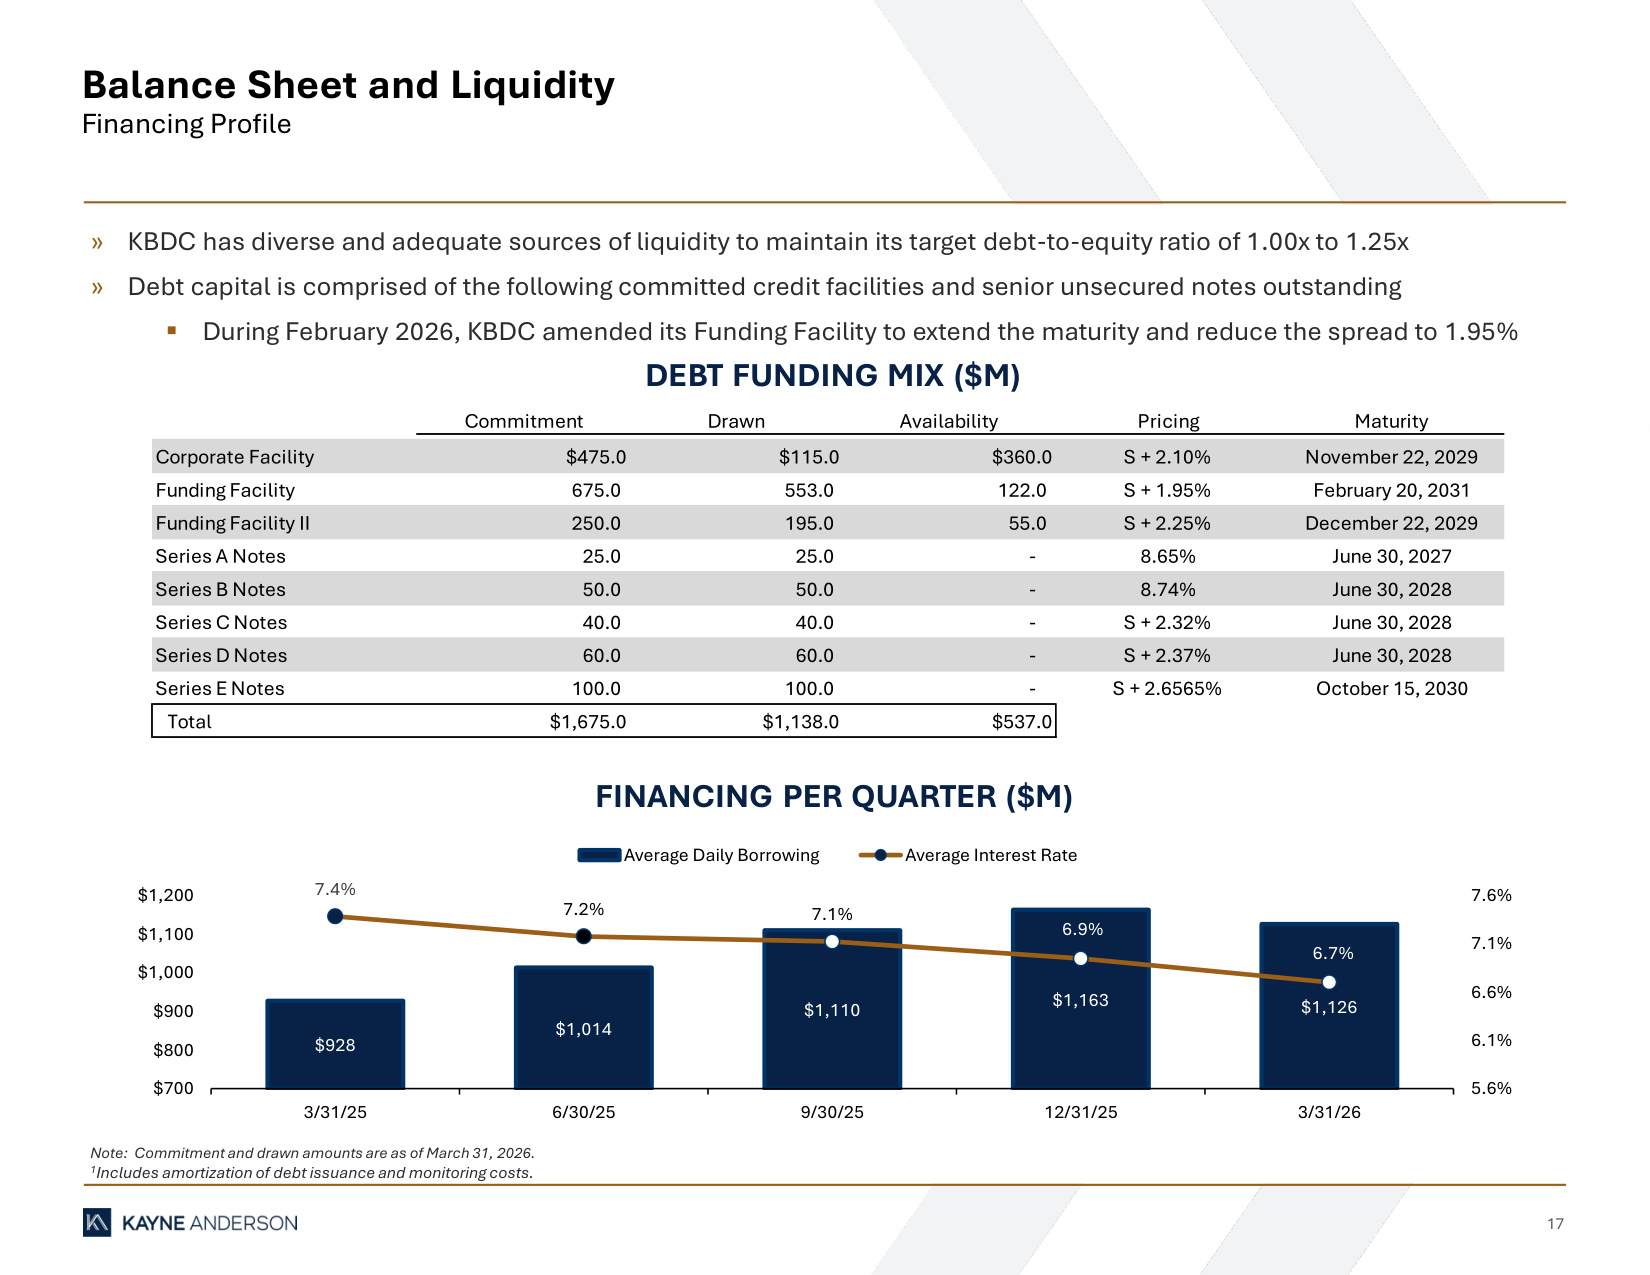
Good morning, everyone. I'm pleased to report another quarter of solid performance that demonstrates the resilience and consistency of our value lending approach, despite the headwinds that the sector has faced this year. I will provide an overview of our quarter and share our thoughts around how KBDC's differentiated portfolio has managed to perform in a more challenging environment. Frank Carl will then provide a more detailed overview of our portfolio and performance, before Terry Hart concludes with KBDC's financial results. For the first quarter of 2026, we generated net investment income of $0.43 per share, which represents strong coverage of our $0.40 quarterly dividend at 108%. While this was a slight decrease from the $0.44 per share we achieved in the fourth quarter, it reflects our disciplined approach to capital deployment in what continues to be an uncertain market environment. Our annualized return on equity for the quarter was a robust 10.6%, underscoring the effectiveness of our investment strategy. Our net asset value per share ended the quarter at $16.23, down 55 basis points from $16.32 in the last quarter. This small decline was due in part to some markdowns in the portfolio, which was offset in part by origination activity, some positive portfolio marks, and by a creative share repurchase activity. I'm pleased to announce that our Board of Directors has declared a regular quarterly dividend of $0.40 per share for the second quarter of 2026. This dividend will be payable on July 16th to stockholders of record as of June 30th. Looking ahead, we remain confident in our ability to sustain our dividend throughout 2026, as we stated on our last earnings call. This confidence is grounded in several key factors. Our portfolio's defensive positioning with 93% in first lien investments. Our value lending philosophy that focuses on companies in stable and staple industries, which allows for a conservative average borrower leverage profile of just over four times. The weighted average yield on our portfolio of 10.1% provides a solid foundation for consistent income generation, while our minimal exposure to volatile sectors like software and technology, at just 2%, positions us well relative to many of our peers. Our portfolio continues to demonstrate strong credit quality and resilience, particularly relative to the broader private credit market. As of March 31, 2026, non-accrual investments represented 2.5% of our debt portfolio at fair value, up from 1.4% in the prior quarter. In terms of specific companies, we added SCORE and Regiment's last-out tranches to the non-accrual status during the quarter. We also moved ArborWorks off non-accrual, and we see a clear path to further improvement in the near term. While many BDCs have significant exposure to software and technology companies, often 15% to 25% of their portfolios, our consistent adherence to underwriting standards that stress disciplined industry and loan-level diversification has proven prescient as we're witnessing the private credit market's first prolonged stress test since the early stages of the COVID era. We remain focused on traditional, stable industry sectors, including industrial services, distribution, food products, and business services. Companies with durable cash flows, substantial, tangible enterprise value, and disciplined leverage profiles. Turning to our investment activity for the quarter, we maintained our disciplined approach to capital deployment while continuing to find attractive opportunities that meet our stringent risk-adjusted return criteria. During the quarter, we made new private credit commitments totaling $93 million, demonstrating our ability to source quality deals even in a more selective market environment. The pricing environment for new originations remains favorable, with our new floating rate loans averaging 549 basis points over SOFR during the first quarter, which was 20 basis points wider than in the fourth quarter. Our total fundings for the quarter were $99.1 million, which included both new investments and draws on existing unfunded commitments from our portfolio companies. We received $74.6 million in private credit repayments and $17.4 million in BSL fails during the quarter resulting in net funded investment activity of 7.1 million. Our balance sheet remains exceptionally strong and we continue to maintain a conservative risk profile. As of March 31st our debt to equity ratio stood at 1.05 times positioning us comfortably within our target leverage range of one to one and a quarter times. Our total liquidity position of $569.7 million provides substantial capacity for accretive capital deployment. This includes $32.7 million in cash and $537 million in undrawn debt capacity under our credit facilities. The private credit market is going through a period of bifurcation in terms of performance across different investment strategies and market segments while presenting challenges for some participants. It's creating opportunities for disciplined lenders. Our selective approach means we're comfortable maintaining higher liquidity levels to be more tactically opportunistic as spreads widen. M&A activity has remained lower than forecasted at the start of the year as geopolitical tensions have kept the cap on activity. However, we continue to see steady transaction flow in our core middle market segment with a noticeable uptick in activity over the past four to six weeks. The quality of deal flow remains solid and spreads have started to widen in Q1. I would be remiss if I didn't mention one of the bigger clouds hanging over our sector right now. The rapid advancement of AI and automation technologies has created significant uncertainty around business model durability and competitive positioning for many software companies. We're seeing several managers report pressure on net investment income per share, higher dividend coverage, and meaningfully declining net per share as they grapple with softening credit performance and increased markdowns on those positions. While we believe the general negative sentiment towards software loans is somewhat overblown, our minimal 2% exposure to the sector has insulated us from this pressure. Public BDC valuations have lagged business fundamentals, with many quality managers trading at discounts to net asset value, despite maintaining strong operational performance. As the market continues to differentiate between managers based on actual performance rather than just asset growth, we believe KBDC's consistent approach will be increasingly valued by both investors and the private equity sponsors who drive our deal flow. I will now pass the call over to Frank Carl to discuss our portfolio.
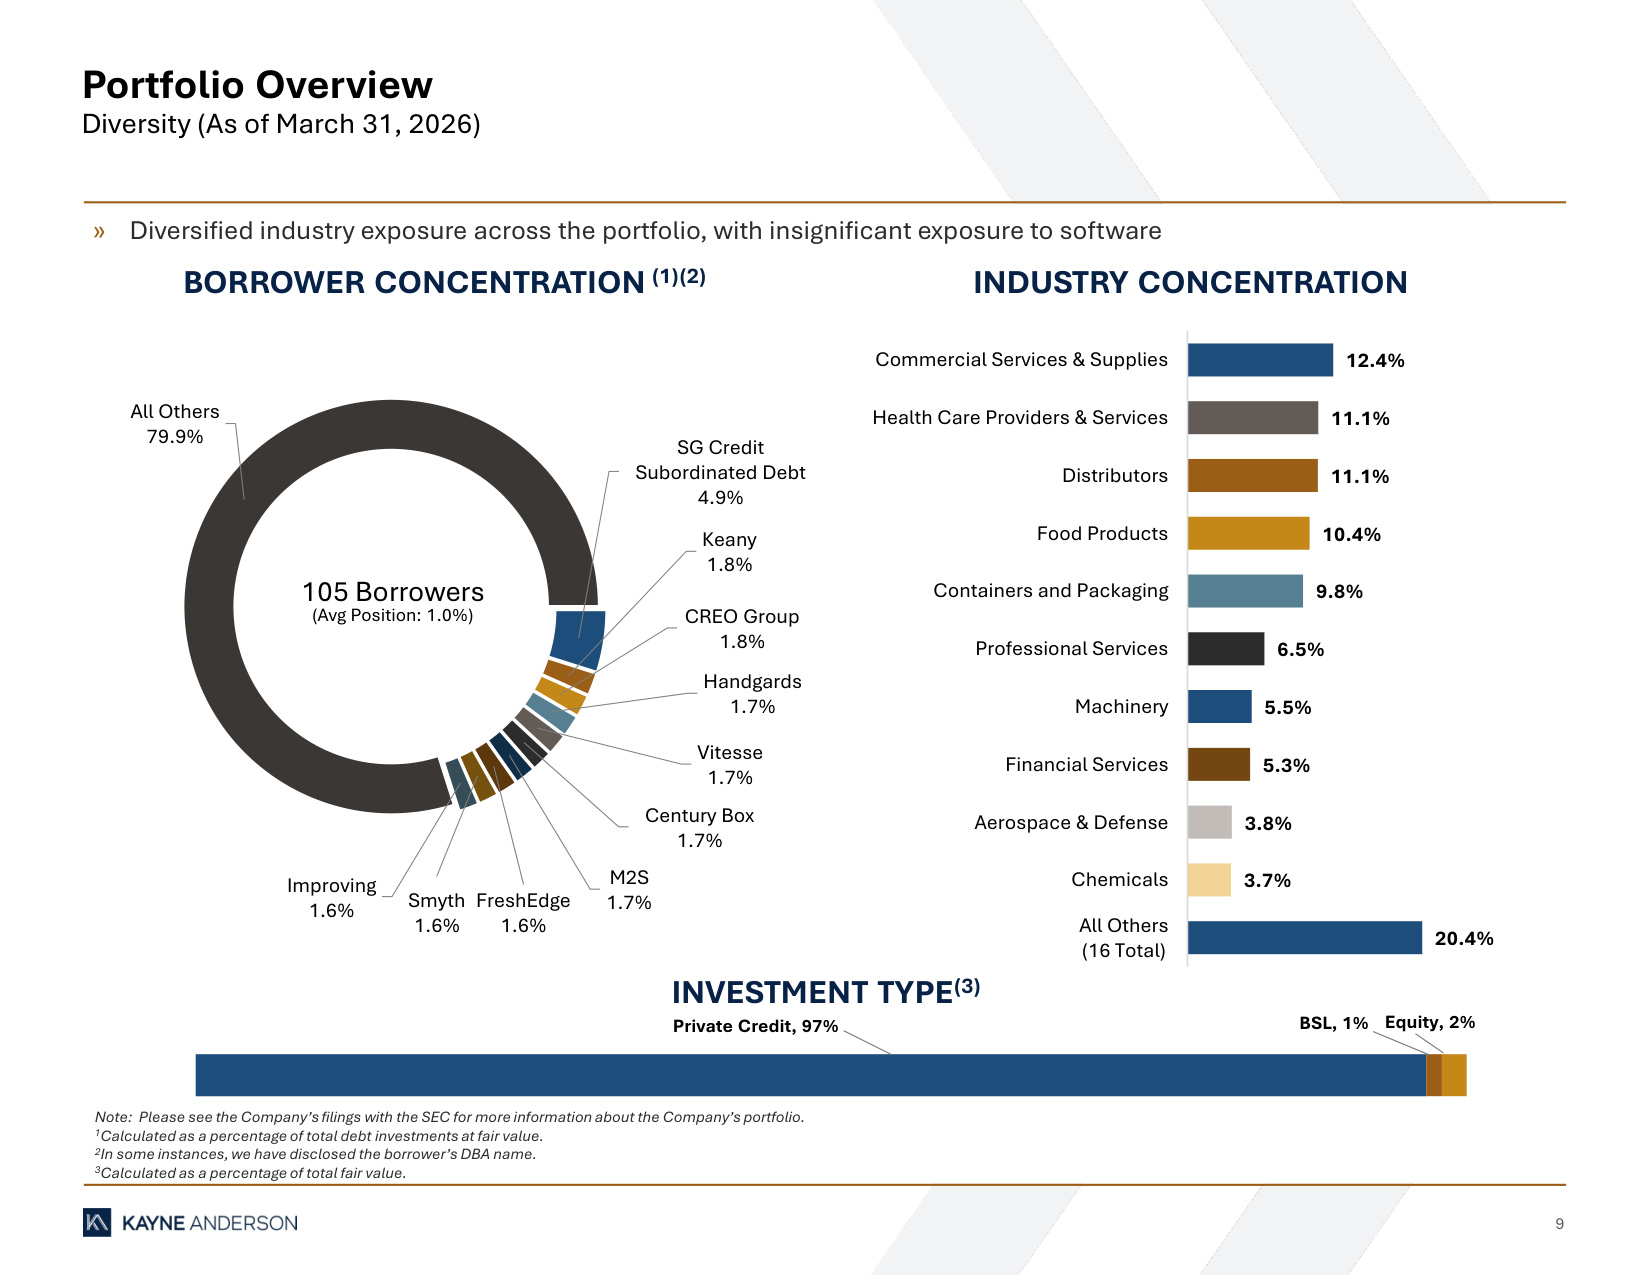
Thanks, Doug. As of March 31st, our portfolio includes 105 companies with a fair value of $2.2 billion plus $289 million of unfunded commitments. Since quarter end, we have closed or finalizing $150 million of new commitments as we've seen something of an uptick in activity in 2Q. Investments in KBEC's portfolio, excluding those on our watch list and opportunistic investments have a weighted average leverage of 4.4 times, interest coverage ratio of 2.4 times, and loan to enterprise value of approximately 43%. The weighted average EBITDA of our private middle market portfolio companies is $52.6 million, reflecting our focus on established middle market businesses with meaningful scale. Company count declined by two, reflecting broadly syndicated loan rotation and realizations the portfolio remains highly diversified average position is approximately one percent of fair value and top 10 investments are only 20 percent of the portfolio our top five industry sectors commercial services and supplies healthcare distributors food products and containers and packaging account for just over 50 of the portfolio and have remained consistent quarter over quarter as we focus on avoiding sector concentration risks. Approximately 95% of our debt investments are floating rate, matched by predominantly floating rate liabilities. Our only material fixed rate investment is the SG credit loan at an 11% coupon, where we increase our commitment in Q1, given strong platform growth. Credit performance remains strong, with 2.5% of debt investments at fair value on non-accrual versus 1.4% last quarter. We do expect both Sundance and Regiment to come off non-accrual over the next one to two quarters as Sundance is completing the final stages of its realization process and Regiment is currently going through a sale. We look forward to providing an update on those credits on our next earnings call. As Doug mentioned, we also moved ArborWorks off of non-approval this quarter, which did have the effect of increasing our total pick income rate for the quarter to 7.5%, up 10 basis points from last quarter, given that we recognize some accrued interest associated with the name in income. Carrie will provide more specifics. Weighted average yield was 10.1% on fair value, excluding non approvals, down slightly from 10.3% last quarter. We've achieved this with materially lower leverage than many peers while continuing our rotation out of the BSLs into higher spread private credit. Remaining BSL exposure was 29.8 million at quarter end, and the sell down is continuing in Q2. Activity has picked up in 2Q, but we have stayed selective, passing on deals where leverage asks pushed beyond our comfort or pricing was too aggressive. Against the backdrop of tariffs, AI risk, and geopolitical tensions, we're looking to remain disciplined as always. We added a further $30 million delayed draw term loan to SC credit, which now represents approximately 5% of the portfolio. That team has executed well. The position adds diversification and the 11% coupon offers an attractive return. Overall, outlook for investment activity looks healthy, and our longstanding sponsor relationships continue to generate preferred lender status on attractive opportunities. With that, I'll turn it over to Terry.
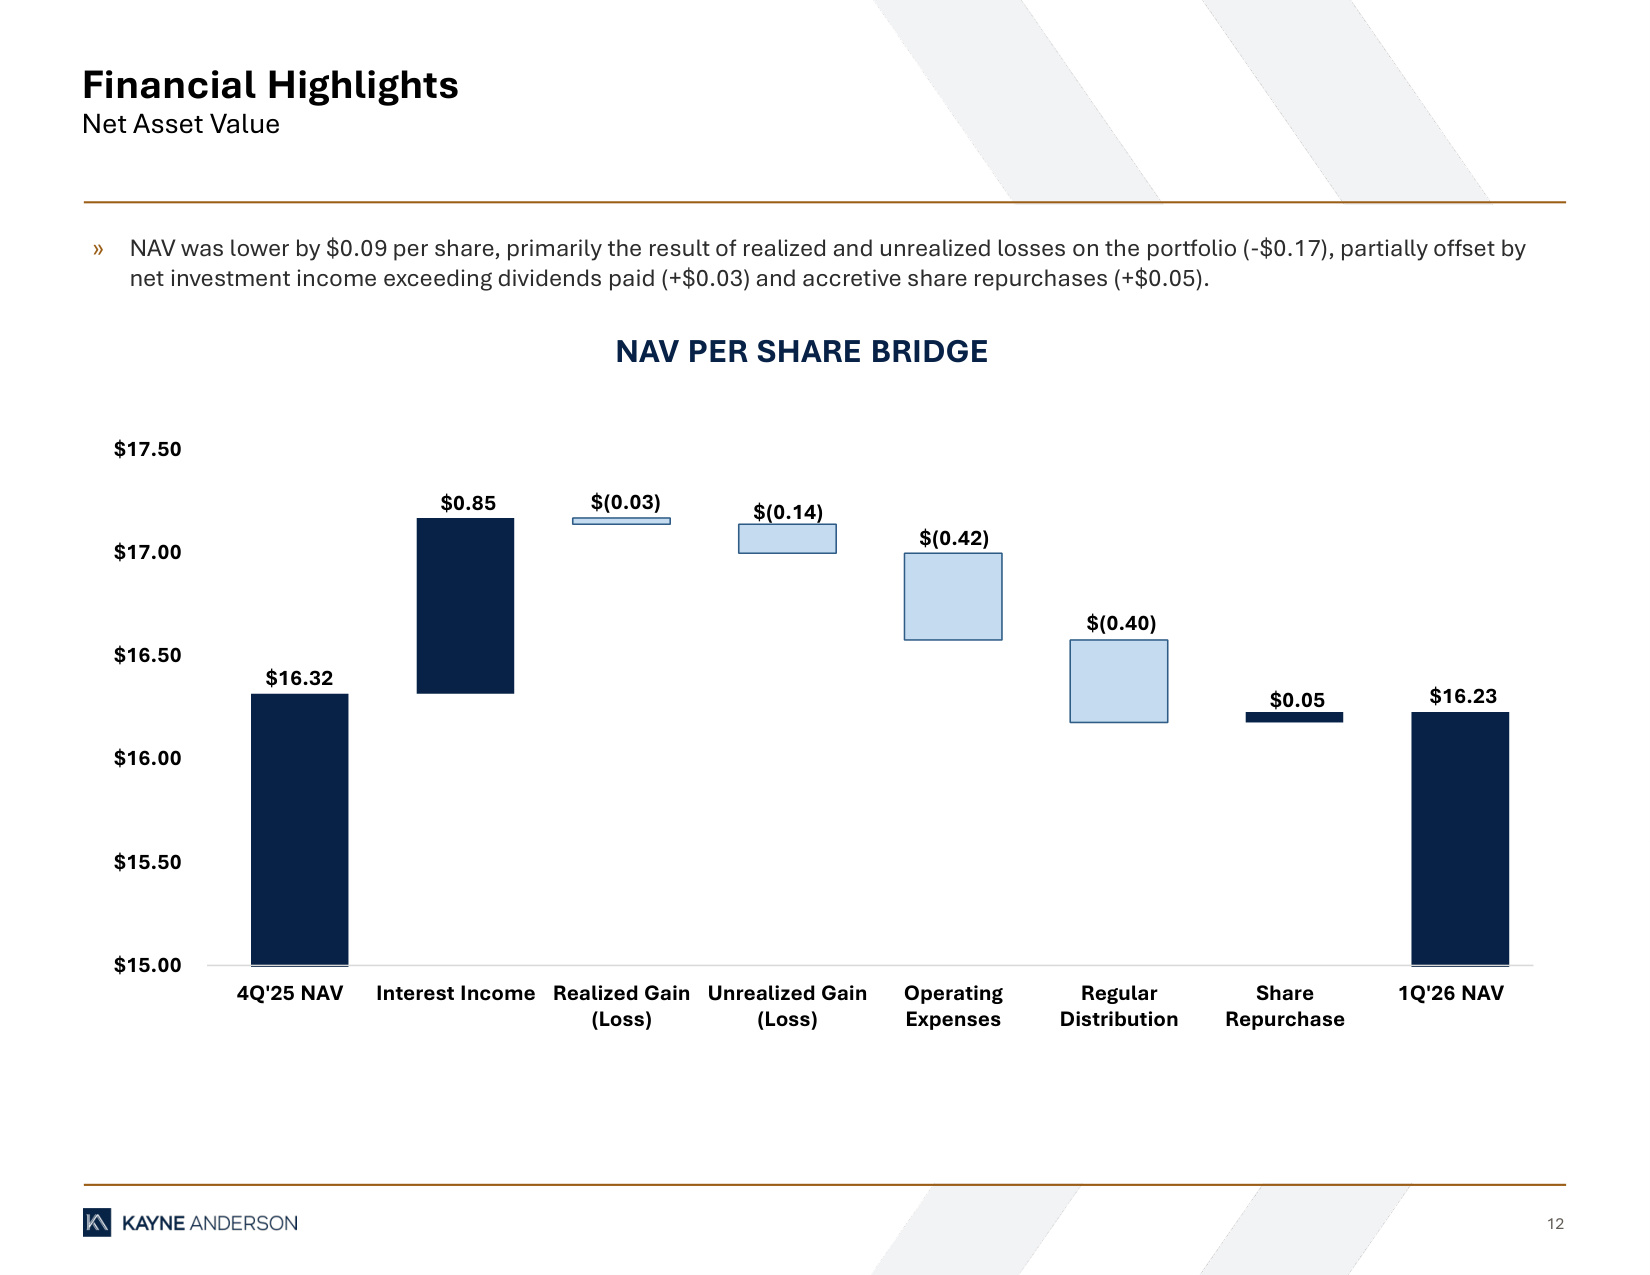
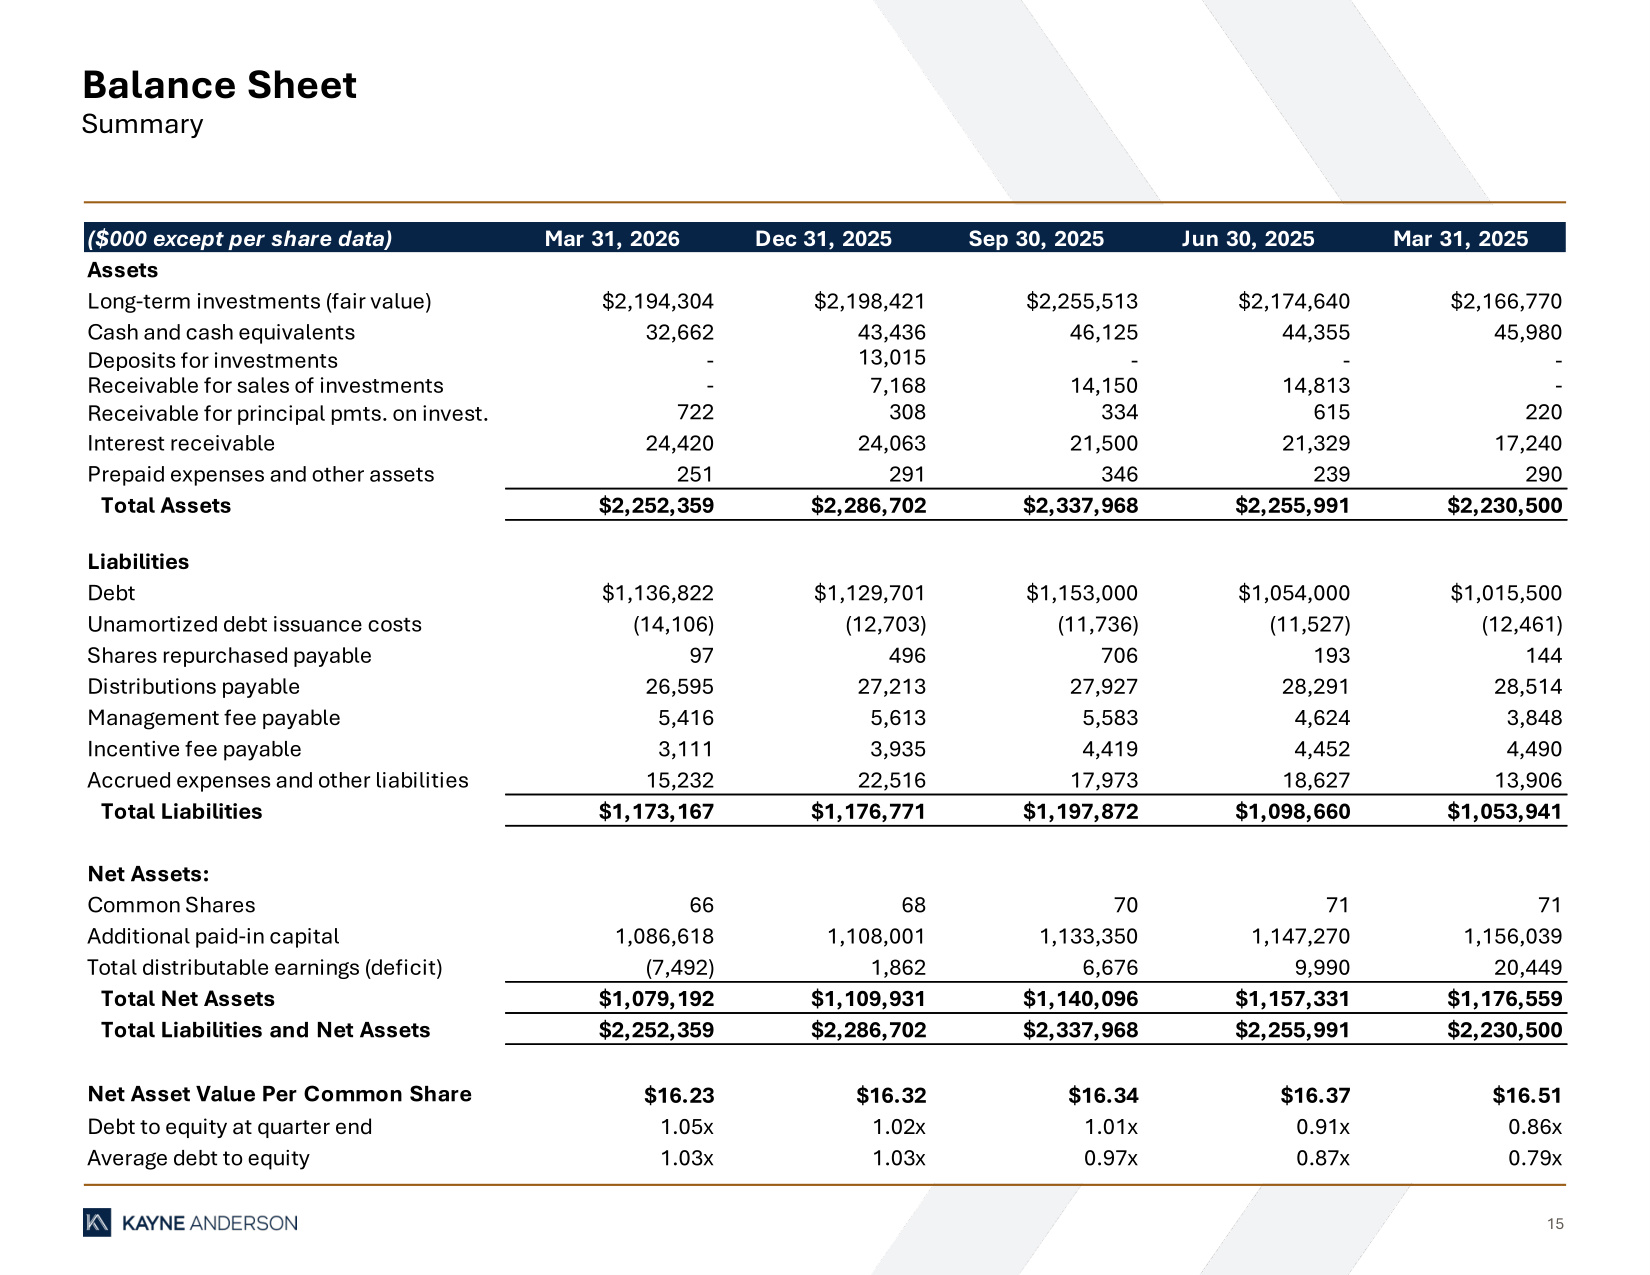
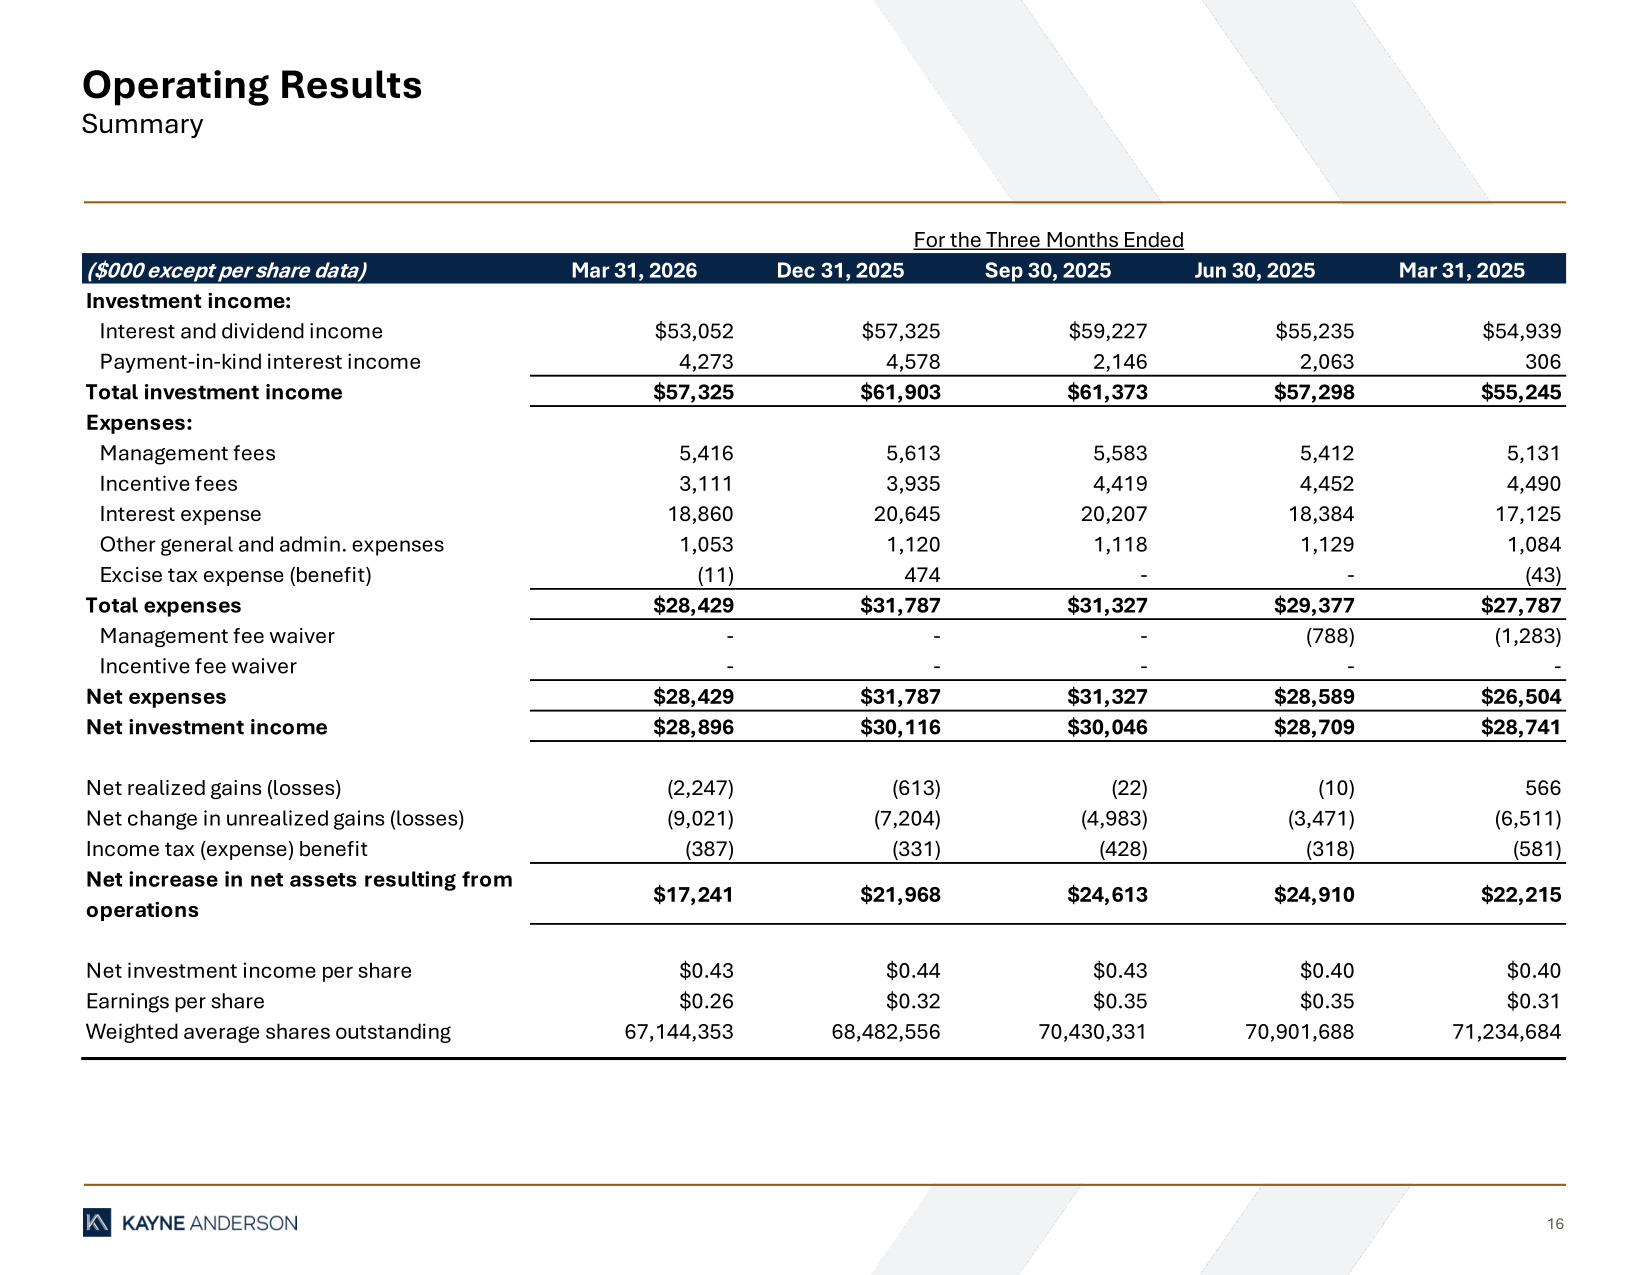
Thank you, Frank. Let's first review our financial results. During the first quarter, we earned net income per share of 26 cents and net investment income per share of 43 cents, compared to $0.44 in the prior quarter and $0.03 above our dividend. Total investment income for the first quarter was $57.3 million, as compared to $61.9 million in the prior quarter. The decrease to investment income was primarily a result of lower average preference rates, some spread compression, and $2.1 million less accelerated amortization of OID and prepayment fees related to realization activity, partially offset by $2.2 million of PIC interest income related to our investment in Arbor Works, which moved to a cool status during the first quarter. Accelerated amortization of OID related to realization activity was approximately $0.5 million during the quarter, and PIC interest represented 7.5% of total interest income for the quarter, but it's worth noting that $2.2 million, or 3.9%, was related to PIC interest from ArborWorks that had not been accrued since the fourth quarter of 2023. Additionally, the 20 basis point decrease to our portfolio yield was split evenly between lower reference rates and lower spreads. Full expenses for the first quarter were $28.4 million compared to $31.8 million for the prior quarter. Decrease was primarily the result of lower reference rates on borrowings, lower average borrowings during the first quarter, lower incentive fees, and $0.5 million of excise taxes incurred in the fourth quarter. During the quarter, our incentive management fees were reduced by the 12-quarter look-back incentive fee cap. During the first quarter, we had $2.3 million of realized losses, mainly related to the restructure of our debt investment and regiment security partners that resulted in a $2 million realized loss, and we recognized a $0.3 million realized loss due to the rotation out of one of our broadly syndicated loans. During the quarter, we had net unrealized losses on the portfolio of $9 million compared to unrealized losses of $7.2 million in the prior quarter. The unrealized losses were largely the result of negative fair value changes related to our investments in SCORE, Siegel Egg, Tempo, and ForOB. Additionally, we had deferred income tax expense of $0.4 million related to unrealized gains on equity investments held in our taxable subsidiary. As of March 31st, total assets were $2.3 billion, and net assets were $1.1 billion. As of that date, our net asset value was $16.23 per share. The decrease of $0.09 from $16.32 per share as of December 31st was comprised of $0.17 per share related to net realized and unrealized losses, partially offset by $0.03 of net investment in income in excess of our dividend, and $0.05 related to accretive share repurchases during the first quarter. At the end of the first quarter, we had debt outstanding of $1,138,000,000, and our debt-to-equity ratio was 1.05 times, which is a small increase from 1.02 times at the end of the fourth quarter. On February 20th, we closed the term extension of our largest credit facility led by Wells Fargo, and reduced the interest rate on this facility by 20 basis points. And as mentioned earlier, during the quarter, we had share repurchases of $21.4 million at an average price to NAD per share of 86%, pursuant to our $100 million share repurchase On May 5th, the program was extended for one year, and the $100 million program amount was renewed starting May 25th. Now, turning to our distribution, on May 5th, our Board of Directors declared a regular dividend for the second quarter of $0.40 per share to shareholders of record on June 30th. As of March 31st, our undistributed net investment income was approximately $0.25 per share. As we continue to execute during the remainder of 2026, we plan to complete the rotation out of our remaining lower-yielding BSL positions, gradually optimize our leverage within our target bet-to-equity range of one-time to one-and-a-quarter times, and stay focused on our value lending strategy. With that, operator, please open the line for questions.
Operator
Thank you. As a reminder to ask a question, please press star, followed by the number one on your telephone keypad. To withdraw any questions, press star one again. Our first question comes from Corey Johnson from UBS. Please go ahead. Your line is open.
Thanks for taking my question. So you mentioned, you know, I guess, passing on some deals because perhaps the terms weren't where you wanted them to be at. But I was just wondering, you know, because I've heard from some of the other BDCs about how some of the terms on their thing that they're looking at have actually strengthened so far. So I was just wondering, are you feeling any pressure possibly from upmarket? And I guess similarly, are you seeing any opportunities given, you know, given where you're at leverage-wise and, you know, I guess coming with a little bit of a cleaner balance sheet, any opportunities for you to either go upstream or just anything else that you're seeing in the market that you can take advantage of?
Sure. Thanks, Corey. This is Doug Goodwillie. And I would say just in general as a backdrop, I think we always, you know, try to stay as disciplined as we can in any market in terms of, you know, leverage discipline as well as pricing discipline. And I think, you know, this quarter was, you know, not all that different for us in terms of that. I'd say the market, in terms of M&A volumes, continues to be, you know, on a mid-range, not fantastic, given what we talked about geopolitical and other pressures on the market. But the opportunities that, you know, we have seen have still been good quality. And I think, you know, if you look at Q2, we've seen a slight uptick. I think we're tracking to almost, you know, 200 million of commitments for Q2 for the BDC. So we are, you know, using our balance sheet and liquidity to invest in what we think are attractive opportunities. In terms of the piece of the question regarding the upper mid-market potentially kind of coming down into the core mid-market, not really the case at all. I think at this point what we're seeing is the start of a dislocation where some of the The upper mid-market players, I think, given some of the redemptions on the private BDC side, haven't been putting as much capital to work. So the $400 million and $500 million upper mid-market deals are actually seeing some better pricing for the first time in a while. And we've seen some of those opportunities where you can play in a $75 million to $100 million EBITDA business, get a covenant, and get some decent pricing. So I think that's been more of an opportunity at this point. We haven't seen enough stress around sell-offs, around software portfolios, and do believe that we're unlikely to see that over the long term. But hopefully that answers the question.
Operator
As a reminder, to ask a question, please press star followed by the number one. Our next question comes from Kenneth Lee from RBC Capital Markets. Please go ahead. Your line is open.
Hey, good morning. Thanks for taking my question. I realize it's a little difficult to predict, but could you offer up any kind of outlook around prepayments over the near term? Could you see it trending either lower or higher than a more normalized kind of environment there?
I'll start, and maybe, Frank, you can weigh in as well. I think it's been a relatively slow prepayment year and probably two to three years, I think, just given the M&A market. So you've seen the average duration, which, you know, Ken and I have been doing this together 25 years. It's almost always over the long term, around three years. I think in a brisk M&A environment, it's going to two and a half, and I think we're seeing it closer to four for this post-COVID period. So this year we're seeing, and I'll toss it over to Frank, relatively kind of normal first half and projecting a pickup in Q4. But I'd say that's a bit dependent on the overall market.
Yeah, I think we've got, to Doug's point, you know, we usually expect something of a, you know, back half, more transaction volume. You'd expect a little bit of a pickup. That said, you know, if you are in an environment where spreads are increasing, you know, 25, 50 basis points, maybe higher than that, that generally leads to something of a slightly more muted refinancing and transaction, you know, period of time. So, I would argue, you know, we're probably expecting 26 to look maybe a little bit of a step up from 25.
And just one more follow-up, if I may, just in terms of the ongoing portfolio ramp, once again, just given the outlook, the macro conditions, and obviously what you're seeing, do you think you would lean for a portfolio leverage to be closer to the lower end or the higher end of your target range there?
Thank you. I think we're comfortable with where we are, you know, between 1 to 1.1. I think our view is we're kind of yet to see where this dislocation goes and, you know, whether it will be prolonged. And we'd like to certainly have a decent amount of liquidity going into the front end of a potential dislocation and certainly don't want to be at the upper end at, you know, one, two, one, two, five, you know, and kind of dealing with potential borrowing base and things like that that can occur if you really go into a prolonged dislocation. So I think we're pretty comfortable with where we are, and, you know, we're still seeing good opportunities, and we'll still deploy capital, but would not expect to get aggressive towards the 1.2, 1.25 side on the leverage side.
Operator
Next question comes from Derek Hewitt from Bank of America. Please go ahead. Your line is open.
Good morning. It was nice to see the 20 basis points of improvement in spreads on a quarter-over-quarter basis. But, like, how are spreads trending today on deals that you're looking at?
Thanks, Derek. I'll start, and Ken and Frank, please weigh in. I think we've seen a slight uptick in the core mid-market, but something along the lines of potentially 20 basis points in our opportunity set. And I think that's translating into the core mid-market. I think you'd hear that in the upper mid-market, there's been slightly more than that, as I think you saw more of the start of the dislocation occurring there. We expect, with capital coming out of the market, fundraising to be harder with a lot of the, you know, whether it's right or wrong, negative press around private credit. So I think those factors bode well for spreads increasing both in the upper mid-market as well as the core mid-market over the near term.
Yeah, the other thing I would add is we've talked to investment bankers, and the pipeline seems to be increasing. That's always the front end of our investment process. And so as more volume comes in the market, we think there will be an opportunity to take spreads up. And so we remain hopeful that that's going to continue. That's generally a pretty good leading indicator.
Okay, thank you for that. And then in the prepared March, you guys had mentioned that the SG credit add-on was on the delayed draw side due to just growth in that investment in general.
So how should we think about maybe increasing your exposure on the equity side, just given that you're seeing strong growth overall in that vehicle? yeah i'll start there i mean they're um you know continuing to grow the book obviously one good way to do that and it's you know over the long term will support you know the valuation of our equity investment is via the incremental debt investment um you know we've talked about in the past we do have an option to purchase um the more equity um in that vehicle i think that that's a you know something that we will continually be discussing internally. As that platform grows, you know, we're not going to be on the phone next quarter saying, hey, we've made a substantially increased equity commitment to SG credit.
Okay. Thank you. And then the last one for me is in your prepared remarks, you guys had mentioned that you were continuing to monetize the BSL portfolio. Is that expected to be done in the first quarter? Or are there maybe a couple of investments in that portfolio that may have experienced some dislocation over the past three to five months and might take a little bit longer to monetize?
I'll toss it to Frank, who's a little closer on the exact timing, but we're down to four credits. You know, three are, I think, the average leverage across those is mid twos. There's one that's slightly marked down, which Frank can hit on. But we do expect to monetize that largely during this quarter. But, you know, some may slip into Q3.
Not much to add, right? There's four names, about $30 million at cost, about $27 million at FMV. You know, I think it will just depend on, to Doug's earlier point, around how we want to manage leverage, what the opportunities look like, et cetera. But, you know, three of those are trading right around our cost basis. And then you mentioned Tempo, that's a light solution. That business has gotten knocked by some AI-related noise, although we do think it's more of a – you know, we don't think it's a fair characterization for that business. Very small position that we are looking to unwind sooner rather than later.
Operator
We have no further questions. I'd like to turn the call back over to Doug Goodwillie for closing remarks.
Well, with that, I would like to thank everyone for joining us for this KBDC earnings presentation for your continued interest in KBDC and our platform. We look forward to speaking again in August at our next earnings call.
Operator
This concludes today's conference call. Thank you for your participation. You may now disconnect.