Nick
Head of Investor Relations
Hello. Welcome, everyone, to the Fiscal 2026 First Quarter Earnings Call for CMC. Joining me on today's call are Peter Matt, CMC's President and Chief Executive Officer, and Paul Lawrence, Senior Vice President and Chief Financial Officer. Today's materials, including the press release and supplemental slides that accompany this call, can be found on CMC's Investor Relations website. Today's call is being recorded. After the company's remarks, we will have a question and answer session, and we'll have a few instructions at that time. I would like to remind all participants that on today's discussion, that will contain four looking statements, including with respect to economic conditions, effects of legislation and trade actions, U.S. steel import levels, construction activity, demand for finished steel products, and precast concrete products, the expected capabilities, benefits, costs, and timeline for construction of new facilities, the expected benefits of recent acquisitions, the company's operations, the company's strategic growth plan, and its anticipated benefits, legal proceedings, the company's future results of operations, financial measures, and capital spending. These statements reflect the company's beliefs based on current conditions but are subject to risks and uncertainties. The company's earnings release, most recent annual report on Form 10-K and other filings with the U.S. Securities and Exchange commissions contain additional information concerning factors that could cause actual results to differ materially from those projected in forward-looking statements. Except as required by law, CMC does not assume any obligation to update, amend, or clarify these statements. Some numbers presented will be non-GAAP financial measures, and reconciliations for such numbers can be found in the company's earnings release, supplemental slide presentation, or on the company's website. Unless stated otherwise, all references made to year or quarter end are references to the company's fiscal year or fiscal quarter. And now for opening remarks and introductions, I will turn the call over to Peter.
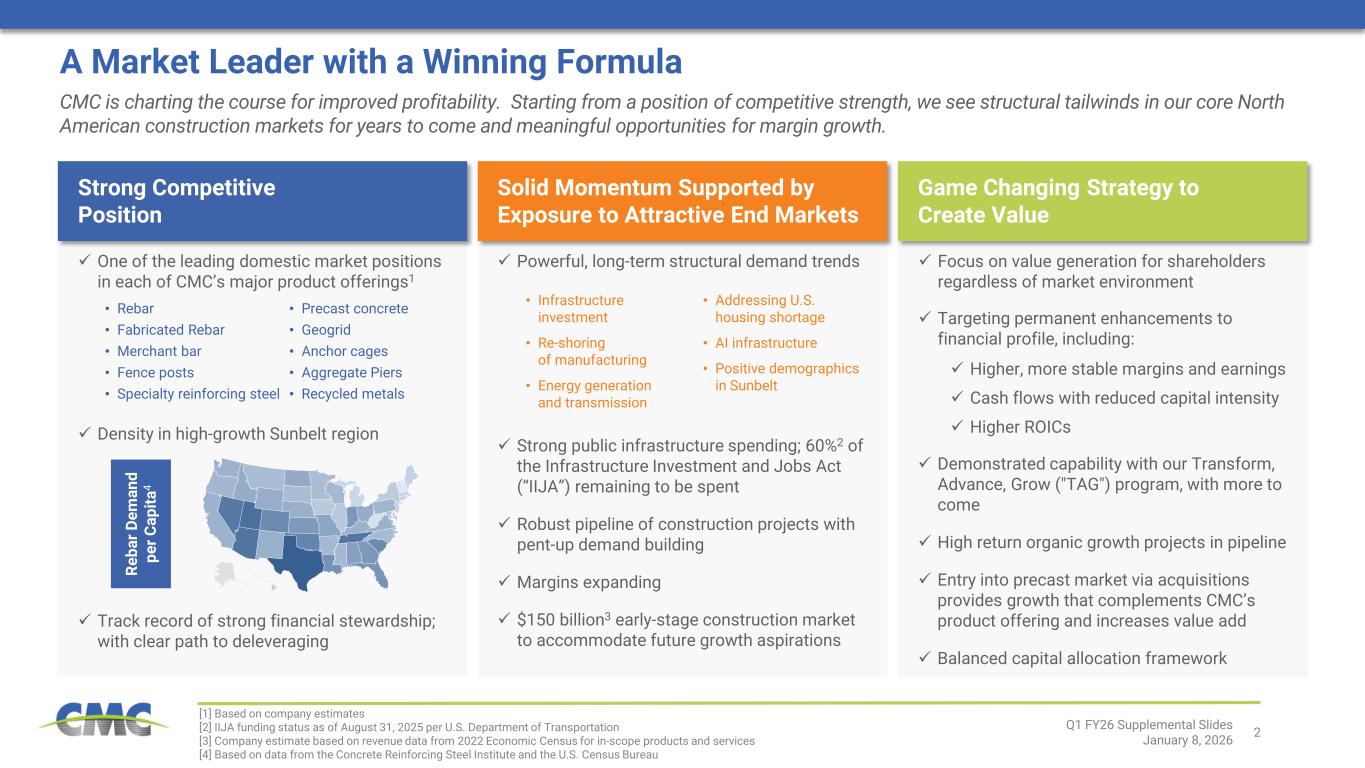
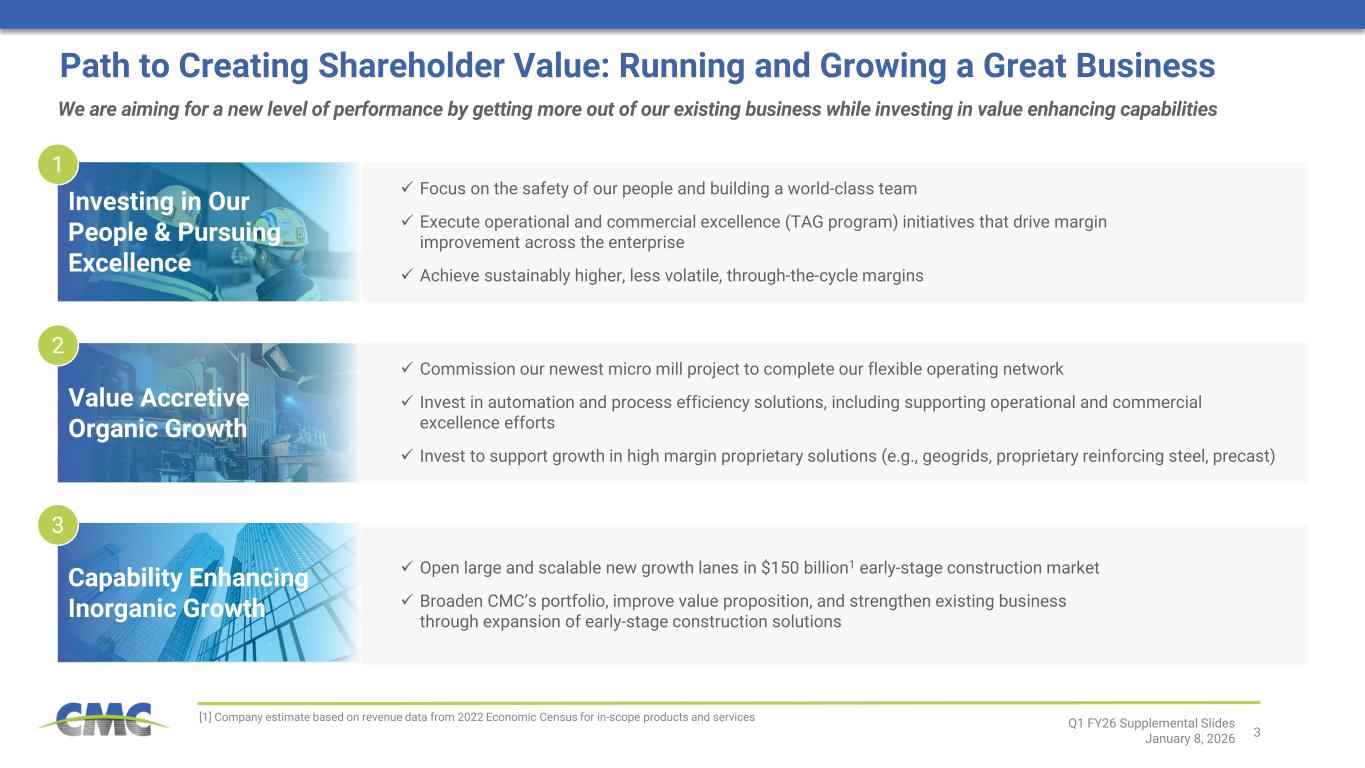
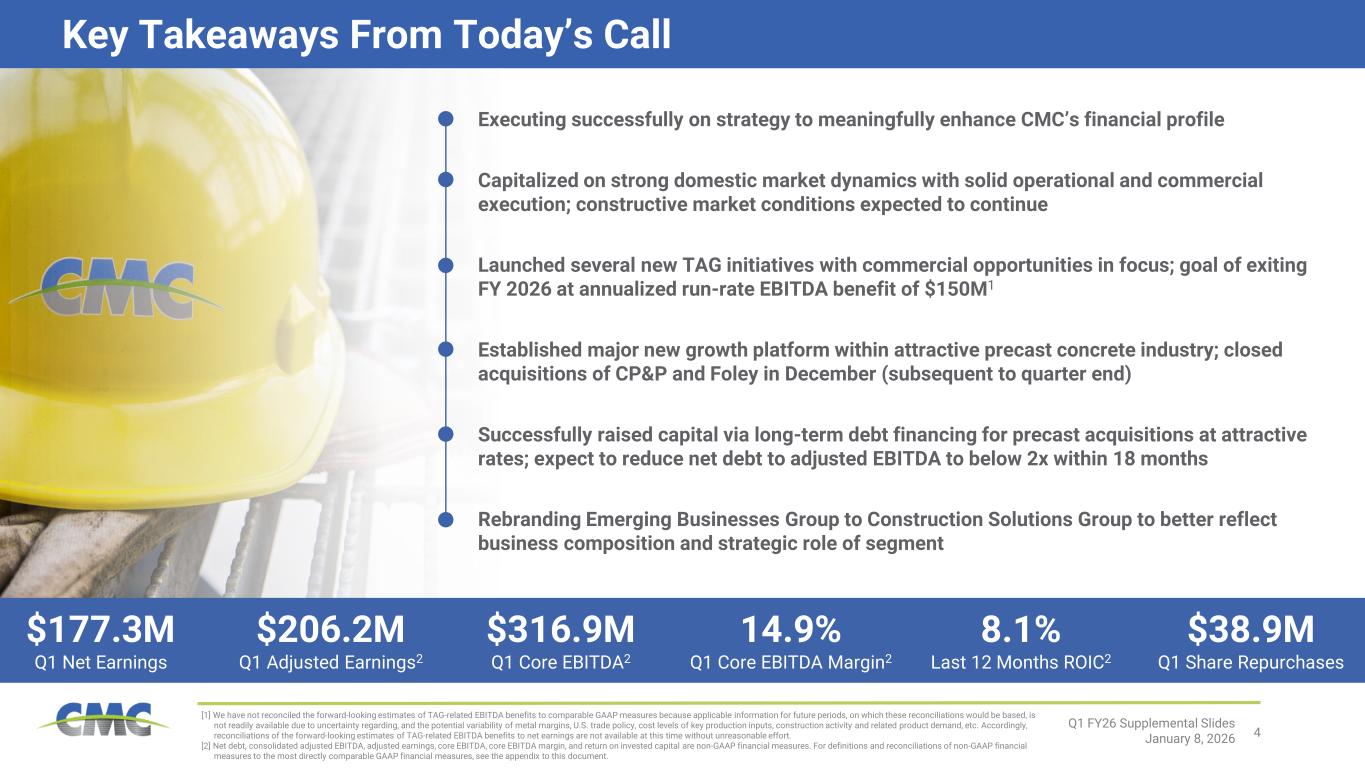
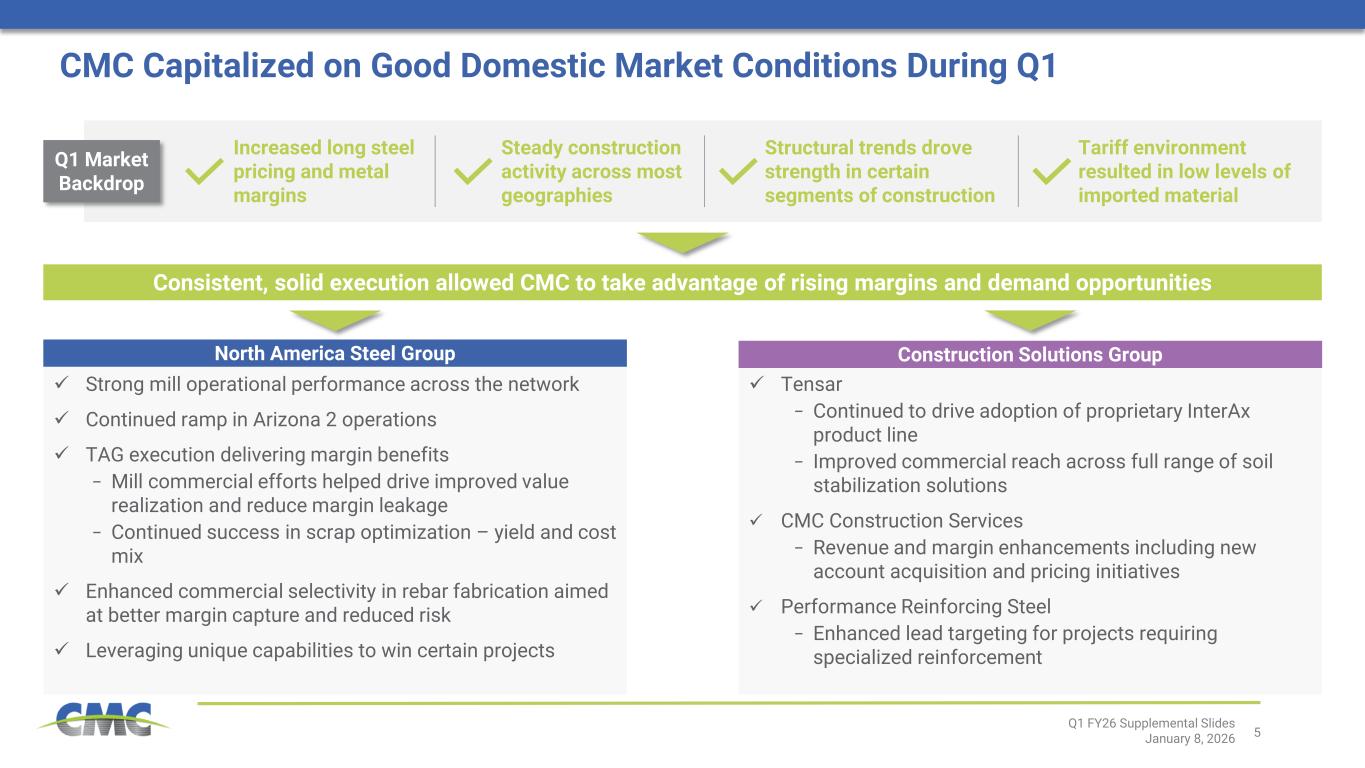
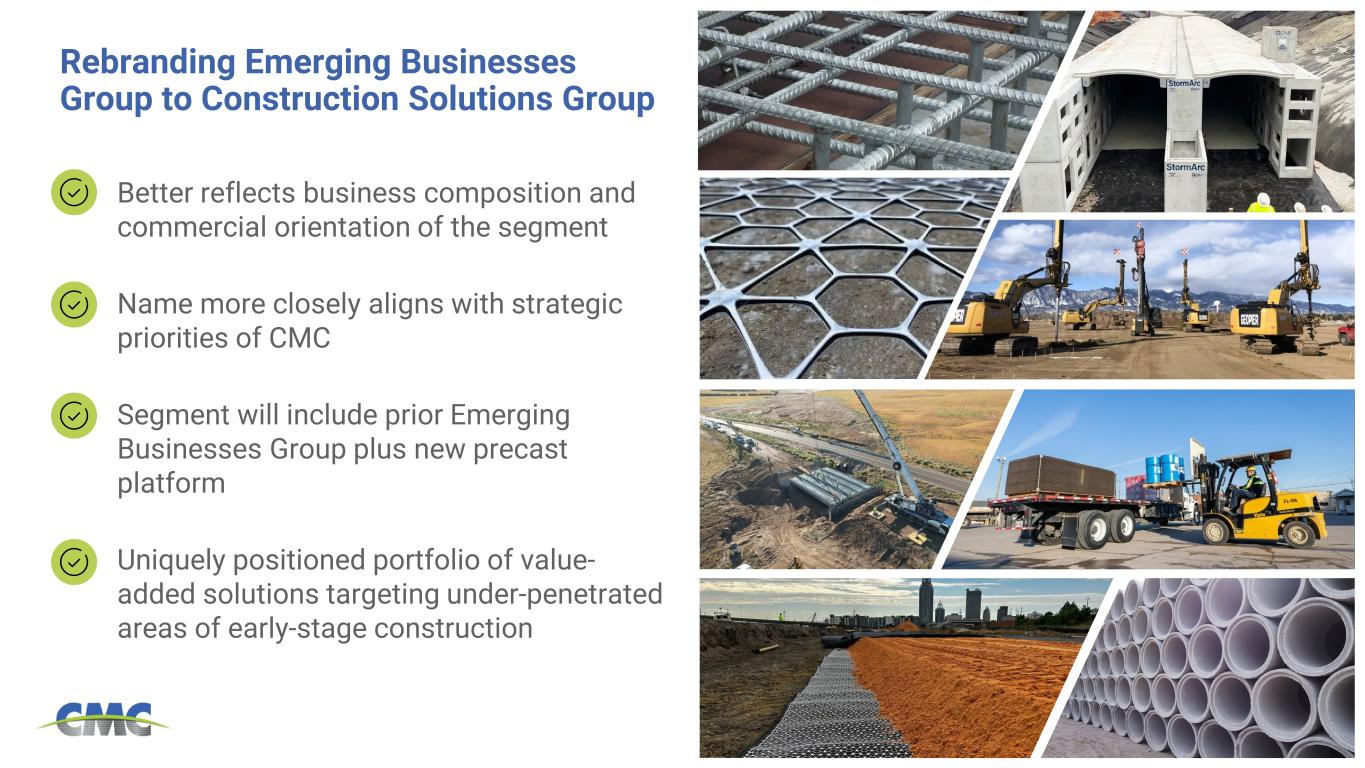
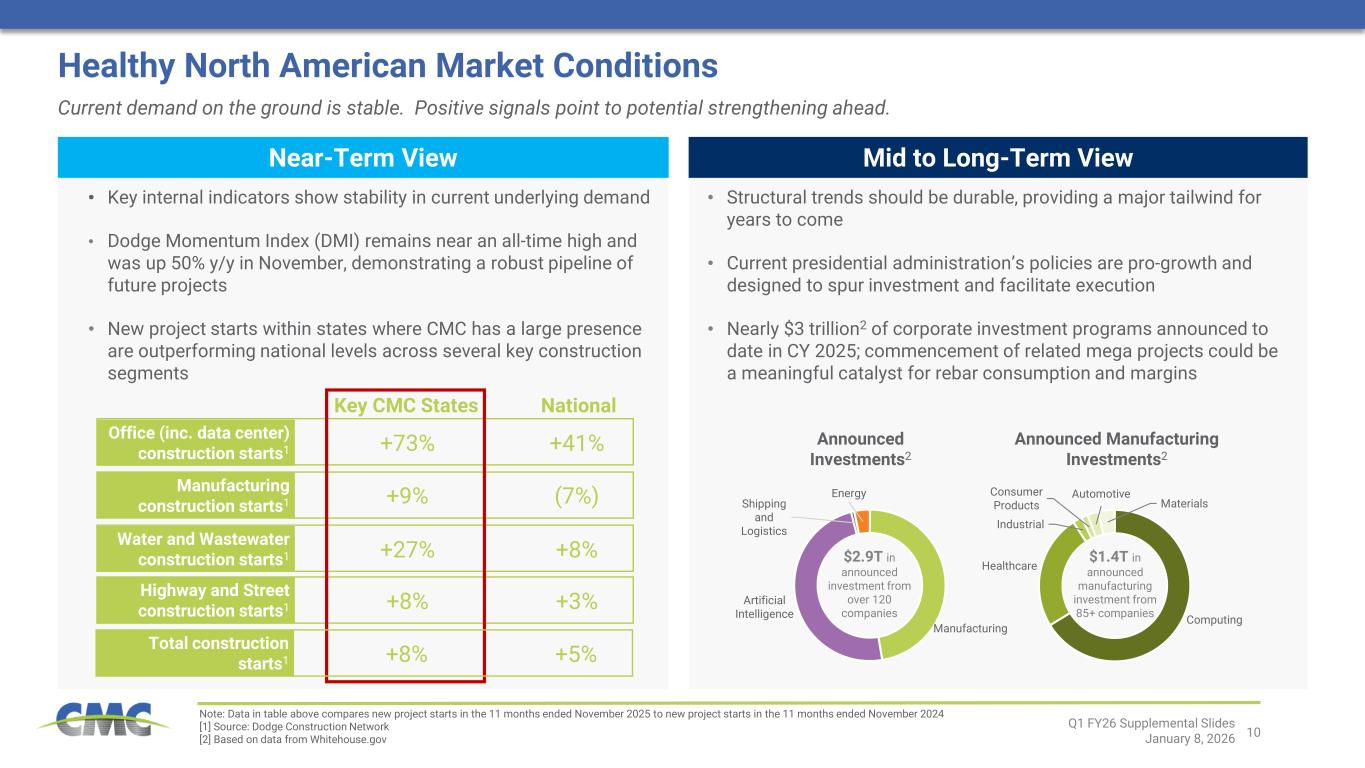
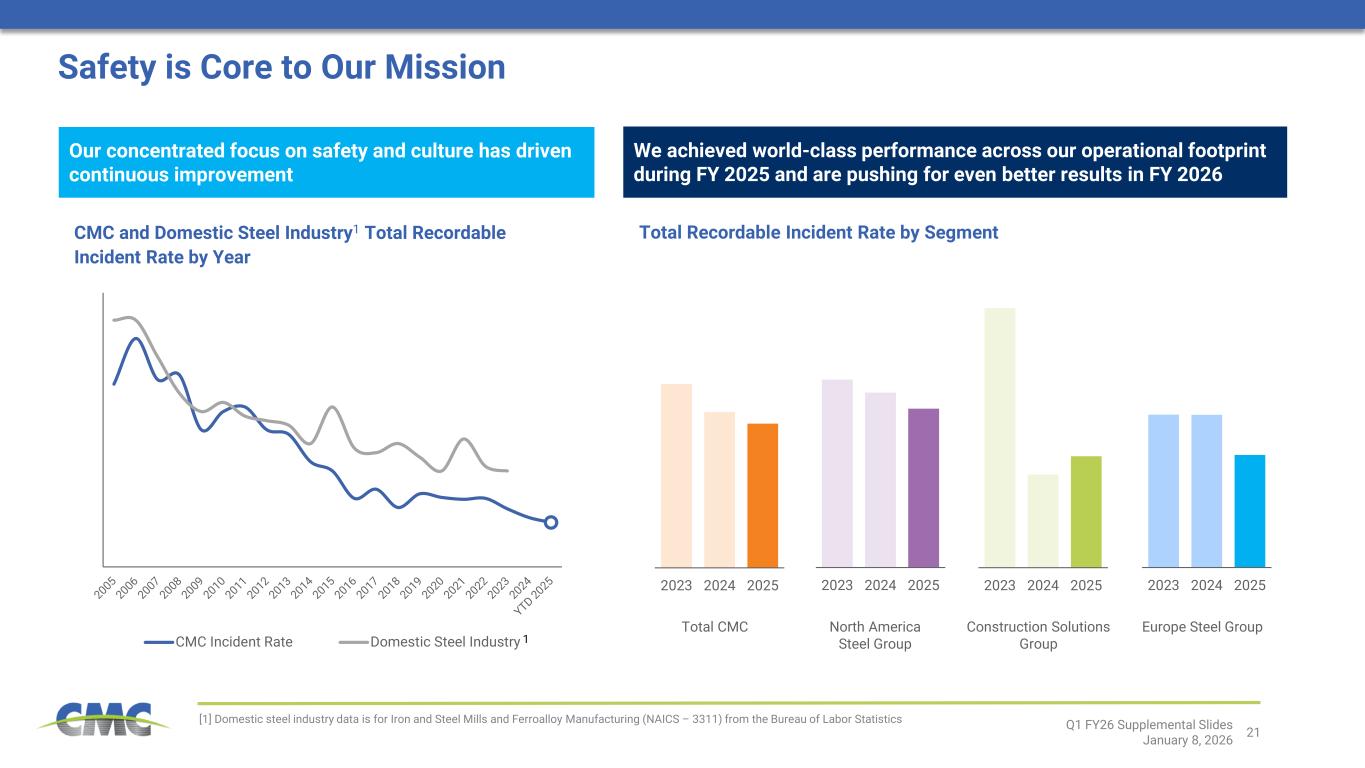
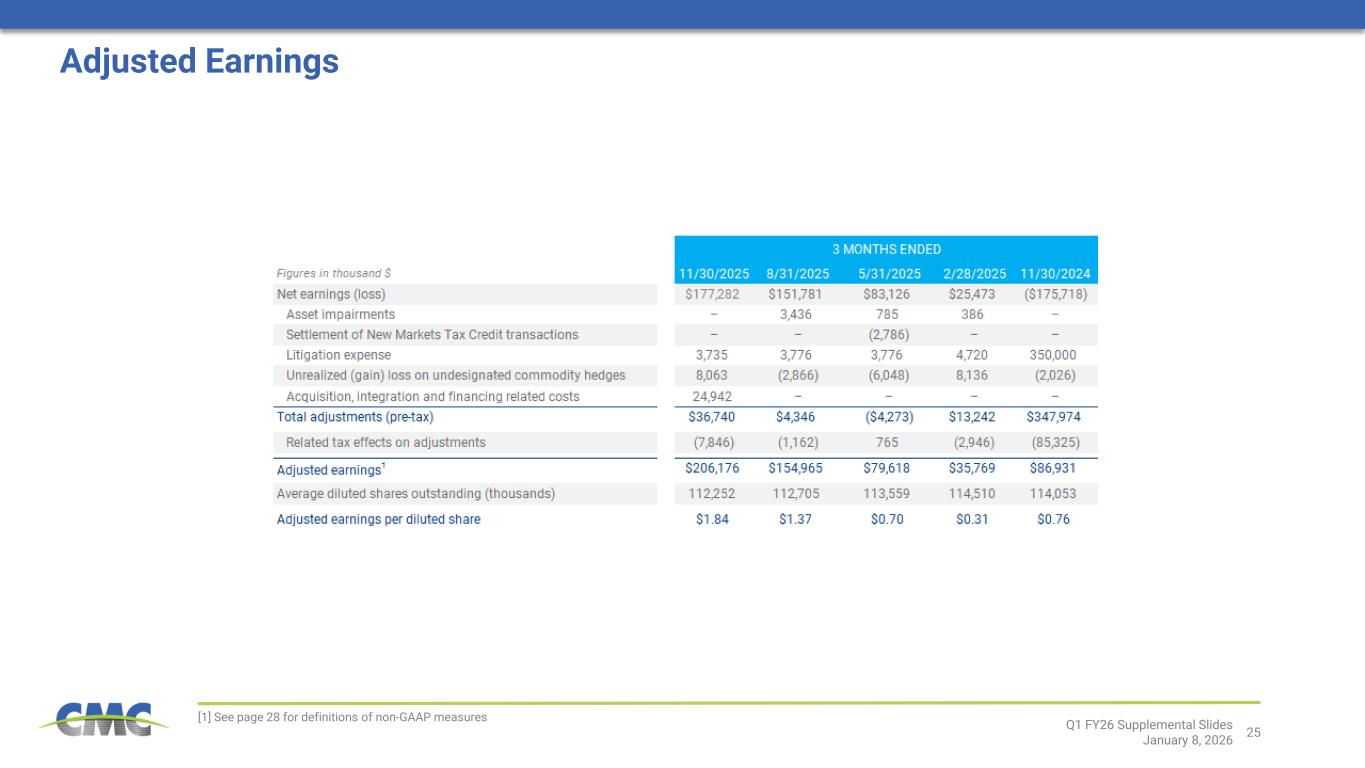
Good morning, everyone, and thank you for joining CMC's first quarter earnings conference call. I hope each of you had a wonderful holiday season and a happy new year. CMC had an exceptional start to our fiscal year as we built on the strategic foundation laid in fiscal 2025, continuing to meaningfully and sustainably enhance our financial profile. The first quarter was one of the best in our company's history, serving as validation that our ambitious strategy is bearing fruit. Strategic actions taken over the last 12 to 18 months, including the launch of TAG, organizational realignment in critical areas, and the onboarding of key talent and resources to support growth areas, are directly driving bottom-line improvement. We are confident there is much more to come, particularly with the addition of CMC's large-scale pre-cast platform. Our strategic focus remains on transforming CMC into an even stronger organization with higher, more stable margins, earnings, cash flows, and returns on capital. Let's jump into the first $177.3 million, or $1.58 per delay. Certain charges, which we beat the margin of 40. As outlined on slide five, this occurred against a good market backdrop with stable demand, limited imports opportunities within certain. Though CMC certainly benefited from these constructive conditions, our results were meaningfully enhanced by solid execute. Let's review some highlights, starting with our North America program now role for construction solutions business, formerly known as Tensar Specific Operational Initiatives Gain Traction. Our team has managing costs and optimizes margins. Our CMC construction services business achieved strong results during the quarter, with revenue growth outpacing the broader market due to several impactful initiatives to acquire new customers. I mentioned earlier that we capitalized on a supportive environment in the quarter. Let me provide a bit more color on what we want. In North America, we experienced healthy, stable, underlying demand for our major problems. Combination with a well-balanced supply landscape year over year and down, capitalized, recent conversations with many of our largest customers. The DMI leads 57% and confident this margin rate could. Turning to our construction solutions group, current conditions are similar to those just described, with steady activity across most construction. In addition, often modest about the comments on the quarter, let me dive more deeply in operational initiatives. We are pleased with the execution on new initiatives so far in fiscal 2026 and have maintained solid momentum on programs launched in fiscal 2025. Looking at fiscal 2026 and beyond, commercial excellence is a major opportunity where we see significant upside potential through achieving better margins and fuller value realization for CMC's industry-leading capabilities and service levels. For the mills, this comes in a variety of forms, endorsing grade and size extras, applying appropriate fabrication business we are making across operational, commercial. In December, subsequent operating, one of the initial observations over the last few weeks. More confident discussions with our construction solutions group a few times. I would like to highlight the reasons for turning the call over to Paul. I would like to recognize the efforts of our world-class employees. With that, I'll thank you, Peter, and good morning
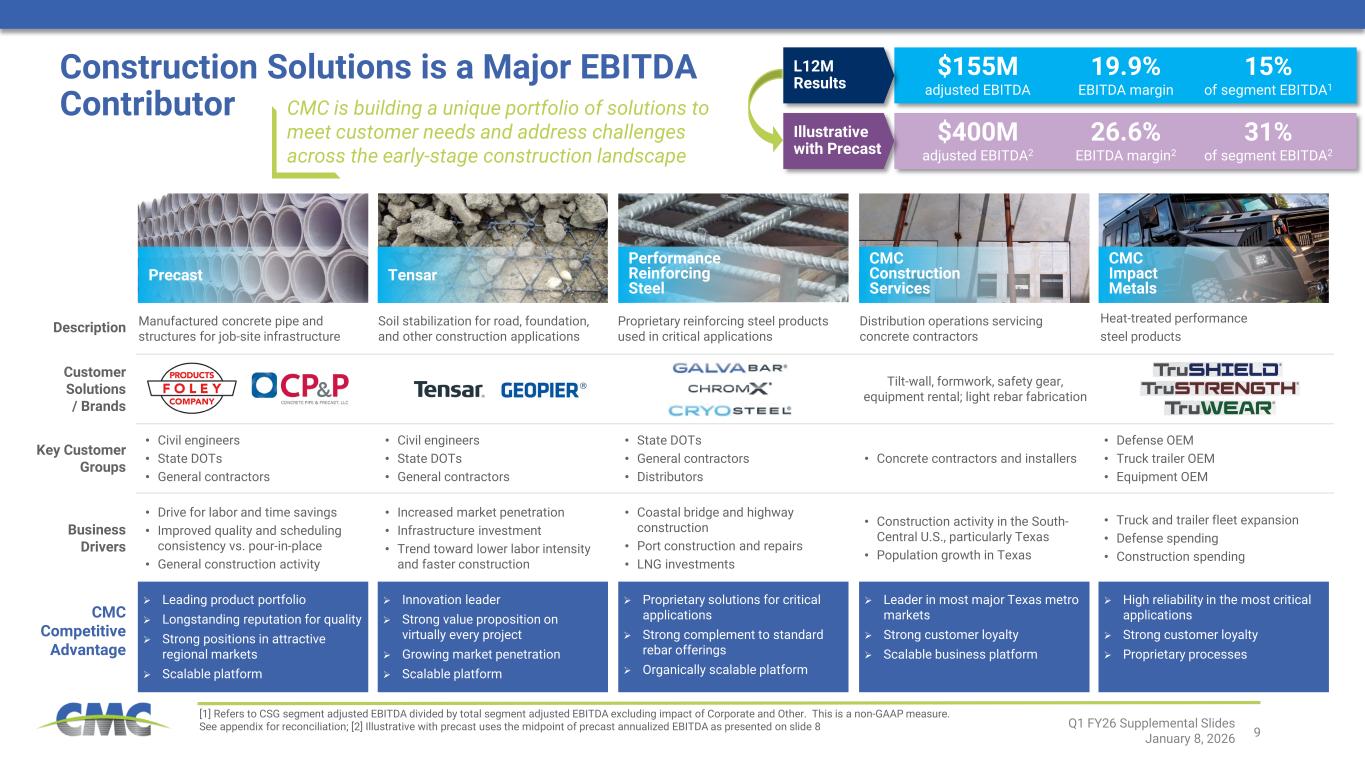
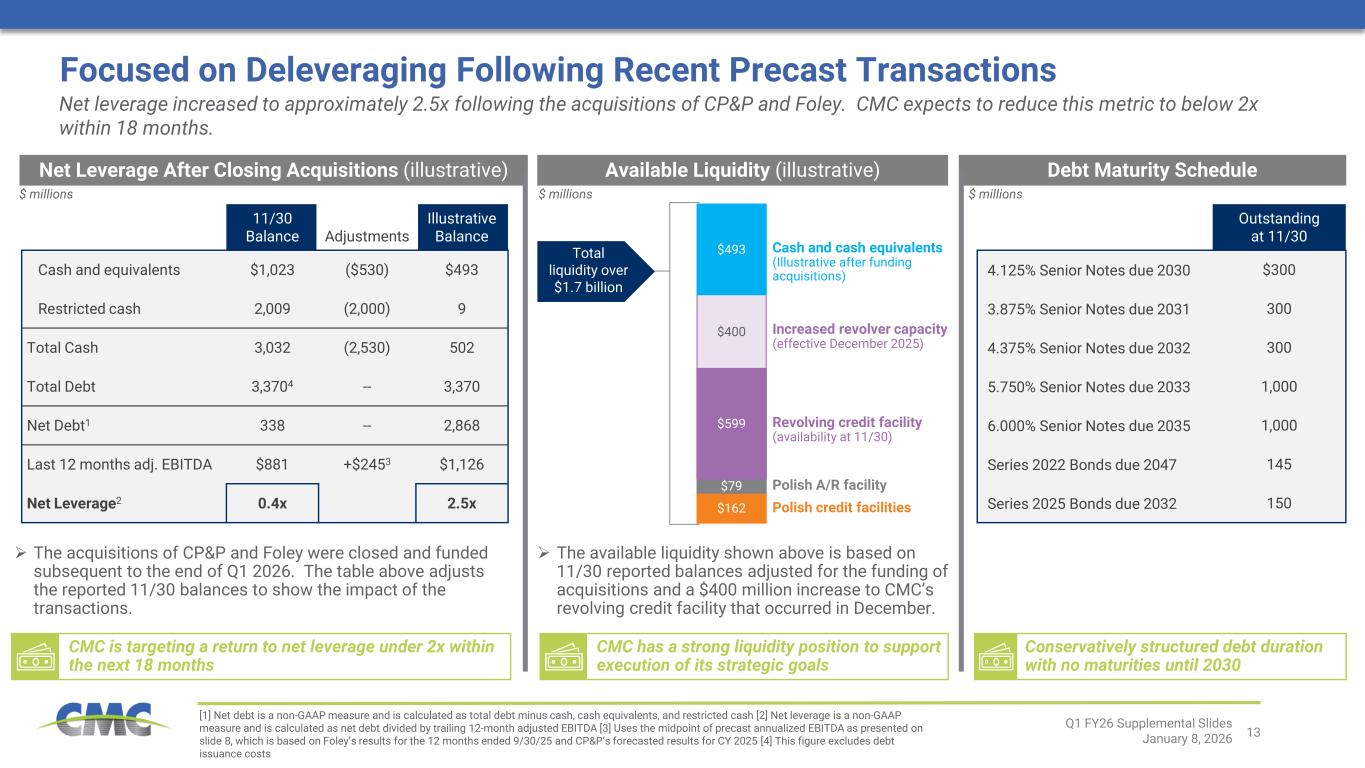
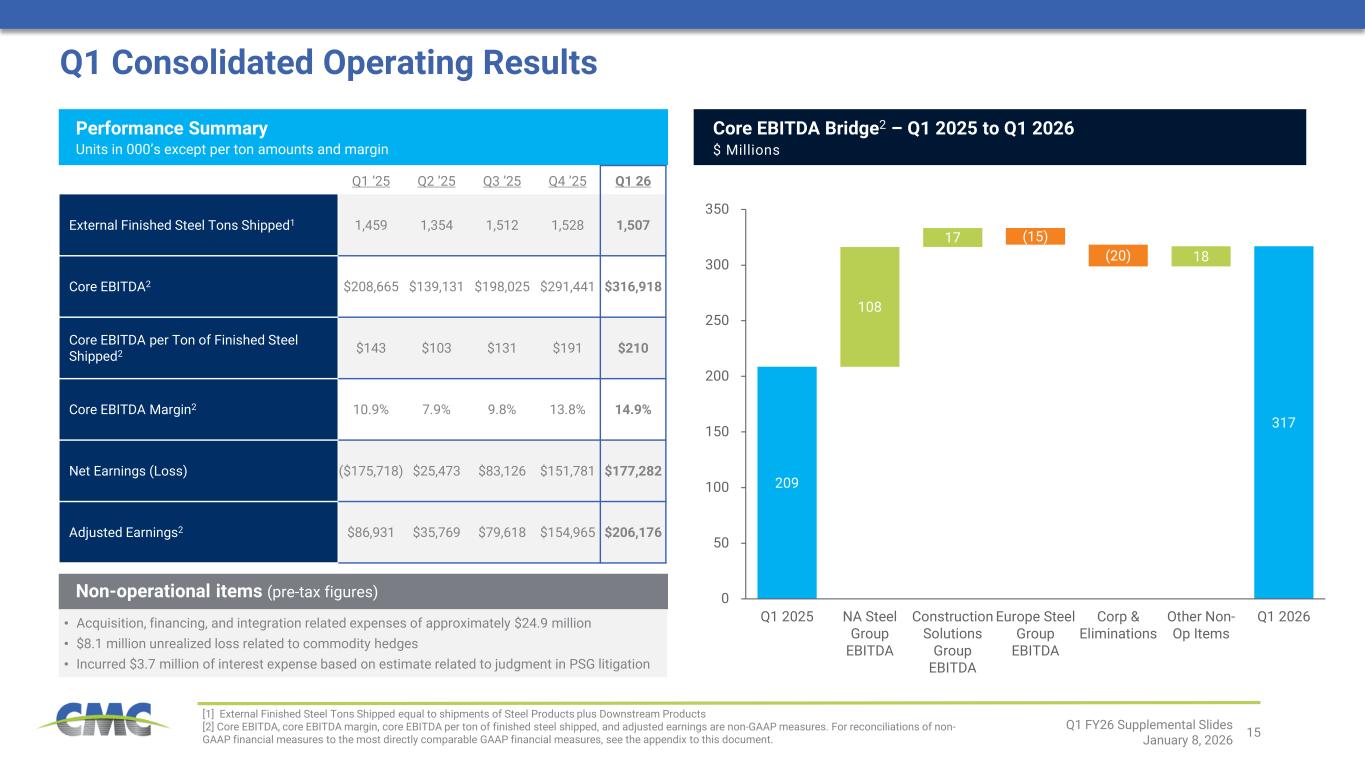
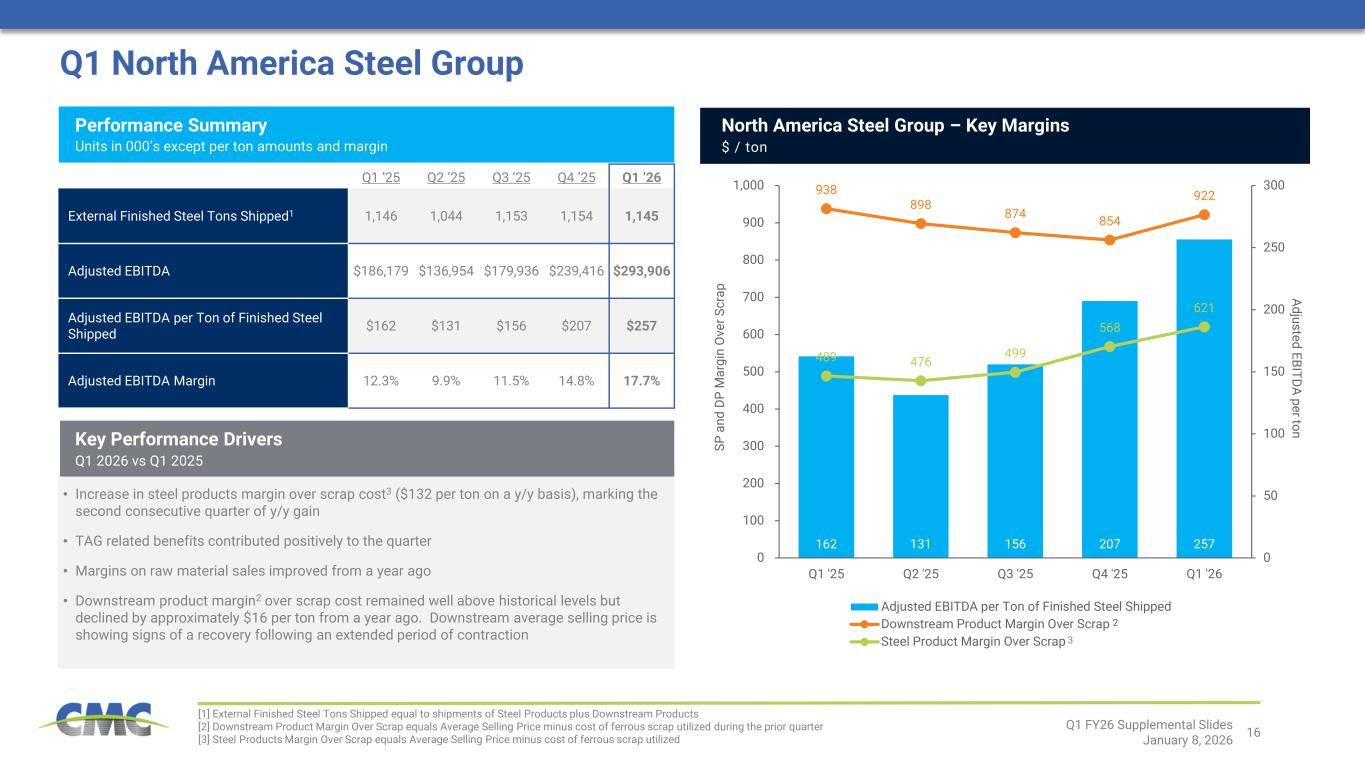
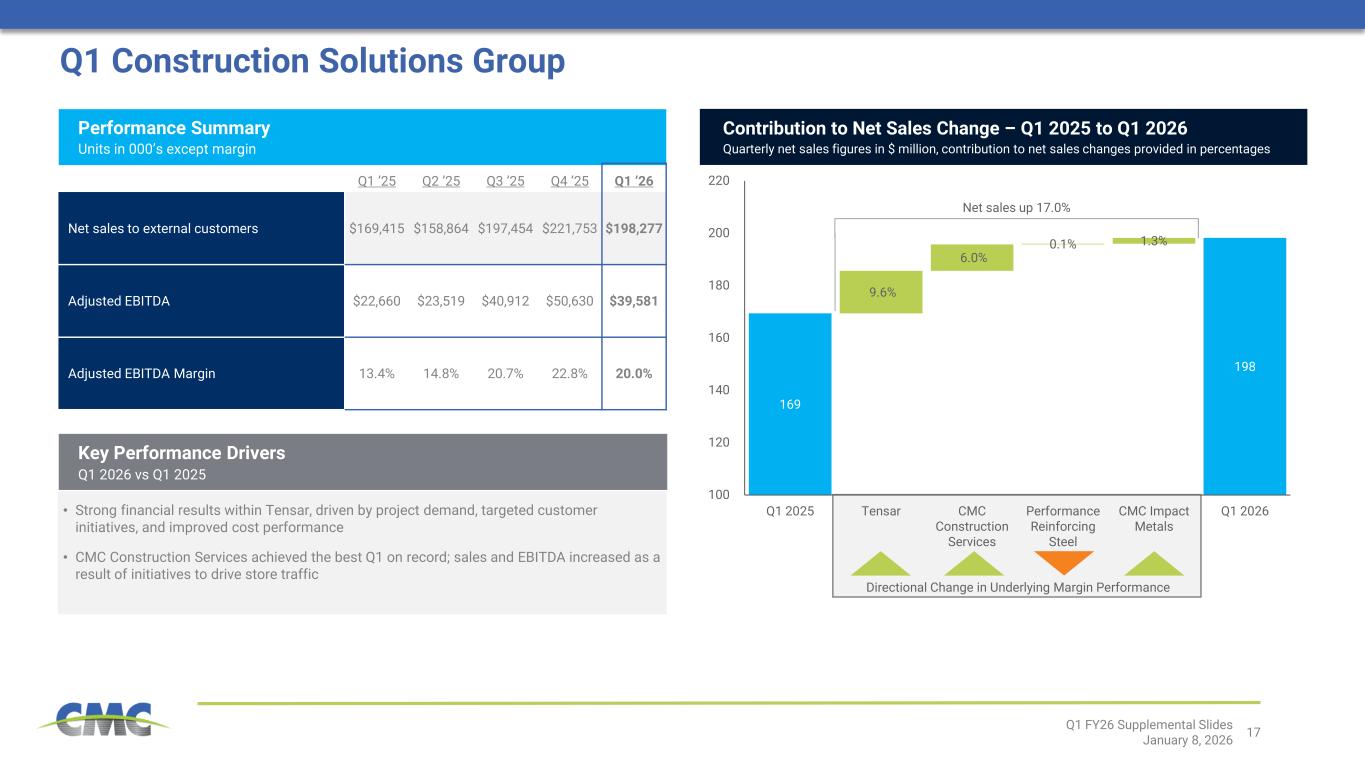
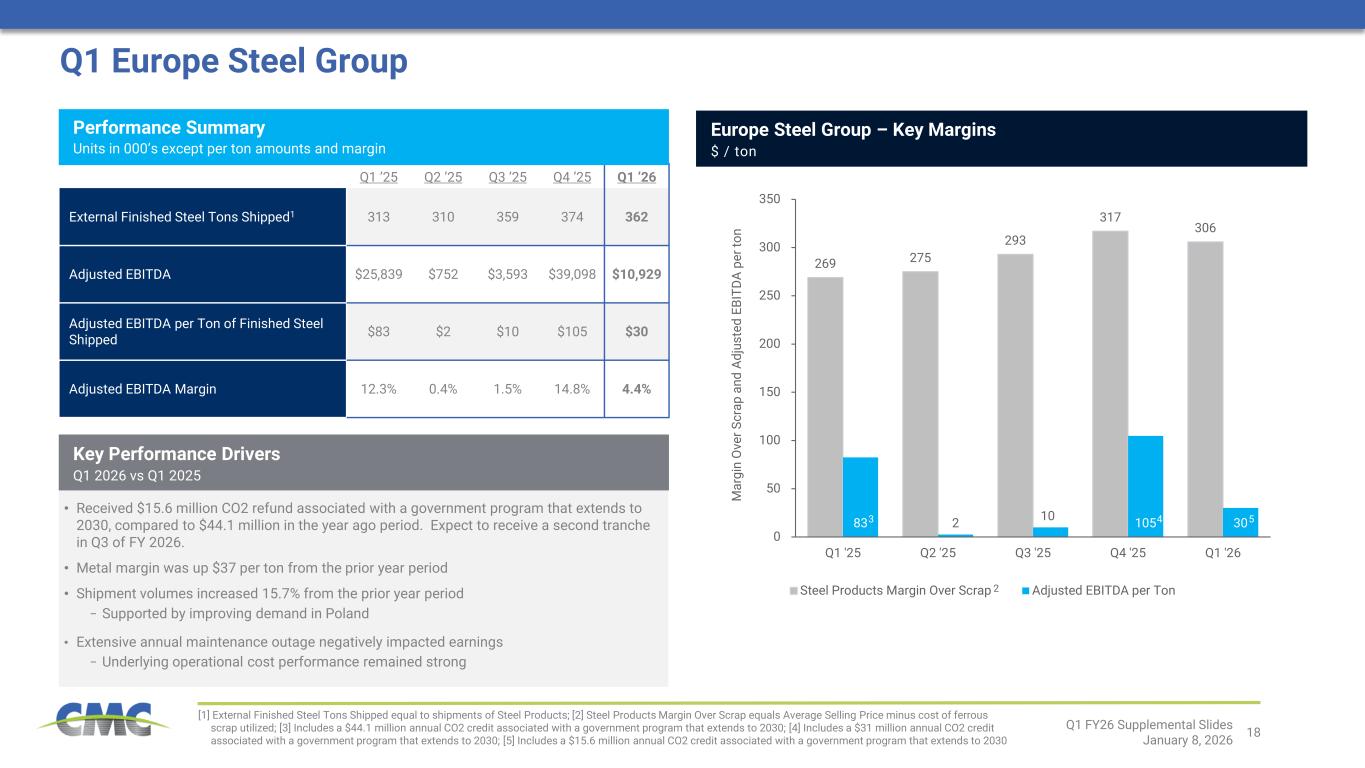
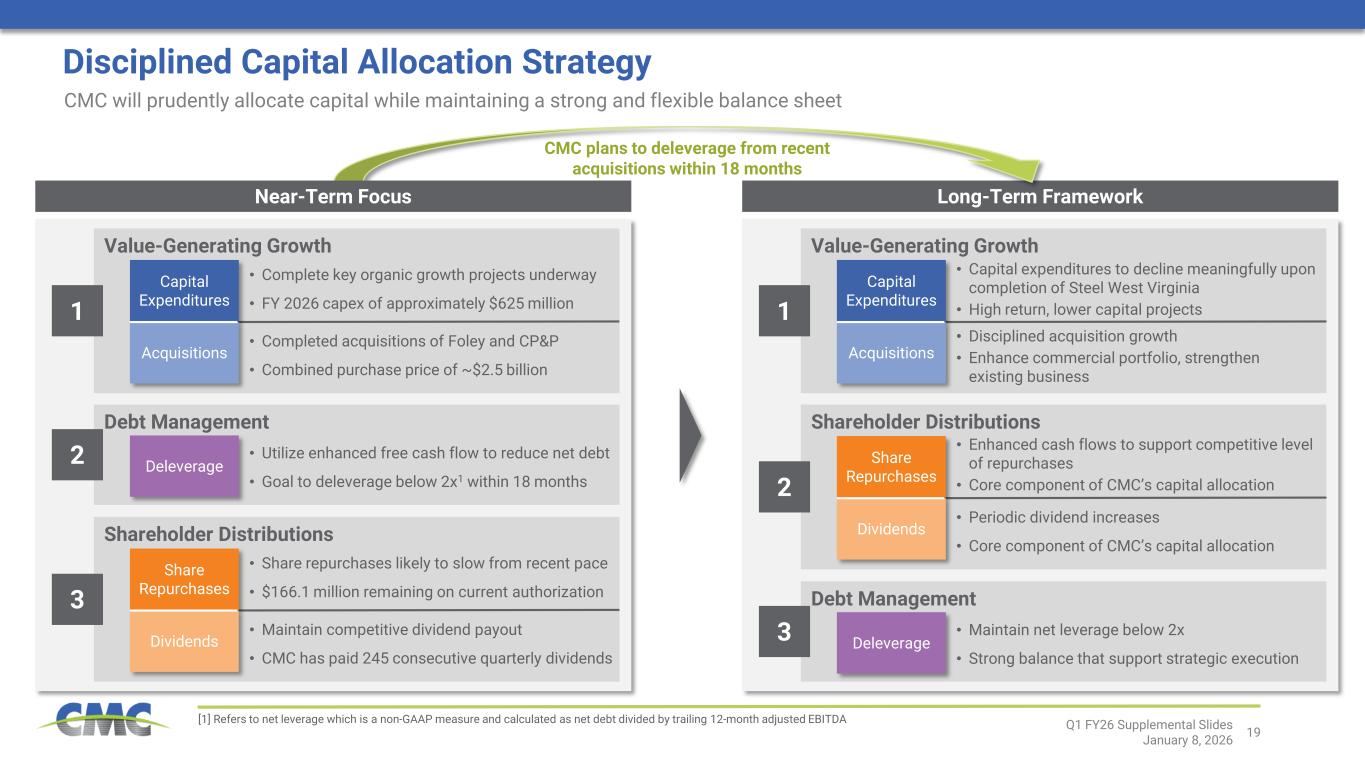
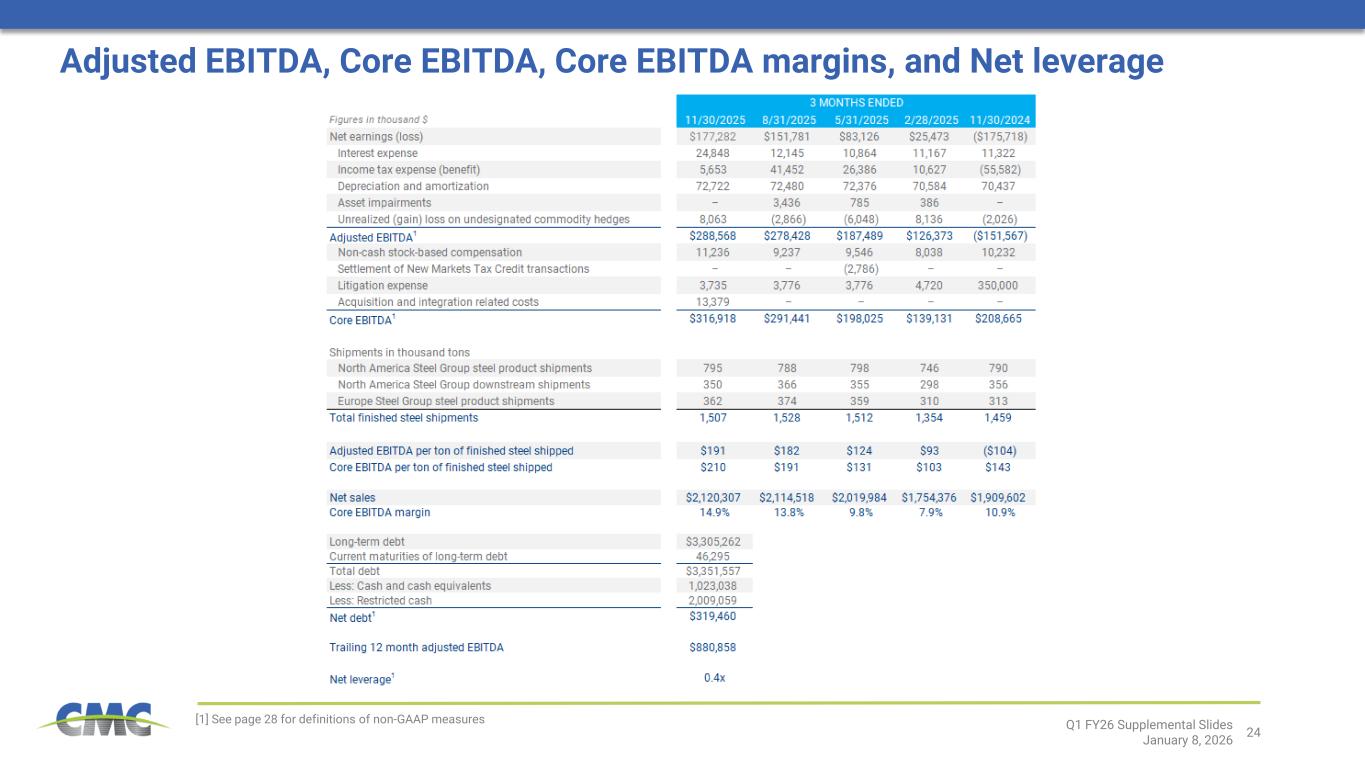
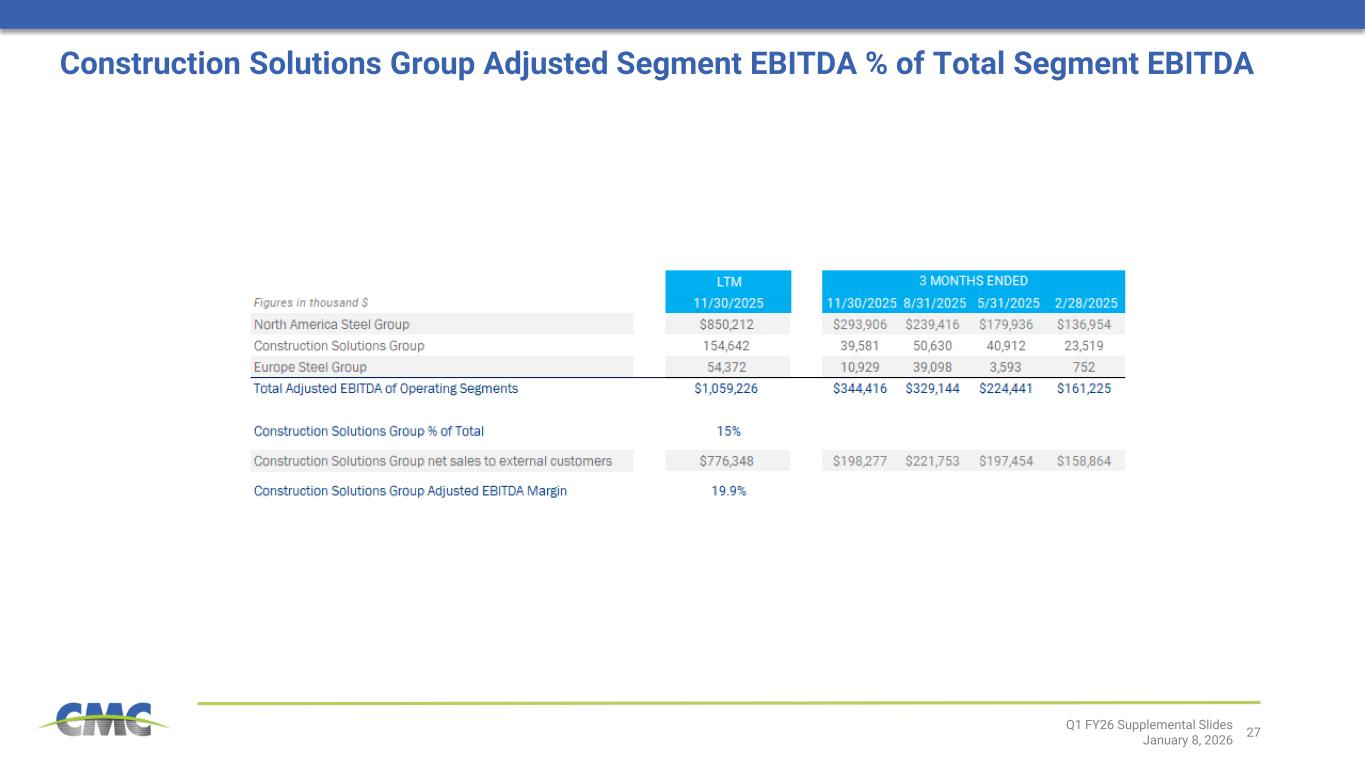
and happy new year to everyone on the call. 177 points there of $1.57 million, $1.9 million related to the acquisitions of CP&P and Foley, $3.7 million excluding these expenses, which amounted to $28.9 million on an after-tax basis, adjusted earnings for the quarter totaled 206 points. Reminder, During the first quarter of fiscal 2026, CMC generated consolidated core EBITDA of $316.9 million, representing a 52% increase from $208.7 million in the prior year. CMC's North American Steel Group generated adjusted EBITDA of $293.9 million for the quarter, equal to $257 per ton of segment-adjusted EBITDA, increased higher margin, resulting in an EBITDA margin of 17.7%, compared to 12.3%, and the financial results also benefited from continued improved operational performance at Arizona 2, as well as contributions from our TAG efforts. As Peter mentioned, we are driving continued gains from TAG initiatives launched during Fiscal 25 and have more recently rolled out commercial initiatives to improve margin capture. The Construction Solutions Group first quarter net sales of $198.3 million grew by 17% on a year-over-year basis. Adjusted EBITDA of $39.6 million significantly increased by 75% year-over-year, driven by strong results from TENSAR and CMC Construction Services, as well as some improvement at CMC Impact Metals from the depressed levels of a year ago. TENSAR achieved its best first quarter financial performance under CMC ownership, benefiting from solid project demand, the positive impact of the sales initiatives mentioned by Peter, and strong cost management efforts. CMC Construction Services likewise profited from self-help measures that drove EBITDA improvement on both a year-over-year and sequential basis. Contributions from our performance reinforcing steel division remained historically strong but declined modestly from recent elevated levels. Construction Solutions Group adjusted EBITDA margin of 20% improved by 6.6 percentage points compared to the prior year period. Our Europe Steel Group reported adjusted EBITDA of 10.9 million for the first quarter of 2026, down from 25.8 million in the prior year period the decline was driven by a lower co2 credit which amounted to 15.6 million during the first quarter of 2026 compared to 44.1 million received during the year ago period the reduction in the co2 credit was the result of the credit generated for calendar 2024 being separated into two tranches one of which which was received during the fourth quarter of fiscal 2025, while the remaining amount was received in the first quarter of fiscal 2026. By comparison, results for last year's first quarter reflected the entirety of the 2023 annual CO2 credit. Including the impact of energy cost rebates, adjusted EBITDA improved on a year-over-year basis on stronger shipping volumes and higher metal margins. shipments grew by approximately 16 percent from the first fiscal quarter of 2025 as a result of continued polish economic expansion and reduced import flows from germany metal margins expanded by 37 per ton largely driven by the same factors during the quarter our polish mill underwent an annual maintenance outage, which incurred approximately $10 million of costs. Dean did an excellent job starting up efficiently following the plan downtime, and similar to recent quarters, continues to effectively manage costs across the organization. I will now discuss CMC's balance sheet and liquidity position as outlined on slide 13 of the supplemental presentation as of November 30th cash cash equivalents and restricted cash totaled 3 billion dollars this amount included approximately 2 billion in proceeds raised through a senior notes offering in November most of which was earmarked to fund the company's purchase of Foley products in December we closed both the CP&P and Foley acquisitions and payments of of approximately $2.5 billion were made. The table on the left-hand side of slide 13 provides an illustrative view of CMC's cash balance, net debt, and net debt to EBITDA, assuming both transactions had closed on November 30th. As you can see, net leverage stands at approximately 2.5 times using combined adjusted EBITDA for legacy CMC and our newly acquired precast business. This is lower than the 2.7 times pro forma figures shared at the time of the fully acquisition with the reduction resulting from the increased EBITDA generation of our business. We continue to be confident in our ability to return to our net leverage target of below below two times within 18 months, and will prioritize de-levering in the quarters ahead. This effort will be aided by strong cash flow generation from the pre-cast platform itself, the wind down of capital expenditures for the construction of Steel West Virginia, and the significant cash tax savings generated by the 48C program and the one big, beautiful bill. Additionally, we have reduced our share repurchases during this period of leverage reduction to amounts approximating our annual share issuance under our compensation program. To quarter end, CMC increased the capacity of our revolving credit facility from $600 million to $1 billion. This will ensure a strong liquidity position to support the execution of strategic goals going forward. Using the same adjustments to our November 30th balance sheet to give effect to the precast acquisitions and also giving effect to the upsized revolver, estimated available liquidity would have been slightly over $1.7 billion. CMC's effective tax rate was 3.1% in the first quarter. Looking ahead, we anticipate a full-year effective tax rate between 5% and 10% for fiscal 2026. As a result of several factors, including our 48C tax credit, bonus depreciation on our West Virginia mill investment, as well as accelerated depreciation on the assets of the acquisitions of Foley and CP&P, we do not anticipate paying any significant U.S. federal cash taxes in fiscal 2026 or for much of fiscal 2027. Turning to CMC's fiscal 2026 capital spending outlook, we anticipate spending approximately $625 million in total. Of this amount, approximately $300 million is associated with completing the construction of our steel West Virginia micro mill, as well as a handful of high-return growth investments within our construction solutions group, and approximately $25 million in our newly acquired precast businesses. This concludes my remarks, and I'll turn it back to Peter for additional comments on CMC's financial outlook. Thank you, Paul.
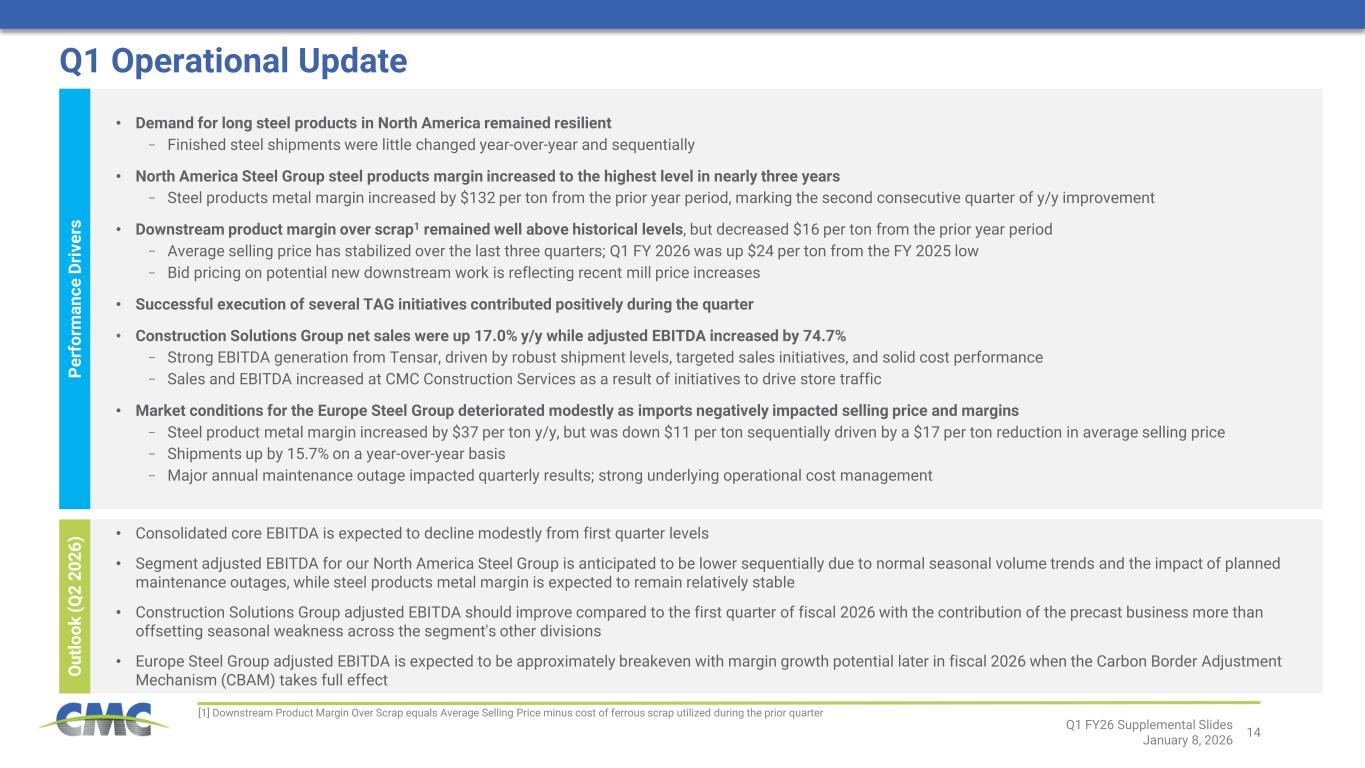
Turning to our outlook, we expect consolidated core EBITDA in the second quarter of fiscal 2026 to decline modestly from first quarter levels due to a normal level of slowdown within our key markets. This will be partially offset by the addition of CMC's recently acquired precast businesses. The company will recognize several acquisition-related expenses during the second quarter, including transaction fees, debt issuance costs, and customary purchase accounting adjustments, each of which will be excluded from core EBITDA. The segment-adjusted EBITDA for our North America Steel Group is anticipated to be lower sequentially due to normal seasonal volume trends and the impact of planned maintenance outages, while steel product metal margin is expected to remain relatively stable. Financial results for the Construction Solutions Group should improve compared to the first quarter of fiscal 2026, with the contribution of the precast business more than offsetting seasonal weakness. A steel group adjusted EBITDA is expected to be approximately break-even with margin growth potential later in fiscal 2026 when the carbon border adjustment mechanism takes full effect. The first quarter marked an excellent start to fiscal 2026, and CMC is well positioned to deliver strong results for the remainder of the year. Solid market dynamics, benefits of our TAG program, and effective operational execution are generating momentum in CMC's existing businesses, which will be supplemented by $165 million to $175 million of EBITDA contributions from approximately eight and a half months of ownership of the precast businesses in fiscal 2026. Looking out longer term, I am confident that CMC will continue to create value for our shareholders as we remain focused on executing against our strategic initiatives, which we expect to deliver meaningful and sustained enhancements to our margins, earnings, cash flow generation, and return on capital. I would like to conclude by thanking our customers for their trust and confidence in CMC and all of our employees for delivering yet another quarter of very solid safety and operational performance. Thank you, and at this time, we will open the call for questions.
Nick
Head of Investor Relations
Thank you. We will now begin the question and answer session. To ask a question, you may press star, then 1 on your touchtone phone. If you are using a speakerphone, please pick up your handset before pressing the keys. If at any time your question has been addressed and you would like to withdraw your question, please press star then two. Please limit yourself to one question and one follow-up. At this time, we will pause momentarily to assemble our roster. And the first question will come from Satish Kassanathan with Bank of America. Please go ahead.
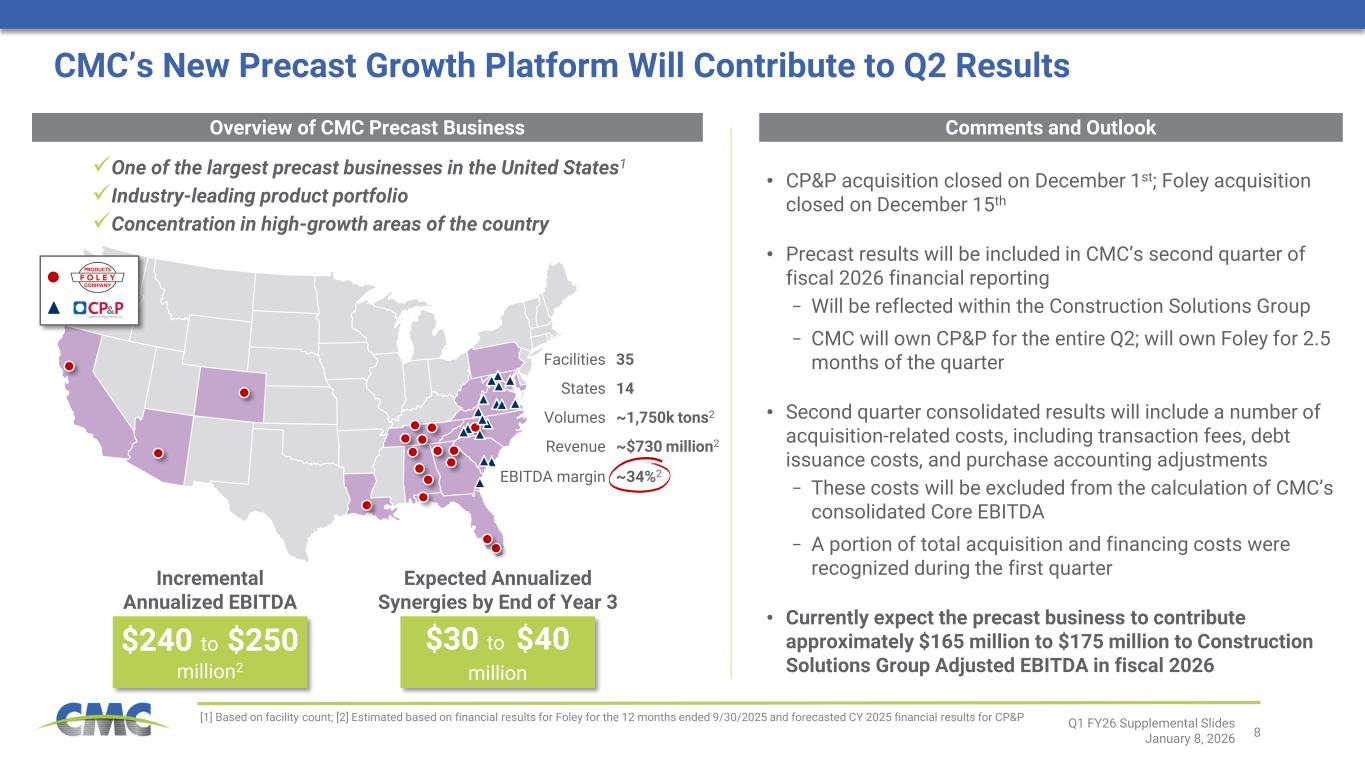
Yeah, hi, good morning and congrats on the strong quarter and as well as the closing of CPNP and Foley equations. Based on what you have seen in the past three to five weeks since the closing of these equations, can you maybe talk about some of the positive or negative surprises you have seen so far? And do you see any potential for acceleration of the three-year timeline to realize the announced $30 million to $40 million in synergies?
Yeah, thanks, Satish. Great question. Again, with the preface that this is early days in our ownership of this business, I would say that we have been really very pleasantly surprised with everything that we've seen, and I wouldn't say there's anything that's really come up that we weren't expecting on the negative side, and I'd say there are a number of things that are on the positive side that we've seen, and let me just give you a little story from one of my trips. I went to a CP&P off-site, and it was a gathering of probably 100 folks from CP&P and then a couple of product experts from cmc um and two remarks i'd make that were i think super gratifying um as the you know kind of new owner of the business first is uh in the room you could have been in a room with cmc folks it was the the cultural affinity is is outstanding um and uh and that that was super uh helpful to see because i think it's going to make our integration efforts uh integration efforts go well. Second was I noted that we brought a couple of CMC product experts and there was a tremendous amount of discussion around, you know, kind of different opportunities that we and CP&P have together and a lot of excitement around that. So that was also super encouraging because it kind of validates the part of our investment thesis. In terms of the synergies, We are, I would say, the work we've done so far leads us to believe that we're very confident that we can get the synergies. What I would say is that it's early to speculate on the timing, and I wouldn't want to accelerate what we've said in the past, but we're very confident the synergies are there, if not more.
Okay, thank you for that. Maybe my second question is on the North American metal margins, which are currently at three-year highs. Can you maybe talk about how you see this margin sustain or improve in the coming quarters, given the context that we expect some new supply to come into the market?
Maybe I'll start on this going backwards and commenting on the new supply. So, you know, there's been a lot of talk about the new supply and, yes, there is new supply coming into the market, I think we've been consistent in saying that we're not overly concerned by the new supply, and that's particularly true in the current context where you've got much lower imports than we've had in previous years. So based on the level of demand as it is today, we feel comfortable that the marketplace can absorb the new supply as it comes in, And if demand gets stronger, which we believe it will, then I think it's fair to say that, you know, there's going to be plenty of demand to absorb any new supply that comes into the market. So we feel good about that. Getting to your question on margins. So in Q2, we would expect mill margins, so our steel product margins, to be flattish. And that is taking into account the fact that we do expect to realize all of the November $30 price increase, but we also have seasonally stronger scrap in this period, and that will offset some of that. And in our downstream, we could see, I think we think it's going to be flat to, could be slightly down given the, you know, kind of the raw material pass through to the fabrication business. But as we go forward, I think the shape of the margins is really going to depend on a couple of factors. One is obviously the supply demand that emerges in the marketplace. And the second is really our TAG initiative. And I think this is an important point to make on TAG because, you know, TAG is all about growing margins in a sustainable way across our business, and we expect that some of that TAG contribution is going to come in the form of benefiting metal margins as we go forward. So we're very excited about that, and I think as we go into the back half, you know there's been a merchant price increase, $50 a ton. We should see a little bit of that in the second quarter, but really most of it is going to be in the back two quarters, and any other pricing actions will really set us up for a strong back half of 2026.
Okay. Thank you. I appreciate it, Nikola.
Nick
Head of Investor Relations
The next question will come from Katja Jankic with BMO Capital Markets. Please go ahead.
Hi, and a happy New Year to everyone. Maybe staying on the more near term, so you expect seasonally volumes to be impacted by seasonality. But can you talk a little bit about what that actually means? Because it seems that so far we haven't really seen a material impact from seasonality.
Yeah, it's a great point. We did have stronger volumes, honestly, than we expected in the first quarter. But going into the second quarter, we are expecting kind of typical seasonality. And remember, in the second quarter, we've got the winter conditions, construction slows down, and typically there's been a, you know, going Q1 to Q2, there's a 5% to 10% decline, and we'd expect to be in that range. But I will acknowledge that, you know, the volumes have been stronger heretofore.
And then maybe on the West Virginia mill, Can you update us what the plan, the ramp-up plan there is?
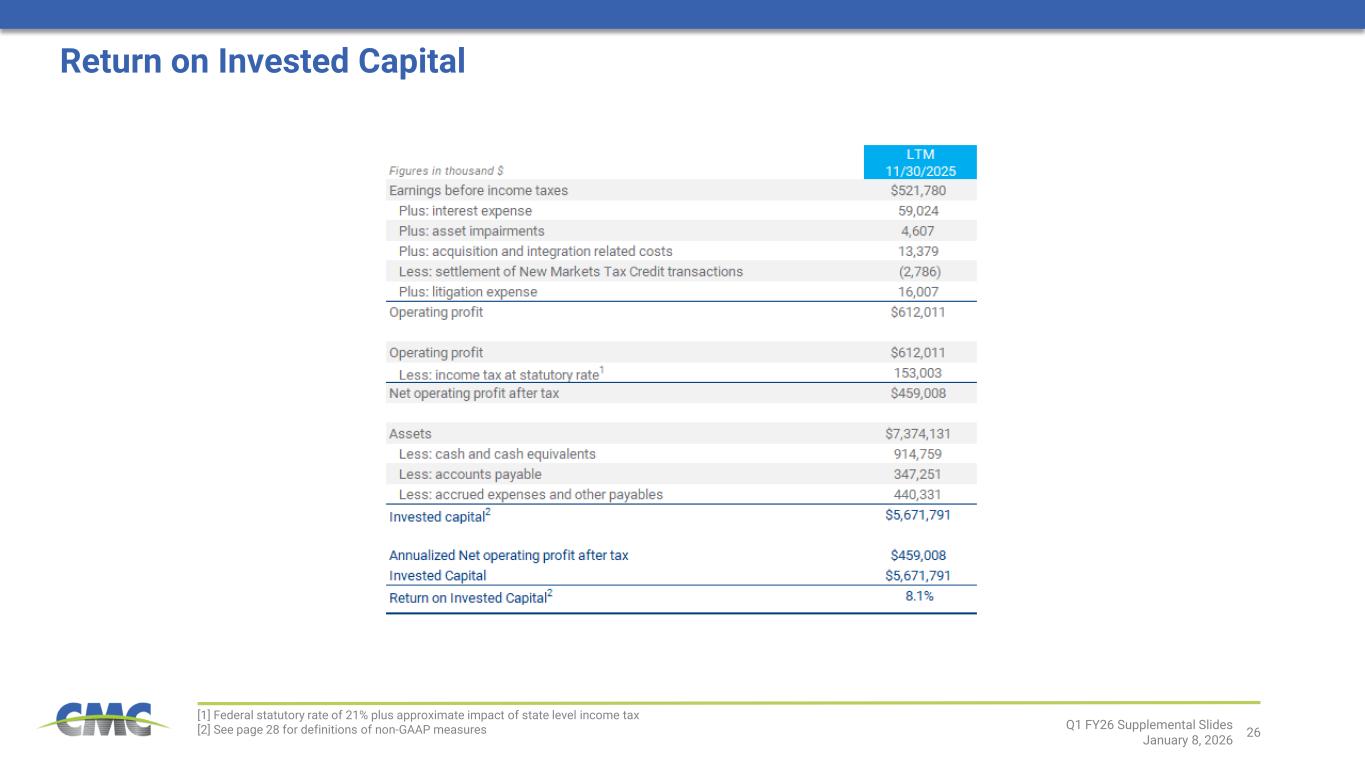
Yeah, we're super excited about that. You know, you start one of these projects, and it seems like a long way off, and now, you know, kind of we're within six months of the startup. So we've actually started some of the cold commissioning already. The hot commissioning, which is, you know, the official startup is, as Paul noted, likely to begin or will begin in June of this year. And we feel really good about it. And just to comment on West Virginia, you know, given the market conditions, we couldn't be bringing that on at a better time. But the other thing I think that really bears note is the fact that we are bringing this project in on budget. And I have to say hats off to the whole West Virginia team for the incredible capital discipline that they've shown in this project. You know, these are big-dollar expenditures. You know we're spending over $600 million on this project, and there's a lot of examples of projects that are kind of over budget. And thanks to the discipline that everyone's shown, we've managed to bring it in. And ultimately, that helps us from an ROIC perspective, which you know is a critical objective for us to improve.
Gotcha. The only thing I would add to Peter's comments is just recall from a startup perspective, this is a rebar-only mill, different from Arizona 2. And so typically based on our other rebar-only mills and the fact that this is not near the degree of new technology being introduced as with AZ2, we would expect to ramp the operation up over the following 12 months once we meet that hot commissioning startup.
Nick
Head of Investor Relations
The next question will come from Tristan Gresser with BNP Paribas. Please go ahead.
Yes, hi. Thank you for taking my questions. The first one is on the old EBG division. If you can talk a little bit about the outlook for fiscal Q2, also more specifically what kind of seasonality usually do you see on the precast business is it fair to assume a normalize the bid that quarterly run rate for precast and add a bit of I mean because tenser has been pretty strong as well so I would assume maybe a bit stronger on that division but yeah we
love to have your you thought on that yeah so thank you for the question tristan um so ebg uh typically there is as we've said before there is absolutely seasonality in that business it's you know as we noted in the uh prepared remarks a substantial portion of that the most the lion's share of that is going into construction markets so seasonality is definitely a factor in rq2 is the weakest period um and i should note that tents are in particular with ground stabilization is most seasonal as we look at that business from year to year. So I think you can expect normal Q2 seasonality in that. Precast, so in our precast business, we think that will largely follow the seasonality that we have in our business overall. And what I mean by that is our steel business overall. Typically, you've got in the winter months, you've got a reduction in the amount of activity that you see, and we expect that to be the case, too. So this is maybe not part of your question, but I'll go to it directly to say we expect in the second quarter the precast business to contribute about $30 million of EBITDA, roughly speaking, which will seem lighter, And that goes entirely to seasonality. And as Paul noted in his comments, the backlogs that we're seeing are very strong. They're stronger than last year. And so we feel very good about the prospects for that business going into our ownership in 26.
No, that's very clear. And going back to your proposed remarks on scrap sorting, how much of a benefit it's been, and can you give us some numbers in what you've been doing and how has it changed today versus what you used to do in the past in terms of using less scrap and varying the quality of the scrap, any color there would also be great.
Yeah, I mean, I'll start and then Paul can jump in with any additional comments. But I guess what I'd start by first saying is that in the past, we talked about the scrap optimization being, I think it was a $5 to $10 million opportunity. And that has grown substantially. And I think the key point is that we started out in a couple of mills, and now we're pushing it to other mills. So we're getting the benefit across a broader footprint. And there are two points, as you said. One is in the quality of the scrap. We've done a tremendous amount of work in the quality of the scrap, and we've identified places where, for example, we're using a lot more shred than we need to use. So we can cut back on the shred, and that obviously kind of reduces scrap costs and so forth. We've also done a tremendous amount of work on yield, and that has helped us a lot in terms of obviously using less scrap to produce the tons and sell the tons that we want to produce and sell.
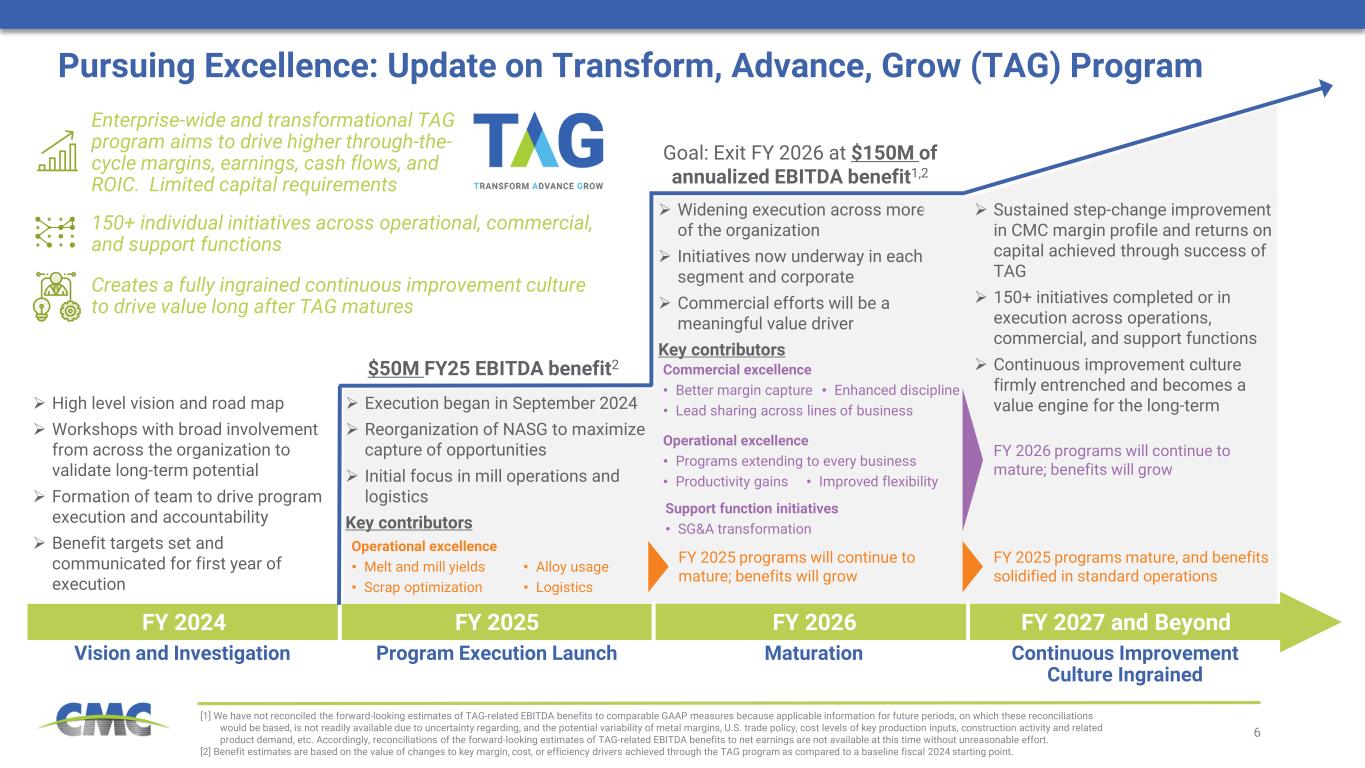
Paul, anything to add? The only thing I would add, Tristan, is, you know, as we've noted, what we achieved last year was approximately $50 million from TAG, And I would say those two initiatives, just given the dollars involved that Peter outlined, probably were near half of the realization that we had last year. And as Peter said, those were on, you know, piloting the initiatives in a few locations and growing throughout both 25 and 26 and incremental number of mills to get it across the entire platform. And so we are very excited about the opportunity of those initiatives to continue to contribute well to our business.
One thing that's maybe worthy of an additional comment vis-a-vis TAG is, and this goes for a lot of our TAG initiatives, you know, what we found is that on something like scrap optimization, it started out in one mill. And then you start to see these real benefits in the mill. And, of course, every mill manager wants to run their mill as well as they possibly can. So there's been this kind of compounding effect as more of the mills take it on and bring it into full bloom. And that's, I think, a characteristic of the TAG program in general. And one of the things that we're super excited about, we see new initiatives coming in and, you know, sizable new initiatives coming in. And we've got to build charters and plans around these different initiatives, but you can see how this can be really a game changer. And as we've talked about in the past, again, the goal is long-term sustainable margin improvement over what we would be otherwise, right? So if X was our historical margin, we want to be at X plus Y. And we're working internally on some tools to help you all define that, but we believe that there is through TAG the opportunity to make our business durably better, and I think that will be a really important contributor to value.
That's very helpful and interesting.
Nick
Head of Investor Relations
Thank you. The next question will come from Alex Hacking with Citi. Please go ahead. Yeah, hi, thanks. Good morning. Happy New Year, everyone.
I guess first question, you know, you mentioned increased commercial selectivity in RebarFab, and part of that was about reducing risk. Has counterparty risk been rising, and is there a reason why? Thanks.
Why reduce – let me just make sure I understand your question. Why we're addressing that point?
sorry the question was um has counter-party risk been rising and and why is counter-party risk
been rising if it has been rising yeah i wouldn't say it's been rising i would say this is a a risk that we have taken historically that we are looking to reduce in the portfolio and where it manifests itself is alex's um in our fabrication business and some of the uh contracts will be asked to do longer-term jobs. And a lot of times those longer-term jobs can be at a fixed price. And of course, our raw material inputs can change. So you can get out two years or three years, and there have been some instances with this company in the past, and I'm sure others, where you can get upside down on a project. And what we're trying to do is to reduce that risk by making sure, either through proper escalators, proper indexing, that we are being compensated for that risk so that, again, it goes back to the ROIC point, that in any environment, we are generating a good return on the capital that we put in, which is, you know, substantial in a business like this.
And just to reiterate and make sure it's clear, you know, counterparty risk, We have historically never had an experience of significant counterparty risk, and nor do we see that really going forward with the structure of how the construction contracts are written. This is all about reducing the risk, as Peter said, around margin preservation and ensuring we're getting a good margin on the job.
Oh, I get it. Thanks for the clarification. I guess I misinterpreted. And then on Europe, you know, as you mentioned, importers, you know, have been getting ahead of CBAM. Do you have any idea, like, how long, how many quarters it could take for prices in Europe to start benefiting from CBAM?
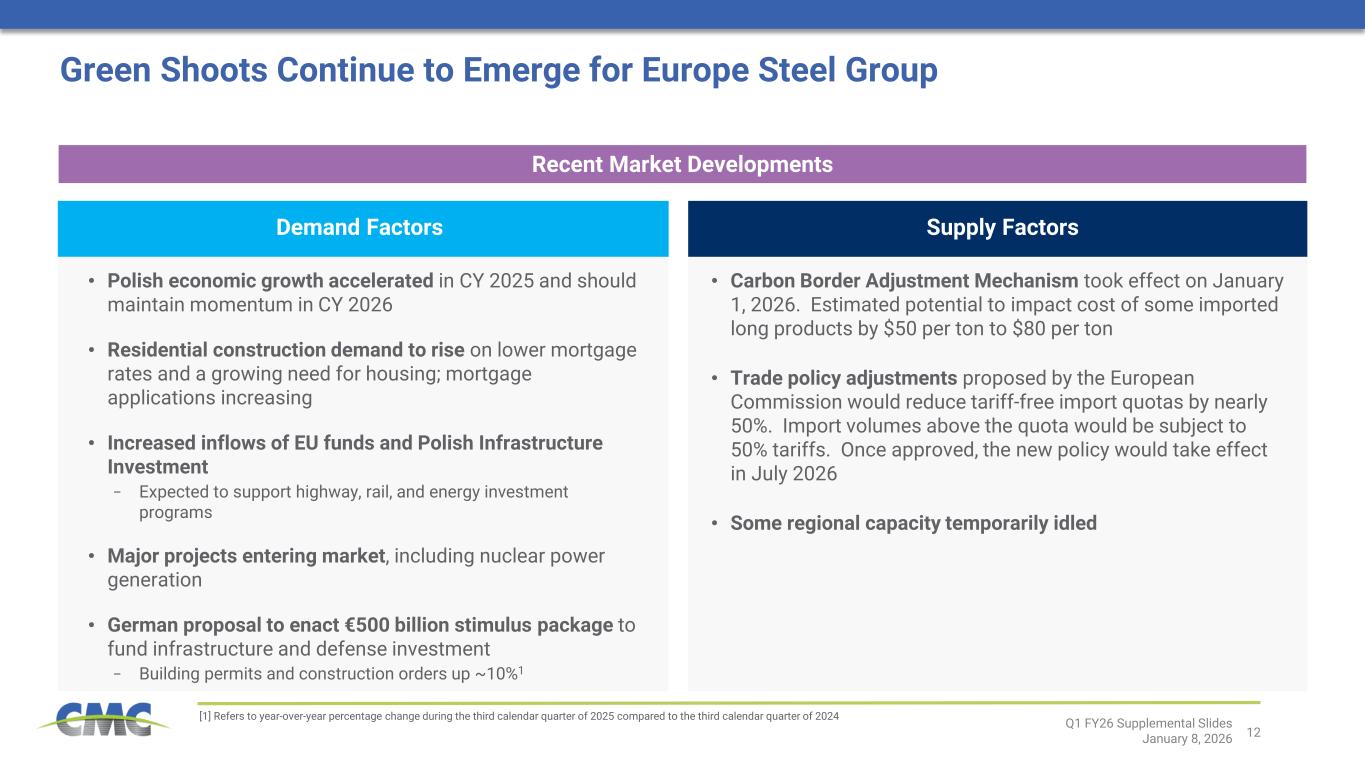
So, again, it took effect January 1. and our read on the situation is for certain importers the average impact on them could be 50 euros a ton and and for for many of them it could be higher initially because they have to be qualified to get to the 50 euros a ton and before they're qualified there's a default rate that's even higher. So this is going to play out over the course of calendar 2026. I think it's fair to say you've probably noted in the import numbers that there was a large, there was a kind of a large pre-buyer of incremental tons coming into Europe that probably, you know, before CBAM, excuse me, that will probably delay the impact of the CBAM credit that we should be getting. But I do believe in the, by the time we get to the, we'll get a little bit of it in our second quarter and in our third and fourth quarters, we should see a substantial portion. And certainly over the course of the year, the calendar year, it should roll in. The other thing, too, to note is that in addition to the CBAM, there is also this safeguard mechanism that was renegotiated by the EU. And the safeguard mechanism, remember, that's effectively a quota system. And in the revised safeguards, the quotas are reduced by 50 percent, and the tariffs for being above the quotas are increased by 50 percent. That should come into effect in the middle of the year, and that should be only additive to the situation in Europe. And just to frame it a little bit for you, you know, if you think about our production capability in Poland and you think about the $45 million of CO2 credits we get, that's about $30 a ton above our breakeven operational performance today. and then add 50 euros to that, all of a sudden you start to get to numbers where we are running at levels at or above our through-the-cycle performance. So, again, this is not something that's going to happen overnight, but in addition to all the other catalysts in Poland, I think it's reason for some real optimism.
Thanks, and best of luck.
Nick
Head of Investor Relations
the next question will come from timna tanners with wells fargo please go ahead
yeah hey good morning and happy new year um i wanted to tailor my questions to trade so um you talked about the cbam implications helping pricing but i think another aspect of cbam is that it helps domestic uh producers in europe perhaps take some market share so curious about you know what volume impact you might see there and then i have a follow-up on the u.s trade side
I think that it's a fair point that you're making, and I think there are some volume opportunities. We have been running at, I would say, a relatively good rate of production recently, so I think there is some volume opportunity for us, but I wouldn't say it's huge at this point.
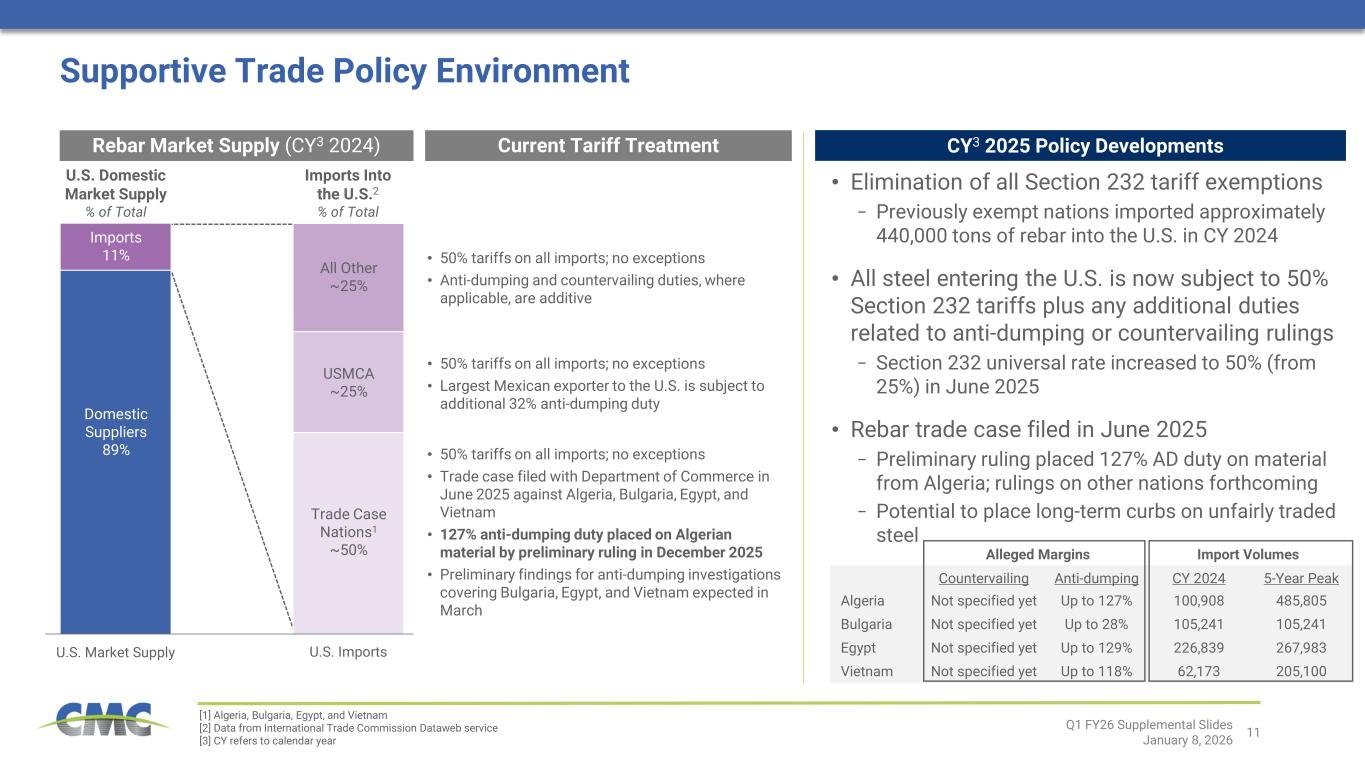
Okay, great. second question on the um u.s side i know you mentioned of course algeria bulgaria egypt vietnam but if you look at the latest trade data actually imports are coming again from turkey and from what i think uh portugal and spain so just any thoughts on on the turkish side and also maybe portugal and spain keep more production domestic and that falls off but it does seem like The other countries before you mentioned are already shrunk in terms of importance, probably because of the filing of the case, even before any decision.
Yeah, no, it's a great point. We've definitely seen some pullback in the imports from those countries. And I'll just remind you and others that those countries in 2005, the trade case countries imported about 500,000 tons of steel into the U.S. So if there was an outcome that's anything like what we have on the Algeria case on a preliminary ruling, I think that's going to be really helpful in terms of keeping those imports out of the country. And remember, on those trade cases, these are five-year terms before the sunset review. So it's quite a durable point. I think to your question on Turkey, We have noticed that Turkey has increased their shipments. We'll have to watch that. Again, in the context of overall imports today, we're not overly concerned about that. But, again, we'll be watching that carefully to make sure that what they're importing, they're importing as a fair trader.
Got it. Yeah, it seems like imports could take yet another leg down. But thanks for the color and all the best.
Nick
Head of Investor Relations
The next question will come from Bill Peterson with J.P. Morgan. Please go ahead.
Yeah, thanks, everyone. Happy New Year, and thanks for all the color on the call thus far. I wanted to ask about AZ-2, how the ramp progressed during the prior quarter and what utilization you're running at, and then how should we think about operations and utilization ahead?
Yeah, AZ2, we've said in the past that this has been a challenging one, and my comments will cover that a little bit. But I think the important point is we reached profitability on EBITDA in the fourth quarter, and we were nicely profitable in the first quarter, too. And we expect to be nicely profitable throughout the year there. In terms of utilization rates, we exited last year at about 60%. We expect to demonstrate a full run rate during our fiscal year, 2026, but we don't expect to be at full run rate in 2026. And that is because we still have a number of merchant specs that we've got to perfect, and that's going to take some time, and it'll force us to run at, you know, kind of suboptimal utilization. But we feel good about where we are. There's still some challenges there, to be clear, but the team has done an incredible job. And this is where I think the CMC team really shines because we have drawn people and expertise from all across our network to help us with this operation. And remember, the challenge is this isn't your grandfather's steel mill, so to speak, right? This is a, you know, very innovative steel mill. It'll be a workhorse in our portfolio, but there's a lot of new technology to make work. And the other challenge that we've had there, Bill, is just with the people, not from the vantage point of the people are good, the people are great, but it takes some training to learn this. And so we've done a lot of work around training, and I think that's enhancing our reliability substantially, and it will continue to do so as we go through the year. So hopefully that helps you.
Yeah, it does. Thanks for that. And then my second question, can you speak a bit more to the pricing profile of your downstream backlog and whether new order entry continues to be priced higher than what's in the backlog? And I guess to what extent is the commercial discipline slash, you know, tag initiatives you spoke of earlier playing a role?
Yeah, absolutely. So we do continue to see prices improve in our downstream. So we have been really for the last couple quarters putting new orders into the backlog at higher prices. So that continues, and we feel good about that progression. And actually kind of starting out the year, we've had a couple of new orders that have come in in a really nice place. So I think we feel good about that. And, again, demand in that business remains very solid. And so there's a lot of project activity and a lot on the drawing board. So we're optimistic about where things go there. Yep, thank you.
Nick
Head of Investor Relations
The next question will come from Carlos de Alba with Morgan Stanley. Please go ahead.
Yeah, thank you very much. Happy New Year, everyone. So maybe just adding to the discussion on the new commercial approach in the publication business, how much of your business is already in this indexed format where you are able to maybe better protect your margins? And how do you see that evolving in the coming quarters if it's still not a big percentage of the overall business?
Yeah, it's not a big percentage today, and the openness to it among the customers can vary, right? So there are some DOTs, for example, that are more inclined to it than others. So we're working from a relatively low base on that, but we do see the opportunity to increase it and to open the dialogue with customers on indexation. And indexation is just one of the strategies, right? The other obvious strategy there is just proper escalation. And when you talk about commercial excellence, one of the things that we've been, I think, showing the team's done an amazing job on being more disciplined about this is in making sure that, number one, we have proper escalators in place, and then, number two, that we're actually enforcing those escalators as we go through, you know, kind of go through the period. So this is a journey. But, you know, the way we think about it internally is that over time, it doesn't make sense for companies like CMC to take this type of risk in the way that we've been taking it. And over time, we will work towards reducing that. And that'll, again, contribute to higher margins through the cycle, higher returns, more consistent returns, all the things that we're pointing towards.
And, Carlos, I'd just add, you know, what we've spoken of is really around protecting the risk from a duration perspective. There's also, you know, recognizing the value that CMC brings from a reliability perspective, and I think that is also critical in terms of our capabilities and ensuring we get value for the service we bring, there's a tremendous amount of risk to a construction project that comes with all the subcontractors. Having a reliable partner, as CMC is, drives a higher value recognition, and we've got to make sure we capture that.
That makes sense. And then what is the EBITDA margin that your $160 million to $170 million EBITDA guidance for CSG represent, and would you say that this guidance, this EBITDA guidance is somewhat conservative, given that you're just starting to take over those assets?
I mean, Paul, you can comment on the margin, but I would say, look, it's early days, right, and we're doing a lot of work on integration. As I said at the very beginning, we feel kind of good about what we've seen. But, you know, there's some adjustment that has to happen as you bring a new company into our company. And so maybe we're being a little bit conservative, but I think it's appropriate to be cautious. And again, you know, our goal with all of you and with all of our investors is to be in a situation where we are under-promising and over-delivering, And that's what we're shooting to do here.
And as far as the margins are concerned, you know, it'll be made up of the two buckets. You know, our existing business typically is in the high teens, so call that 18% to 20% margin. We would expect that to remain there. And the precast business to come up, combination of the two entities to be in the 30% to 35% range from a margin perspective. So no change. Obviously, it's just a different mix going forward than what we've had historically.
Yeah, great. Thank you, Paul. Yeah, I misspoke a period of 165 to 175 EBITDA guidance. It's not for CSG. It's for the pre-Casbians. So thank you very much. Good luck.
Nick
Head of Investor Relations
The next question will come from Mike Harris with Goldman Sachs. Please go ahead.
Yeah, good morning. Thanks for squeezing me in. Just one quick question on my part. When I look at the TAG program, I think last quarter, the expectation for the expected run rate annualized EBITDA benefit at the end of 26 was greater than 150. And now you're saying 150. So, does that change just the function of timing, or did you adjust your initiative list, or just being conservative?
No, I don't think it was greater than 150. I think we have moved towards 150 as we've gotten more clarity on the opportunities in TAG. And by the way, as we've said in many other forums, this is just the beginning, right? So it's not like 150 is the end. as we get more fidelity around this that we will we will share more what we're you know what we're really doing in tag is we're trying to build durable margin improvement so you know rather than throw lots of programs in that we haven't fully vetted or we haven't done the work to make sure that they deliver and they deliver in a sustainable way we're you know we're proceeding a little bit more slowly, but I think the outcome will be something that's more lasting.
Okay. Thanks a lot for that clarification.
Nick
Head of Investor Relations
The next question will come from Phil Gibbs with KeyBank Capital Markets. Please go ahead.
Hey, good morning. Sorry if this question was asked earlier, but what is the typical seasonality of the North American business from a volume standpoint relative to Q1?
It's in the 5% to 10% range that we would expect. Obviously, that is very much weather dependent, and we've seen some inclement weather in the West Coast, certainly. Nationally, it's been pretty good so far, but we were only in the early innings of the winter. So typical is 5% to 10%, and that's what we're guiding towards.
Thank you. And then in terms of integrating just baseline depreciation, I'm assuming you're going to have some write-ups associated with the precast deals. I think your baseline for DNA was like $70 or $75 million in Q1. So what should we be anticipating for Q2?
Yeah, it's a great question, Phil. And, you know, as we have owned these businesses just for a short period of time and the complexity of some of the purchase accounting, we're not in a place from a DNA perspective, well, really an amortization perspective to provide guidance. There's, you know, a lot of intangibles associated with the businesses, and they all have different valuation approaches and durations. What we know is cash flow. The cash flow of these businesses will be certainly very attractive, as we outlined at the acquisition. We were able to achieve the financing at very attractive rates in November and excited about the conclusion of the financing. But as far as the accounting, we are not yet in a position to really provide much outline in terms of what the amortization will be. Thank you.
Nick
Head of Investor Relations
At this time, there appear to be no further questions. Mr. Matt, I'll now turn the call back over to you.
Thank you, Nick. At CMC, we remain confident that our best days are ahead. The combination of structural demand trends, operational and commercial excellence initiatives to strengthen our through-the-cycle performance and value-accreditive growth opportunities create an exciting future for our company. Thank you for joining us on today's conference call. We look forward to speaking with many of you during our investor calls in the coming days and weeks.
Nick
Head of Investor Relations
The conference has now concluded. Thank you for attending today's presentation. You may now disconnect. Thank you.