Operator
Thank you for standing by. At this time, I would like to welcome everyone to the Lincoln Financial First Quarter 2026 Earnings Webcast. I will now turn the call over to John Muething, Head of Investor Relations.
Speaker 1
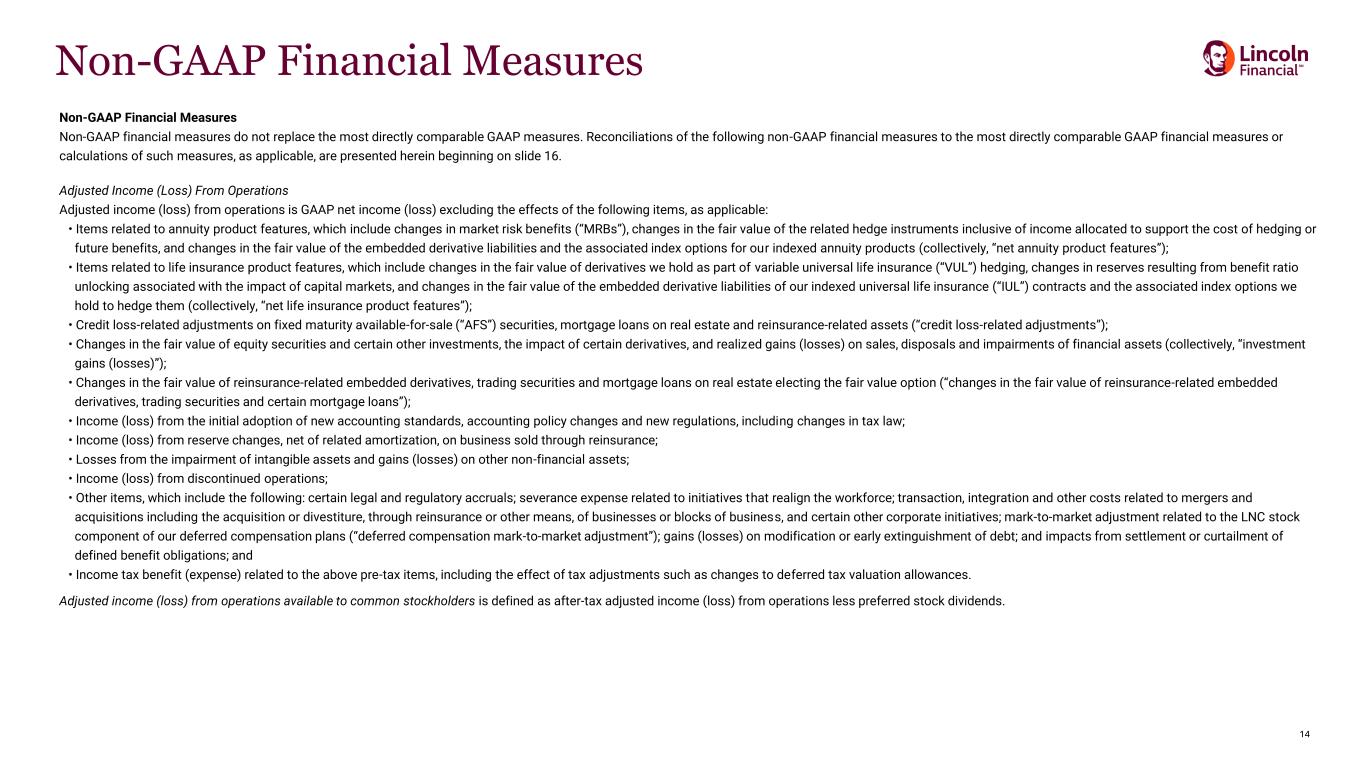
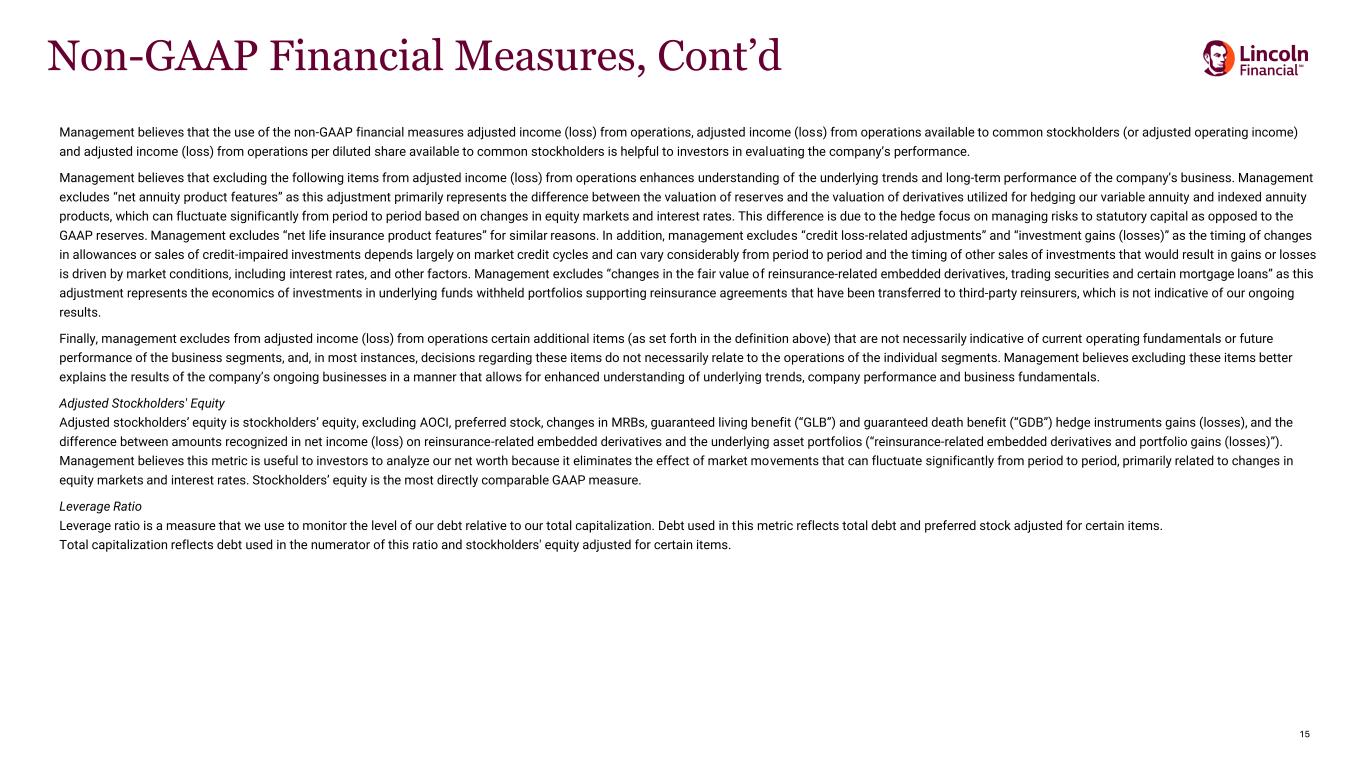
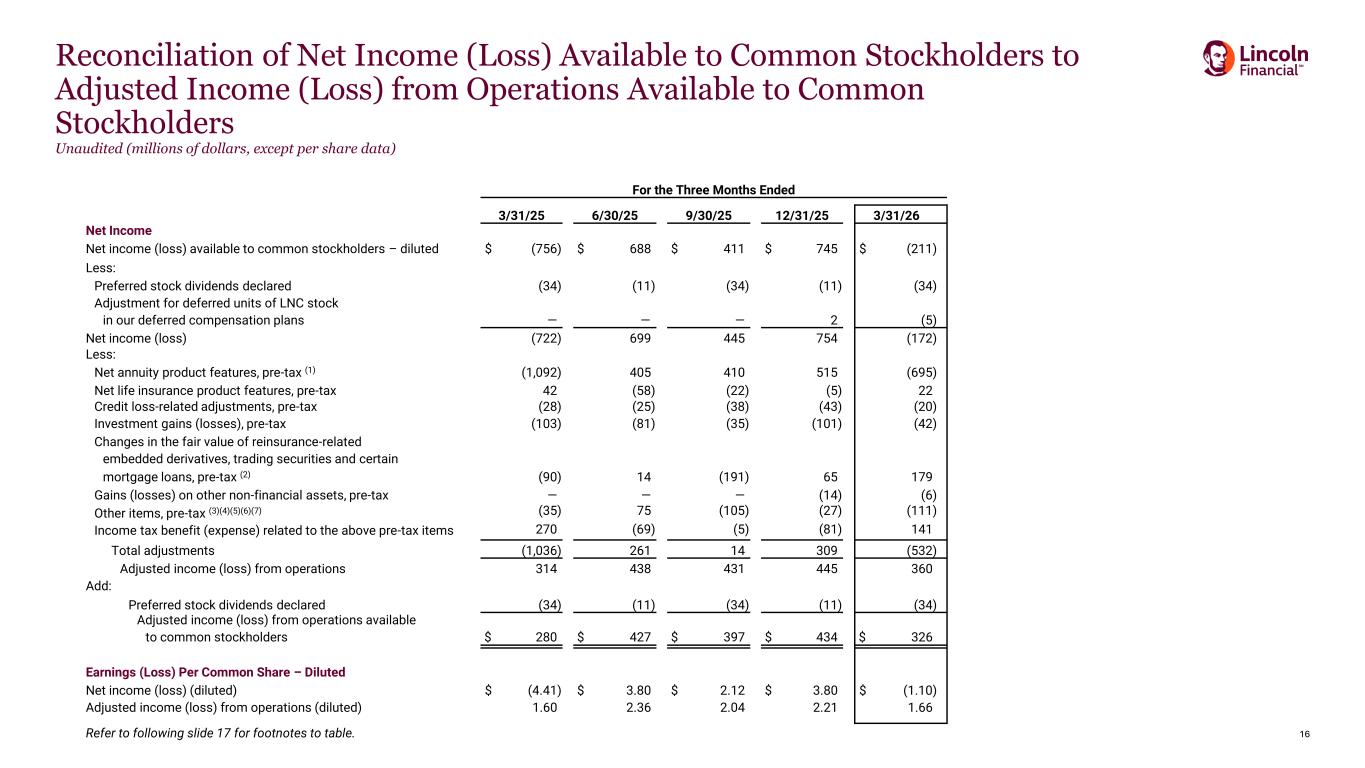
Thank you. Good morning, everyone, and welcome to our first quarter earnings call. We appreciate your interest in Lincoln. Our quarterly earnings press release, earnings supplement and statistical supplement can all be found on the Investor Relations page of our website, www.lincolnfinancial.com. These documents include reconciliations of the non-GAAP measures used on today's call including adjusted income from operations and adjusted income from operations available to common stockholders or adjusted operating income to their most comparable GAAP measures. Before we begin, I want to remind you that any statements made during today's call regarding expectations, future actions, trends in our businesses, prospective services or products, future performance or financial results including those relating to deposits, expenses, income from operations, free cash flow or free cash flow conversion ratios, share repurchases, liquidity and capital resources are forward-looking statements under the Private Securities Litigation Reform Act of 1995. These forward-looking statements involve risks and uncertainties that could cause our actual results to differ materially from our current expectations. These risks and uncertainties include those described in the cautionary statement disclosures in our earnings release issued earlier this morning as well as those detailed in our 2025 annual report on Form 10-K, most recent quarterly reports on Form 10-Q and from time to time in our other filings with the SEC. These forward-looking statements are made only as of today, and we undertake no obligation to correct or update any of them to reflect events or circumstances that occur after today. Presenting this morning are Ellen Cooper, Chairman, President and CEO; and Chris Neczypor, Chief Financial Officer. After their prepared remarks, we'll address your questions. Let me now turn the call over to Ellen. Ellen?
Speaker 2
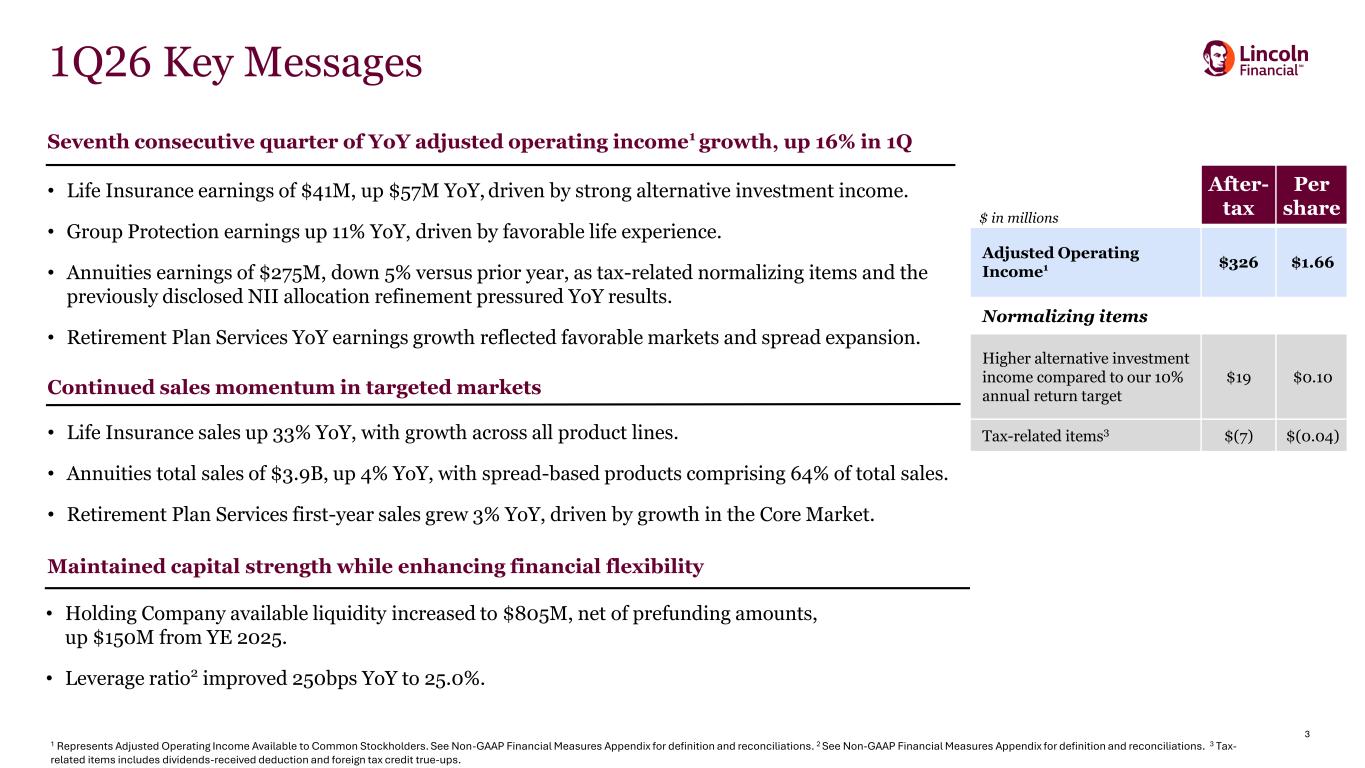
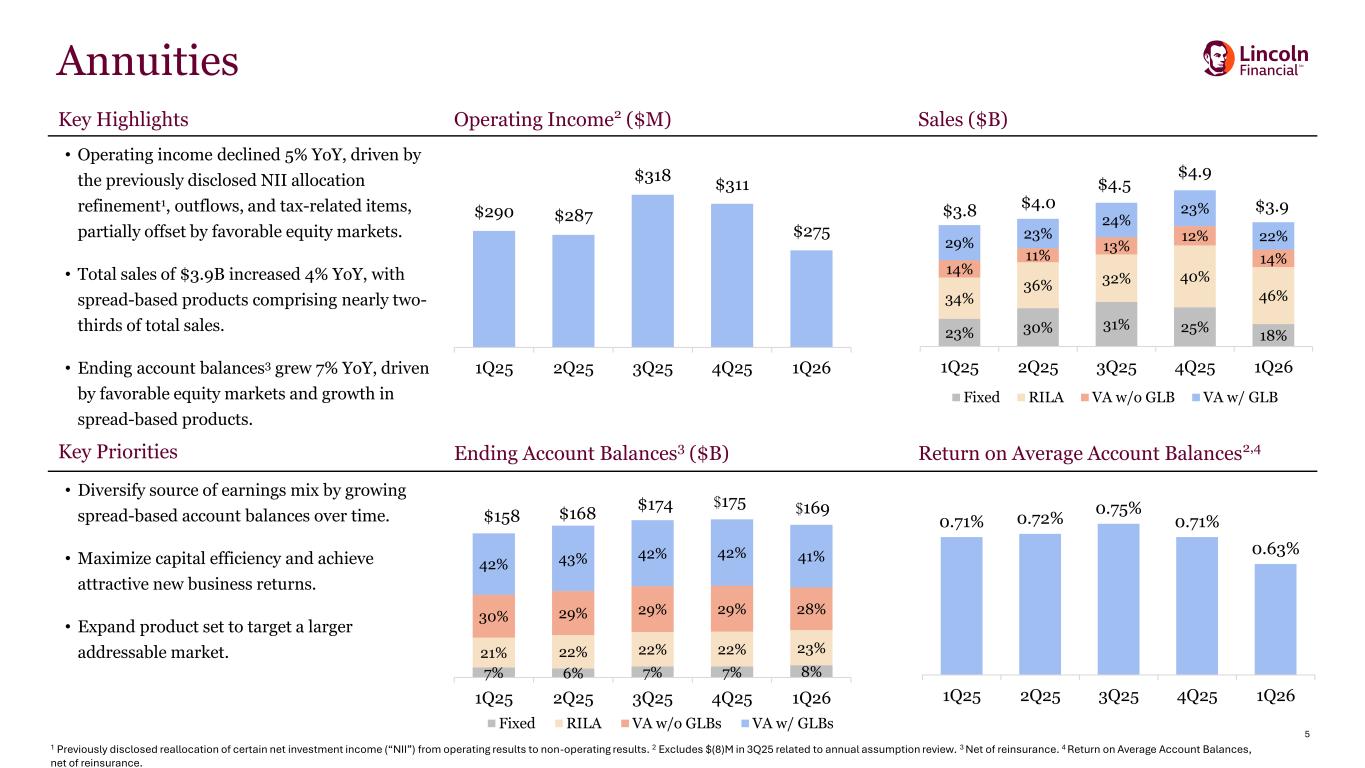
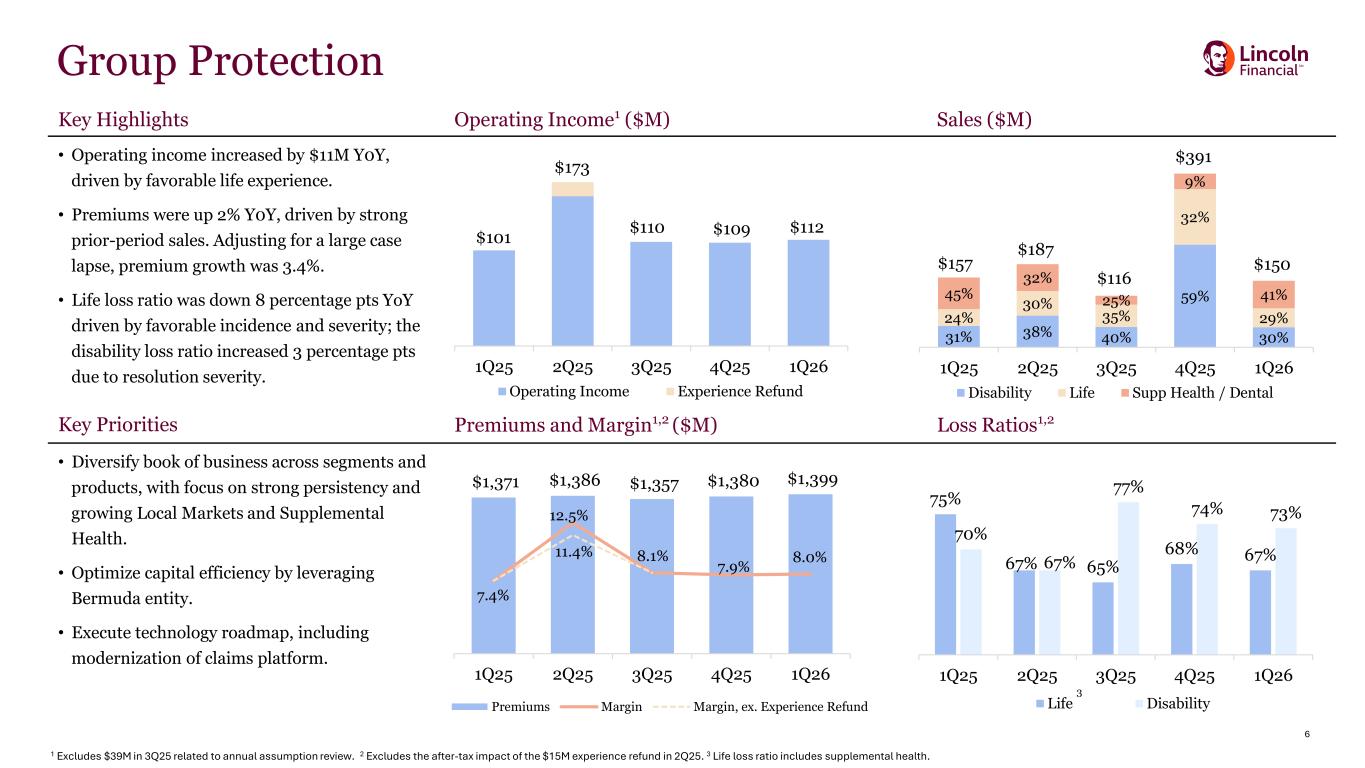
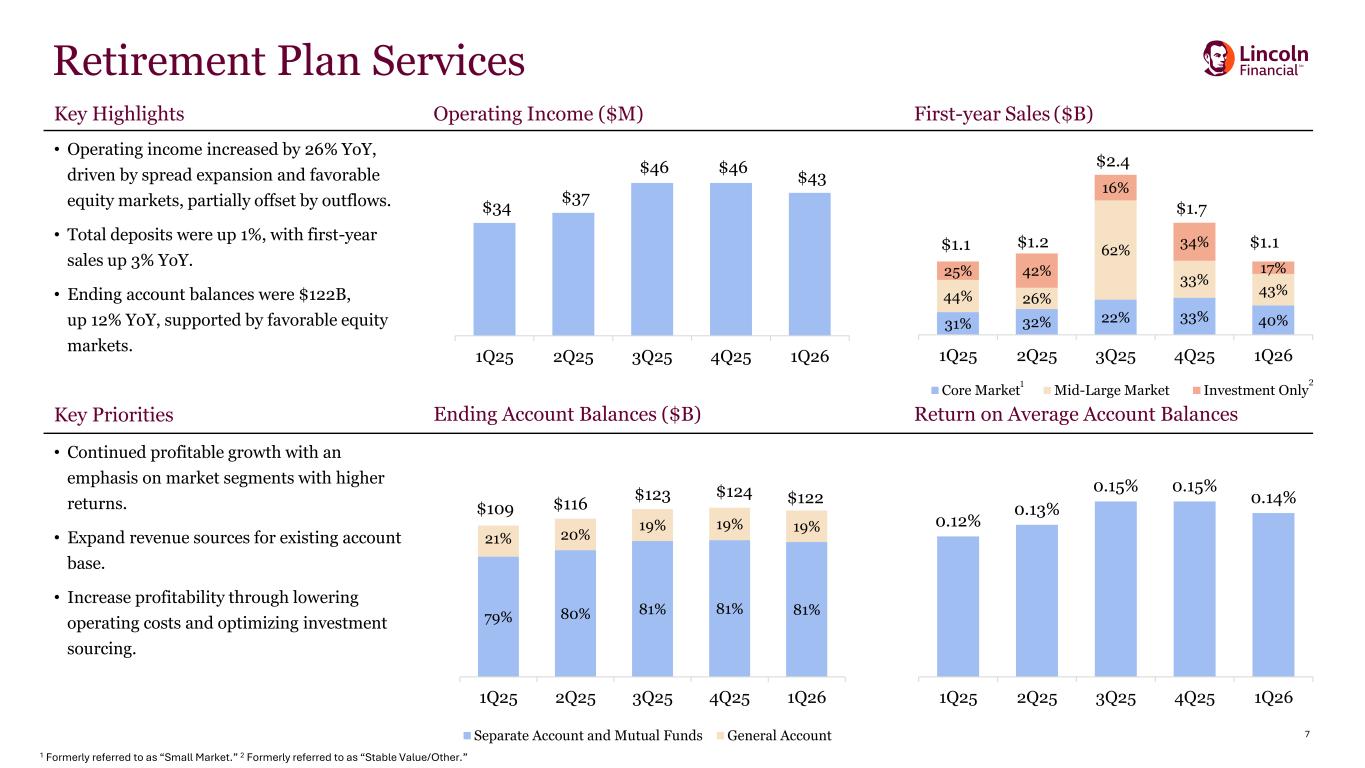
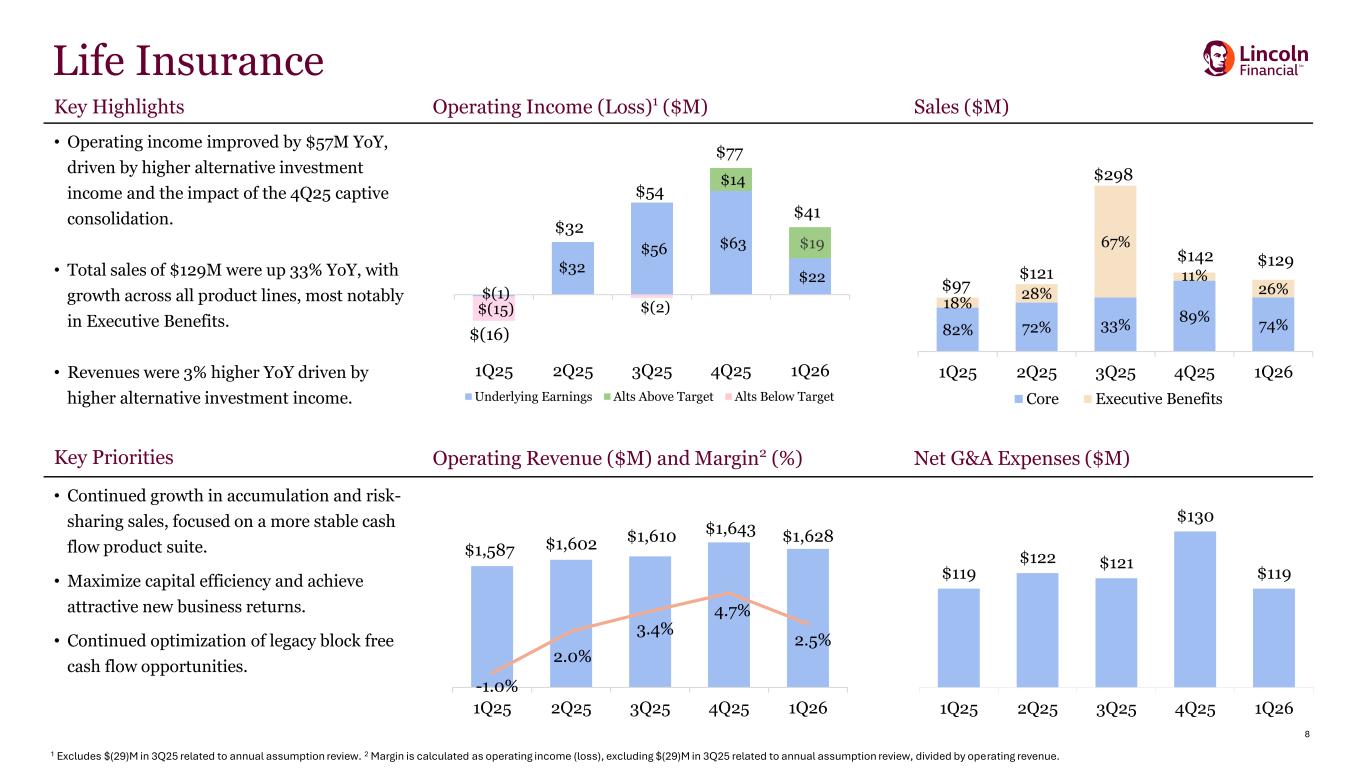
Thank you, John, and good morning, everyone. Thank you for joining our call today. Our first quarter results reflect continued execution with adjusted operating income increasing 16%, marking our seventh consecutive quarter of year-over-year growth. This performance is the cumulative impact of the actions we have taken over the past several years to strengthen our balance sheet, build a more efficient operating model and diversify our business mix. Together, these are building the resilience that positions Lincoln for durable value creation in the years ahead. Anchoring this performance are 3 priorities that guide our strategy: fortifying our capital foundation, optimizing our operating model and driving profitable growth across our businesses. Our capital foundation remains strong with capital levels well above our established buffer and our leverage ratio at our long-term target. The capital buffer is sized to provide a cushion against adverse economic conditions, allowing us to maintain steady execution as we advance our strategy. We have also made meaningful progress on our operating model. This includes continuing to leverage our Bermuda affiliate to enhance capital efficiency, optimizing our investment strategy and maintaining expense discipline alongside investments in digital capabilities and automation that improve the customer experience and support the growth of our businesses. We see additional opportunity ahead to drive broader enterprise operating leverage while enhancing how we serve our customers through higher employee productivity, more streamlined processes and unlocking capacity for further innovation. At the same time, we are advancing profitable growth across our businesses, balancing top line momentum with profitability and capital efficiency. Our focus remains on segments and products where we can compete beyond price, leveraging the depth of our distribution relationships, the breadth of our product suite and our differentiated capabilities to meet our financial objectives with attractive risk-adjusted returns and more predictable, stable cash flows. The mix of business we are writing is increasingly shaped by this approach, providing a foundation for our ability to sustain value creation over time. Underpinning these priorities, we are growing the core capital generation of the company, deploying that capital to sharpen our competitive advantages, broaden our moat and drive growth in free cash flow over time. Results will not always be linear and the economic backdrop can be uncertain, but our momentum is building. Our track record is increasingly evident and we remain committed to creating long-term value. Each of our businesses made progress against these priorities in the first quarter. Group Protection had another strong quarter with earnings growth and margin expansion. Life Insurance produced solid earnings with sales up over 30% year-over-year, driven by growth across core Life and executive benefits. Retirement Plan Services generated earnings growth with the realignment of this business still in its early stages. And in Annuities, we shifted further toward a more balanced, less market-sensitive business mix with sales aligned to our deliberate approach and earnings carrying the known headwinds we previously communicated. Our Annuities business had another solid quarter, supported by diversified sales and strength in our distribution relationships. We offer a broad set of products across RILA, fixed and variable annuities with and without living benefits, enabling us to meet customer needs across a range of market environments. As we discussed last quarter, our new business approach centers on balancing profitability, capital efficiency and lower market sensitivity. Our first quarter results reflect that discipline across each of our product lines. Total sales were $3.9 billion with spread-based products representing 64% of sales as we evolve toward a more balanced and less market-sensitive business mix. Starting with RILA, as we shared last quarter, we expect sales this year to be in line with the average of the past several years as we emphasize the parts of this segment where we compete beyond price through our unique product features, crediting strategies and depth of our distribution relationships. A clear signal of that approach is our second-generation RILA launched nearly 2 years ago, which was recognized by SRP in 2025 as the most innovative annuity product. First quarter RILA sales were up year-over-year and lower sequentially, consistent with our objective to prioritize profitability over volumes. As we mentioned last quarter, within fixed annuities, we see the most runway to grow over time across our annuity portfolio, particularly in fixed indexed annuities where our crediting strategies and product features allow us to compete beyond price. First quarter FIA sales increased over 90% year-over-year, supported by differentiated offerings, broader distribution and enhanced digital capabilities. Total fixed annuity sales of $716 million were below the prior year, reflecting lower volumes in the more price-sensitive MYGA products. Total fixed account balances grew as we retained 100% of our fixed sales with new business aligned to areas of the segment where the economics support our return objectives. Variable annuity sales of $1.4 billion were down year-over-year with the decline most pronounced in variable annuities with living benefits, consistent with our objective to reduce market sensitivity over time and the expectation we shared last quarter that 2026 volumes would move closer to pre-2025 levels. Variable annuities remain an important part of our portfolio, supporting continued free cash flow generation and attractive risk-adjusted returns. As a holistic annuity provider, the breadth of our franchise, our proven ability to pivot across product lines and our investment in technology modernization to support a more seamless and integrated customer experience position us to deliver on our objectives. Together, these capabilities reinforce our balancing of profitability, capital efficiency and growth while building towards a higher quality earnings profile over time. Now turning to Life Insurance. Transforming this business has been a significant strategic priority over the past several years. Aligned with our financial objectives, we refocused our new business mix on products with more predictable cash flows, accumulation and limited guarantee solutions such as IUL, accumulation VUL and executive benefits. These are areas where demand is rising and where our product distribution and customer experience capabilities give us a clear advantage. Drawing on insights from our deep relationships with advisers and producers, we launched a new generation of products in these areas, optimized our distribution footprint to align with our product strategy and built the digital capabilities to better serve our producers and their clients. We have been seeing momentum in our sales growth, although it will take time to meaningfully flow through to earnings and free cash flow. First quarter life sales were $129 million, up over 30% from the prior year, with growth across all product categories. Core Life and MoneyGuard sales were $96 million, up 20% year-over-year. Our IUL suite led the growth as our integrated approach to product design and policy servicing is resonating with advisers who want to give their clients both long-term value and a simpler in-force experience. Accumulation VUL is also gaining traction, supported by broader offerings and self-service capabilities. Executive Benefits had a strong start to the year with sales nearly doubling versus the prior year period. While large case activity can vary from period to period, the pipeline remains active, and we are encouraged by the momentum we are building in this business. Overall, the progress in Life this quarter reinforces the direction we set several years ago. The actions we have taken are building on one another, and we are developing a more diversified and profitable life franchise over time. There is more work ahead, but the path forward is increasingly clear. Turning to Group Protection, another business where execution is clearly translating into results. Central to our success is our targeted segment strategy. We operate across 3 distinct market segments: local, regional and national with products, capabilities and distribution tailored to the different needs of each. In local markets, the fastest-growing part of our 3 market segments and where we see the most attractive margin profile, our approach centers on bundled solutions that emphasize ease of doing business, leveraging our local distribution footprint. In regional markets, we are reinforcing our broker partnerships and expanding the technology integrations and digital capabilities employers depend on to manage their benefits programs. And in national accounts, where clients demand robust capabilities, we are tailoring products and services enabled by integrated technology, streamlined processes and our market-leading leave management expertise. Across all 3 segments, supplemental health remains a key priority. This strategy is coming through in our results and reflected in year-over-year higher earnings, margin expansion and premium growth. First quarter premiums were up 2% year-over-year, driven by strong prior period sales and in-line persistency, offset by a large case lapse. Importantly, that premium growth is increasingly concentrated in the priority segments we are most focused on expanding with local market premium increasing by more than 4%, its strongest year-over-year increase in nearly a decade and supplemental health premium up 28% year-over-year. Sales were roughly in line with the prior year period and consistent with typical sales levels experienced in the first quarter. Seventy-four percent of sales were from existing customers and a sizable share of that came from expanding additional lines of coverage with our in-force customers, particularly in supplemental health, where employers are responding to rising employee demand. Our pricing remains disciplined. Alongside that, we are making meaningful investments, modernizing our claims platform and expanding digital tools that improve the experience for the brokers and employers we serve. These investments enhance our offerings, reinforcing persistency while helping us attract new business. Overall, our targeted segment strategy, diversified footprint and disciplined execution are translating into consistent performance with a clear runway ahead. Looking forward, we expect Group Protection to be an increasingly meaningful contributor to Lincoln's higher-quality earnings profile. Now turning to Retirement Plan Services. First quarter operating income was up 26% year-over-year. First year sales of $1.1 billion were up nearly 3% year-over-year with growth concentrated in the core market segment, a priority area for us. Total deposits were modestly higher at $4.1 billion. As we discussed on our last call, the realignment of this business is in its early stages. Importantly, we are applying a playbook we have run successfully in other parts of our business, which gives us confidence in our ability to execute here. Three priorities anchor our approach. The first is disciplined growth, enhancing our product and service capabilities while broadening the opportunity to increase revenue. The second is service excellence, modernizing our operations, expanding offerings of digitally enabled tools and capabilities for participants and recalibrating how we meet the needs of plan sponsors. The third is enhancing what we offer, refreshing our value proposition by segment, updating our distribution model and using analytics to deepen engagement with our existing customer base. Across all 3 priorities, we are modernizing the technology that underpins this business. While this realignment will take time, we are encouraged by the early progress. We will steadily advance these priorities to improve the earnings trajectory of this business in the years ahead. In closing, we are executing, delivering results and making tangible progress on our priorities. There is more to do, and we see significant opportunities ahead. Lincoln has a differentiated set of competitive advantages, a diversified franchise across 4 businesses, each at a different stage of its realignment toward our financial and strategic objectives, a deep distribution platform that we are actively expanding and optimizing and capabilities tailored to each of the markets we serve, giving us the capacity to do more for our customers with greater agility. We are operating from a position of strength with a balanced and disciplined approach to growth and capital deployment. We remain confident in the actions we are taking, which are building toward a higher quality earnings profile that creates sustainable long-term value for our shareholders. With that, let me now turn the call over to Chris.
Speaker 3
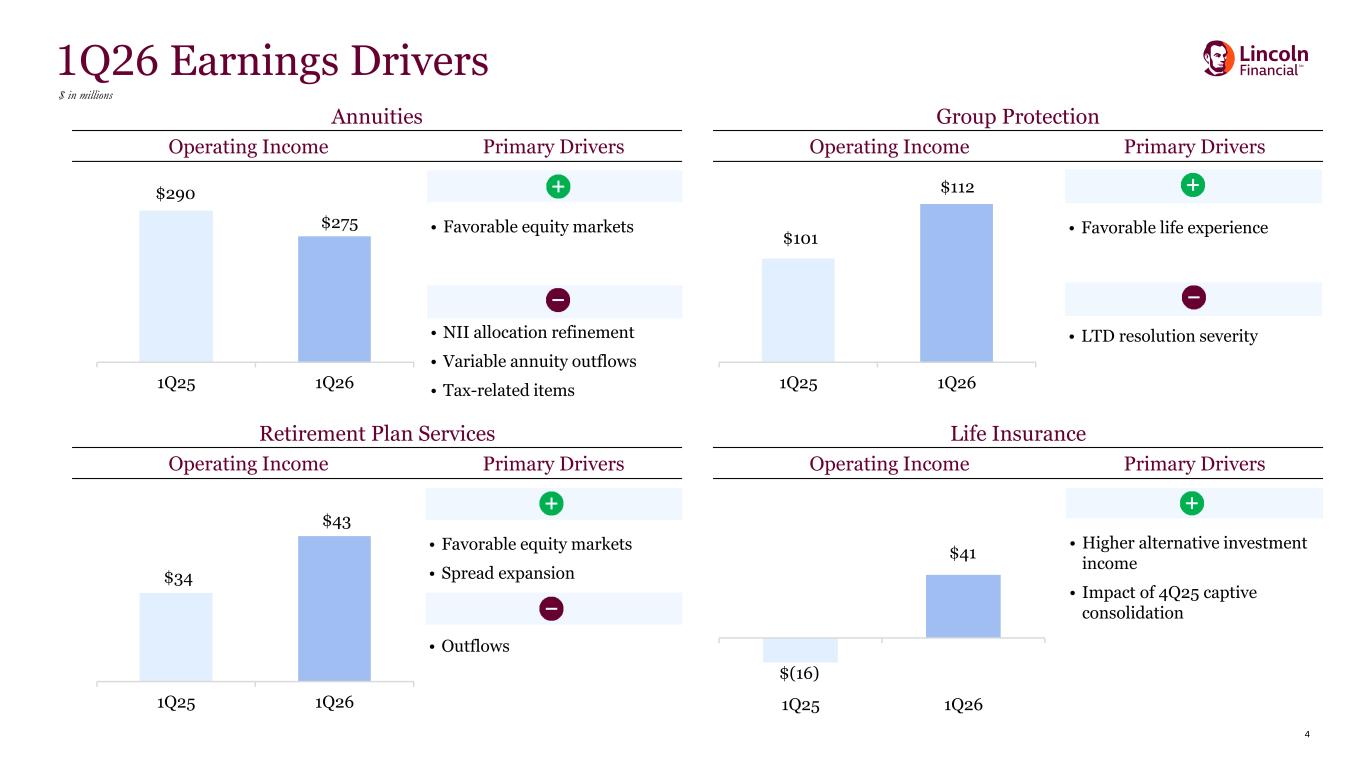
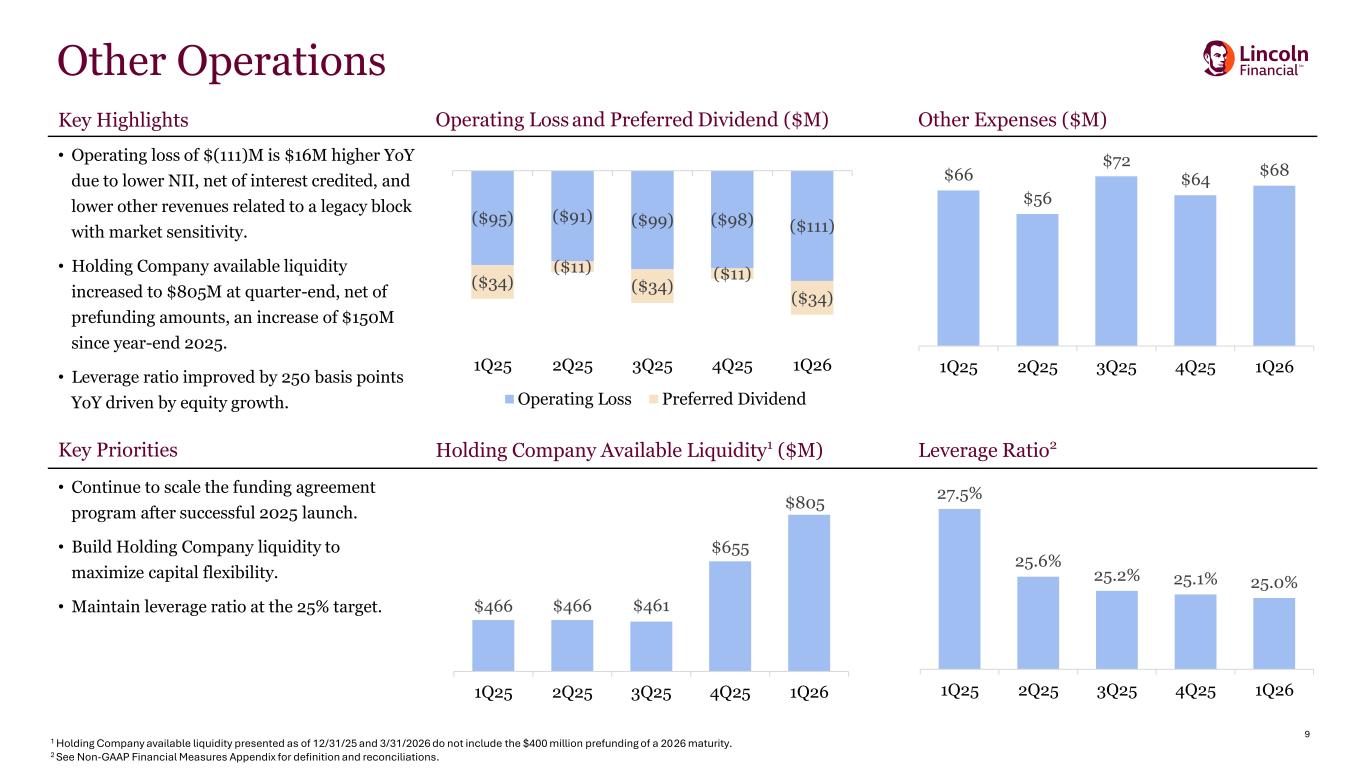
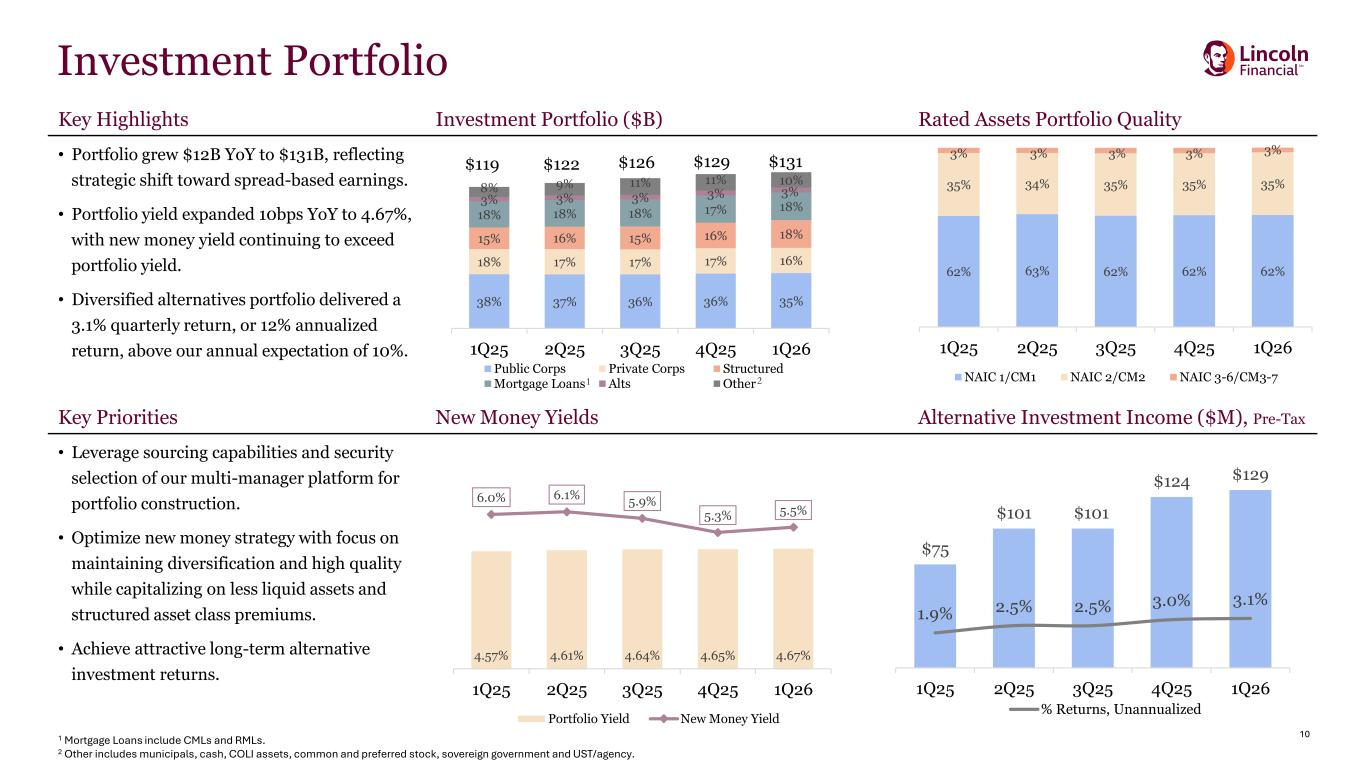
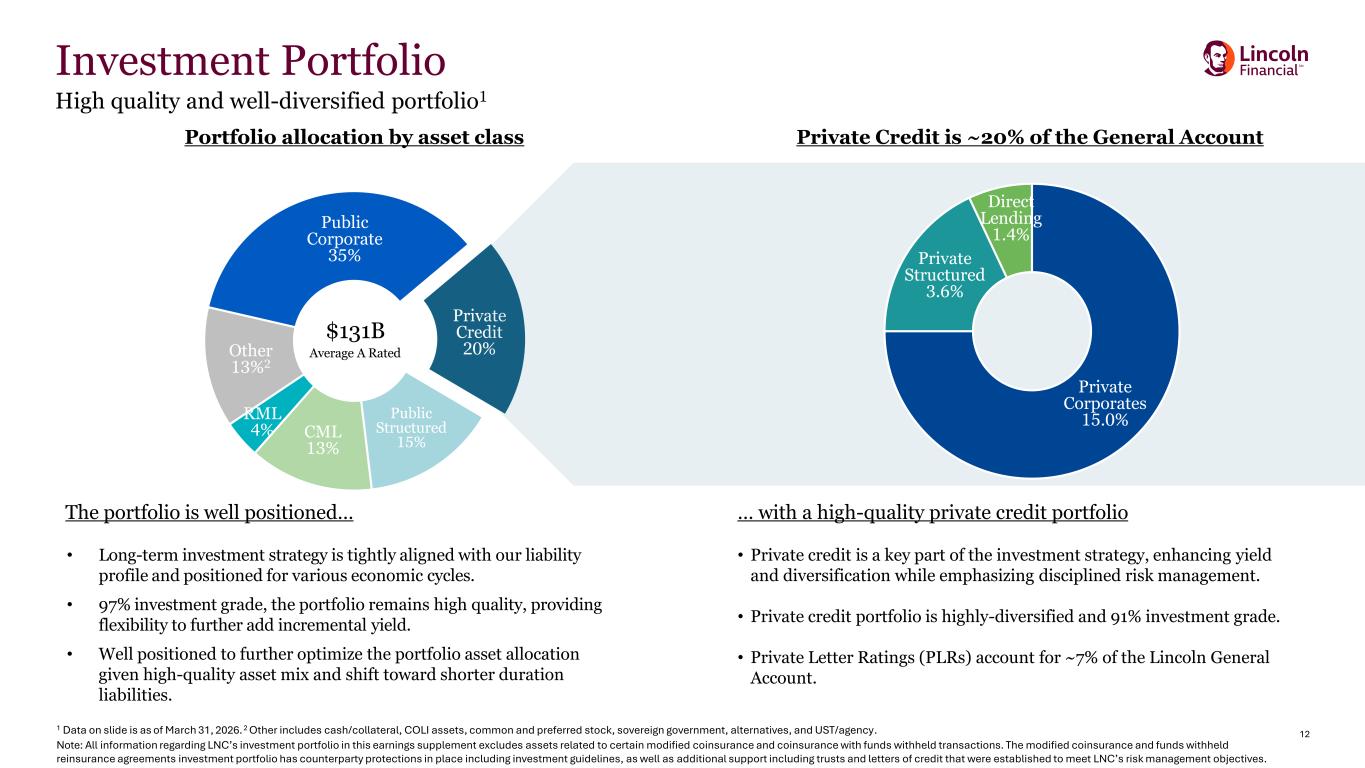
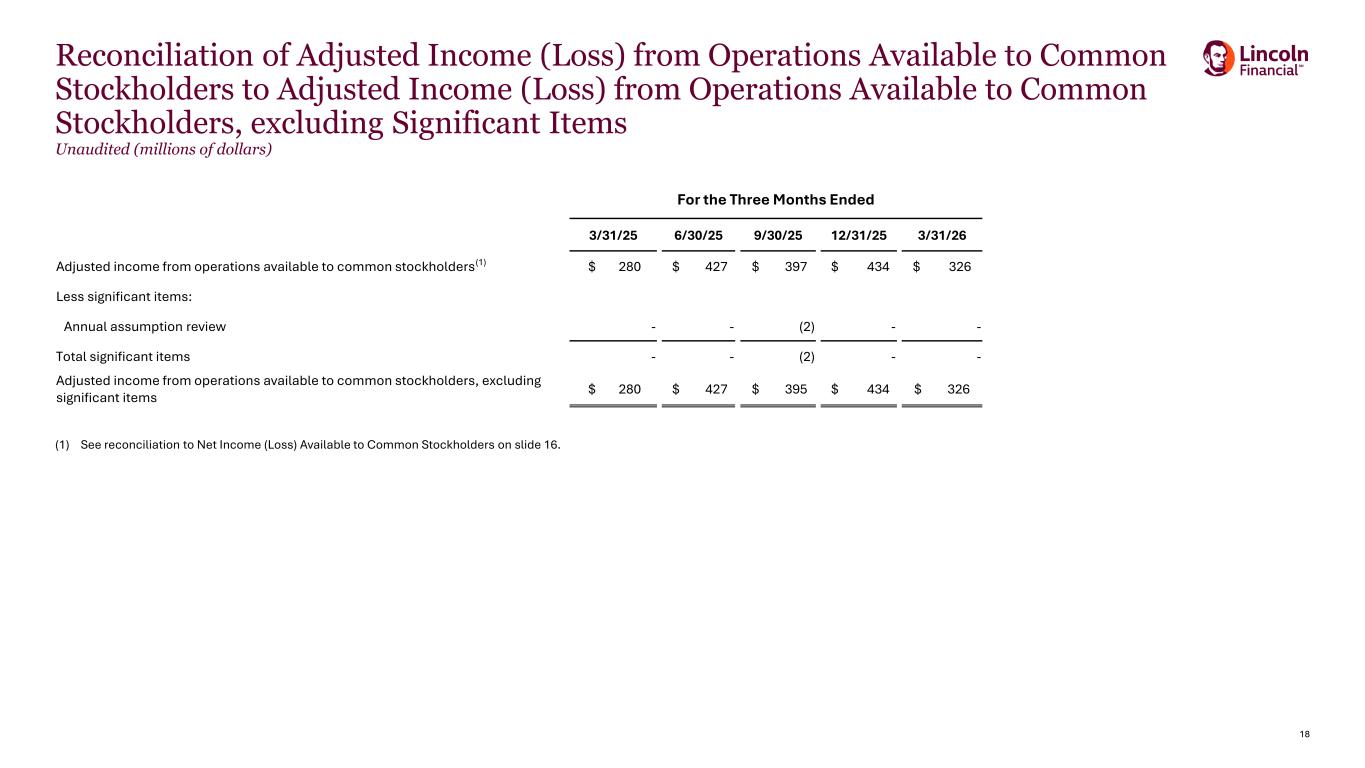
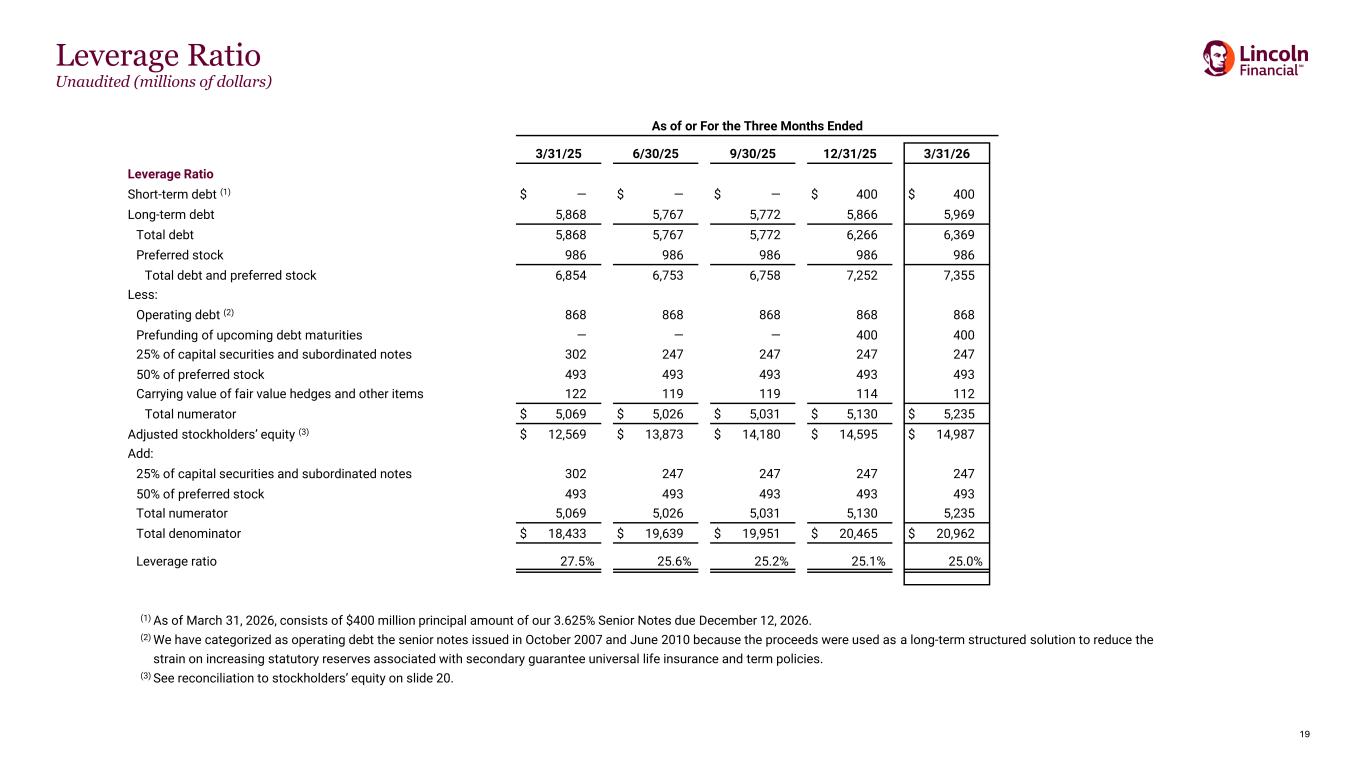
Thank you, Ellen, and good morning, everyone. Our first quarter results represent another quarter of strong execution and meaningful progress on our strategic priorities, delivering year-over-year adjusted operating income growth for the seventh consecutive quarter. The result this quarter was supported by favorable underwriting experience in our group and life businesses, continued growth in spread income in annuities and retirement plan services and another strong contribution from our alternative investments portfolio. Alongside strong earnings, free cash flow and capital generation continued to build, tracking in line with our expectations. Holding company liquidity, excluding prefunding for our December senior note maturity, ended the quarter above $800 million, reinforcing the financial flexibility we have to act on multiple fronts over the next few years. This morning, I will focus on 3 areas. First, I will walk through our consolidated and segment level performance for the first quarter. Second, I will touch on our investment portfolio. And third, I will provide an update on our capital position. Let's begin with a recap of the quarter. This morning, we reported first quarter adjusted operating income available to common stockholders of $326 million or $1.66 per diluted share. There were no significant items in the quarter, but there were 2 normalizing items. First, our alternative investments portfolio delivered an annualized return of 12.3% in the quarter or $129 million. On an after-tax basis, this amount was approximately $19 million, above our 10% annualized target or $0.10 per diluted share. And second, results in the first quarter included a one-time $7 million impact due to unfavorable tax-related items, reflecting a true-up of certain prior year tax positions on our variable annuity separate accounts. As a result, the annuities effective tax rate this quarter was approximately 200 basis points above recent levels. Ongoing impacts are minimal at approximately $1 million per quarter. Turning to net income for the quarter. We reported a net loss available to common stockholders of $211 million or $1.10 per diluted share. The difference between GAAP net income and adjusted operating income was driven primarily by the negative movement in market risk benefits amid lower equity markets in the quarter. Importantly, our hedge program, which explicitly targets capital, continued to perform in line with expectations. Now turning to our segment results, beginning with Group Protection. Group delivered another strong quarter, building on the momentum from 2025. First quarter operating income was $112 million, up 11% from $101 million in the prior year quarter, and the margin was 8%, a 60 basis point improvement. The year-over-year improvement was driven by the strength of our group life results, partially offset by continued normalization in disability. The group life loss ratio was roughly 67%, an improvement of more than 800 basis points from the first quarter of 2025. Group Life results remained strong this quarter, supported by favorable incidence and severity outcomes. While mortality results can vary from quarter-to-quarter, the result was consistent with the favorable trends we've observed in recent quarters and remains favorable relative to historical experience. Importantly, we continue to see the benefits of disciplined pricing actions, which have supported a more durable earnings profile in this business. The disability loss ratio was 73.4% compared to 70.1% in the prior year quarter. The elevated loss ratio was driven by 2 primary items. First, our paid family leave product experienced elevated incidence rates with the introduction of 2 newly effective states, consistent with our continued footprint expansion as more states adopt these programs. This is an expected occurrence for new states, and we anticipate it will moderate as we move through the year. Second, within LTD, we experienced unfavorable resolution severity this quarter. As we discussed in the back half of last year, disability results are normalizing from the record low levels we experienced over the last 2 years, including some moderation in the favorable claims dynamics that supported those results. Even with this normalization, claims management outcomes remain solid and the underlying fundamentals continue to be strong and in line with our expectations. As we look ahead, risk results have historically improved from the first to the second quarter, and we expect that seasonal pattern to repeat this year. As a reminder, however, our second quarter results in 2025 included approximately $15 million associated with the annual experience refund tied to one state's paid family leave program. As we communicated last year, we have transitioned to accruing this refund on a quarterly basis throughout the year, mitigating the one-time impact experienced in prior years. Overall, group's first quarter results continue to reflect the strong progress in our strategy to expand this business into a larger and more profitable part of our enterprise. Now turning to Annuities. Annuities reported first quarter operating income of $275 million compared to $290 million in the prior year quarter. Given a few moving pieces this quarter, let's walk through the result on a sequential basis from the fourth quarter reported earnings of $311 million. As a reminder, fourth quarter results included approximately $8 million of favorable payout annuity mortality experience that we noted at the time. Excluding that, underlying earnings in the fourth quarter were closer to $303 million. From that level, a few items drove the sequential change to $275 million. First, as we discussed on last quarter's call, beginning in the first quarter and continuing on a go-forward basis, we reallocated net interest income earned on collateral posted in connection with our index credit hedging strategies from annuities operating income to nonoperating income. As our RILA business has grown, so have the associated collateral balances, making the related net interest income more meaningful. Moving this income to nonoperating income provides a cleaner view of underlying annuities operating performance. Relative to the fourth quarter, this reallocation reduced reported annuities operating income by approximately $10 million in the first quarter with no change to the underlying economics or free cash flow. Second, as I discussed earlier, results in the first quarter included a one-time $7 million impact due to unfavorable tax-related items, reflecting a true-up of certain prior year tax positions on our variable annuity separate accounts. The remainder of the sequential change relative to the fourth quarter reflects 2 fewer fee days, which drove approximately $10 million of additional pressure and continued traditional variable annuity outflows, partially offset by continued growth in spread income. Stepping back to a year-over-year view, when normalizing for the NII reallocation and the unfavorable tax-related items in the first quarter of this year, Annuities underlying earnings would have modestly improved relative to the first quarter of 2025. The improvement reflects continued growth in spread income and the benefit of higher equity markets, partially offset by continued traditional variable annuity outflows and higher expenses associated with the full retention of our fixed annuity flows. Account balances net of reinsurance ended the quarter at $169 billion, 7% above the prior year period, supported by 15% growth in RILA balances and 24% growth in fixed annuity balances. Spread-based products now represent 31% of total annuity account balances net of reinsurance, up from 28% a year ago. On a sequential basis, however, ending account balances were down approximately 4% from the fourth quarter, driven by the equity market decline in the period and continued variable annuity outflows. We would expect this lower starting balance to be a headwind to fee income beginning in the second quarter. That said, equity markets have recovered meaningfully through the first several weeks of the quarter. And if these levels are sustained, we would expect a reversal of that pressure. Turning to net flows. Total net outflows for the quarter were approximately $2.2 billion, an increase from the prior year quarter, reflecting higher traditional variable annuity outflows, partially offset by continued positive net flows in spread-based products. Traditional variable annuity net outflows for the quarter were approximately $2.6 billion. While outflows increased relative to the prior year quarter, the outflow rate has remained relatively consistent over the past year with the increase in outflow volume reflecting growth in our underlying account balances driven by favorable equity markets over the last year. Across spread-based products, both fixed annuities and RILA continued to generate positive net flows in the quarter. Fixed annuity net inflows were approximately $100 million and RILA net inflows were approximately $285 million as continued strong sales were partially offset by higher surrenders from earlier vintages exiting their surrender charge periods. As we have noted previously, we expect RILA net flows to moderate relative to recent years as additional vintages move out of their surrender charge periods with overall account balance dependent on overall sales. As we look to the second quarter, we anticipate a sequential tailwind from the normalization of the unfavorable tax-related items alongside the benefit of an additional fee day and continued growth in spread income. Overall, the fundamentals of the business remain solid. Our continued emphasis on diversifying the product mix towards spread-based products, together with the disciplined risk and hedging framework we have built around the business, positions annuities to remain a steady contributor to earnings and free cash flow over the long term. Now turning to Retirement Plan Services. Retirement Plan Services delivered a strong quarter with operating income of $43 million, up 26% from $34 million in the prior year quarter. The improvement was driven by continued spread expansion alongside the benefit of higher equity markets supporting average account balances. Base spreads were 116 basis points, up 13 basis points from 103 basis points in the prior year quarter. The expansion is driven by deploying new money at rates above our existing portfolio yield, along with targeted crediting rate actions taken at the start of the year. Average account balances grew approximately 10% year-over-year to $125 billion, supported by equity market performance over the past 12 months. Net outflows for the quarter were approximately $200 million, a meaningful improvement from the prior year quarter. As we look to the second quarter, however, we expect net outflows to be elevated in the range of $2 billion to $2.5 billion, driven by a small number of known plan terminations, the majority of which did not meet our profitability targets. Consistent with the comments made throughout last year, we are continuing to be deliberate about the business we retain, focusing on the segments and customers that meet our targeted return thresholds even when that means accepting elevated outflows in a given quarter. The combination of disciplined pricing on retained business, the meaningful spread expansion delivered this quarter and the operating leverage from a higher quality business mix is what positions retirement plan services to deliver durable earnings growth over time. The first quarter result represents an early but tangible proof point that the actions we've been taking in this business are beginning to translate into improved earnings, and we expect to sustain a similar level of year-over-year growth as we look towards the second quarter. Lastly, turning to Life Insurance. Life delivered first quarter operating earnings of $41 million, our strongest first quarter result in 5 years and a meaningful improvement from an operating loss of $16 million in the prior year quarter. The improvement was driven by higher alternative investment returns and the continued benefit of our captive consolidation, which represents an approximately $10 million year-over-year tailwind. As a reminder, we executed this consolidation in the fourth quarter of last year, so we will continue to see this year-over-year benefit in the second and third quarters of this year, after which the comparisons will normalize. Mortality this quarter was favorable to our expectations, driven primarily by continued favorable experience within our term business. The result is consistent with the improvement we have seen in recent quarters and with broader U.S. mortality trends, which have continued to move in a favorable direction. While quarterly mortality results will continue to vary, recent experience has been encouraging and remain supportive of the underlying trajectory of the business. Alternative investment returns were also strong, contributing approximately $19 million after tax above our 10% annualized target. Building on this progress, we are also beginning to see early evidence of the impact from the strategic repositioning of our new business franchise contributing to underlying earnings. While modest in the current earnings profile, the deliberate mix shift over recent years toward products with more favorable risk characteristics and attractive risk-adjusted returns will continue to emerge over time as the in-force grows in size. As we look to the second quarter, we expect a modest improvement in mortality as favorable seasonal trends from the first to second quarter are partly offset by the favorable experience in the first quarter. Additionally, given the elevated volatility we have seen across markets, alternative investment returns could experience some variability relative to our 10% annual guidance. As a reminder, the second quarter of 2025 also benefited from favorable mortality experience, which could create a less favorable year-over-year earnings comparison for the second quarter even as the underlying trajectory of the business continues to improve. Beyond near-term seasonality and as demonstrated by the past year of results, we remain focused on building the durable earnings power of this business through disciplined expense management, optimization of the investment portfolio and continued progress on our strategic repositioning toward products that generate more stable cash flows and attractive risk-adjusted returns. Turning briefly to expenses. First quarter G&A expenses, net of amounts capitalized, were $589 million, up modestly year-over-year and down sequentially from a seasonally high fourth quarter. The year-over-year increase reflects continued investments tied to specific business actions, including the ongoing modernization of our claims platform and Group Protection, which is intended to drive efficiency and a simpler experience for our customers as well as the financial impact of supporting the full retention of our fixed annuity flows and annuities. Expense discipline remains a strategic priority across the organization, and we see continued opportunity to drive efficiency as we advance our transformation with an ongoing focus on leveraging technology to improve productivity and ensuring our expense base is appropriately sized to support our strategic objectives. Now turning to investments. Our investment portfolio delivered solid results in the first quarter, reflecting our high-quality and well-diversified portfolio and continued execution of our strategic asset allocation initiatives. Portfolio credit quality remains strong with 97% of investments rated investment grade, while our below investment-grade exposure remains at historic lows. Credit performance for the quarter was in line with our expectations. Touching briefly on alternative investments. Our alternatives portfolio delivered another strong quarter with a return of 3.1% or approximately 12% annualized above our 10% annualized return target. While alternative investment returns have been at or above our target over recent quarters, the elevated volatility we have seen across markets could lead to some variability in our alternatives portfolio in the near term. While quarterly results can vary, the breadth and diversification of the portfolio give us confidence in its ability to achieve our return objectives over time. Lastly, I want to spend a moment on private credit, given the heightened focus on this area across the industry. Our approach across all asset classes is grounded in how we manage the general account, anchored in a robust strategic asset allocation framework that recognizes private assets as a natural fit for the long-duration illiquid nature of our liabilities. Investment-grade private placements, in particular, have been a long-standing core competency of our investment platform and a meaningful source of risk-adjusted yield that supports our liability profile. As you can see in our investor supplement on Slide 12, our private credit portfolios represent approximately 20% of our general account and are comprised of 3 categories: investment-grade private placements, private structured securities and direct lending. The vast majority of our exposure, approximately 15% of our general account or $19 billion sits in investment-grade private placements. This is a market we have invested in for decades, along with the majority of our long-tenured insurance peers. These are institutional investment-grade borrowers diversified across industry with sectors like utilities comprising a large portion of the exposure. Historically, the IG private placement market has delivered fewer rating migrations, lower defaults and better recoveries than their public comparables, supported by strong covenant protections and the deeper diligence that comes from having a direct relationship with the issuer. It's also worth noting that this market has been relatively stable in terms of growth over the last decade. At a smaller scale, we also hold approximately $4 billion or roughly 3.5% of our general account in private structured securities, which is largely an investment-grade strategy. This portfolio is A rated on average, has an average position size of $14 million and is represented by collateral such as equipment financing, solar financing and aircraft leasing. And while our portfolio is smaller than the industry in terms of allocation, we would expect this portfolio to grow over time given its duration profile, consistent with our strategic priority of growing our spread-based earnings and diversifying our annuity mix. The last and smallest allocation of the portfolio is direct lending, which represents less than 1.5% of our general account. This has been a surplus strategy, which over the last decade has delivered attractive net returns, though it has been a modest overall contributor to our earnings given the small allocation. The portfolio is highly diversified with more than 400 underlying loans, primarily managed by 4 large, well-tenured managers with an average position size of approximately $4 million. The weighted average life of the portfolio today is under 2 years, and we would expect this exposure to decrease over time, both in terms of absolute dollars and as a percentage of the general account, in line with the strategic priority of growing our spread-based businesses and thus allocating our risk appetite to assets more efficiently supporting our interest-sensitive liabilities. Stepping back, our portfolio across asset classes is the highest credit quality we've experienced in years. We maintain a robust asset allocation framework with rigorous stress testing and a measured approach toward diversified deployment of new money across asset classes, executed alongside our strategic partners and grounded in a consistent disciplined risk framework. We remain very comfortable with the portfolio. Turning now to capital, where we continue to operate from a position of strength. I would highlight 3 points. First, our estimated RBC ratio remains well above our 400% target and the 20 percentage point buffer we built on top of that target, now the eighth consecutive quarter that we've ended above the 420% target buffer level. Second, our leverage ratio improved further during the quarter to 25%, which is now at our long-term target. We've made meaningful progress on this front since the end of 2023, and the lower leverage ratio reinforces the financial flexibility we have built across the enterprise. Third, holding company liquidity ended the quarter at approximately $1.2 billion, an increase of approximately $150 million from year-end. This includes $400 million of prefunding for our senior notes maturing in December of this year. So net of prefunding, holding company liquidity is $805 million, well above our historical operating range. The continued build in holding company liquidity in part reflects the growing dividend capacity from our operating subsidiaries and provides the flexibility to support our broader capital priorities. Before I conclude, I want to briefly touch on the macro environment. While uncertainty remains with elevated volatility persisting across markets, the work we have done over the past several years to fortify the balance sheet, diversify our sources of earnings and deepen our risk framework leaves Lincoln well positioned to perform through it. In closing, our first quarter results reflect another period of consistent execution and meaningful progress on our strategic priorities. We delivered the seventh consecutive quarter of year-over-year adjusted operating income growth with continued progress across our underwriting businesses, ongoing spread expansion and another quarter of free cash flow and capital generation tracking in line with our expectations. The path forward will not always be linear and mortality experience and market conditions will continue to create some variability from quarter-to-quarter, but the trajectory of the business is clear, and we remain focused on disciplined execution, free cash flow generation and the creation of long-term shareholder value. With that, let me turn the call back over to the operator.
Operator
Your first question comes from the line of Wes Carmichael with Wells Fargo.
Speaker 4
Just thinking about the holdco liquidity increased about $150 million sequentially. And I think you guided to around, call it, $100 million of holdco expenses on a quarterly basis. So is that a decent proxy for free cash flow? I think last quarter, you had mentioned that kind of any excess generation in subsidiaries would be upstreamed, but any other considerations in the quarter when we think about free cash flow?
Speaker 3
Yes, good question. So I would say a couple of things. First of all, you're right, the holding company cash increased to over $800 million, net of the prefunding for the quarter. It's the highest it's been in a long time. We talked about this last quarter where as free cash flow is being generated, you will see an increasing amount of that move to the holding company. I think as it relates to the quarter-to-quarter dynamics, though, just keep in mind that we tend to take dividends from our subsidiaries at least last year in the back half of the year. So we would expect that trend to continue. And then there's also always going to be some variation quarter-to-quarter as it relates to free cash flow relative to GAAP because of things like taxes or how seasonal expenses might be dealt with between the two. But at the end of the day, when you step back, the earnings growth came through at 16%. The free cash flow conversion continues to look strong relative to the guidance that we had talked about a quarter ago, and you're starting to see more of that move to the holding company.
Speaker 4
Got it. And I guess just the second one, good to see favorable alts returns in the first quarter. Chris, I think in your prepared remarks, you mentioned there could be some variability in 2Q. That makes sense. But do you have any kind of early view on alts returns for the second quarter or how you think that ought to trend through the rest of the year?
Speaker 3
It's too early, Wes. But I think the comments that I made in the prepared remarks are just a reminder that the portfolio is on a lag. And so if you think about what happened in first quarter, you would imagine any volatility that would play through would come through next quarter. Obviously, this quarter, in public markets, you're seeing positive performance. And so there's always just that lag. I do think it's important, though, to step back when you think about our alts portfolio. It really has been a significant contributor over the last few years. And frankly, it's a testament to the way that portfolio has been built. And so when there is volatility in the markets, it can have an impact, but I also wouldn't think of it as S&P beta, if you will. It's about $4.2 billion in size. We've done about 10% returns with relatively minimal volatility over the past couple of years. And the point on the way the portfolio is constructed, and this is true for our general account as a philosophical perspective, but it's extremely diversified, right? And so we get questions about the alts portfolio from time to time. $4.2 billion, you could think of it as 40% in private equity, 20% in growth equity, 20% in real assets. So think of things like infrastructure and energy and then 20% in other strategies, so hybrids or hedge funds. From a fund perspective, there's over 400 funds. So when you think about the diversification, that's, call it, $10 million per fund. And then if you just think about the way that portfolio construction works, from a position perspective, there's probably over 4,500 portfolio companies, so $1 million average size. So it's an extremely diversified portfolio. And the reason I make this point is because when you look back historically, depending on the macro environment, different parts of the portfolio are going to perform well and some parts of the portfolio are going to underperform. So the diversification is a real point, both from a strategy perspective, an asset class perspective and a size perspective. And frankly, it's been a really strong performer for us over the past couple of years.
Operator
Your next question comes from the line of Ryan Krueger with KBW.
Speaker 5
My first question was on disability. Could you help us size the PFML impact on either in dollars or on the disability loss ratio? And then if we were to exclude that, like where is disability at this point relative to your longer-term expectations? Have we basically removed all of the favorability you had been mentioning from the macro environment and now we're more at a stable state? Or is there still some favorability you're seeing?
Speaker 3
Yes, good questions. On the first question on PFML, we're not going to size the specific impact. I think it's the dynamic there is relatively consistent with what you've heard from others in the industry. Two new states came online that has a near-term impact, but then normalizes throughout the year. So you will see the normalization of that as you go through the next couple of quarters. The other dynamic, though, if you look at the loss ratio year-over-year, 70% last year, 73% this year. So in addition to the PFML pressure, which again normalizes, the dynamic that we talked about in the second half of last year is continuing, and that's on the claims resolution side. So as you think about as the mix of the block evolves and a greater percentage of the reserves are from more recent years where new claim severities have been favorable, the release of reserves from older high severity claims become less impactful. So that normalization is continuing. It's continuing in line with our expectations. And those expectations were obviously baked into the way we framed the outlook for '26 and '27. That's continuing. What I would say, though, is that incidence is still really good. And incidence has been normalizing a bit, but relative to the longer-term expectations, both from a frequency and severity perspective for incidents in LTD, in particular, it's still favorable. So to the degree that the macro changes and unemployment becomes more of a dynamic, we would expect to see some change in incidents. But if you think about the 2 main drivers to your disability loss ratio on the LTD side, we are seeing the normalization on the resolution side, while incidence remains strong, but a little bit of a normalization from last year, which were, frankly, record levels.
Speaker 5
And then on annuities, if I normalize for the tax item and also the 1Q seasonality, it would seem like you're trending kind of more towards the low end of the 66 to 70 basis point ROA guide you had given last quarter for the medium term. Is there any reason to expect any upward movement there from or is that more you should think of this as you're probably running towards that lower end at this point?
Speaker 3
Sure, Ryan. So it's one quarter. And what I would say is you're right, there's a lot of noise in the numbers. And so there's the tax item, which we mentioned. There's the NII allocation dynamic that we talked about. And then on a year-over-year basis, there is the incremental acquisition expense from retaining the full flow. We've talked about that in the past, and that will be a recurring dynamic. But just when you're looking at the comp year-over-year, keep that in mind. So if you think about the underlying drivers beyond that, markets were not a tailwind for VA this quarter. When you think about the VA block, call that an 80 basis point ROA block of business, and you have the combination of outflows and fees and assessments and so forth running at about 10% a year. So for that 80 basis point large block to maintain its earnings trajectory, you need a similar level of earnings growth on an annualized basis. And so this quarter, when you don't have the market tailwind, you see that pressure come through a little bit more. That outflow rate has been relatively consistent the past couple of years. It's in our expectations. And as we talk about all the time, the volatility just comes from what's happening on the account value side for markets. On the spread side, the good news is we're continuing to see good spread income growth there. You can see some of that flow through in the P&L. I would also mention as a reminder that the NII allocation when you look year-over-year, you have to adjust for that. But as the account value grows for the spread income business, two dynamics will happen. One is you'll just get the greater lift of earnings, but from an ROA perspective, as you're building those blocks, the incremental return expansion comes over time because you've got some nondeferrable acquisition expenses. You have the expectation that your spreads expand over time, especially as you get through surrender periods and so forth. So longer term, I think you would expect the ROA of that to — for the non-VA block to expand as the account balance is growing at the same time. And then you have the VA ROA somewhat dependent on markets, as we've talked about. Very specifically, as you think about 2Q versus 1Q, the tax dynamic goes away and then you do have an extra fee day.
Operator
Your next question comes from the line of Joel Hurwitz with Dowling & Partners.
Speaker 6
Chris, first, can you just break down the loss in other ops. It seemed a bit elevated. Just walk us through the moving pieces of spreads in that legacy business you guys called out and expenses.
Speaker 3
Yes. It's relatively straightforward. There is a legacy block that has assets against it. There's some equity sensitivity in the legacy block. And over time, as markets have performed well, the excess on the asset side has grown. And so what happens is in periods of volatility in the markets, you can have a little bit of a drag there, and that's the majority of the difference year-over-year. There was the net investment income allocation change. We talked about that for annuities. We also mentioned at the time that there would be a more minor impact for other operations. It's about $20 million annually in other ops, so about $5 million a quarter. So once you adjust for those 2 things, the other ops income number is pretty straightforward.
Speaker 6
Got you. And then just shifting to annuity sales. Can you unpack more what you saw in fixed annuities? It was a step down from prior quarters. It sounds like, right, I think, Ellen, you said FIAs were up 90% year-over-year. But how did that compare to the last couple of quarters as you started to sort of ramp that business up?
Speaker 2
That's right. So first of all, if you take a step back and what you see in the first quarter just overall in terms of our annuity business is delivering on the framework that we laid out in our fourth quarter call. So as it relates to fixed annuity in particular, and one of the things that we said is that we see the greatest runway there over time and that we, as we move into 2026, are focusing on FIA over price-sensitive MYGA. And keep in mind a couple of things here. One is that in fixed annuities, as Chris mentioned, we are now retaining 100% of sales following the exit of our external flow reinsurance treaty. And so while we're doing this, you saw this quarter, even though sales were down, that fixed annuity account value growth was up, and we expect it to continue to be up relative to where we were in 2025. So when we look at overall FIA and we see that we're up 90% year-over-year, we really see that in the fixed segment, importantly, this is where we see the most attractive growth opportunity. And some of the reason why is that we are really leaning into where we have differentiated crediting rate strategies, where we have differentiated product features, and that enables us to compete beyond price. And then at the same time, we have the opportunity in FIA to continue to expand from a distribution perspective where we have strategic partnerships, but we have not traditionally been on the shelf for FIA. And then additionally, one more thing, which is that we're investing in the customer capabilities around digital and things like statement on demand, et cetera. So all places that support us in terms of continuing to grow here. MYGA, at the moment, we are deliberately stepping back. So we are seeing — and I believe some of our peers have talked about this as well — we really want to compete on features rather than pure rate. And we're going to selectively be in the market where the value trade is. We have the ability to pivot, and we're always going to make that trade-off. And if we see market conditions or we see something change here, we will, of course, adjust and pivot the strategy accordingly.
Operator
Your next question comes from the line of Suneet Kamath with Jefferies.
I guess for Ellen, we're seeing or witnessing the first merger of equals in the annuity space in probably 20 years, I think your company is probably the last one. Just wondering how you're thinking about that transaction? And does it change the need for scale in the business? And ultimately, does this start a wave of consolidation as people try to kind of catch up to size?
Speaker 2
Sure. So I agree with you that we haven't seen an MOE of this size in quite some time. And as you all know, we compete with both of these organizations that are part of the merger announcement. And we also, by the way, compete with organizations that are much larger, too. So we feel really comfortable that we're going to be able to continue to compete well. We feel very well positioned. Just in terms of — recall that several years ago, when we were initially going through our transformation and realignment, we did a broad strategic review. We looked across every business, every product, every segment. We made the decision at that time to sell our Wealth Management business because that was a business for us that we didn't have scale, and we didn't really feel that we had the right to win and really compete in that business. And we talked about the fact that we have a commitment to the 4 businesses that we're in, all of which, as we've reinforced, are in different stages of their realignment. So we feel really good about our ability to continue to execute and deliver results. And to your point, scale is clearly a factor, and we have scale in our businesses. And at the same time, there are a number of other factors that we think are just critical in terms of success. Capabilities, and you hear us, we are investing in unique and differentiated product features. We know that we've got a real competitive advantage as it relates to our distribution and proven track record of pivoting, and we're doing that all across the platform. And then you also hear us over and over again talking about all the investment that we're making in capability in ease of doing business with customer. And really, those things go hand-in-hand in terms of really having the right to win, continuing to gain share, continuing to grow the business. So we feel very good around where we are and our ability to continue to compete and importantly, grow the overall earnings trajectory for Lincoln.
Okay. That's helpful. And then I guess for Chris, I don't know if you can provide this, but in terms of the Bain Capital, is — can you give us a sense of how much of that has been deployed at this point?
Speaker 3
So I don't know that I would add a lot to what we said at the fourth quarter. So if you think about it, when we brought in the $800 million, we said we were going to use it for basically 3 primary strategies: number one, grow the fixed annuity account value and spread earnings over time as we exited the flow deal. Number two, continue to scale the institutional funding agreements; and number three, optimize the legacy Life block. So as you think about where we were at the end of the year, we had talked about the fact that we exited the flow deal and we had, call it, a quarter and a month worth of flow that was being capitalized and will produce strong spread earnings over time. As you think about the rest of this year, we'd obviously earmarked for the remainder of that to run through from a comp perspective. And then we've been doing funding agreements when the markets are supportive, as you know. So from a cadence perspective of deployment, I think the spread income side of things continues at the pace that we had expected. The bigger variable as it relates to the use of proceeds as it relates to optimizing the Life portfolio, we mentioned in the fourth quarter that we restructured a number of the legacy life captives. We used some of the capital for that, really good return, both GAAP and even more so on the free cash flow side. And then we discussed the fact that in 2026 and 2027, we would look at a number of different actions, some external, some internal, to deploy more of that capital towards either repositioning the life portfolio asset base or looking at an external risk transfer deal. And obviously, we're still working through all of that. So we like the trajectory of the deployment. There's the pace of account value growth that we're seeing on the fixed annuity side. We had the big first step on the life side with the captive. And really from here on out, it's making sure that we're being diligent on how we think about using the proceeds to execute on some of the life actions.
Operator
Your next question comes from the line of Tom Gallagher with Evercore.
Speaker 8
Just 2 competition questions. The — so Ellen, I think you were partly referencing the first one in your answer a few minutes ago. But on the Apollo call yesterday, they mentioned irrational competition in the annuity market coming from incumbent insurers, not from the new PE-backed entrants. And I certainly hope it's not you guys they're referencing because you did have good FIA growth, but you were mentioning MYGA is where you're seeing the most competition or at least aggressiveness in the market where you pulled back actually. But what are you seeing competitively that you think might explain this commentary and irrational competition from incumbents?
Speaker 2
So I obviously can't speak to the comment of another peer. But having said that, we know that there are certain pockets of the annuity product segments where it's a pure price competition play. And one of those examples at the moment is MYGA. And we see pockets of this, and we've referenced this in previous calls. There are pockets of this on the RILA side as well as we see more competitive entrants. And one of the ways that we are focused on differentiating and ensuring that we are achieving the risk-adjusted returns that are critical for us in terms of growing this business is differentiated product features and really having a deliberate focus on the more profitable segments of this market. So you're going to hear us over and over again reinforcing this fact that we are not focused on top line growth. We are focused on balancing growth with profitability, with capital efficiency as we continue to grow here, and we're leveraging the strength of our distribution franchise to pivot across products. You've seen us do this many times before, and we're going to stay focused there to make sure that we are ensuring that we're building the durability for this business going forward.
Speaker 8
Got you. My follow-up is a question on competition in the Group Protection business. So your large case lapse that you referenced, was that more you needed rate, you were looking to reprice and as a result, you lost it? Or would you say that was more aggressive pricing from competitors or some other reason that you thought you lost that? And I'm just curious if that informed you about where you currently see competition in that market.
Speaker 2
So Tom, you've repeatedly heard us talking about the fact that we are prioritizing margin expansion over top line growth across all of our businesses, but in group in particular. And so with one large customer, you can assume that it holds true here as well. So importantly, our in-line, our persistency was in line ex the one large case. And while we saw premium growth of 2%, there are a couple of things that I want to emphasize here year-over-year. One is that we feel very comfortable with the medium-term outlook that we laid out for all of you last quarter, expecting premium growth to be in the 3% to 6% range over the medium term. And then you've also heard us talk about the fact that we are leaning into the most attractive margin and fastest-growing segments in our group business, the local markets and also continuing to expand supplemental health. And we saw local market premium growth deliver its strongest growth that we've seen in nearly a decade. And as it relates to supplemental health, that premium grew 28%. So we feel really good about where we are. And again, we'll continue to prioritize margin over top line growth.
Speaker 1
Thank you for joining us this morning. We're happy to address any follow-up questions you may have. Please e-mail us at [email protected].
Operator
Ladies and gentlemen, that concludes today's call. Thank you all for joining. You may now disconnect.