Operator
Ladies and gentlemen, thank you for standing by. My name is Krista, and I will be your conference operator today. At this time, I would like to welcome you to the Lincoln National Corporation fourth quarter 2025 earnings webcast. All lines have been placed on mute to prevent any background noise. After the speakers' remarks, there will be a question and answer session. If you would like to ask a question at that time, simply press star then the number 1 on your telephone keypad. And if you would like to withdraw that question, press star 1 again. Thank you. I would now like to turn the conference over to John Mutheng, Head of Investor Relations. John, please go ahead.
Speaker 1
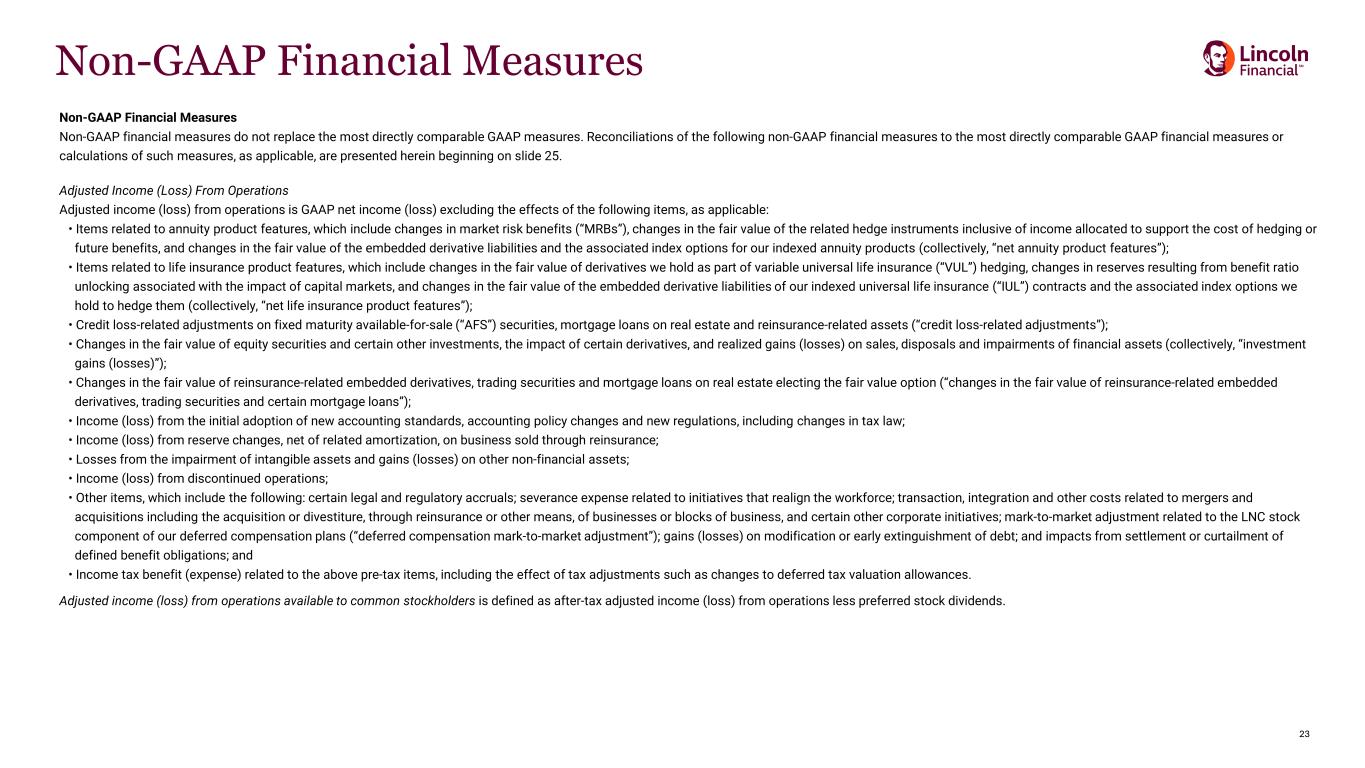
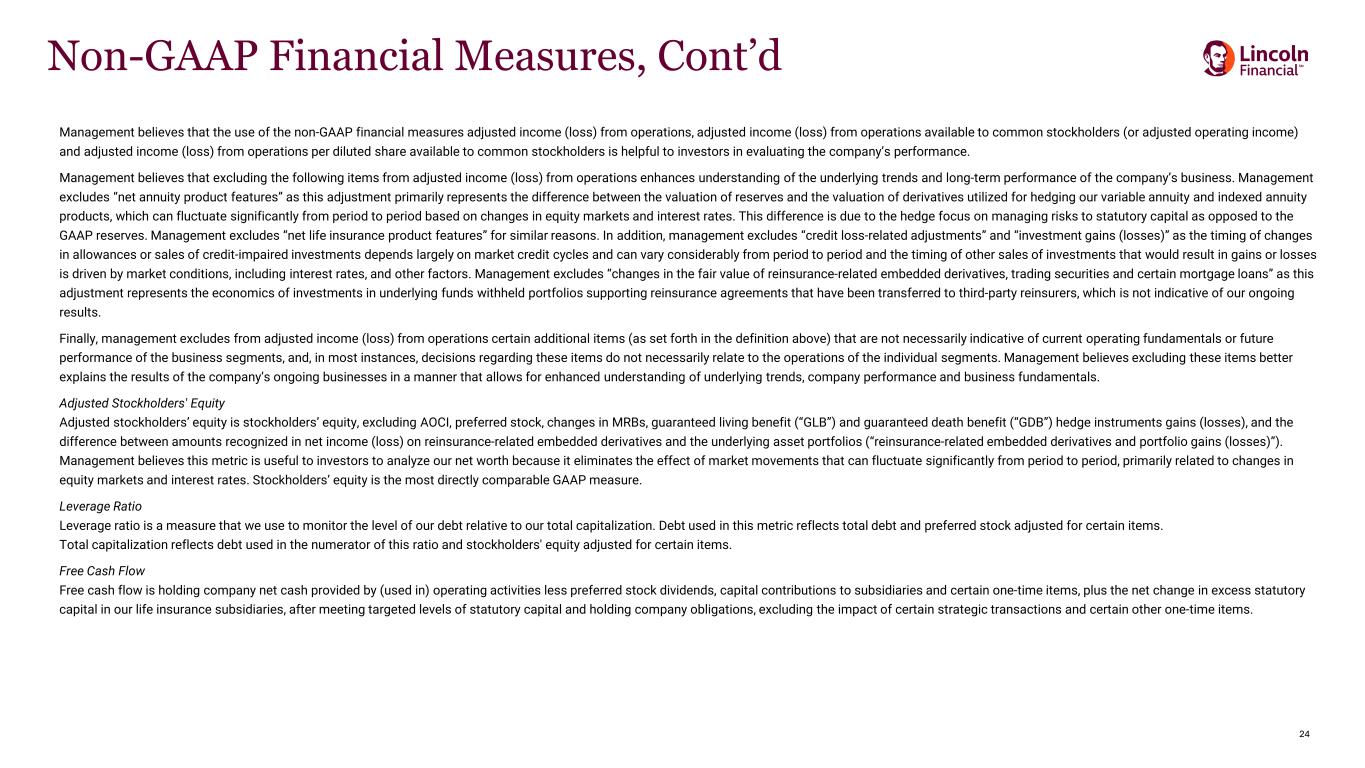
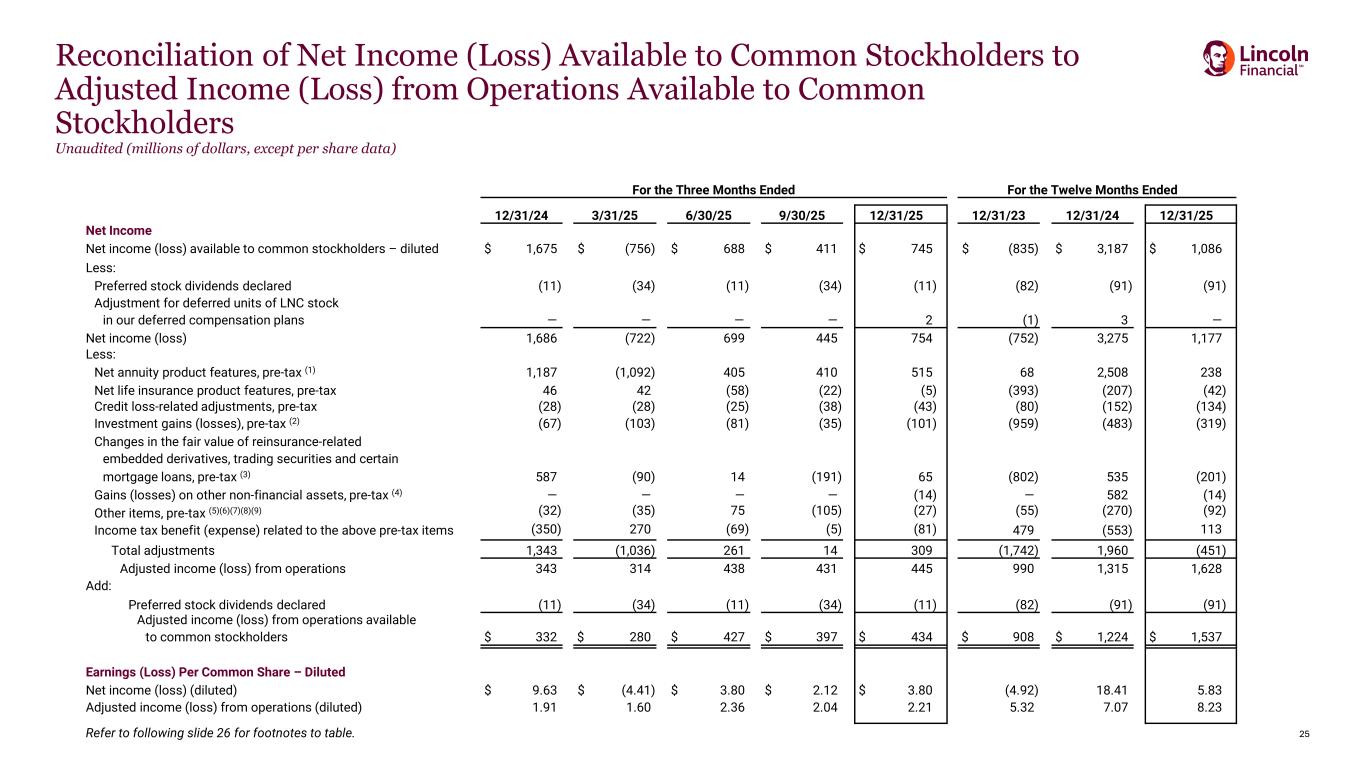
Good morning, everyone, and welcome to our fourth quarter earnings call. We appreciate your interest in Lincoln National Corporation. Our quarterly earnings press release, earnings supplement, and statistical supplement can all be found on the Investor Relations page of our website, investors.lfg.com. These documents include reconciliations of the non-GAAP measures used on today's call including adjusted income from operations and adjusted income from operations available to common stockholders, adjusted operating income to their most comparable GAAP measures. Before we begin, I want to remind you that any statements made during today's call regarding expectations, future actions, trends in our businesses, prospective services or products, future performance or financial results, including those relating to deposits, expenses, income from operations, free cash flow or free cash flow conversion ratios, share repurchases, liquidity and capital resources, as well as any statements regarding our 2026 and medium term outlook and future strategic initiatives are forward-looking statements under the Private Securities Litigation Reform Act of 1995. These forward-looking statements involve risks and uncertainties that could cause our actual results to differ materially from our current expectations. These risks and uncertainties include those described in the cautionary statement disclosures in our earnings release issued earlier this morning as well as those detailed in our 2024 Annual Report on Form 10-K, most recent quarterly reports on Form 10-Q, and from time to time in our other filings with the SEC. These forward-looking statements are made only as of today, and we undertake no obligation to correct or update any of them to reflect events or circumstances that occur after today. Presenting this morning are Ellen G. Cooper, Chairman, President, and CEO, and Christopher Michael Neczypor, Chief Financial Officer. After their prepared remarks, we will address your questions. I will now turn the call over to Ellen G. Cooper. Ellen?
Speaker 2
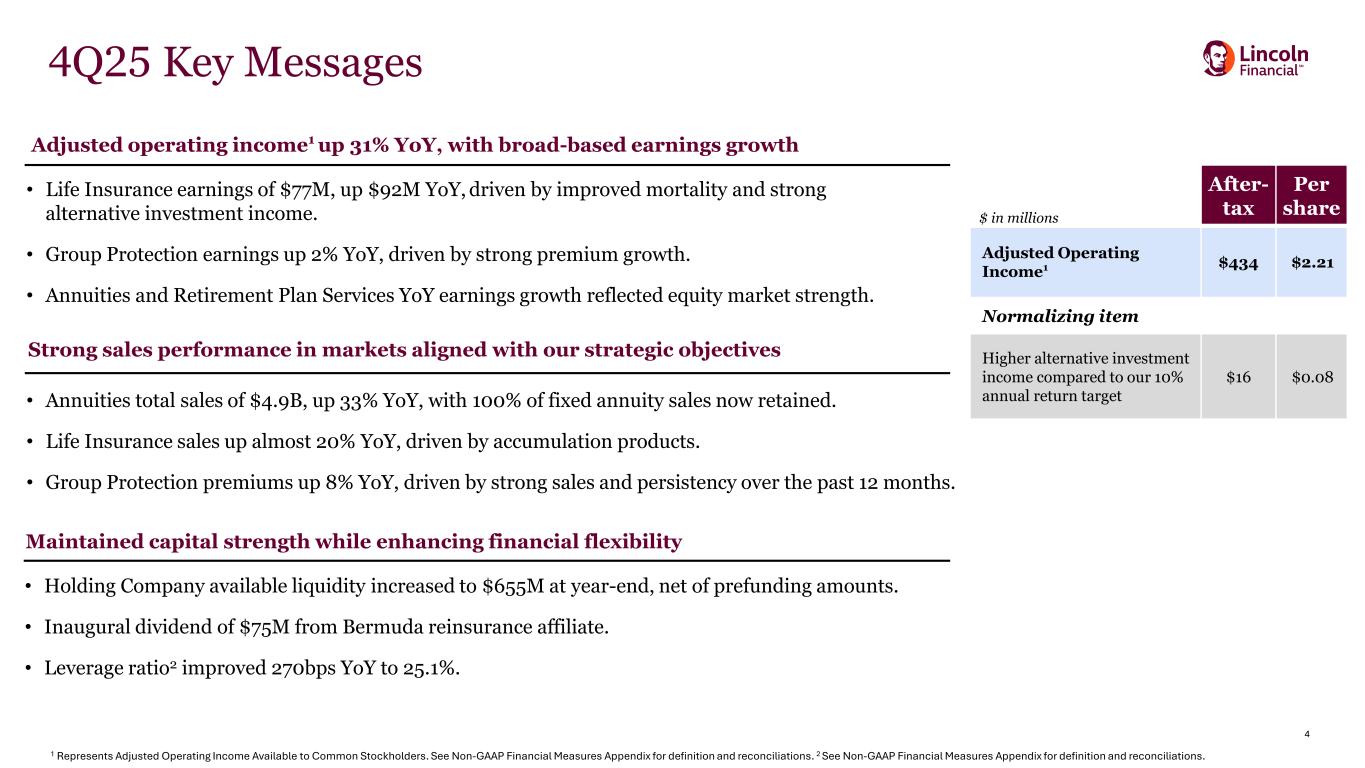
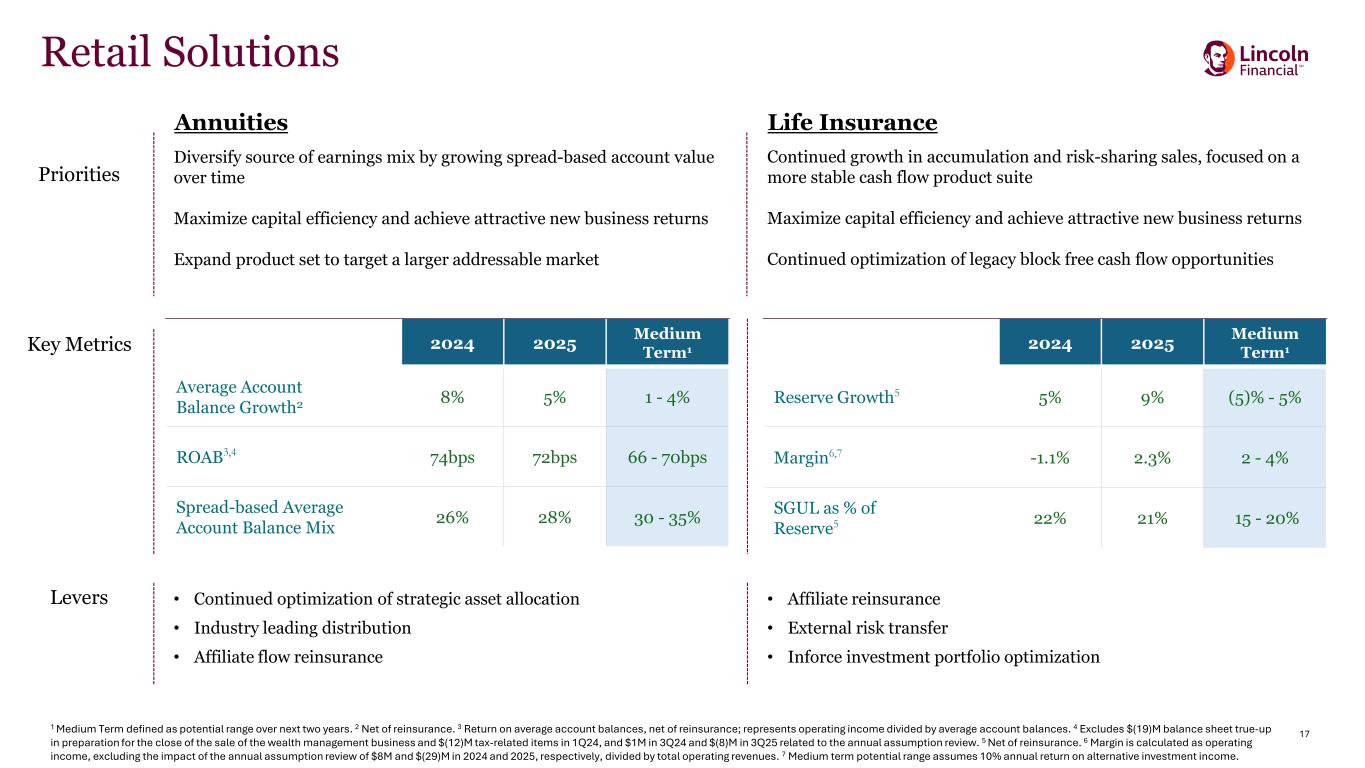
Thank you, John, and good morning, everyone. Thank you for joining our call today. Our fourth quarter performance was strong, with adjusted operating income increasing 31% year over year and our full year adjusted operating income increasing to its highest level in four years, underscoring the progress we have made as we advance our strategy with discipline and focus across Lincoln National Corporation. This was also our sixth consecutive quarter of year over year adjusted operating earnings growth with solid performance across the business aligned with our objective of further diversifying our mix. These results were supported by the continued advancement of our strategic realignment, operational execution, and a more resilient capital foundation. Before I walk through the quarter's highlights, I want to step back and reflect on what we have accomplished since we began this journey in 2023. Over the course of the past several years, we remained focused on executing against the strategic priorities we laid out to evolve the direction of the company with a focus on increasing our risk-adjusted return on capital, reducing the volatility of our results, and growing our franchise. The fundamental principles of foundational capital, a more efficient operating model, and our efforts to drive profitable growth are coming through in our results with clear evidence of building broad-based momentum balanced against a strategic awareness of where more work needs to be done. With that context, I will briefly frame our progress against the three priorities that continue to guide our strategy. Following several years of strengthening the balance sheet, our capital foundation remains durable and resilient. Capital levels remain well above our established buffer, and our leverage ratio has meaningfully improved. With this foundation firmly in place, we remain focused on continuing to improve returns on capital and to manage capital with greater flexibility over time. We also made meaningful headway in optimizing our operating model, creating a more efficient and scalable organization. We have sustained expense discipline, combining prior firm-wide actions with continued targeted initiatives this year. And we see additional targeted opportunities ahead while continuing to invest strategically to support our long-term priorities. We are also making operational enhancements, streamlining processes to support employee productivity and efficiency, enhancing digital and automated capabilities to better serve our customers, and evolving our distribution strategy to strengthen our go-to-market approach. Our investment strategy has been further refined, expanding our asset sourcing capabilities and leveraging our external partnerships to enhance ongoing risk-adjusted yield. The role of our Bermuda affiliate expanded over the year and we will continue to leverage it to enhance capital efficiency in support of our broader strategy. Collectively, these actions build upon the more stable foundation we have established, reinforcing more efficiency and sustainability of performance. Lastly, over the course of the year, we advanced profitable growth across the enterprise with clear progress across each business. Some businesses are further along in their strategic realignment and their performance reflects that, while others are at earlier stages. Across the company, our emphasis is on products and segments with higher risk-adjusted margins, more stable cash flows, and greater capital efficiency to strengthen the resilience of the business over time. The cumulative impact of these actions is translating into stronger core capital generation for the company, which in turn supports capital deployment that sharpens our competitive advantages, reinforces our strategic moat, and supports long-term free cash flow generation. Results may not be linear, markets can be volatile, and the economic backdrop could change, but we remain steadfast in our commitment to deliver results that drive long-term value. Our momentum continues to build, our progress is increasingly evident, we remain focused on the path ahead. Let me turn to our businesses where I will walk through our results and how we are positioning each to continue building on our progress in the years to come. Starting first with annuities. We are a leader in this market, offering a broad set of products across RILA, fixed, and variable annuities both with and without living benefits, enabling us to meet customers across different needs and market environments. Our deep, longstanding distribution relationships and consultative approach continue to broaden our reach and strengthen our position. Over the past two years, we have built important infrastructure to support this business including our Bermuda affiliate, expanded investment platform, and enhanced product features. These capabilities support our go-to-market strategy and position our annuities business for sustained success in an evolving market. In 2025, we delivered strong annuity sales with total volumes up 25%. Approximately two-thirds of those sales came from spread-based products consistent with our strategy to evolve toward a more balanced and less market-sensitive mix over time. Full year RILA sales increased 35% in 2025 reflecting our differentiated product features that continue to resonate with customers. Fixed annuity sales increased 11% underpinned by the capabilities we have built to support a consistent presence. Full year variable annuity sales increased 27% year over year, as our product offerings coupled with the favorable market environment supported sales growth in variable annuity, with and without guaranteed living benefits. 2025 sales volumes in part reflected a strong market environment and customer demand. In 2026, we remain focused on balancing profitability, capital efficiency, and lower market sensitivity over time, prioritizing profitable growth over top-line sales growth. I will speak to each of our annuity product segments to provide additional context. For variable annuities, we expect 2026 volumes to be intentionally lower and more closely aligned with pre-2025 levels as part of our effort to reduce exposure to market sensitivity over time. In fixed annuities, we are now retaining 100% of sales following the exit of the external flow reinsurance treaty. Looking ahead, sales levels will continue to reflect market dynamics as we advance our profitable growth priorities and we expect our fixed annuity account values to increase relative to 2025. Within the fixed annuity category, we see attractive growth opportunities in fixed indexed annuities where differentiated crediting rate strategies and product features support our return objectives and allow us to compete beyond price. In RILA, customer demand continues to expand alongside increasingly competitive dynamics. Our approach remains anchored in disciplined target return thresholds and differentiated product features, factors that directly inform where we choose to compete. As a result, and a deliberate focus on more profitable segments of this market, sales levels may remain broadly consistent with the past two to three years as we see greater longer-term growth opportunity in fixed annuities relative to RILA. Importantly, our position as a leading annuity provider with a diversified set of chronic capabilities supported by a broad distribution footprint gives us the flexibility to reallocate capital efficiently toward the opportunity set offering the most attractive returns as market dynamics evolve. We also remain focused on broadening our distribution partnerships across the annuity market, aligned with a disciplined focus on segments that support higher risk-adjusted returns on capital and profitable growth. At the same time, we are expanding our product offerings and continuing to build digital tools and capabilities that enhance the value we deliver to our partners, particularly in areas where we see the strongest opportunities and can compete beyond price. Taken together, these dynamics underscore a disciplined framework for allocating capital across the annuity platform toward higher risk-adjusted return opportunities supported by product breadth, distribution strength, and prudent capital deployment. Turning to life. We continue to make meaningful progress repositioning the business over the course of the year. Our efforts have been focused on improving the performance of the in-force block and pivoting the new business franchise toward accumulation and protection products with more balanced risk profiles that support stable cash flows. At the same time, we have advanced the modernization of our infrastructure to get closer to the point of sale and further optimized our distribution footprint. The strength of our distribution platform has enabled us to deepen relationships with key partners and expand our reach into markets where we see attractive growth opportunities. These actions are supporting both improved financial outcomes and stronger sales momentum. For the full year, excluding the impact of our annual assumption review, earnings improved meaningfully. Sales for the year were up approximately 50% versus the prior year. Full year core life sales, which exclude executive benefits, increased 4% compared to the prior full year. It is worth noting that fourth quarter's core life sales included some larger cases, which can vary from period to period. We expect core life sales to grow in 2026 but from a baseline more in line with the earlier quarters of 2025, as we continue to prioritize profitable growth for the business. Executive benefits had a record year with sales of $265 million up from $59 million in 2024, reflecting the foundational investments we have made in this business centered around product capabilities, distribution relationships, and our service model. While large case activity will naturally vary, we are encouraged by the trajectory we are building in this segment and expect to have a consistent presence in this market going forward. From a franchise perspective, we continue to strengthen the new business momentum across our targeted product lines. Execution against our strategy remains focused on repositioning sales towards solutions with more favorable risk characteristics, improving the financial professional experience through digital tools and operational excellence, and expanding distribution reach through targeted product launches. Together, these efforts are reinforcing the trajectory of the life business and supporting a more consistent contribution over time. Overall, we are pleased with the progress we made in life this year, and where this business is positioned heading into 2026. In Group Protection, we continue to execute effectively against a targeted strategy to deliver value across three distinct market segments: local, regional, and national, with an emphasis on the fastest growing markets, local markets, and supplemental health. Group delivered another outstanding year with strong earnings and premium growth and full year sales largely in line with the prior year. Full year earnings, excluding the impact of our annual assumption review, increased 16% year over year. Full year premium growth of nearly 7% was broad-based, with growth across all products and segments driven by strong sales and persistency along with disciplined pricing. Full year sales, as mentioned previously, were roughly in line with last year's results with growth in local and regional markets, supplemental health sales increasing over 40%, further diversifying the book. Overall, this strong performance reflects deliberate choices in how we are tailoring products and services by segment, supported by continued investment in the capabilities and infrastructure that support our customers to manage their benefits more effectively. As we look to 2026, we expect to build on this momentum as we continue to diversify the business with growth increasingly driven by strong persistency and disciplined premium growth. With that context, I will walk through how this translates across our local, regional, and national segments. In local markets, where we see the strongest margin profile, we are focused on accelerating growth by delivering bundled solutions that emphasize ease of doing business, leveraging our focused local distribution footprint. In regional markets, we are reinforcing stronger strategic broker partnerships and expanding our technology integrations and digital capabilities to better support employers and their benefit decisions. In national accounts, where clients demand robust capabilities, we are tailoring products and services enabled by our integrated technology and streamlined processes, leveraging both our market-leading leave management expertise and deep broker relationships. And across all of our segments, supplemental health remains a key priority. Across each segment, the focus remains on disciplined execution and serving customers while supporting sustainable growth over time. Overall, the fundamentals of this business remain strong, and Group is well positioned as we move forward. Turning to Retirement Plan Services. For the full year, earnings were relatively steady with modest pressure reflecting ongoing headwinds, including participant outflows. At the same time, we continue to see strong sales and total deposits, underscoring that our value proposition is resonating with customers and that our focus on participant outcomes is gaining traction. As we begin the next phase of our realignment work, our focus is on sharpening where and how we compete. We see opportunity to build on our strengths in the more profitable parts of the market, including leveraging our distribution footprint and supporting growth in higher margin areas such as the small market segment. Looking ahead, our priorities are centered on improving the earnings profile of the business over time by expanding revenue sources within the existing customer base, broadening products and services where customer demand is strongest, and taking targeted actions to improve operating efficiency. We also see opportunity to further optimize the investment strategy to support our stable value offerings. While this work will take time, the momentum we are seeing with customers reinforces our confidence in the strategic direction and our ability to steadily improve the quality and durability of earnings in this business over time. Stepping back, we are pleased with the progress we have made. Today's results demonstrate disciplined execution as we continue to shape the enterprise, strengthen the earnings profile, and improve the durability of the business. At the same time, we recognize there is more work ahead. We are operating from a position of strength, which gives us the flexibility to invest where we see the greatest opportunities while remaining disciplined in how we deploy capital across the enterprise. As we enter 2026, we do so with clarity on our priorities, momentum in our results, and confidence in what we are building. We remain focused on delivering against our objectives and continuing to build long-term shareholder value over time. I will now turn the call over to Christopher Michael Neczypor to discuss our fourth quarter and full year results and our outlook. Chris?
Speaker 3
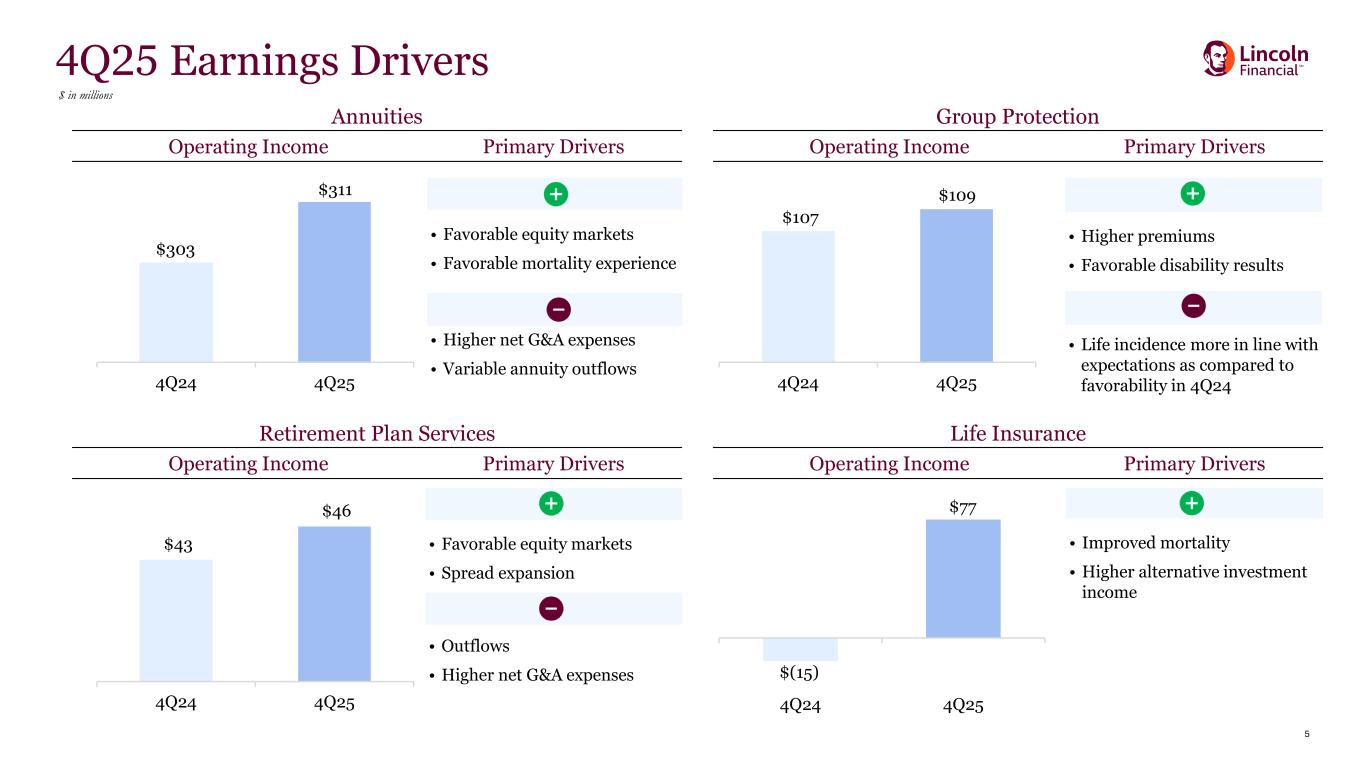
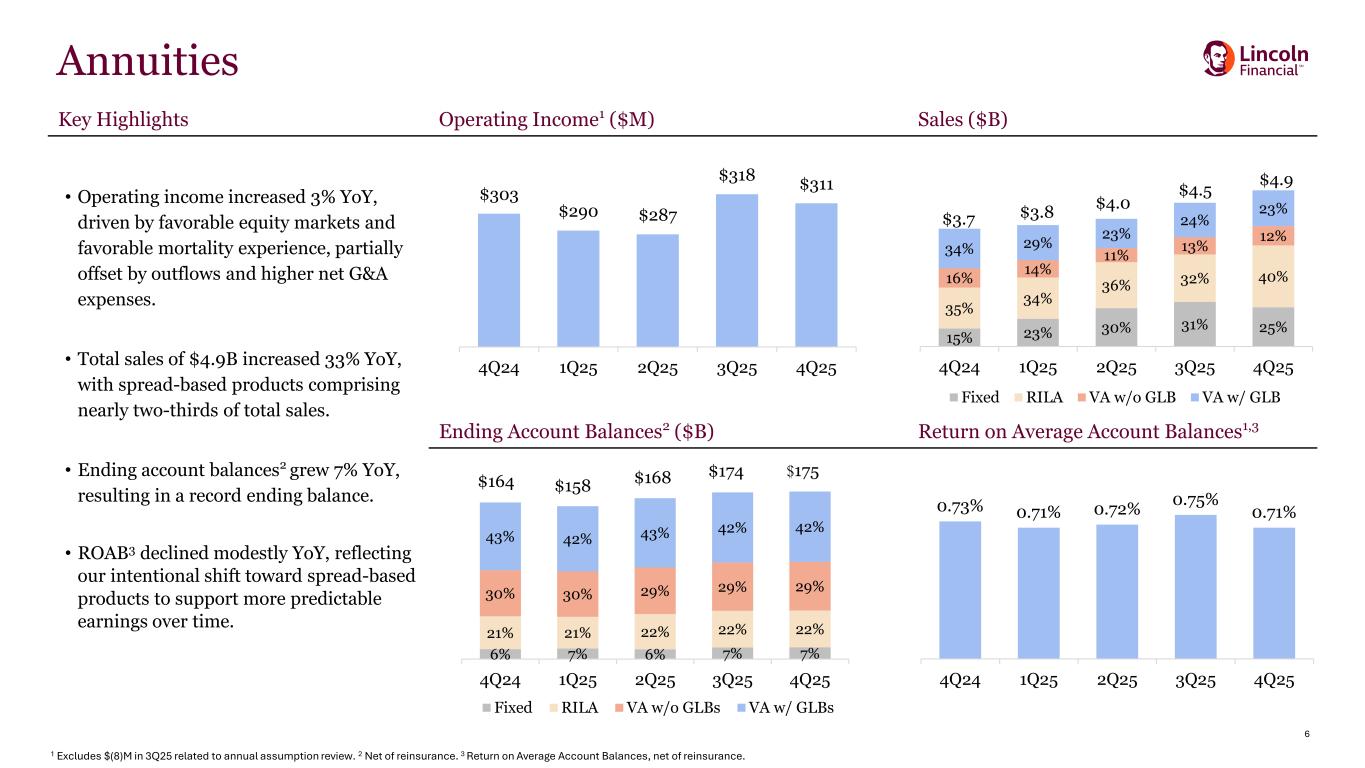
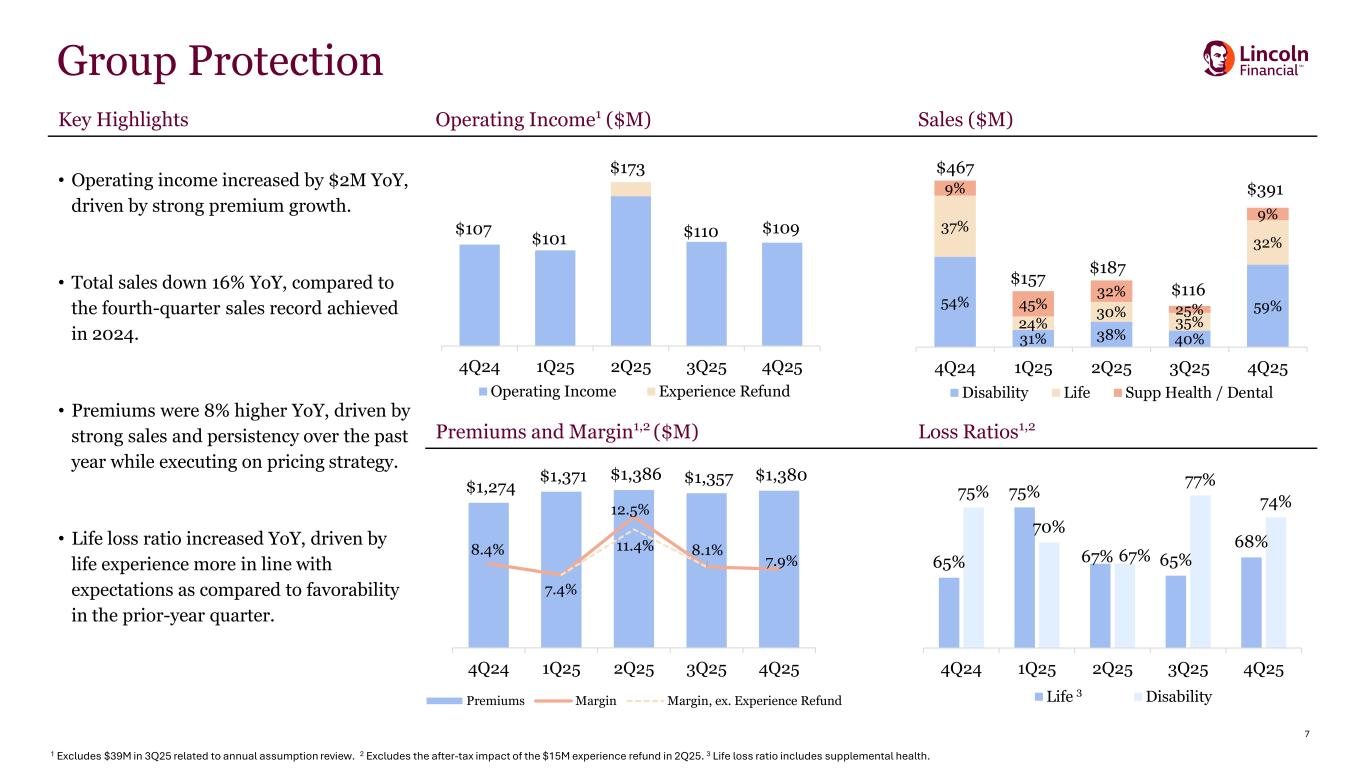
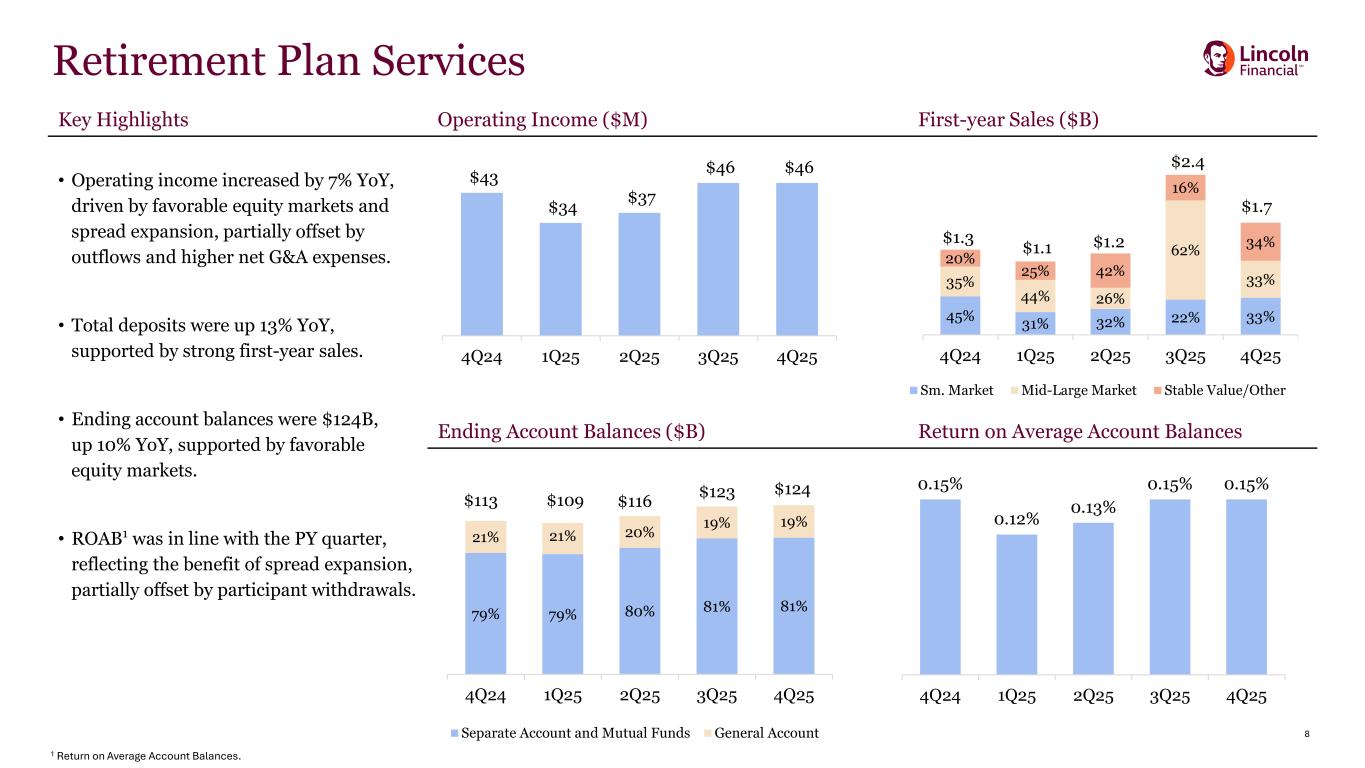
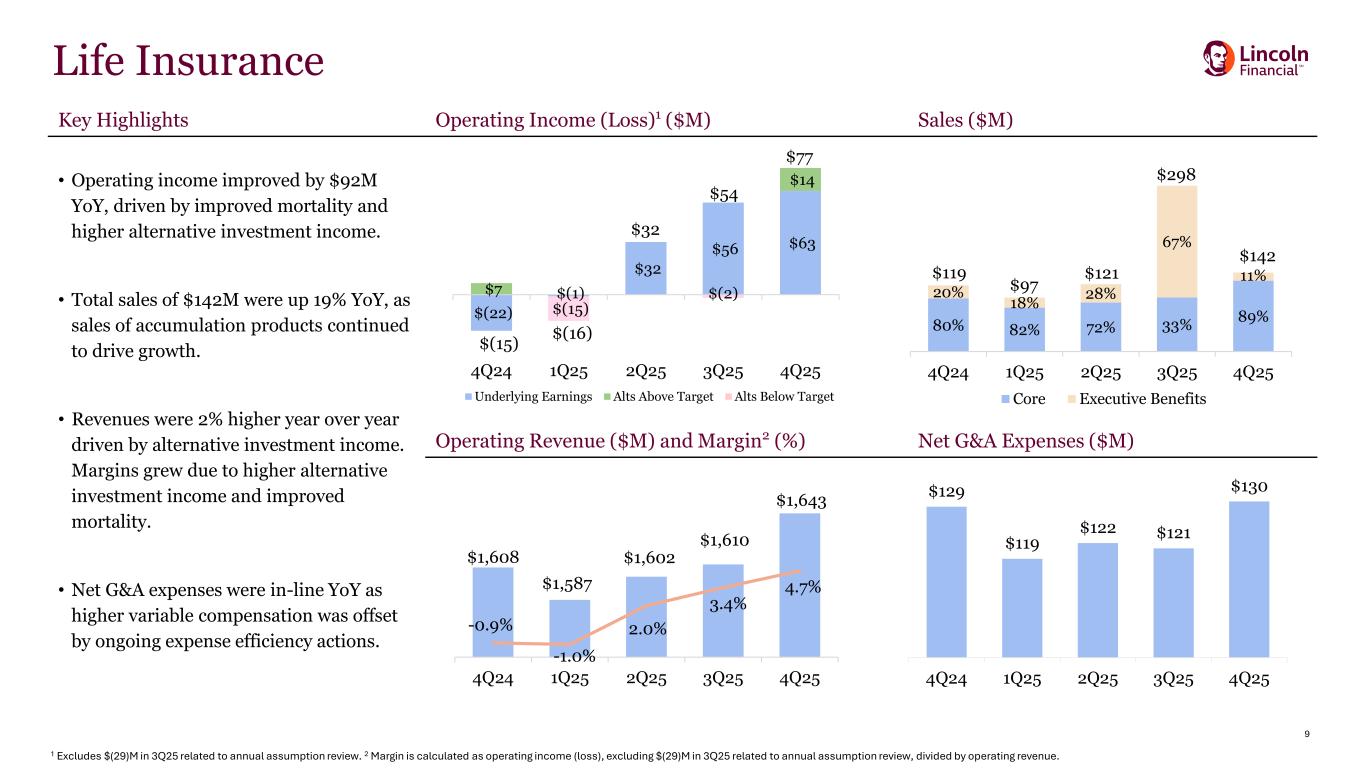
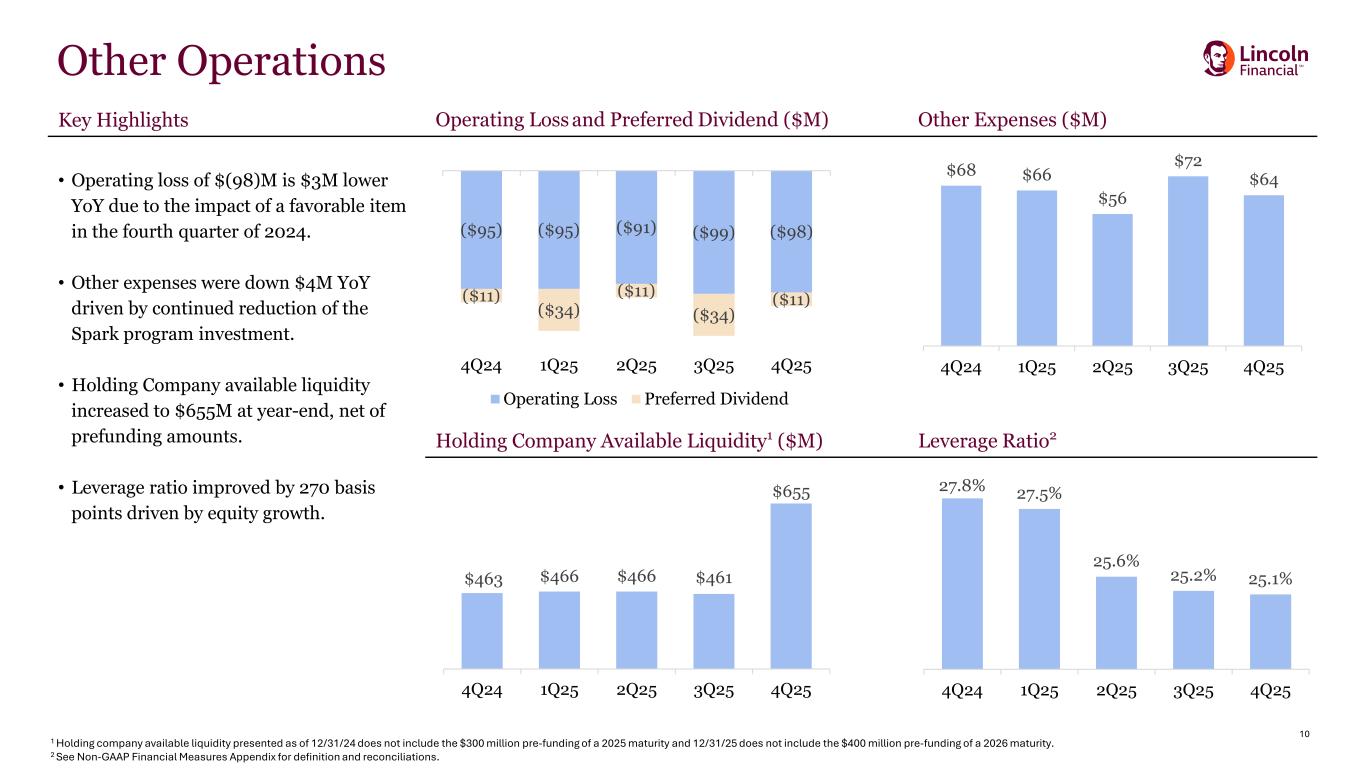
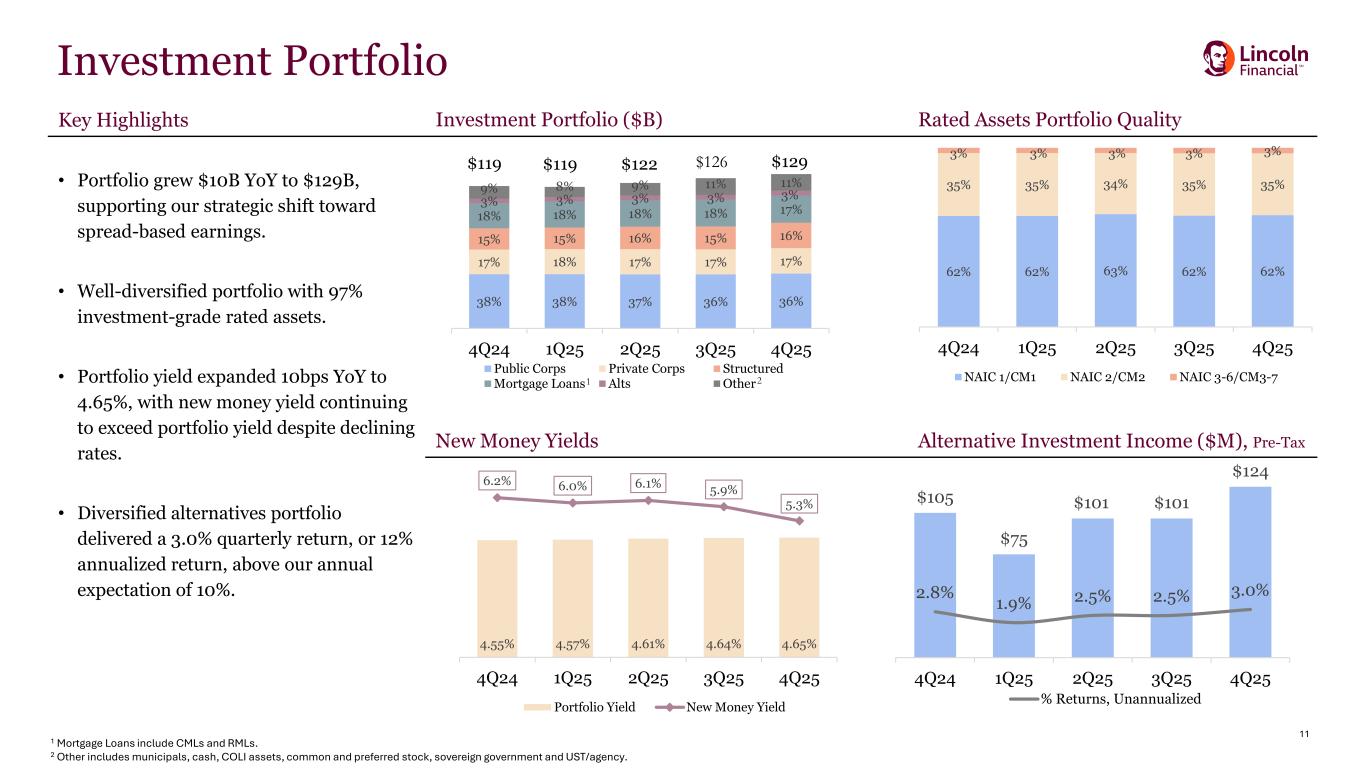
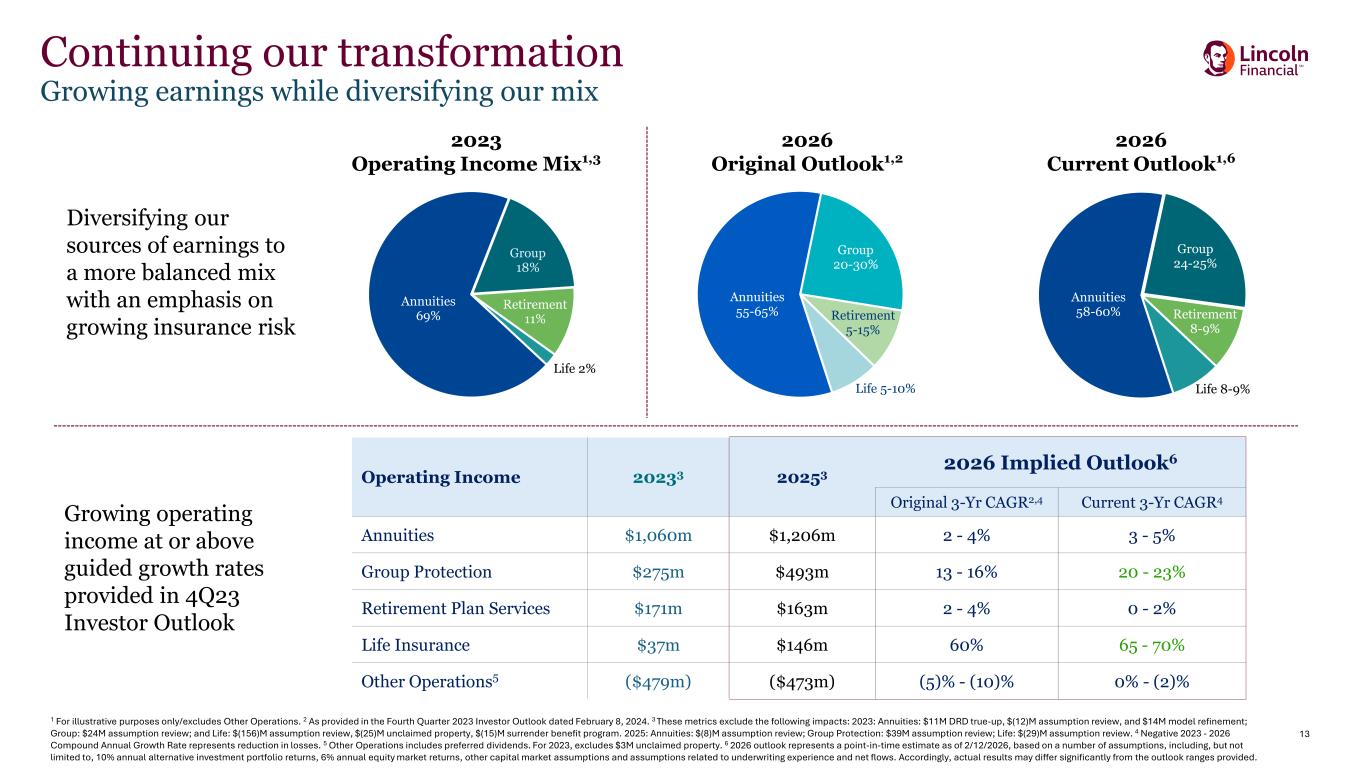
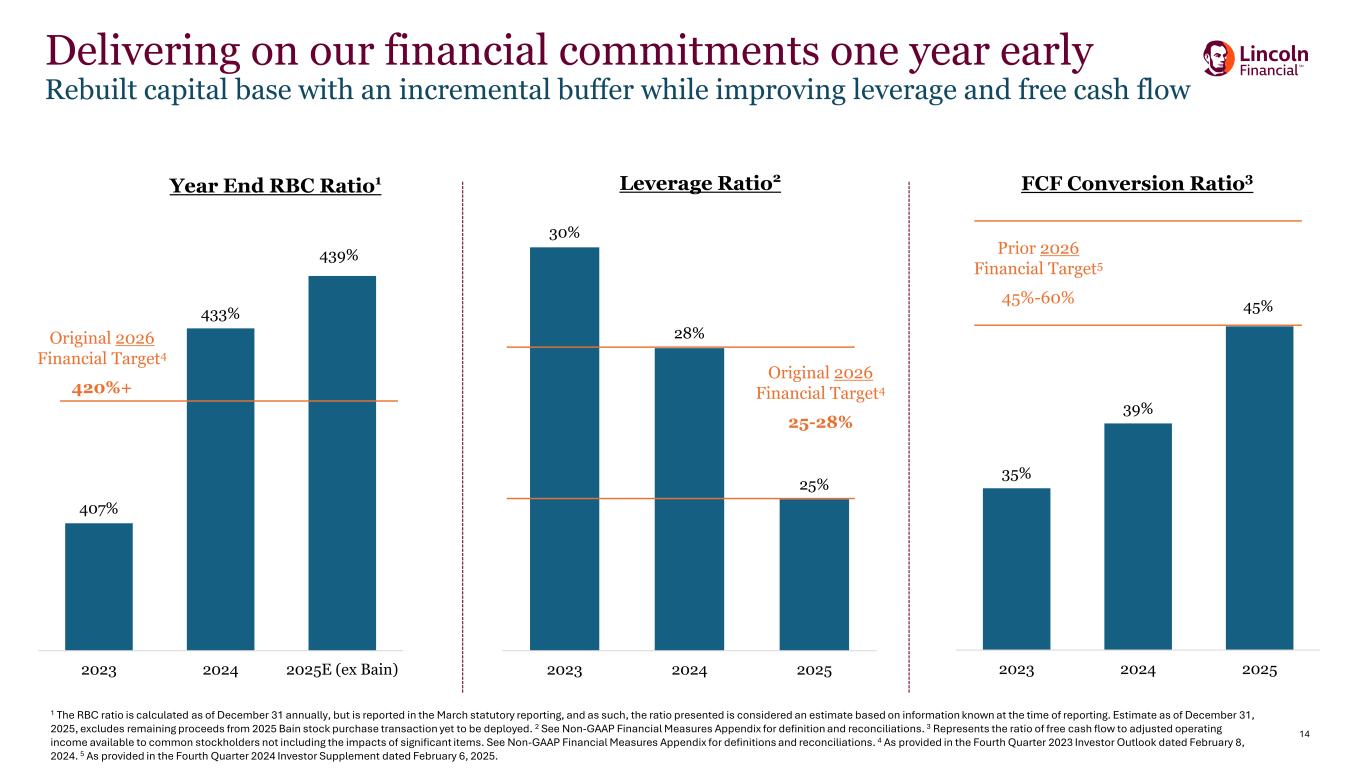
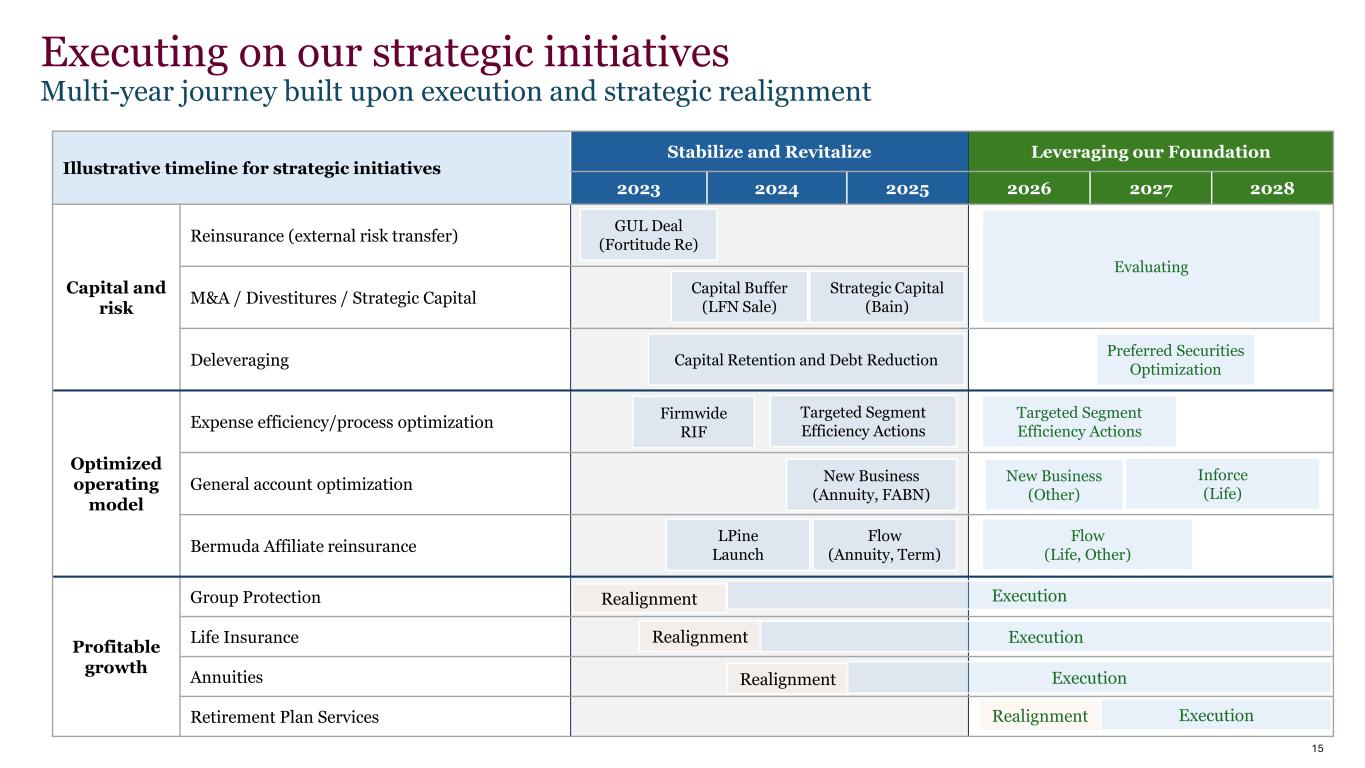
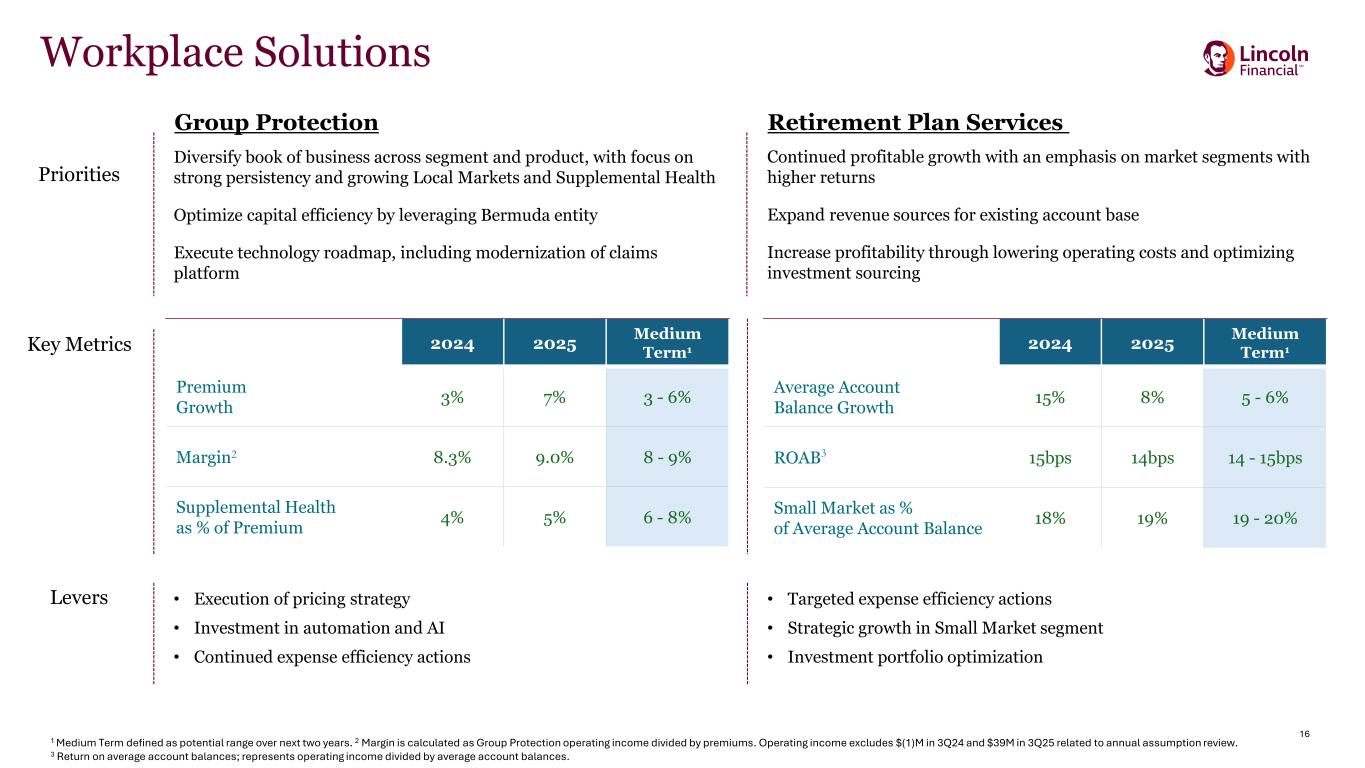
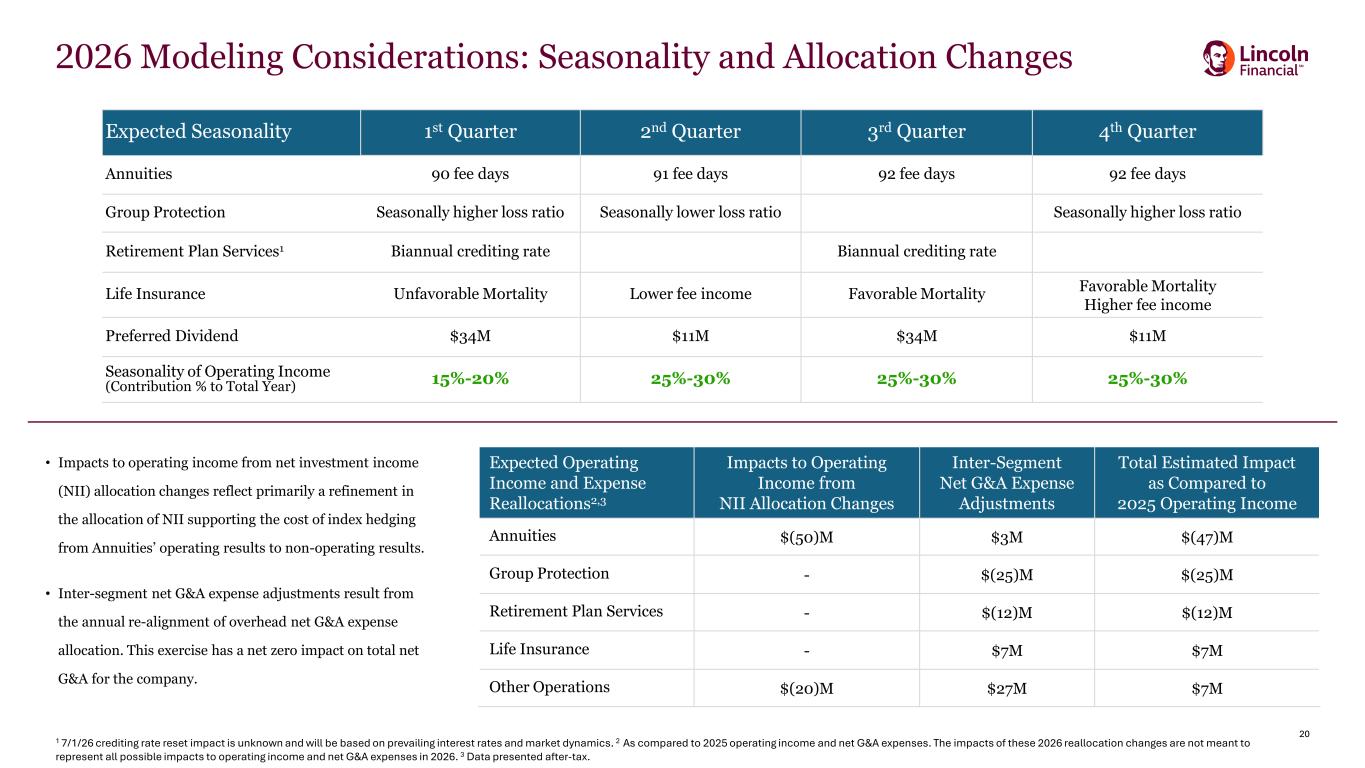
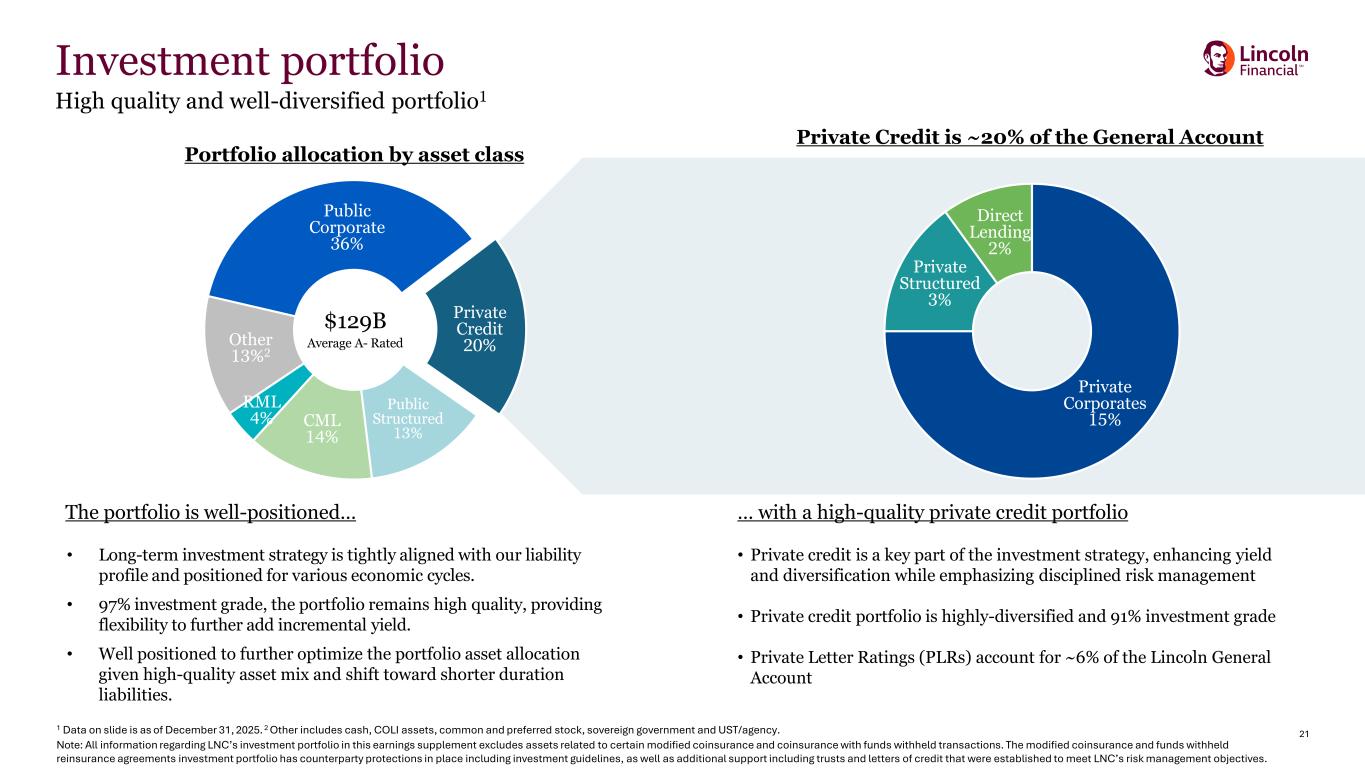
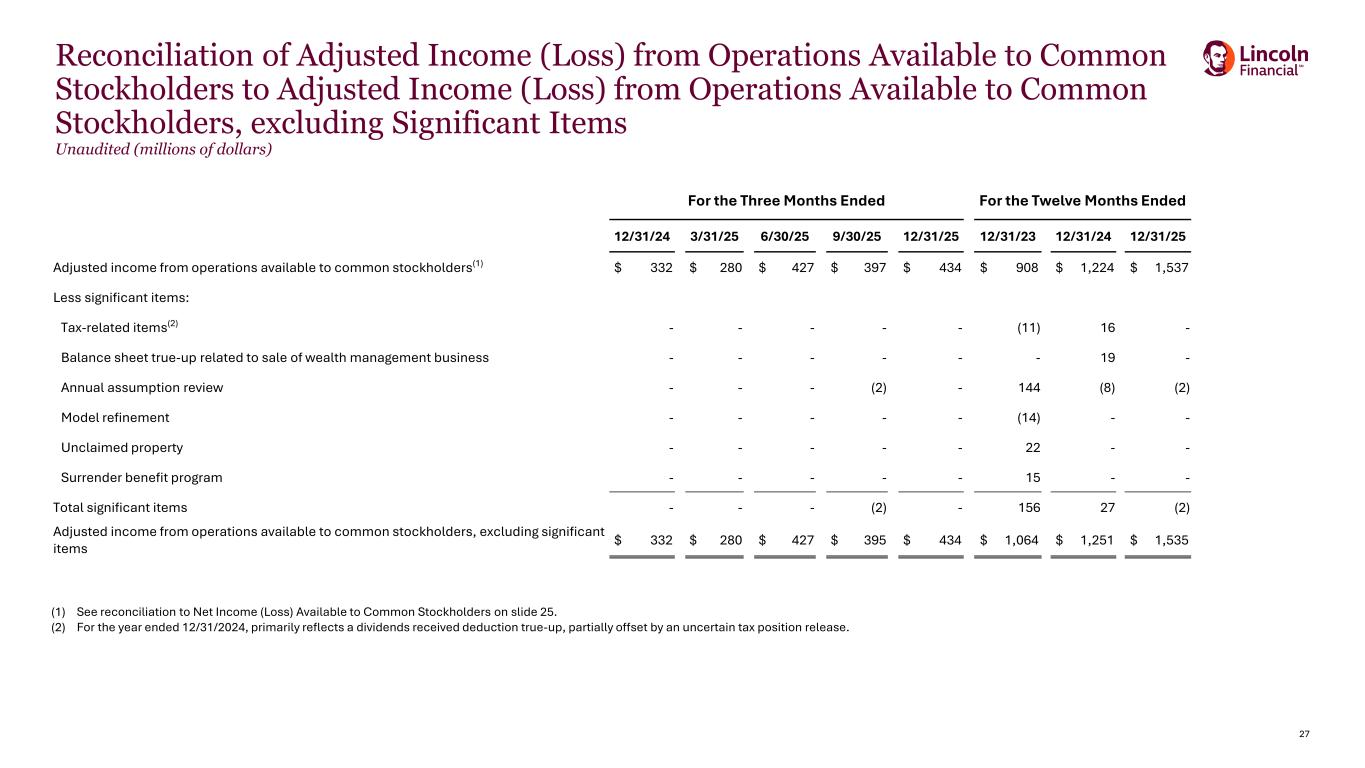
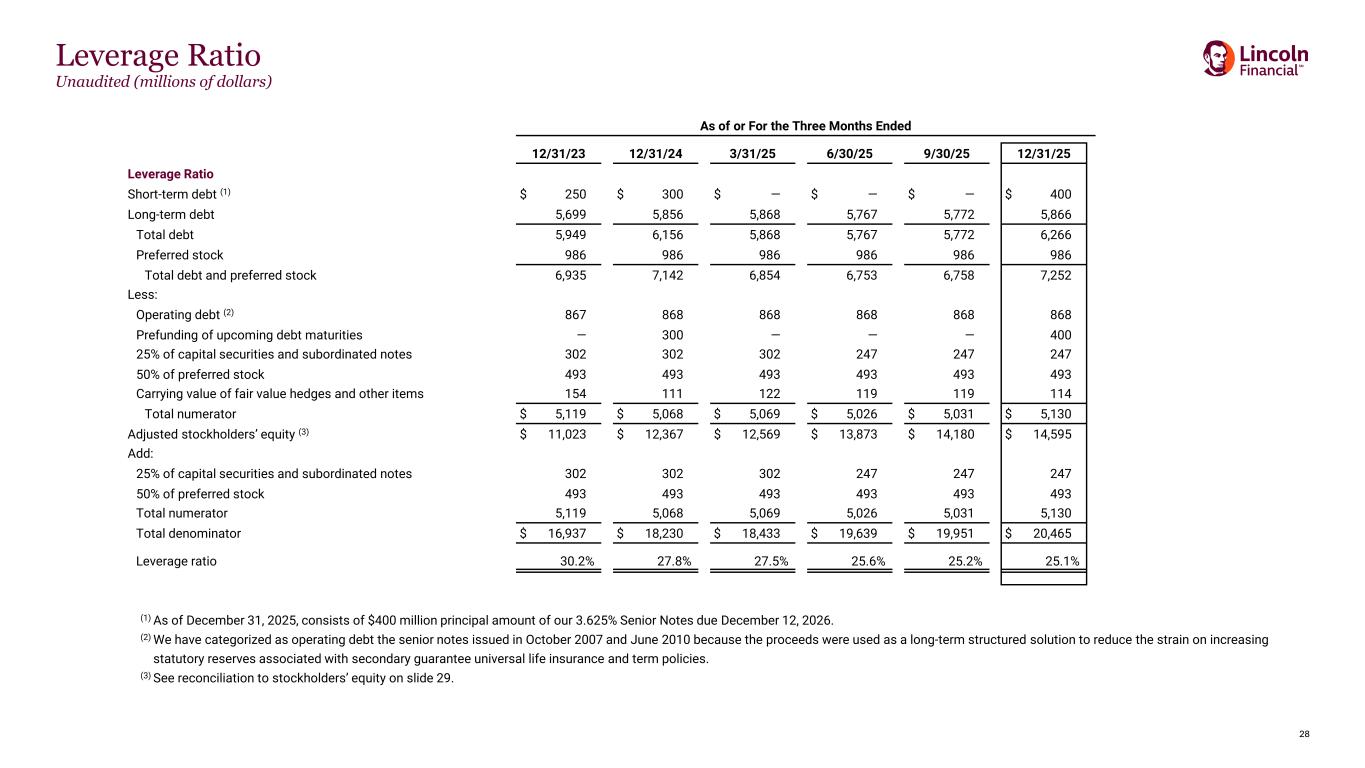
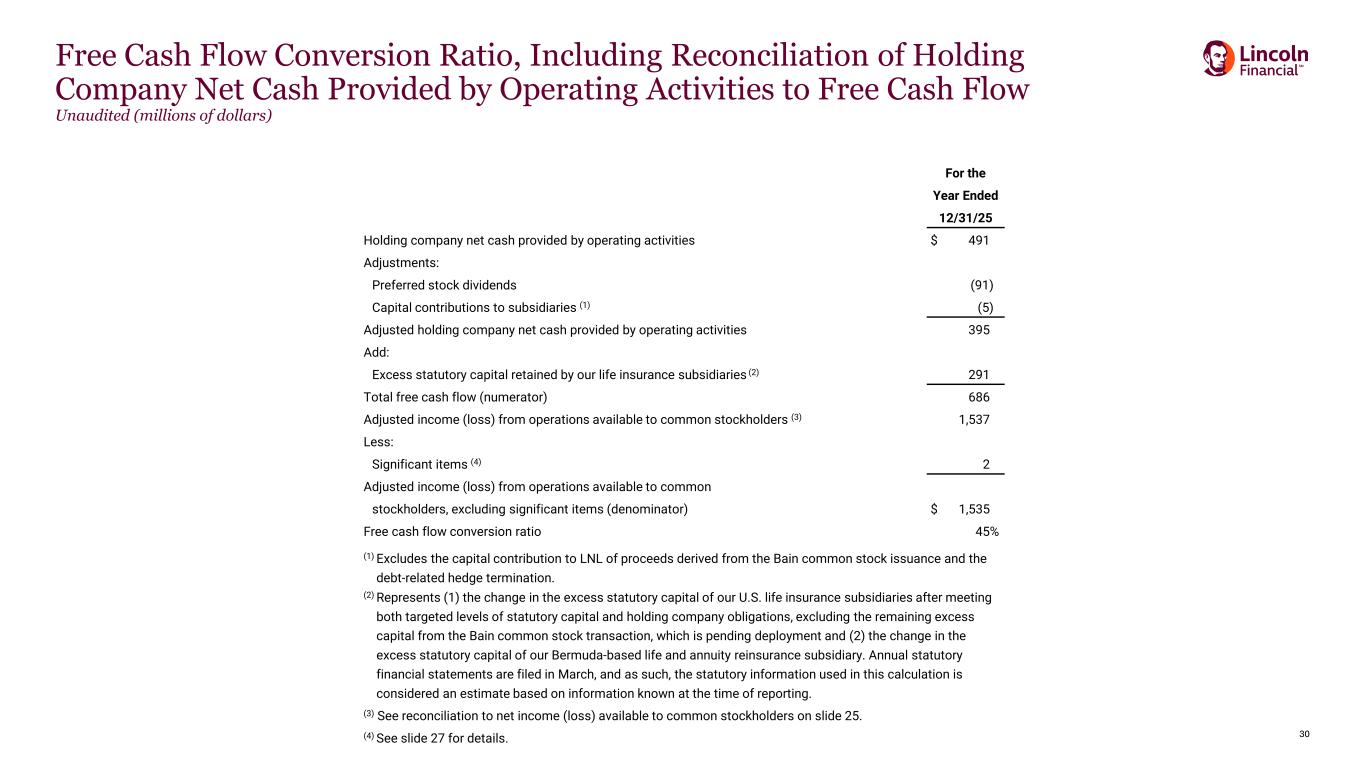
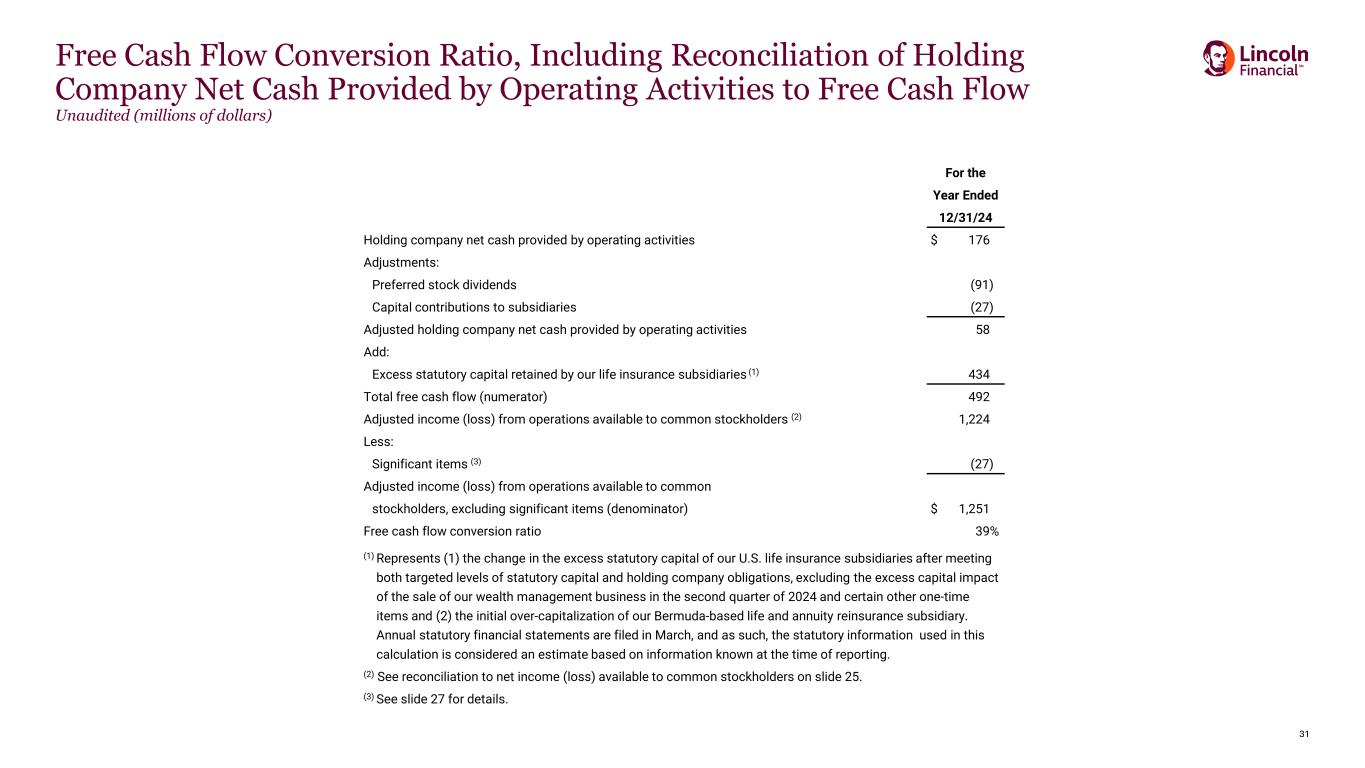
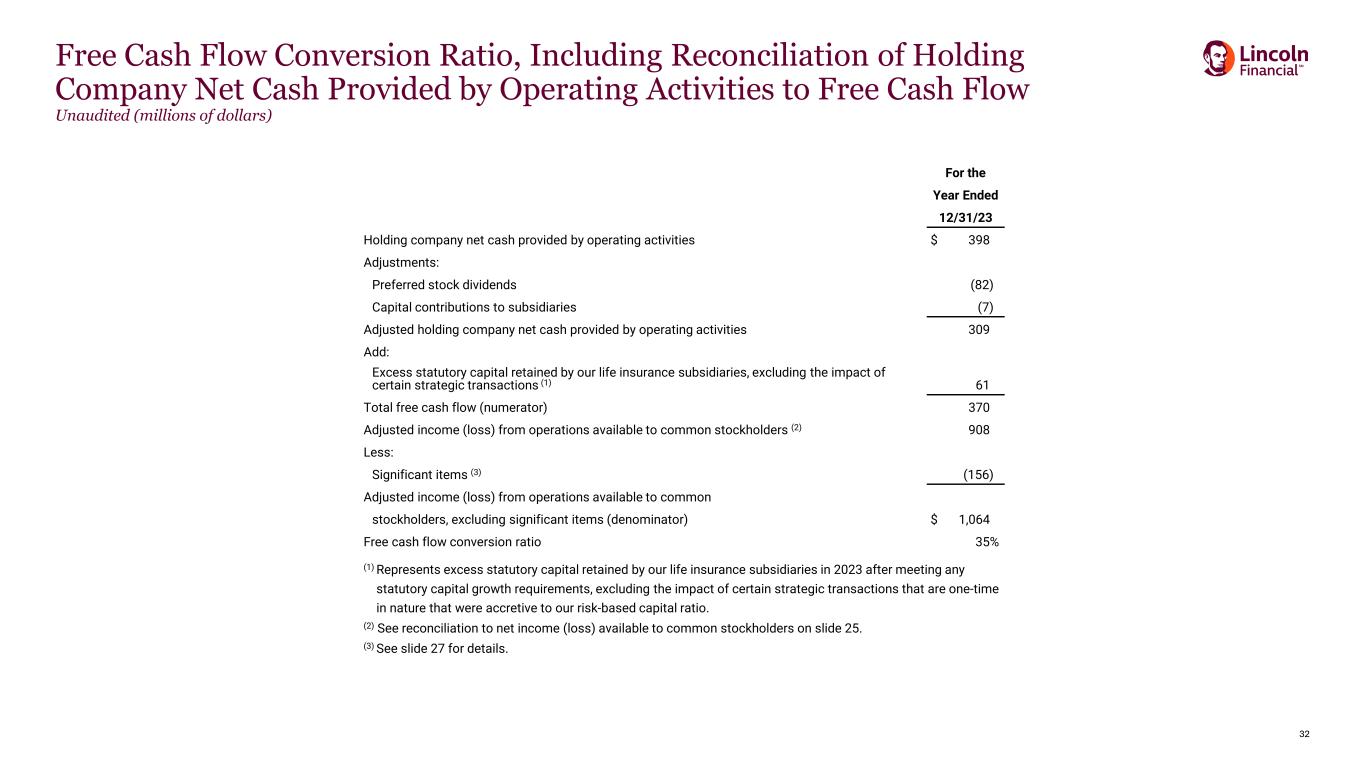
Thank you, Ellen, and good morning, everyone. Our fourth quarter results represent another quarter of strong execution and meaningful progress on our strategic priorities, delivering adjusted operating income growth for the sixth consecutive quarter. For the full year, 2025 marks our third consecutive year of growth with each of our businesses contributing to a result that reinforces the broader momentum we have built across the enterprise. Alongside solid earnings, we continued our emphasis on free cash flow generation and capital efficiency, reinforcing Lincoln National Corporation's ability to deliver attractive risk-adjusted returns and positioning the company for sustained long-term success. This morning, I will focus on three areas. First, I will review our fourth quarter and full year results including our segment level financial performance. Second, I will provide an update on our investment portfolio. And third, I will offer an update on our capital position and our outlook. Let's begin with a recap of the quarter. This morning, we reported fourth quarter adjusted operating income available to common stockholders of $434 million, or $2.21 per diluted share. There were no significant items in the quarter. Our alternative investments portfolio delivered an annualized return of nearly 12% for the quarter, or $124 million. On an after-tax basis, this was approximately $16 million above our target, or $0.08 per diluted share. Excluding the impacts of significant items in each year, full year 2025 adjusted income from operations available to common shareholders was over $1.5 billion, a 23% improvement compared to 2024. This result reflects strong execution across our businesses with year over year earnings growth driven by favorable underwriting experience in Life and Group Protection, continued spread expansion, and the benefit of higher equity markets. Turning to net income for the quarter. We reported net income available to common stockholders of $745 million, or $3.80 per diluted share. The difference between GAAP net income and adjusted operating income was driven primarily by the positive movement in market risk benefits amid slightly favorable interest rates and modestly higher equity markets. Our hedge program continues to perform in line with expectations. Now turning to our segment results, starting with Group Protection. Delivered another strong quarter, capping a record year. Fourth quarter operating income was $109 million, up from $107 million in the prior year quarter, and the margin was 7.9%. Modest improvement in earnings year over year was driven by the disability loss ratio, improving to 73.6% from 75% in 2024. Improvement reflected favorable new claim severity partially offset by lower recoveries and smaller average resolution amounts. As discussed last quarter, we typically experience seasonal pressure in our disability loss ratio from the third to fourth quarter, and that did materialize within expectations. However, the favorable severity in our new and in-force claims more than offset the seasonal headwinds, ultimately resulting in a decreasing sequential loss ratio. Partially offsetting the improved disability result was a normalization in our group life loss ratio. The fourth quarter life loss ratio of 67.9% was higher than the record low 64.7% we delivered a year ago, though it remains favorable compared to historical experience and reflects the continued benefit of our disciplined pricing actions. Touching briefly on the full year, excluding the impact of our annual assumption review, Group delivered operating earnings of $493 million, up 16% from $426 million in 2024, and the margin improved to 9% from 8.3%. The improvement was broad-based, driven by premium growth of 7%, continued favorability in both life and disability experience, and meaningful growth in our supplemental health business. As we look to 2026, we expect to sustain the momentum we have built. Two years ago, we outlined an objective of achieving an 8% margin by the end of 2026. We have now achieved that target in each of the last two years, and our goal remains to continue operating at 8% or above. External factors may create some variability from quarter to quarter, but the fundamentals of this business are strong. We expect continued earnings growth supported by disciplined execution of our strategy including pricing discipline on new business and renewals and diversification into higher margin market segments and products. Overall, Group's 2025 results continue to reflect the strong progress in our strategy to expand this business into a larger and more profitable part of our enterprise. Now turning to annuities. Annuities delivered operating income of $311 million for the quarter. Normalizing for approximately $8 million of favorable payout annuity mortality experience, underlying earnings were approximately $303 million, broadly in line with the prior year quarter. The result reflects higher spread income and higher average account balances, partially offset by continued traditional variable annuity outflows and higher expenses associated with retaining 100% of our fixed annuity flows following the exiting of our external flow reinsurance agreement in September. The sequential expense impact of full retention was roughly $5 million in the quarter. Ending account balances net of reinsurance reached a record $175 billion, up 7% from the prior year quarter with growth across all products. Turning to spreads, spread income continued to grow, spread-based products now representing 30% of total annuity account balances net of reinsurance, up from 27% a year ago. RILA account balances increased 15% over the prior year quarter, representing 22% of total account balances net of reinsurance. Fixed annuity account balances increased 20% year over year, reflecting the first full quarter of retaining 100% of our fixed annuity sales. From a net flows perspective, net outflows improved year over year as net flows into spread-based products exceeded $1 billion for the quarter. Variable annuity net outflows continued at a pace consistent with recent quarters, with higher equity markets contributing to higher account balances available for withdrawal. On a full year basis, annuities delivered operating earnings of approximately $1.2 billion, modestly higher than the prior year, driven primarily by higher average account balances. This result came despite the ongoing shift in business mix towards spread-based products, which carry a lower ROA but more stable earnings over time than traditional variable annuities. Continued shift towards spread-based products, combined with the full retention of our fixed annuity economics builds the in-force base that will support durable earnings and free cash flow generation over time. As we look to 2026, in the first quarter, we expect sequential pressure on earnings due to two fewer fee days and the resetting of favorable mortality experience from this quarter. Additionally, as part of our annual review of allocations, beginning in 2026, we will reallocate net interest income earned on collateral posted in connection with our index credit hedging strategies from annuities operating income to non-operating income. As our RILA business has grown, so have the associated collateral balances, making the related net interest income more meaningful. Moving this income to non-operating income provides a cleaner view of underlying annuities operating performance. While this item can be variable over time given the nature of the underlying collateral balances, as a frame of reference, had this reallocation been in place during 2025, it would have shifted $50 million of annuities operating income to non-operating income on an annual basis. Importantly, this is an allocation refinement. There is no change to underlying economics or free cash flow. Overall, the underlying trajectory of the business remains sound, and we remain confident in our ability to deliver stable, attractive returns over the long term. Retirement Plan Services reported operating income of $46 million for the quarter, up from $43 million in the prior year quarter. The improvement was driven by favorable equity markets and spread expansion, partially offset by pressure from outflows over the past twelve months and higher expenses. Account balances benefited from equity market performance, with average balances increasing nearly 9% year over year to $124 billion. Base spreads were 110 basis points, up from 101 basis points in the prior year quarter. The expansion reflects the benefit of deploying new money at rates above the existing portfolio yield. Net outflows totaled approximately $1 billion for the quarter, primarily driven by participant withdrawals and pressured by known planned terminations, the majority of which were not meeting our profitability targets. We remain focused on retaining profitable business and maintaining pricing discipline on both new and recurring business. Turning to full year results. Retirement Plan Services delivered operating earnings of $163 million, flat compared to the prior year. While outflows earlier in the year created headwinds, these were largely offset by favorable equity markets and spread expansion. As we look to 2026, we expect net flows to remain negative as we continue to prioritize profitability over retention of business that does not meet our return targets. We see opportunity to improve returns through targeted expense efficiency actions and investment portfolio optimization. We remain confident in our ability to deliver sustainable earnings growth in this business over time. Lastly, turning to Life Insurance. Life delivered operating earnings of $77 million for the quarter, a meaningful improvement compared to an operating loss of $15 million in the prior year quarter. The improvement was broad-based, driven by improved mortality, higher alternative investment returns, and the execution of our captive consolidation. Mortality results for the quarter were in line with our expectations. You may recall that 2024 was pressured by elevated mortality driven by an outsized impact from severity in our universal life block. We saw that dynamic normalize this quarter, which was the primary driver of the year over year improvement. Turning to expenses. Despite stronger sales and higher variable compensation in the quarter, the actions we have taken over the course of the year allowed us to hold expenses flat year over year. Maintaining expense discipline remains critical to supporting earnings improvement in this business. Touching briefly on the full year, excluding the impact of our annual assumption review, Life delivered operating earnings of $146 million compared to an operating loss of $71 million in the prior year, an improvement of over $200 million. The improvement was driven primarily by favorable mortality compared to unfavorable mortality in 2024, higher alternative investment returns, and the expense discipline we have maintained throughout the year. These results reflect the ongoing progress we have made in stabilizing and improving the trajectory of this business. As we look to 2026, we expect continued progress. As a reminder, the first quarter is typically our lowest earnings quarter for Life, reflecting unfavorable mortality seasonality and a step down from the higher fee income we earned in the fourth quarter. You will see these seasonal patterns outlined in our earnings supplement. Beyond those near-term dynamics, we are focused on rebuilding sales momentum with an emphasis on products that generate more stable cash flows and attractive risk-adjusted returns. And we will continue to optimize the free cash flow profile of this business by remaining disciplined on expenses, optimizing the investment portfolio, and the potential for external risk transfer. We are confident in the trajectory of this business, as we continue working towards positive underlying free cash flow. Turning now to expenses. As we signaled last quarter, fourth quarter G&A expenses increased both sequentially and year over year. The sequential increase was primarily driven by higher variable compensation reflecting the strong sales volumes we achieved during the quarter. On a year over year basis, the increase also reflects continued investments in our businesses, including in annuities where we are now fully retaining our fixed annuity flows, and in Group Protection, where we continue to execute on our technology roadmap including modernizing our claims platform. Looking ahead, expense discipline remains a strategic priority across the organization. We have made meaningful progress over the past two years, and we see continued opportunity to drive efficiencies as we advance our transformation. This includes ongoing focus on organizational simplification, leveraging technology to improve productivity, and ensuring our expense base is appropriately sized to support our strategic objectives. We are committed to maintaining a disciplined approach to expenses, balancing the investments needed to drive growth with a relentless focus on operational efficiency. This will remain a critical area of focus in 2026 and beyond. Turning to investments, our investment portfolio delivered solid results in the fourth quarter reflecting disciplined management and continued execution of our strategic asset allocation initiatives. Portfolio credit quality remains strong with 97% of investments rated investment grade and below investment grade exposure near historic lows. Overall credit performance for the full year was solid. New money was invested at a yield of 5.3% for the quarter, approximately 65 basis points above the portfolio yield. For the full year, new money yields averaged 5.7%, approximately 110 basis points above the portfolio yield. Alternative investments generated a return of 3% for the quarter, or 12% annualized, above our target of 10%. For the full year, alternative returns of approximately 10% were in line with our annual return target. We continue to make progress on our general account optimization efforts, executing on new money strategies across a variety of asset classes to support our spread-based growth initiatives. These efforts remain an important component of our broader strategy to enhance investment returns and support product competitiveness. Before turning to the outlook, I wanted to highlight three capital actions that occurred in the fourth quarter. First, we completed the consolidation of several life insurance captive entities. This simplifies our legal entity structure, reduces reserve financing costs, and supports improved free cash flow within the Life business. Second, we received a $75 million dividend from Alpine, our Bermuda-based affiliated reinsurance entity, demonstrating its strong capitalization and profitability. We expect Alpine's contribution to grow as we expand its role across additional products. Third, holding company liquidity ended the year at approximately $1.1 billion, which includes $400 million of prefunding for our senior notes maturing in December 2026. Net of prefunding, holding company liquidity is approximately $655 million, above our historical $400 to $500 million operating range. With the debt maturity later this year, the preferred securities becoming redeemable in 2027, and as we move closer to increasing capital return to shareholders, this increased liquidity provides the financial flexibility to act on multiple fronts over the next few years, reflecting the progress we have made in strengthening cash flow to the holding company and positioning us well to execute on the capital priorities ahead. Lastly, I would like to provide an update on our financial outlook. We began this journey in 2023 with a focus on fortifying the balance sheet, transforming the company to one with a more balanced mix of earnings, and profitably growing. Over the past few years, we have made considerable progress on these efforts, building momentum that positions us well against the goals we set out at the end of 2023. We have provided a number of updates in the outlook section of the investor supplement released this morning that helped to frame the progress we have made as well as some goals over the medium term, which we defined in the supplement as potential ranges over the next two years. Stepping back, what is clear is that our business mix is evolving, with Group Protection now approximately 25% of business unit earnings, up from 18% in 2023. Spread-based annuity account balances net of reinsurance are now 30%, up from 25% in 2023. And our Life business is showing considerable momentum in pivoting their franchise to a product set with more stable cash flows and increased risk sharing. Additionally, as you can see on slide 14, we are ahead of schedule on delivering on our financial commitments. From a balance sheet perspective, we restored capital to levels above our 400% target, built a 20% risk buffer on top of that target, and ended last year well in excess of that buffer. With that growth in capital, our leverage ratio has declined 500 basis points since 2023 and is now back at our long-term target, providing greater financial flexibility and capital support for the future. At the same time that we have been pivoting our mix and strengthening our balance sheet, we have been growing both our earnings base as well as our ability to convert those earnings into free cash flow. In 2023, our adjusted operating income was $908 million, and we converted 35% of those earnings into free cash flow. Last year, our adjusted operating income grew to over $1.5 billion, or 69% higher than in 2023. Importantly, at the same time as our earnings base was growing, so was our ability to convert those earnings into free cash flow, with a 2025 conversion ratio of 45%, 10 points higher than 2023. So over the last few years, we have made progress on shifting our mix to more capital efficient and less volatile businesses. We have rebuilt our capital to levels well in excess of our targets, and we have grown both our earnings base and, importantly, our ability to convert those earnings into free cash flow. As we think about the next few years, we would expect the momentum to continue. As we leverage our foundation to profitably grow our franchise, maximize value, and increase free cash flow. We have a number of levers available to support us on this journey, as shown on slide 15. For example, we will continue to focus on our operating model, with targeted actions on expense efficiency, and continued optimization of our investment strategies. We will also continue to evaluate potential for external and affiliate reinsurance transactions with a diligent focus on reducing risk and generating economic value. And lastly, we will continue to strategically grow in products and businesses where we can achieve attractive risk-adjusted returns while shifting our capital allocation should market or competitive dynamics change. When we look out over the next two years, the culmination of these efforts should translate into continued growth in capital generation and free cash flow, which should in turn lead to higher dividends from the operating companies to the holding company as shown on slide 18. As this excess capital builds at the holding company, we would eventually then be in a position to increase capital return to shareholders. We continue to see a clear path of opportunity ahead. With a leverageable foundation in place, an increasingly optimized operating model, and disciplined strategic capital allocation, we are positioning Lincoln National Corporation for durable value creation in the years ahead. We thank everyone for listening. I will now turn it back to the operator.
Operator
Thank you. We will now open for questions. Again, press 1. We do ask that you limit yourself to one question and one follow-up. For any additional questions, please requeue. And your first question comes from the line of Joel Hurwitz with Dowling and Partners. Please go ahead.
Speaker 4
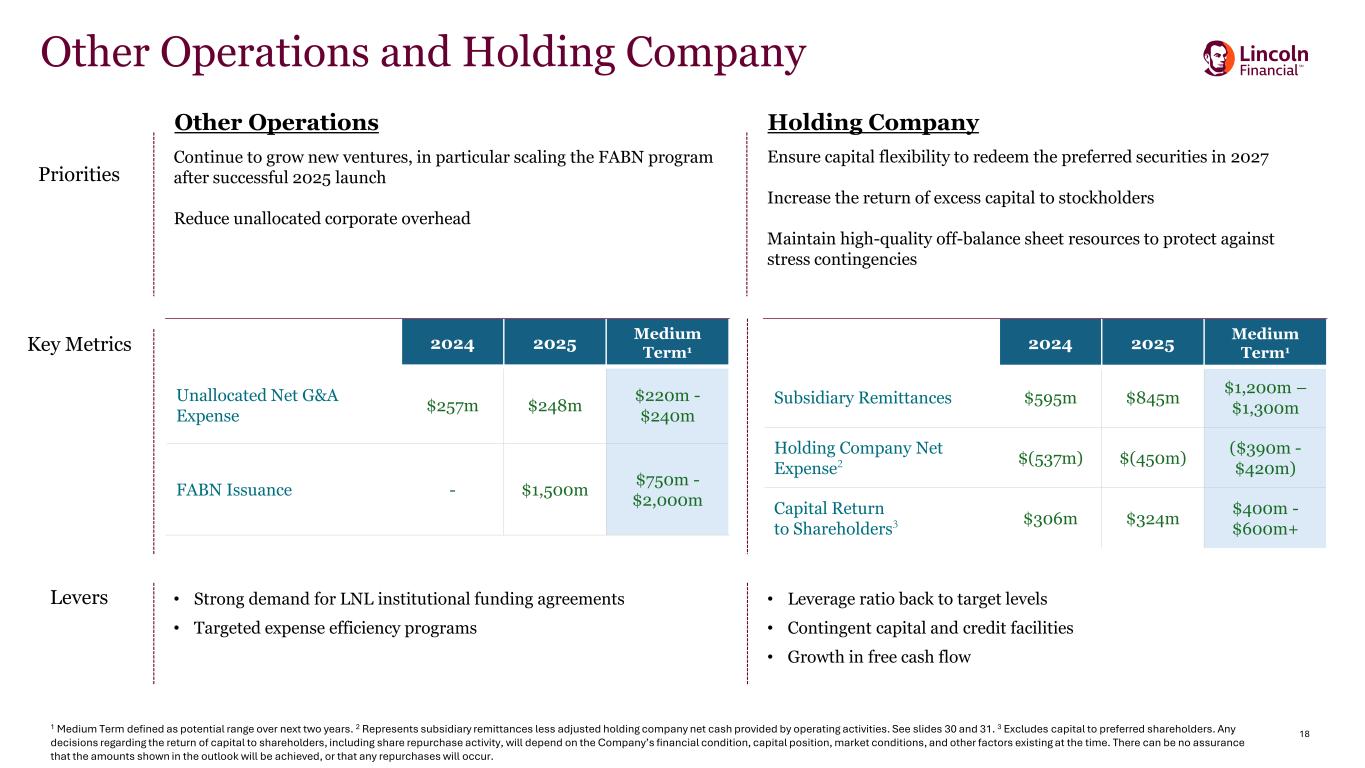
Hey, good morning. So, Chris, first, wanted to touch on capital return. If I look at your medium-term guidance, it is for $400 to $600 million plus of capital return to shareholders. Just given the dividend should be around $350 million this year, is that implying at least $50 million of buybacks in 2026? I want to make sure I am thinking about that correctly.
Speaker 3
Hey. Good morning, Joel. So thanks for the question. What I would say is when you look at the way that we have presented the information in the outlook, we are really talking about a potential range over the next two years. And so, if you think about our capital deployment priorities, the first priority has not changed. And, frankly, we are going to continue to hold buffer capital in our operating entities, and we will continue to invest incremental free cash flow that we generate where we see opportunities. That said, our free cash flow continues to improve. You can see that we have moved more of the free cash flow that we generated this year to the holding company. That is a good sign. It is something you would expect. But the point is the first priority will continue to be to maintain an excess within our operating companies and invest where we see attractive returns. The second priority continues also to be the same, which is we are preparing for the optimal way to deal with the preferred when it is redeemable next year. As you move more capital to the holding company, that gives you more optionality. At the same time with our leverage ratio back to where it is, we have got some more flexibility in how we think about it. So we are still working through what the optimal way to handle the preferred will be. I would imagine we would continue to study that over the course of this year. And then when you think about the fact that even on top of that, you have built the excess capital and the buffer in LNL and Alpine and so forth. We are moving more capital to the holding company as we deal with the preferred, we will still be in a position where we are generating significant free cash flow and excess capital. And our priority would then be to increase the capital return to shareholders. So we are not going to give you a 2026 versus 2027, but the good news is all of the signs that would support increasing capital return to shareholders continue to move in the right direction.
Speaker 4
Got it. That is helpful. I guess just sticking on capital, if I take the remittances in that medium-term outlook less the holding company expenses, that implies like $800 to $900 million of excess cash. If I just take that versus the capital return, is it sort of largely for the to manage the preferreds and the calls next year? Is there any other potential uses of that capital at the holding company?
Speaker 3
No. I think that is right. If you are, at its simplest form, assuming that you are moving all of the excess capital that you are generating in the year up to the holding company, that would be the difference between those two items, your remittances and your expenses at the HoldCo, which you could think about as your debt interest, your preferred coupon plus or minus any NII you might earn. But the sum of those two, you should think about under those constraints as being your free cash flow. And then as we build cash and think about deploying it for the preferred in 2027, the other usage of it would be increasing capital return to shareholders.
Speaker 5
Good morning. Yes, appreciate slide 18. I think that clarifies a lot in terms of where the cash flow is going in terms of the components. So, Chris, is the best way to think about this, I heard what you are saying about the prefs, and that makes a lot of sense over the next few years. But if the $1.2 billion of sub remittances is a number that is probably going to grow somewhat, and then assuming you either refinance or pay down the prefs, then we would be looking at a lower HoldCo interest expense bogey heading into, call it, 2028–2029. So we are looking at, when I think about where this is going, and I am not asking for specific numbers, I want to make sure I am understanding conceptually where this is going. You probably have something better than $1.25 billion coming in for remittances, and you will have a lower HoldCo bogey, assuming your interest expenses go down. And then we could be talking about something north of a billion dollars of the amount that is available annually for shareholders unless there is some other component to it that I am missing.
Speaker 3
Tom, if you are looking for 2028 and 2029 guidance, I will have to get back to you. But that being said, yes, I mean, if you think about the fact that you redeem, and whether you redeem with all capital or you refinance a piece of it, etcetera, etcetera, that will be a 2027 event, which exactly to your point, there is a $90 million coupon associated with that. So then starting in 2028, your holding company net expense would come down. I would expect over time, as we continue to execute on all the things we have been talking about, really thinking about the longer term, after the two-year sort of range that we give here, you would expect remittances to grow. But we are focused right now on 2026 and 2027, but I think the way conceptually you are thinking about over the long term are the right drivers.
Speaker 5
Okay. Thanks for that. And then my follow-up, I guess just a question on this redefinition of NII. I heard what you said about the hedging. What kind of prompted that change? Is it just that RILA is becoming larger and it is like a materiality issue and you looked at the way peers are treating this? And I presume also, since you are redefining earnings a bit lower, on an apples-to-apples basis, that would, at the margin, make your cash flow conversion better, all things equal.
Speaker 3
So on that last point, yes, but I think that is just definitional. Right? I mean, we are focused on the absolute dollars of free cash flow. When you are comparing it to the GAAP number, yes, that would have a slight positive to it, but that is just, call it, optics. I think at the end of the day, every year we look at allocations. There is another component which we show in the back where you look at your operating expenses and depending on how some of the drivers move, there is corporate overhead allocations and things like that where the allocated expenses to the businesses might move around. But that will net to zero from an operating income perspective. On this specific issue, yes, that is exactly right. As RILA has grown over time, there is a component. The majority of the investment income and or expense related to the collateral is in non-operating, and there was a piece of it that we had looked at that was more specific when we went through how to think about 2026. And as we have committed to, we are trying to be transparent and give all of the clarity as it relates to how we think about the operating income. And this was just a natural part of that. But you do this every year, you look at the different pieces. What I would tell you is it was not a big driver year over year as it relates to growth for 2025. So I think the annuities growth number was not significantly impacted. But as you look out over the longer term and you think about some of the things that we have talked about wanting to do around giving more explicit spread margin information for annuities, we want to be able to provide the cleanest view possible as it relates to NII and interest credit and so forth.
Speaker 6
Good morning. My first question was on the Life Insurance business. Chris, I think you mentioned some captive consolidation and reducing reserve financing costs. Just wondering if you could talk a little bit more about those actions you have taken, if there is more to do there and the impact on earnings and free cash flow.
Speaker 3
Sure. Good morning, Wes. So we alluded to this last year. But if you step back, the bigger picture comment here is we have been doing a lot over the past couple of years to improve free cash flow profile of the legacy Life block. And so we have taken out, we did the Fortitude transaction, and we have alluded to a number of other projects that we are looking at with the idea of being, on an internal perspective on an organic basis, we do think that there is a lot we can do to improve the profile there. The captive consolidation was one of those projects. We completed it in the fourth quarter of this year. And essentially what it is is historically you have a number of legacy life captives and they can be product specific, you might have some term captives, you might have some GUL captives and so forth. And so we have seen this across the industry, but as you think about consolidating those captives, there is a financial benefit given the high financing fees relative to the years-ago contracts that were signed. So by consolidating and restructuring the way those captives work, you are able to save on the finance piece of it. As specifically for GAAP in fourth quarter, it was about a $10 million benefit to Life. So if you think about 2026, you should get, call it, another $25 to $30 million in improvement to the Life GAAP earnings. And then I would tell you that on a free cash flow perspective, it will be an incremental benefit on top of that $40 million, call it, GAAP run rate, given the fact that you do have some capital optimization when you combine some of those blocks. So I hope that helps. It is in line with the sort of bigger picture projects we have talked about. And as it relates to going forward, we think that there is more that we can do.
Speaker 2
And, Wes, just to add, in addition to all of the in-force actions that Chris just mentioned, I also want to reiterate some of the comments that we made earlier around all that we have done to completely revamp the new business franchise so that as we think about the ongoing trajectory of the Life business over time, we also firmly believe that we will continue to see profitable growth there. So just as a reminder, across the products, we have significantly revamped as we have shifted into, for example, accumulation and more limited guarantee products. And you really start to see that coming through if you look year over year, for example, at our IUL and also at our accumulation VUL from a sales perspective. We have talked quite a bit about executive benefits. That is another example. And part of that success is also really leveraging our distribution. So we have talked about getting closer to the point of sale. We are targeting new channels there such as the producer group and the agency channel. And then additionally, as we think about this business going forward, we have also done a lot as it relates to technology, automation, supporting our producers around e-delivery, pre and post sales, etcetera. So we are excited about what we see. We have made significant improvements to the in-force, and we also see some bright spots over time as it relates to Life new business going forward.
Speaker 6
Thank you. That is all very helpful. My second question, I guess, was just about dynamics in the annuities market. It sounded like, Ellen, from your comments that RILA maybe is becoming more competitive and maybe pushing you towards fixed and indexed annuities a bit more. So just curious what you are seeing there and maybe the outlook for 2026.
Speaker 2
Absolutely. So I am going to step back for a moment, and I will talk about all three segments. So first of all, as you know, we are a leader in the annuity market. We have got a broad product portfolio. We are across all the major segments. And we very much leverage the overall product portfolio and our distribution. So some of what we have been talking about, it is a couple of things. Number one is that we have been focused on lowering our market sensitivity over time. And I will get to the VA point in a moment. And at the same time, we are focused on balancing profitability, capital, and capital efficiency, and really growth as well and really thinking about those three components. So what we have seen, and you see this coming through in our sales, and I have to say that our sales in 2025 were strong. We were very happy with the overall volumes. We were very happy with the returns across each of the product segments, and we also are continuing to just evaluate market dynamics as we go forward as well. So specifically in RILA, as you know, we were one of the earlier entrants into the RILA product. We have now significant experience overall in RILA. About eighteen months ago, we revamped and refreshed our product. It was very much needed. And you have seen increasing sales there over time. The addressable market has grown, but the competitive landscape has also grown, and we see that increasingly growing as it relates to its competitive nature. For us, given our strong overall annuity platform, part of what we are focused on there, and we talked about the fact that we can expect in 2026 to see sales growth that would be in line with what we have seen over the last, call it, two to three years. What we are doing is we are really leaning into places where we have differentiated product, whether it is features, whether it is unique crediting features as well. And then additionally, along our distribution platform, which is so broad, we also have some places where we have select channels where VA is a good fit. For a moment, on some of the comments that we made around VA. So our product in particular is differentiated there. And so these are ways that we are competing beyond price, really focused again on this idea of balancing profitability, growth, and overall capital efficiency. And I will just make a mention on mix shift, and part of that is that we have continued to experience strong outflows so that the higher sales that we saw this year did not deviate from our goal of diversifying the mix. But in addition, some of the new product features that we launched about a year ago really supported some of the sales momentum that we saw in 2025. And then, of course, we saw this higher demand. So as we look to 2026, we are going to expect to see that growth moderate, as I mentioned, so that our sales will look more similar to pre-2025 levels. And then the last point that I will make is as it relates to fixed annuity. Fixed annuity is the one place where we really believe that we have runway to continue to grow. Leverage everything that we have talked about: Bermuda, investment strategy, expanding our overall opportunity there as we continue to have unique sourcing, and also expanding both our product capabilities and also distribution as well.
Operator
Your next question comes from the line of Suneet Kamath with Jefferies. Please go ahead.
Speaker 7
Great. Thanks. I wanted to go back to slide 18. If I look at the medium-term subsidiary remittances, if I take the midpoint, it is a pretty big jump from the $845 million you did in 2025. And I know that the range is over a two-year period, but can you unpack what would lead to close to a 50% jump, if I am thinking about it right?
Speaker 3
Yeah. I think the central premise there, and by the way, good morning, Suneet. I think the central premise there is for the past, call it, three years, as we have grown our free cash flow, we have maintained the vast majority of it in the operating entities. Right? And so for all the reasons we have talked about, but going forward the expectation is, A, that the underlying free cash flow is growing, we have shown the ability to do that. We have talked about the levers that will continue to drive that. But also, with where we are from a capitalization perspective, LNL and Alpine and so forth, we would expect us to move that to the holding company. So I think that it is somewhat of a, we have done what we said we were going to do in terms of building back capital at the opcos, we are maintaining a buffer. You can see from the RBC slide upfront that we ended the year at 439%, and by the way, that excludes the remaining Bain proceeds that are earmarked for deployment next year. So you could just think about the fact that as we have been generating incremental free cash flow, you are seeing it come through from an RBC perspective and there is a similar dynamic in Alpine. So going forward, as the free cash flow continues to be robust, you would expect us to move that to the holding company.
Speaker 7
Okay. That makes sense. And I guess, I do not want you to get too specific on it. But as we think about this $1.2 to $1.3 billion, does that have any of the levers in it that you guys have talked about in terms of reinsurance or anything like that? Or is it more sort of normal course and should we expect there to be a big difference between 2027 and 2026?
Speaker 3
So I think on the first question, what I would say is all the things that we have been doing over the past couple of years to increase free cash flow, and we have talked about the big buckets there, dealing with the legacy Life block, optimizing the operating model, being more thoughtful around capital allocation, they have been big drivers and the vast majority of them should continue to be drivers to the growth in free cash flow over the medium term. We will continue to look at our operating model and optimize the strategic asset allocation. We will continue to look at expenses. We think there is more we can do with Bermuda. From a capital allocation perspective, as we talked about, that is both at a business unit level. If you think about how much Group has grown, as well as inside the business unit. So think about the repositioning in Life. So those dynamics should continue to be tailwinds to free cash flow. What we are not including, Suneet, to your specific question, are any other sort of big external things that we have done in the past. And so, to the degree that we, for example, look at another external risk transfer deal, that would not be what is implied in the remittances. So it is the natural evolution of the things that we have talked about. We continue to see runway to obviously both grow earnings, but then more importantly, the ability to convert those earnings into free cash flow. And then if we were to do something else, that would be sort of incremental to these numbers.
Operator
And that concludes our question and answer session. I will now turn it back over to John Mutheng for closing comments.
Speaker 1
Thank you for joining us this morning. We are happy to discuss any follow-up questions you have. Please email us at [email protected].
Operator
Ladies and gentlemen, this does conclude today's call. Thank you for joining and you may now disconnect.