Operator
Good day, and welcome to the Northern Trust Corporation First Quarter 2026 Earnings Conference Call. Today's conference is being recorded. At this time, I would like to turn the call over to Jennifer Child, Director of Investor Relations. Please go ahead.
Thank you, Operator, and good morning, everyone. Welcome to Northern Trust Corporation's First Quarter 2026 Earnings Conference Call. Joining me on our call this morning is Michael Grady, our chairman and CEO, Dave Fox, our chief financial officer, John Landers, our controller, and Steve Carroll and Trey Stegman from our investor relations team. Our first quarter earnings press release and financial trends report are both available on our website at northerntrust.com. Also on our website, you will find our quarterly earnings review presentation, which we will use to guide today's conference call. This April 21st call is being webcast live on northerntrust.com. The only authorized rebroadcast of this call is the replay that will be made available on our website through May 21st. Northern Trust disclaims any continuing accuracy of the information provided in this call after today. Please refer to our Safe Harbor Statement regarding forward-looking statements in the back of the accompanying presentation, which will apply to our commentary on this call. During today's question and answer session, please limit your initial query to one question and one related follow-up. This will allow us to move through the queue and enable as many people as possible the opportunity to ask questions as time permits. Thank you again for joining us today. Let me turn the call over to Mike O'Grady.
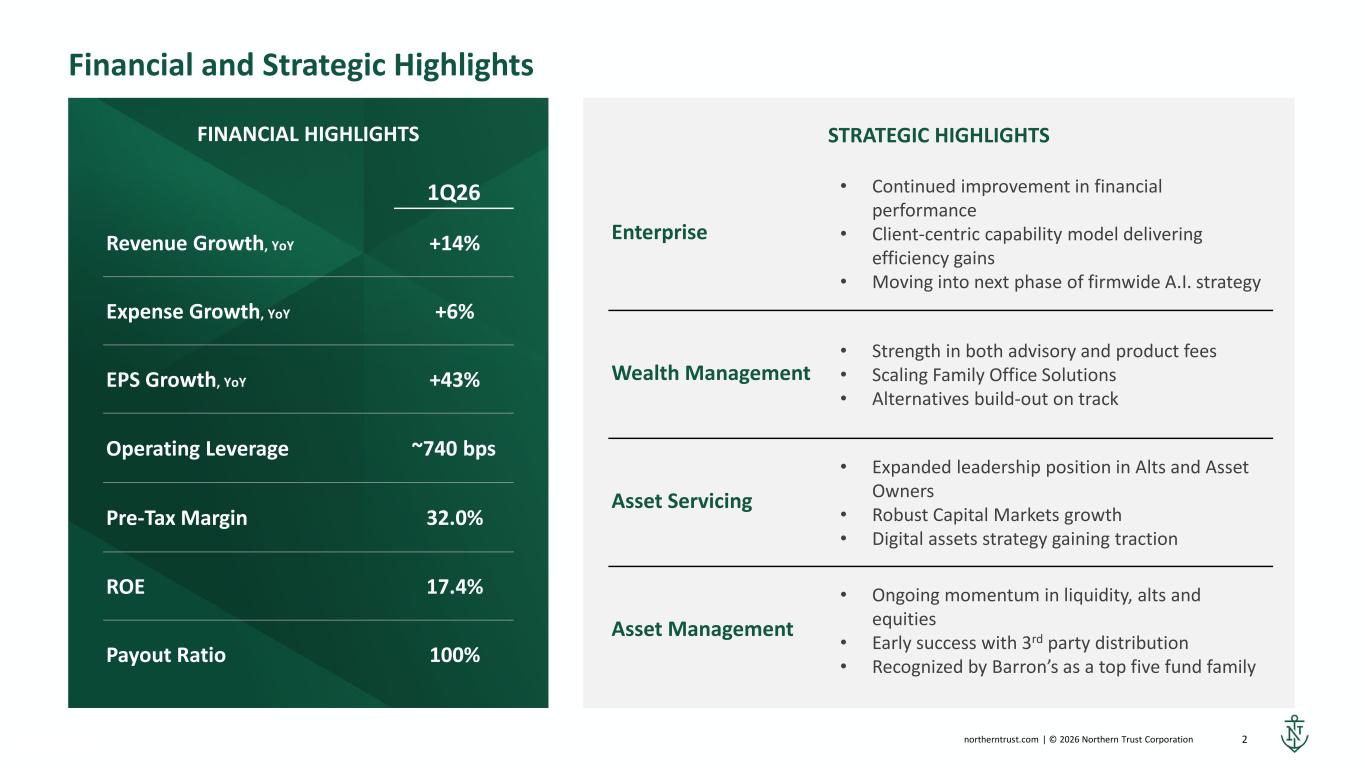
Thank you, Jennifer. Let me join in welcoming you to our first quarter 2026 earnings call. We're off to a strong start in 2026, reflecting our ability to capitalize on a constructive market and rate environment while continuing to advance our One Northern Trust strategic priorities. Against this backdrop, first quarter trust fees increased 11%, net interest income grew 15%, and total revenue rose 14%, all on a year-over-year basis. While continuing to invest in key growth initiatives, we generated more than 700 basis points of positive operating leverage, driving our pre-tax margin up nearly 500 basis points to 32% and fueling EPS growth of 43%. Return on average common equity reached 17.4%, which is at the higher end of our new medium-term target range, and we returned $510 million to shareholders, representing a total payout ratio of 100%. This included $359 million in share repurchases in the first quarter, contributing to a 5% reduction in share count as compared to the previous year. These results confirm that our One Northern Trust strategy is driving steady improvement in organic growth, consistent efficiency gains, and resiliency in a volatile environment. AI is increasingly embedded in how we operate, enabling our teams to deliver more value with greater consistency and speed. Moving forward, we are accelerating its deployment in ways that will further advance our strategy and financial objectives. We're applying AI not only to drive incremental efficiency, but also to scale knowledge and expertise, while maintaining the resilience, governance, and client confidence that define our franchise. Our AI strategy is anchored in three outcomes, hyper-personalization, AI-generated alpha, and infinite scalability. Together, these outcomes focus investment where it matters the most, enhancing the client experience, improving decision quality, and increasing operating leverage. Hyper-personalization allows us to move toward highly contextual, tailored engagement. A tangible example is our One Wealth Assistant, which integrates the Northern Trust Institute insights directly into workflows. With future enhancements, this will equip our wealth management advisors with real-time, client-specific context, connecting market insights, portfolio considerations, and client objectives to support more informed, high-touch conversations with speed at scale. AI-generated alpha focuses on strengthening investment outcomes through faster synthesis of information and generating deeper insight. Within asset management, AI-assisted research and product construction tools are enabling teams to process significantly larger structured and unstructured data sets, identify patterns more quickly, and test scenarios more efficiently. This enhances both investment decision-making and operational execution, supporting stronger client outcomes without adding complexity. Infinite scalability is a key driver of operating leverage. By digitizing work through agents, we further disconnect the relationship between growth and staffing, allowing for consistent execution across value chains and supporting stronger controls, all of which enable us to scale while maintaining rigorous risk management. With that backdrop, let me now turn to business performance for the quarter, beginning with wealth management. Momentum from last year carried into the first quarter, as improved organic growth, underpinned by both strong advisory and product fees, drove low double-digit trust fee growth. The regions delivered another quarter of solid results, with trust fee growth accelerating to 11%, supported by especially robust performance in the central region. We made good progress implementing various client acquisition initiatives across talent, centers of influence, and digital channels. Talent is our most important growth driver. We're advancing plans to increase revenue-generating roles by high single-digit percentages by year-end. This includes significant increases in critical producer roles. Centers of influence, which include attorneys, accountants, and other professionals, are a vital referral source, driving nearly 25% of our new business activity. In the first quarter, we introduced a more robust and structured outreach framework to engage key centers of influence, including hiring a senior leader to accelerate this initiative, targeting a 10% increase in opportunities in 2026. Digital channels also continue to be an increasingly important source of new business. To boost the transition from interest to conversion, we're enhancing data integration, lead qualification, and personalization at scale. Notably, the opportunities originating from digital channels in the first quarter grew by nearly 50% year-over-year. Within our global family office business, strength in international markets and investment management fees drove healthy performance. We also continued to scale family office solutions with early traction and client wins across several new markets. Expanding our investment offerings, particularly within alternatives, remains an important focus area. We had seven funds in the market during the first quarter, up from five in the previous quarter. Looking ahead, we will continue to build out our alternatives platform with a number of new alternative investment funds and strategies planned for launch later this year, with the goal of increasing ALT's fundraising by 25%. These offerings, spanning areas such as venture capital, co-investments, and secondary funds, will broaden access and flexibility for clients seeking diversified sources of return, while maintaining our disciplined approach to portfolio construction and manager selection. Collectively, these initiatives are strengthening our ability to generate repeatable, scalable growth while enhancing both the client and employee experience. Turning to asset servicing, the business delivered another quarter of solid organic growth and strength and profitability, driven by discipline execution of our strategic priorities. Trust fee growth of 10%, coupled with significant NII and capital markets activity, fueled over 700 basis points of year-over-year pre-tax margin expansion. Our differentiated service model, deep institutional expertise, and strength in supporting complex client needs continues to resonate, particularly with global asset owners. During the quarter, we secured nine new mandates across foundations, endowments, and health care institutions, including four not-for-profit health care systems. As a result, we now serve three-quarters of the top 50 health care systems in the United States. Within alternatives, we remain a market leader, with assets under administration approaching $1 trillion across hedge funds, private capital, and semi-liquid vehicles. Demand for scalable, institutional-grade services remains strong, supported by more than a dozen wins during the quarter. These included IGNIO's planned second quarter launch of a new private equity fund focusing on energy infrastructure in Europe, further expanding our global relationship across Europe, Australia, and the U.S. We also announced an expansion of our CLO middle office services, delivering a unified operational and compliance framework that supports the full lifecycle of CLOs as interest in this offering continues to grow. Strong momentum in capital markets continued in the first quarter, as elevated volatility and heightened client activity drove 34% growth, including another quarter of robust FX and core brokerage fees. We're also seeing continued interest in our digital asset strategy, particularly in custody, reporting, and servicing of tokenized assets as tokenization moves towards scale. During the quarter, we onboarded five new clients, providing custody and other services for tokenized real-world assets, U.S. stablecoins, European money market funds, and carbon credits. Turning to asset management, NTAM made good progress in the first quarter, with strength across liquidity, alternatives, and equities, positioning the business well to meet its 2026 targets. Within liquidity, we extended our streak to 13 consecutive quarters of positive flows with associated AUM increasing to $350 billion. Importantly, we continued to diversify our funding sources across global liquidity vehicles and third-party platforms while gaining overall market share. We also launched a tokenized share class for our NIF Treasury Instruments portfolio during the quarter, marking Northern Trust's entry into the digital asset marketplace. By applying tokenization to institutional-grade liquidity strategies, we're offering clients a modern, digital-first way to access money market investments while maintaining our high standards for risk management and service. Within equities, ETF momentum remains strong, with a fourth consecutive quarter of positive flows. This was supported by the successful launch of the Northern Trust U.S. Equity ETF, our latest active ETF designed to deliver tax-efficient outcomes for investors. We also launched our first Saudi Arabia Equity Index strategy with $1 billion in client capital, reflecting our expanded presence and strategic partnerships in the Middle East. NTAM continued to broaden its alternatives capabilities through active fundraising, which included three new sizable custom solutions and advisory mandates, spanning secondaries, private credit, and private equity. Earlier in the quarter, we announced an important milestone in our third-party distribution strategy. Our institutional quality direct indexing capabilities became available on InvestNet's platform, the largest independent TAMP, which supports approximately one-third of all financial advisors in the U.S. This will enable advisors to access our diverse lineup of equity strategies, empowering them to personalize portfolios at scale while managing tax outcomes. Finally, reflecting the strength of our active investment platform and the expertise of our investment professionals, NTAM was recognized by Barron's as a top fund family in 2025, ranking fourth overall and fifth in general equity out of 46 fund families. To wrap up, as we enter the second quarter, our priorities are clear and we remain focused on disciplined execution. With that, I'll turn it over to Dave to walk through our first quarter financial results.
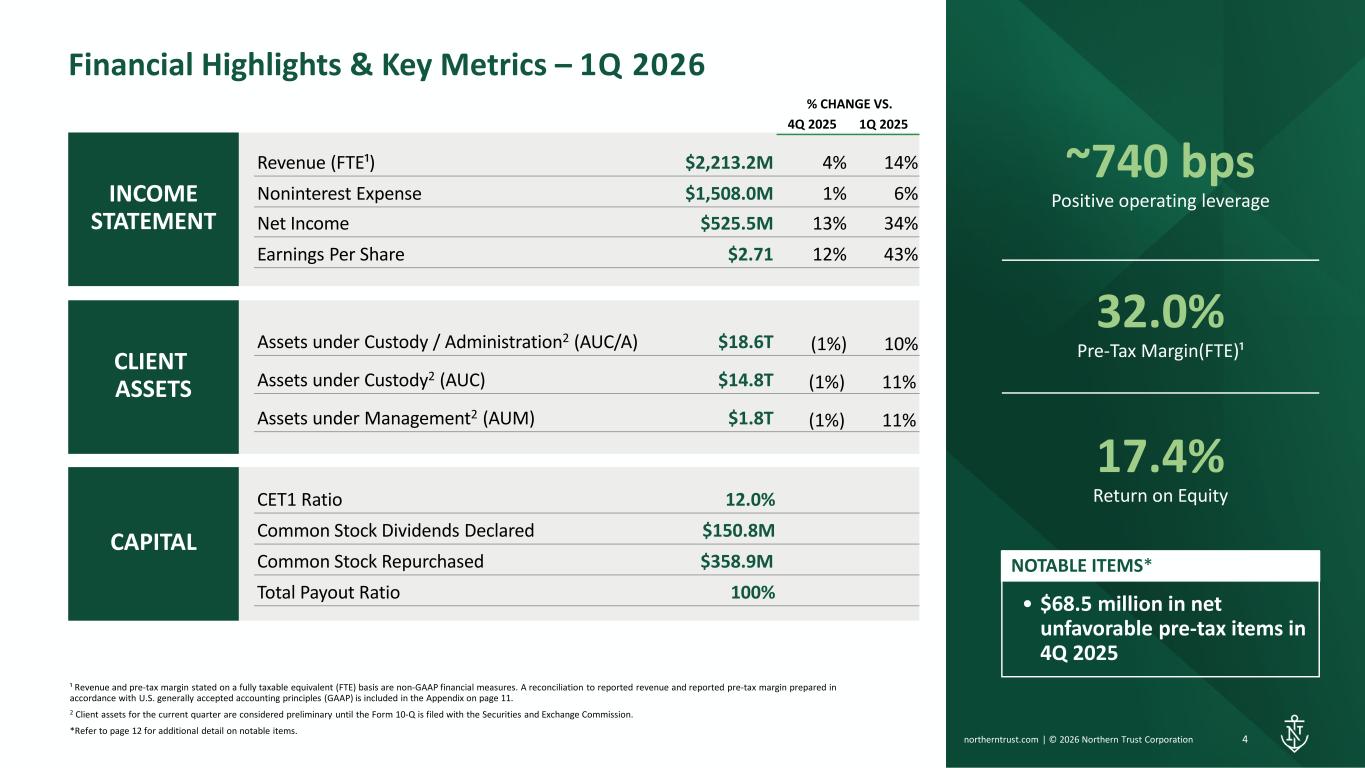
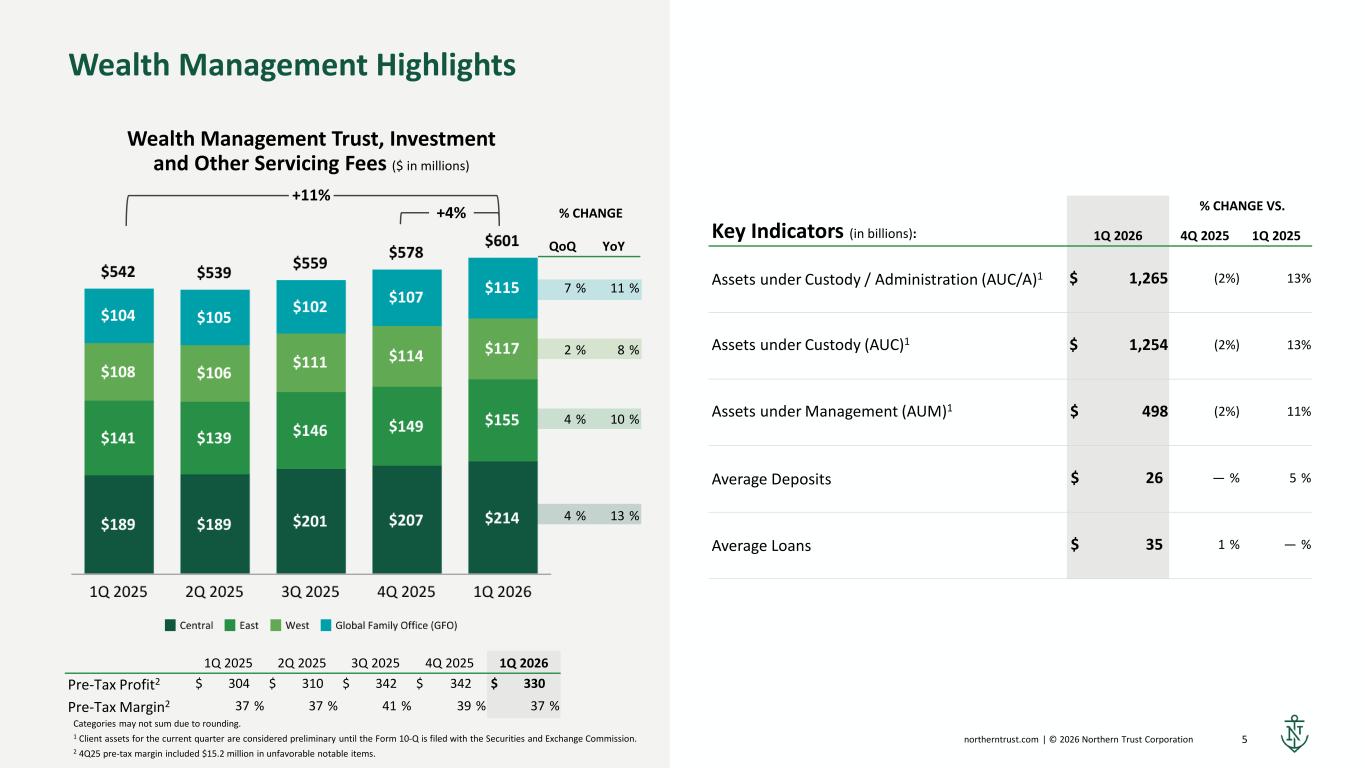
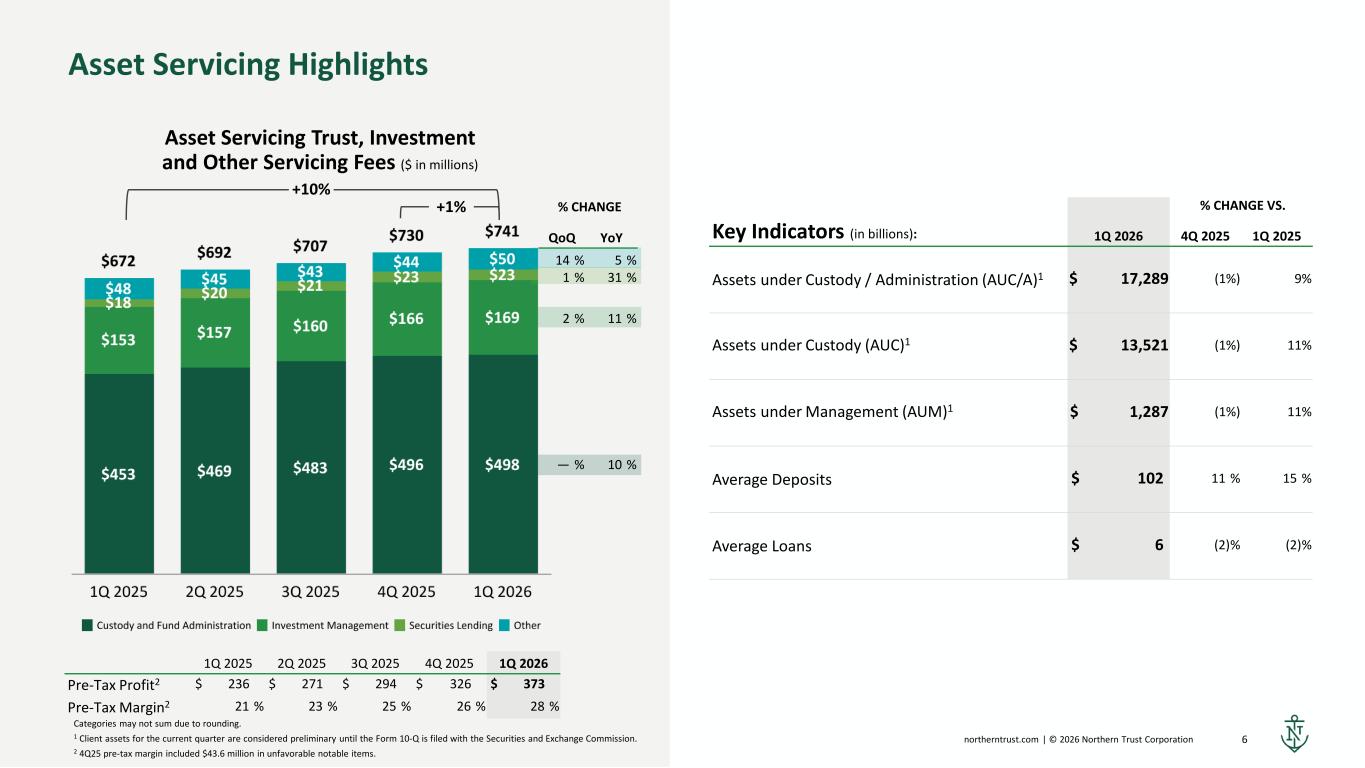
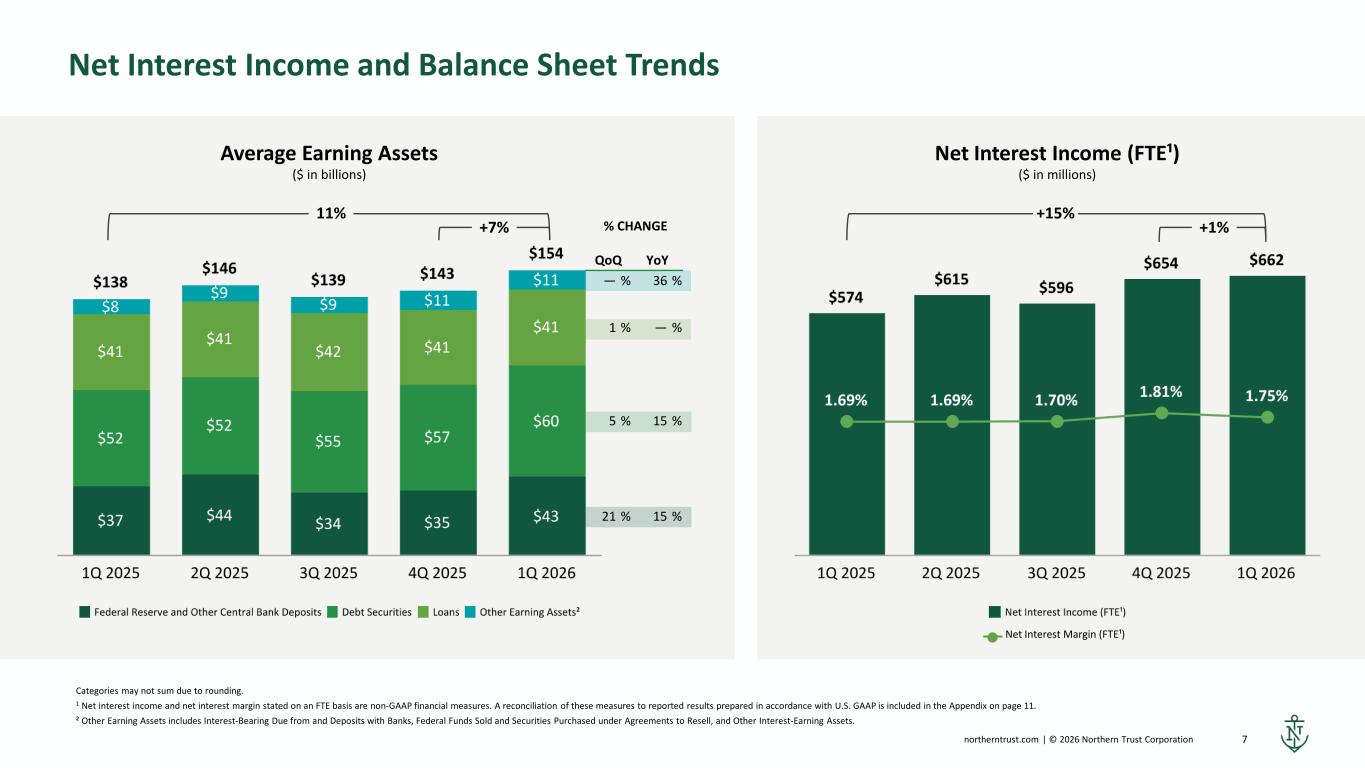
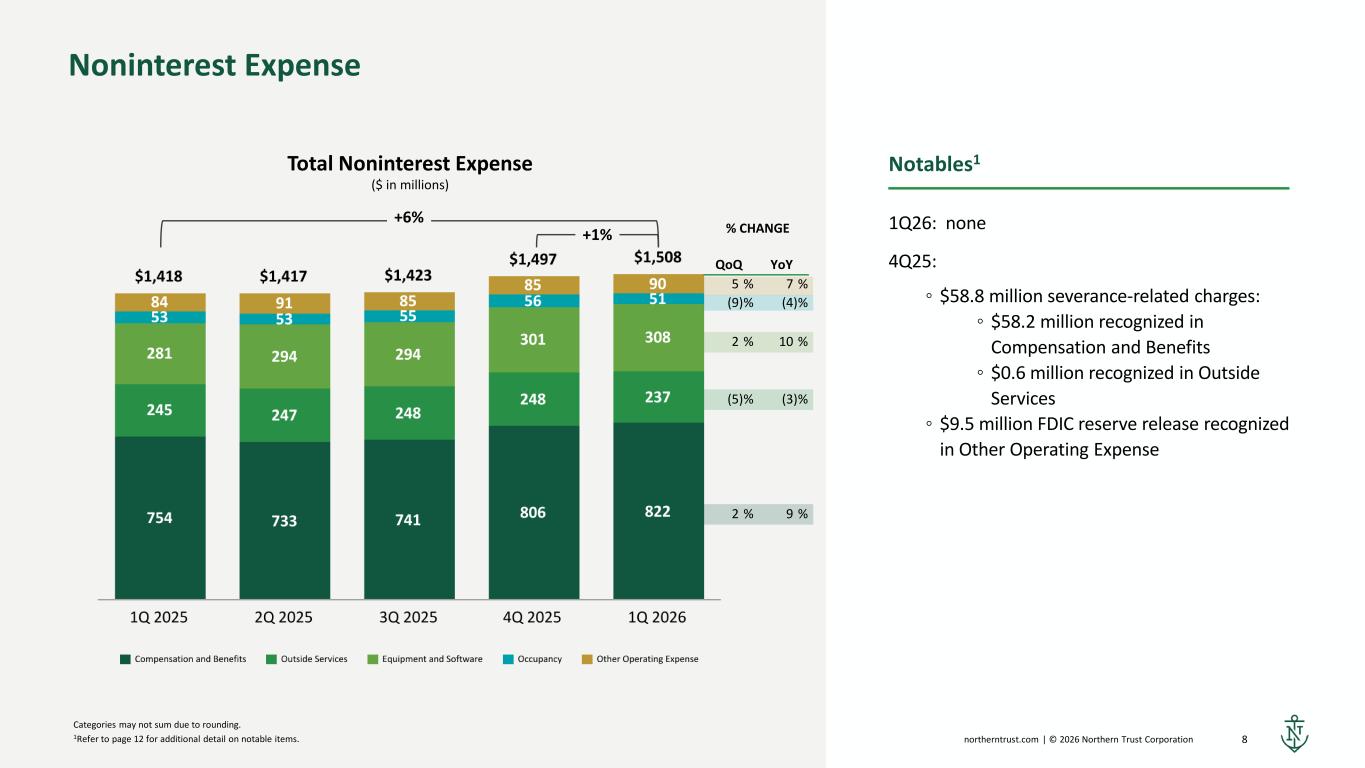
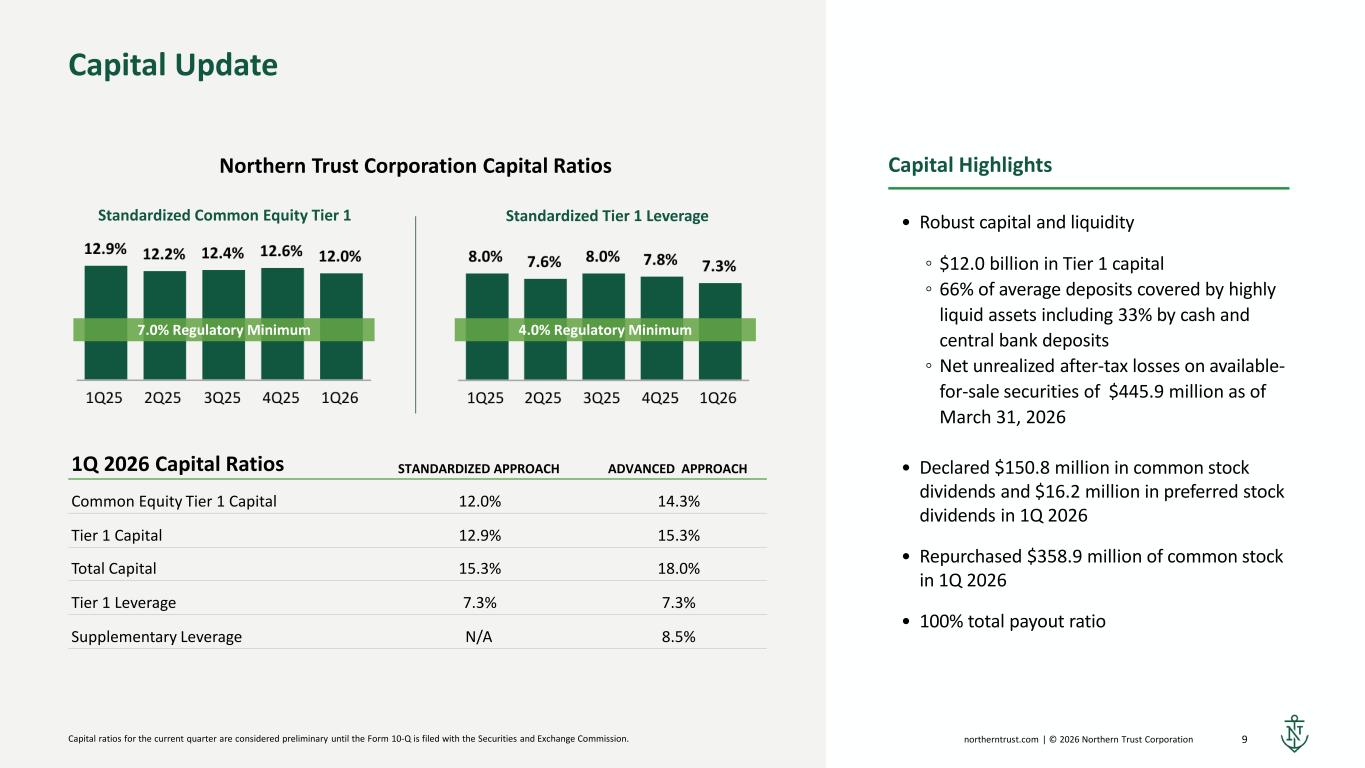
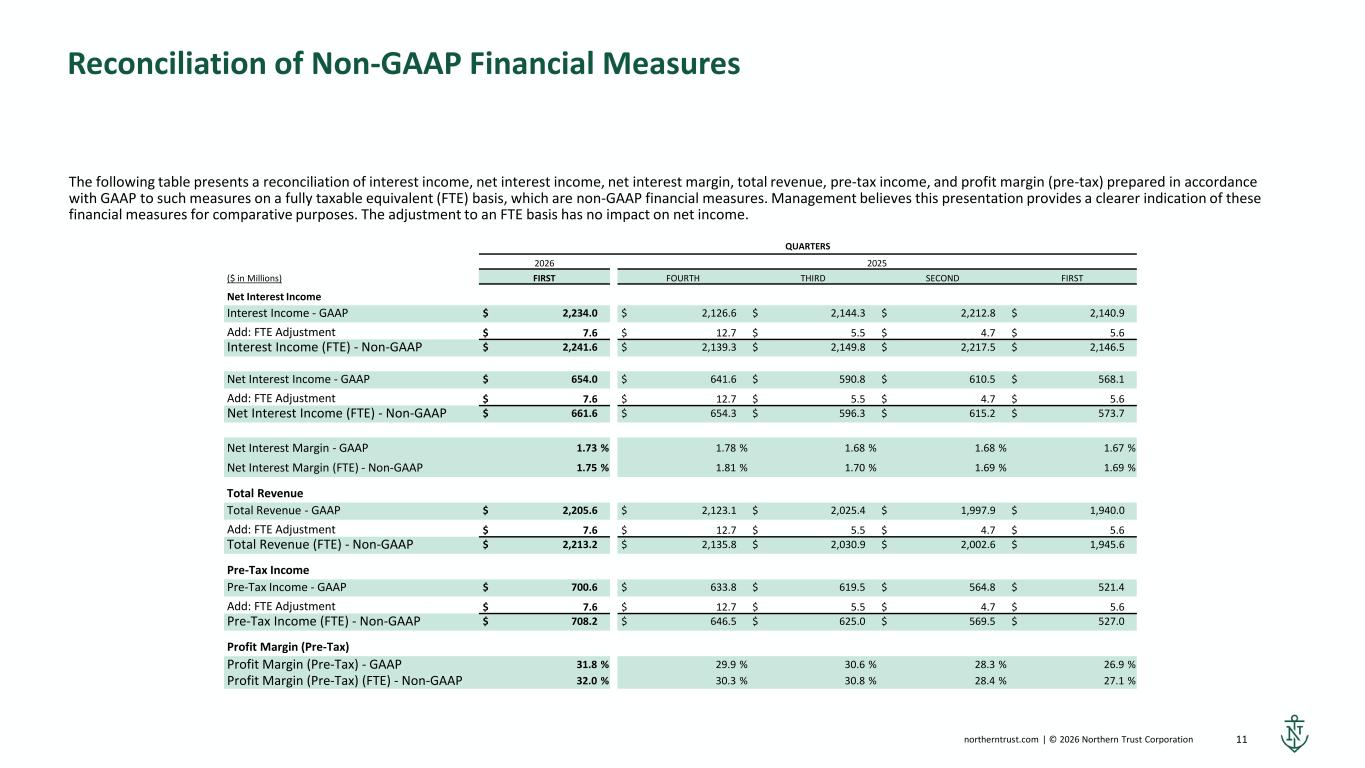
Thanks, Mike. Let me join Jennifer and Mike in welcoming you to our first quarter 2026 earnings call. Let's discuss the financial results of the quarter, starting on page four. This morning, we reported first quarter net income of $526 million, earnings per share of $2.71, and our return on average common equity was 17.4%. We're off to a strong start to the year. We delivered our seventh consecutive quarter of positive organic growth, positive operating leverage, and year-over-year improvement in our expense-to-trust fee ratio, all excluding notables. We also returned 100% of our earnings to shareholders. Relative to the prior year, currency movements favorably impacted our revenue growth by approximately 120 basis points and unfavorably impacted our expense growth by approximately 130 basis points. Relative to the prior period, currency movements were immaterial to both revenue and expense growth. Trust investment and other servicing fees totaled $1.3 billion, an 11% increase compared to last year, driven by favorable markets, currency, and new business generation. Other non-interest income was up 33% year-over-year, reflecting very strong FX trading and securities commission and trading income, which benefited from elevated macro volatility and uncertainty. Net interest income on an FTE basis was up 1% sequentially to $662 million, a new quarterly record, and up 15% from a year ago. Our assets under custody administration were down 1% sequentially, but up 10% compared to the prior year. Our assets under management were also down 1% sequentially and up 11% year-over-year. Overall, our credit quality remains very strong, with all key credit metrics in line with historical standards. We recorded a $3 million reserve release in the first quarter, driven by improvements to the CNI portfolio, which was partially offset by a small number of non-performing loans. Our effective tax rate was 25%, down 150 basis points from the previous quarter due to higher benefits associated with share-based compensation. We still expect the effective tax rate in 2026 to be approximately 26% to 26.5%. There were no notables in either the first quarter of 2026 or the first quarter of 2025. Turning to our wealth management business on page 5. Wealth management started the year well, with strength and trust fees across both GFO and the regions, spanning both advisory and product channels. Assets under management for our wealth management clients were $498 billion at quarter end, down 2% sequentially, but up 11% year over year. Trust, investment, and other servicing fees for wealth management clients were $601 million. up 11% year-over-year, with particularly robust organic growth within GFO. Average deposits within Wealth Management were flat sequentially, while average loans were up 1%. Wealth Management's pre-tax profit rose 9% over the prior year period, while the pre-tax margin remained flat at 37.1%, as we continued to reinvest in the business to support future growth. Moving to our asset servicing results on page 6, our asset servicing business also had a good start to the year, boosted by healthy new business generation coupled with robust capital markets activity. Assets under custody and administration for asset servicing clients were $17.3 trillion at quarter end, reflecting a 9% year-over-year increase. Asset servicing fees totaled $741 million, up 10% over the prior year. Custody and fund administration fees were $498 million, also up 10% year-over-year, largely reflecting the impact from strong equity markets, favorable currency movements, and net new business. Assets under management for asset servicing clients were $1.3 trillion, up 11% over the prior year. Investment management fees within asset servicing were $169 million, up 11% year-over-year due to favorable markets and new business activities. Asset servicing average deposits were unusually strong, increasing 11% sequentially, while average loan volume decreased 2% from fourth quarter levels, albeit off a small base. Asset servicing pre-tax profit grew 59% over the prior year period, and the pre-tax margin expanded 740 basis points year-over-year to 28.3%, benefiting from elevated deposit levels, higher volatility-driven capital markets activities, and the pivot in our new business approach. Moving to page 7 on our balance sheet and net interest income trends. Our average earning assets were up 7% on a linked quarter basis as higher deposit levels drove an increase in money market assets and in our securities portfolio. The fixed percentage of the securities portfolio remained flat at 52% in the first quarter, including the impact of swaps. The duration of the securities portfolio dipped slightly to 1.44 at the end of the quarter, and the duration of our total balance sheet continued to be under one year. Deposit levels were higher than expected throughout the quarter as a result of both elevated volatility and general uncertainty in the marketplace. Average deposits were $129 billion, up 8% compared to fourth quarter levels and 11% year-over-year. From the deposit base, interest-bearing deposits increased by 8% sequentially and non-interest-bearing deposits increased by 5%, remaining at 15% of the overall mix. Net interest income on an FTE basis was up 1% to $662 million sequentially and up 15% compared to the prior year. Sequentially, NII was favorably impacted by higher deposit levels, including growth in non-interest-bearing deposits, along with the impact from fixed asset repricing and deposit pricing actions we've taken, which was partially offset by the full quarter's impact from the fourth quarter rate cuts. Our net interest margin on an FTE basis decreased sequentially to 1.75%, primarily reflecting several large short-term institutional deposits and the absence of the higher FTE adjustment recorded in the fourth quarter. Turning to our expenses on page 8. Expenses increased 6% year-over-year. We delivered 410 basis points of trust fee operating leverage and 740 basis points of total operating leverage, and our expense-to-trust fee ratio, while seasonally higher at 112.4%, was down 440 basis points year-over-year. This translated to a pre-tax margin of 32 percent, up nearly 500 basis points year over year. Turning to page 9, our capital levels and regulatory ratios remain strong in the quarter, and we continue to operate at levels well above our required regulatory minimums. Our common equity Tier 1 ratio under the standardized approach decreased by 60 basis points on a linked quarter basis to 12 percent, driven by an increase in RWA related to elevated capital markets activities. Our Tier 1 leverage ratio was 7.3%, down 50 basis points from the prior quarter driven by our larger balance sheet. At quarter end, our unrealized after-tax loss on available-for-sale securities was $446 million. We returned $510 million to common shareholders in the quarter through cash dividends of $151 million and stock repurchases of $359 million, reflecting a 100% payout ratio. Turning to our guidance, for the full year, we now expect NII to grow by mid to high single digits over the prior year, which is an increase from our previous guide of up low to mid single digits. We still expect to generate more than 100 basis points of positive operating leverage, and we expect to return at least 100% of our earnings to shareholders. Before we open it up for questions, I'd like to take a moment to thank Jennifer Child, our Head of Investor Relations, and congratulate her on her upcoming retirement. Steve Carroll, currently the CFO of Northern Trust Asset Management, will be stepping into the role and will work closely with Jennifer over the coming weeks to ensure continuity. Jennifer has been a trusted partner to me and a leadership team, and we're very grateful for her many contributions over the years. And with that, operator, please open the line for questions.
Operator
Thank you. And if you would like to ask the question, please signal by pressing a star one on your telephone keypad. If you are using a speakerphone, please make sure your mute function is turned off to allow your signal to reach our equipment. We ask that you please limit yourself to one question and with one follow-up question. Again, you can press star 1 to ask a question. We'll pause for just a moment to allow everyone an opportunity to signal for questions. We'll now take your first question, coming from the line of Ibrahim Poonawalla with Bank of America.
I guess maybe just two questions. One, just at the very top of the house, when we look at the pre-tax margin, the ROE performance this quarter, including in asset servicing, but for the entire business. Given just that there's a component of the macro being very strong for Northern, but there's also a self-help component that was kicked off about a couple of years ago. As we think about the sustainability of the ROE or the pre-tax margin, just maybe frame for us where you think there might be a little bit of cyclical tailwinds that's leading to over-earning on these relative to structural actions that have been taken over the last couple of years that may improve the resiliency relative to what we reported for OneQ?
Sure, Abraham. It's Mike. I'll take that. So our goal is to be a consistently high-performing company. And as you pointed out, that's something we put out there a few years ago, along with our One Northern Trust strategy. So we're very focused on executing on the three pillars of that strategy. We'll do that in different environments. And this past quarter was a very constructive environment. And so there's no question that we got a lift in our financial performance as a result of that. Equity levels are still relatively high. The level of volatility is attractive for our capital markets business. And there's a fair amount of liquidity, broadly speaking, in the market, which helps us with deposits, with money market funds as well. So very constructive on that front. That said, you know, we also, to your point, think about it from a self-help perspective and try to just execute as well as possible, whether it's a really strong environment or not so strong. As far as the targets, at the last earnings call, we put out medium-term targets. You know, some of those, as I mentioned, we've kind of largely hit or are close to.
That said, you know it was in this strong environment so we're going to keep driving towards those medium term targets got it and i guess maybe just uh switching to the global family office it's been a strong business over the last few years maybe talk to us around the win rate and the competitive landscape there and just the evolution of that client when once they're on board how do you think about just the growth runway and the opportunity to improve the ROI on the client once they're on board at Northern. Thanks.
Sure. So the global family office business is absolutely one of our strongest businesses. It's an area where, you know, truly we can deliver the entire firm. It's the best of all three of the businesses in working together for these largest families and their family offices. And as you pointed out, it's grown at a high rate. And once again, here in the first quarter, the organic growth rate for GFO was above the average for the businesses. And there's a number of dynamics that are allowing us to continue to grow at that high rate. One, it is certainly just the competitive position that we have and our offering on that front. But second is that it's still largely a U.S. domiciled or focused business. Right now, international is less than 15 percent of the client base and the revenues, and yet it's growing at a faster growth rate. And we do believe that this is something that is not only, I'll say, attractive offering globally, but also is something that is scalable globally. And then to the latter part of your question, you're absolutely right that often the relationship with the family office can start with a more limited breadth of offering. So it may focus primarily on custody and reporting to start, but then that's the opportunity to do much more with the family office when it comes to other opportunities, particularly along the lines of investment management, and you saw some of that in the first quarter as well. So we think it's a great business and continues to have a lot of upside.
Operator
Got it. Thank you. Your next question will come from the line of Manon Gousalia with Morgan Stanley.
Hi, good morning. I wanted to start on the operating leverage side. I mean, 740 basis points of operating leverage this quarter, a really strong, you know, I think you reiterated the guide of generating over 100 basis points of operating leverage this year. Can you help us just think through, you know, how we should think about, I guess, expense growth this year? You know, are there any investments that were maybe got pushed out, any timing differences or anything else we should be considering here?
You know, our expense growth methodology hasn't really changed. If you think a little bit about the expense growth in this particular quarter, most of it was driven by incentives, and there was some noise from currency as well. So actually when you make more money, you obviously are going to have a rising expense line. We still have in process the idea behind productivity funding investment and then solving for an expense growth as a result of that. And so we haven't changed. And what I would say is the productivity targets for the first quarter hit their target. The investments that we wanted to make, we were able to make. And the expense growth we managed, too, was pretty much spot on where we thought it would be. And so that discipline and flexibility is built into our planning, which is why at the beginning of the year, I talked more about operating leverage than I did about attaching myself to a finite expense growth number. We wanted to have the flexibility to react when markets were conducive, but also have the discipline to be able to flex down in environments that are less. So when I think about expenses, I think about a dynamic expense line that basically is something we look at on a very continuous basis. And so it's very much driven today by the productivity and the investment side of the equation.
Got it. And then maybe to pivot over to capital, any thoughts on the new Basel Endgame proposal and maybe how it impacts your capital deployment strategy going forward?
Yeah, I think it's too soon to think about how it might impact the capital return part of it. I will say that on measure, our preliminary view of it is it could be a net positive for us as it relates to obviously the commercial loan side and the operational risk is something that we probably have less of than some other peer banks. And so net-net, we think that it's going to be a positive for RWA, but it's still early days. We're in the comment period. And so I would say is taking a cautious look to it. Don't think it's going to have a massive impact, but if it does, it will certainly be net positive at this point.
Thanks so much, and congratulations, Jennifer. thank you your next question will come from the line of mike mayo with wells forgo securities or hi um look uh wealth is growing double digits uh as you said um firm-wide revenues up 14 percent the higher end of return targets so seems like it was working this quarter but what got my attention is i think new news that you look to grow wealth producers by seven to nine percent i think that's this year um and so and correct me if you disagree but i think this is the most competitive market we've seen in the wealth business like almost ever um so the question is i'm not saying it's a wrong strategy the question is why now do you look to increase the wealth producers and what's your pitch because i think every literally every large bank large brokerage firm is looking to expand wealth at this time. What's your pitch when you try to get the new producers?
Thanks, Mike. So you're right. We are focused on hiring and investing in talent in the wealth management business. And you're absolutely right. It's a very competitive marketplace for the best talent, which is what we're looking for. And we are trying to focus on roles that are revenue generating for us and within that producer roles. And part of it is, as we look back over the last several years, although that group has grown, it has grown at a lower rate than the growth of the business itself. And so there's an acknowledgement that we need more talent to increase the growth rate, the organic growth rate within wealth. As far as being able to have an attractive value proposition for wealth management professionals and advisors, we think we have a very different value proposition. We have an excellent brand. We are positioned within the upper tiers of the market, which I'll say the highest levels of expertise want to be able to not only serve that client base, but look to bring on new clients on that front. We've been investing in the platform to do that. We've talked a lot about family office solutions, which we believe really is a differentiated offering. It's, in our view, better and more attractive than standalone virtual family offices, because it brings the full set of resources and banking capabilities that we have. And yet it's also an opportunity to leverage the history and the fiduciary capabilities that we have and trust capabilities. So we think for an advisor or a professional that's looking to be able to apply their trade, if you will, and succeed, we offer the best platform for them to be able to do that. So that's a big part of it. It is a different model here at Northern, and that's, as you know, that's part of why we think it's more attractive.
And as part of this increased investing for growth, whether it's wealth or firm law, because you rattled through a lot of growth initiatives, is that, and maybe I got this wrong, but you're still guiding for 100 base points of operating leverage this year, but you had over 700 base points of operating leverage in the first quarter. is the reason for no change in that guide just conservatism or also because you think you might be ramping up some spending as you bring on these new producers?
Yeah so as I mentioned before obviously it's a very constructive backdrop and macro environment for us so there's definitely some acknowledgement that the strong revenue growth here was driven and supported by that backdrop. We don't know what's going to happen as we go through the year. And there are also some tough comps in the sense of last year, we had strong second, third, fourth quarters. So acknowledging that that's ahead of us as well. And as Dave mentioned, we've really tried to align our, I'll say, resource deployment strategy based on productivity and looking to ensure that we're driving productivity to fund that investment. And so we haven't pulled off of that. Yes, we expect to continue to invest in these areas that we talked about, but the plan is to try to generate more productivity to do it and not necessarily change the expense growth profile that we've been on.
Got it. I'd just like to add to that, the direction of travel on expenses is down.
Operator
Next question will come from the line of Brennan Hawken with BMO Capital Markets.
Good morning. Thanks for taking my question. So, Dave, you know, you flagged strength as far as the deposit growth goes, and it looks like a lot of, from the presentation, a lot of the deposit growth was driven by the servicing business. You also flagged some large institutional deposits weighing on NIM. So was that part of that deposit strength, some large institutional deposits? And how should we be thinking about the profile of deposits as we move forward and what your expectations are for that through the course of the year?
Yeah, we had some, you know, largely unexpected, extremely large deposits. I mean, you've heard me speak in the past about why we keep our capital ratios where we keep them, and we want our balance sheet to be open at all times for our largest clients. And so occasionally some of our clients will do some strategic repositioning, and we want to be in a position to capture those deposits when they do that. They're not core operational deposits. They aren't there for a long period of time, but we want to be able to accommodate them. So in this particular quarter, you know, it really drove up the average deposit level significantly, and that isn't going to obviously translate into a Q2, although I do think the increase was roughly $9 billion, and I think we're going to keep four to five of that, so in terms of average deposits. But at the end of the day, that's really what you saw there was client-driven, specific, very large deposits from just a handful of just really important big clients.
Okay, that makes a lot of sense. And you also spoke to robust organic growth in the GFO business, but we didn't see a lot of deposit trends. We certainly saw the revenue look good. And is the organic growth in that business less tied to deposits the way we normally think about that, and therefore that's the divergence? And also, maybe could you give a little color around your new efforts around the GSO and how that's going? And when you guys talk about GFO, do you categorize those two together?
Sure. So just on the liquidity part of the question there, Brennan. So these family offices have significant liquidity, which they are, I'll say, utilizing and moving around quite a bit. And so it can move from on the balance sheet as deposits to into our money market funds or short-term treasury. So it's, I'll say, a pretty active management of liquidity that we do, I'll say, on their part and for them. And so from quarter to quarter, for example, those deposit numbers can move up and down. And to your point, it's less of an indicator, I would say, of the organic growth and more of an indicator of just their activity. To the second part of your question, we have the benefit of having this strong family office business, which we've been in for quite a while and have built up the capabilities. And to your point, what we've looked to do with family office solutions is leverage those capabilities but in such a way that we can create the virtual family office experience for a family that doesn't want to have to set up their own office. So it's not run as one business together, but I would say two businesses that are very closely related and highly coordinated in what they're doing because they're leveraging some of the technological capabilities, some of the expertise that cuts across that, And it's just a different service model where we're acting as essentially the head of that family office for them as opposed to that person and team being, you know, employees of the client's family office. Okay.
Thanks for taking my questions. And, Jennifer, congrats on your retirement.
Operator
Your next question will come from the line of Alex Blasdain with Goldman Sachs.
Hi, good morning. Thank you. So, Mike, top of the house question. So the tone in your prepared remarks to some of the Q&A feels like, you know, leans on organic growth, acceleration a little bit more than we heard from you guys in the past. And you talk about some of the investments you're making to sort of support that. Can we talk through maybe the areas where you see the most opportunity to accelerate growth and ultimately what you think Northern's organic fee growth, so X markets, should look like over the next couple of years if you achieve these goals, both across the institutional business and the wealth? Sure.
So I would start, Alex, by saying that we see the organic growth opportunity across all three businesses. The nature of it is going to be different. We've talked somewhat on the call here about wealth management. A lot of the investment, but also then the opportunity on the wealth management front is to add talent to that to increase the growth rate. So I think we've talked through that part of it, but it also cuts across, you know, other aspects that drive growth in thinking about marketing. I talked about digital marketing that we're doing, a focus on centers of influence. There are other areas where we're trying to essentially, you know, bring in more opportunities at the top of the funnel in order to increase that growth rate. And, you know, many of them require investment to be able to do that. And I would also say on that front, that's an area where we believe that AI is going to create opportunities for us to continue to transform the client experience and the advisor experience, particularly as you work down the wealth tier. So we're excited about that, but that also does require investment to be able to drive that. Within the asset servicing business, as we've talked about there, the real goal is around scalable growth. And I would say staying focused on our current footprint, our current offerings, the segments that we're in, That's where we expect to get this continued growth at a profitable, very profitable level and expect to continue to drive the margins up in that business. And then within asset management, really, you've seen a lot of growth that's come from the core products for us, certainly liquidity. But where we're really investing there is on the ETF front, as well as tax-advantaged equity and also quant. And that requires investment in the sense of building out our distribution capabilities for third party. But we believe that's an avenue which right now represents a relatively small part of our asset management business that could grow at a much higher growth rate. So that's, I'll say, the combination across the businesses. And we've talked about an organic growth rate that we've targeted around 3%. and certainly from what I talked through there, that's going to drive the 3%, but we hope above that as well.
Got it. Thank you. And then a quick follow-up just around capital management. Would the Visa shares become available to you guys this year? Can maybe just talk through the amount of proceeds you expect, the use of these proceeds and timing when it comes to potentially bigger buybacks?
Yeah. So we'll roughly get half of our position, let's say $470 million pre-tax, so $350 post-tax, depending on the share price. And we've only just begun to sort of think about what we're going to do with it. I don't think we're going to use the same, obviously, playbook we had a few years ago. We've got other options at this point, but we're going to weigh it against all our other priorities and take a look at what to do at that point in time, but haven't landed yet on that.
Okie dokes. Thank you very much. Thank you.
Operator
Your next question comes from the line of Ken Usdin with Autonomous Research.
Hi, thanks. I want to ask a question just about the balance sheet. You mentioned that the benefits that came through, the size of the balance sheet and the deposits, maybe some of that doesn't say, maybe some of it does. But just given the higher for longer environment, how do you think just about duration of the security portfolio and any other changes to that? Or is it really more of a wait and see because you're not 100% sure if this elevated size of the balance sheet lingers?
So when you think about the upside to our balance sheet and to our NII during the course of the year, there's a bunch of different things we think of in trying to figure out what we're going to guide. And so the first one would be the investment securities maturity replacement. Obviously, we still have back book repricing, and we can take advantage of that through the full year in 26. We did take some deposit pricing actions as well towards the end of last year, let's say third and fourth quarter, and we haven't lapped those yet. So those are built-in increases that we see coming in the year. We've been leaning a bit more into some incremental investment strategies around higher yielding opportunities. we've been looking at our wholesale funding mix a little bit more leaning a bit more into FIC repo as well and so when you put all those together and obviously the deposit growth so we're thinking about having some deposit growth in line with the businesses and we also no longer have the potential headwind in our mind anyway of rate cut in the US and we've taken that off the table and may even have some rate increases in Europe. And so you put all that together, and that's sort of how we come up with it. We're not going to reach for yield. We're not going to materially change our profile in terms of duration to try to get there. We don't need to, to be honest with you, to get there. We feel we can do it without that. And there's a lot of uncertainty out there. So I think our positioning right now is pretty stable.
Thank you, and thanks for that. And just a bigger picture follow-up, you know, we've got a potential new Fed chair coming on who talks about potentially shrinking the size of the Fed balance sheet. You know, the Fed balance sheet's already been down $2.5 trillion, and trust bank deposits keep growing. But you remind us of the rule of thumb to think about, you know, if the Fed balance sheet continues to shrink over time, how insulated is your balance sheet from that in terms of deposits?
Ken, I would say that is something that we are obviously observant of and what's happening. And frankly, I'll say a little surprise that liquidity levels have remained so high on our balance sheet and in our funds, given that the Fed has reduced its balance sheet as much as it has. To the extent that we're in, I'll say, some level of stabilization there, I think that's good because that means, you know, our deposit levels and money market fund levels, you know, will grow with our organic growth. So, yes, there is definitely some exposure to the extent the Fed were to really shrink its balance sheet more. I think that pulls liquidity out of the marketplace and, you know, our model as well as others, it tends to, you know, expand and contract with that somewhat. So, yeah, some exposure on the downside, I think less on the upside.
Operator
Your next question will come from the line of Stephen Schubach with Wolf Research.
Hi, good morning. This is actually Sharon Long filling in for Stephen today. Just wanted to ask on the margins in the business segments. The margin in asset servicing has expanded nicely, But while the margin was flat year on year, despite some strong revenue growth, I just wanted to understand, like, what are the components that are going to drive the, I guess, the path towards your medium-term target of 33% in the margin?
So the goal of the asset servicing business, as I mentioned, is scalable growth. And as much as we did have a strong pre-tax margin here in the quarter, this is something that we're trying to consistently move up. And so the expectation is that we will continue to try to see a higher margin in the asset servicing business. You know, we've talked about a particularly strong macro backdrop here. So capital markets, very strong. NII, very strong in asset servicing. So that definitely contributed to the higher pre-tax margin for this quarter. But we want to make that even more sustainable, if you will, and a more resilient high level of margin. So there's more opportunity on that front. On wealth management, where we have had a very attractive pre-tax margin, that's an area you've heard a lot where we've talked about growth and making investments for growth. So we feel like we're in, I'll say, a good range for that margin, but we are emphasizing growth as opposed to trying to see that margin go up. And to the extent we did have some pressure on the wealth management margin as we make some of these investments in the near term, the expectation is that we'll more than make up for those with improvement in asset servicing.
Operator
Your next question comes from the line of David Smith with Truist Securities.
On organic growth, you said it's seven consecutive quarters of positive growth for the business as a whole. And then there's a 3% target that you've put out there, but you think there's an opportunity to do better over time. You know, let's get a sense of where organic growth is today and where you were a year ago. You know, we know GFO is above average, but is that servicing and the regional part of wealth, you know, barely positive today, 1% or so, 2% or so. Sure, it can bump around some quarter to quarter, but maybe over the past year, what kind of organic growth have each of those businesses earned, and then where were those, say, like the year prior? Thank you.
Sure. So to just start with this quarter, each of the three businesses had positive organic growth, and that would also be true within the major segments of the business. But to your point, if we look at each of them individually and a little bit, I'll say, over time, within wealth management, you know, the organic growth has been closer to a consistent, I'll say, 1%, with GFO, you know, being above that and the regions being a little bit below that. And that's where we're looking certainly for GFO to continue to grow at a high rate, but it's more with the regions incrementally increasing that growth rate as we go forward this year and into next year to move it up in total above the 3%. So made progress this quarter, but again, it's all about consistency. consistency. In the asset servicing business, just given the nature of some of the larger mandates, that organic growth rate can, I'll say, swing or vary more from quarter to quarter or even in a year. So we did, if you went back a few years, we did have some periods where we had some business that rolled off that did bring that down to kind of flat to negative organic growth. As I mentioned, it's positive right now, again, in about the same range as the wealth management business, but we see the opportunity likewise to continue to see that growth rate increase, but with the focus on profitability and scalability for it. And asset management overall, a lot of the organic growth more recently has been primarily driven by liquidity, but we're seeing greater diversification in the growth with that business as well. So in the past quarter here, likewise, some of the areas that I mentioned around ETFs and for some time period, tax-advantaged equity have had nice organic growth across that front. So once again, at about the same range there and same expectation to see that increase.
Got it. And do you expect over time all of the major businesses to be doing 3% organic or medium term? Would you expect, you know, to get there for the company as a whole, but some to be above and some to be below?
Yeah, so, you know, the target is for all of them to be above the 3%, but just given the way that it varies, you know, say from quarter to quarter, even year to year, you know, they may not all be, but that's the benefit of having the three businesses.
Operator
Your final question will be coming from the line of Gerard Cassidy with RBC.
Hey, Mike. Hey, Dave. Morning. Mikey, I think you called out in your prepared remarks that you saw outsized growth in the wealth management area in your central region. Can you highlight what drove that?
You're right, Gerard. We did. And I would say, you know, often, you know, given that the company has been in the central region and headquartered in Chicago for a very long time, we have a very strong business here. And often people think that it's, you know, a mature business that is not going to grow at the same rate or even a higher rate. But the fact of the matter is the team and the leadership of this region, particularly under John Fumagalli and his team, have consistently leveraged that strength to be able to grow at a higher rate. And one of the areas, and I would say more recently, is around the family office solutions that I talked about. That's the area where we started, you know, with that solution set and with that offering. It's already gained momentum in this region, and now we're in the process of rolling that out to the other regions in the same way. So that's a part of the driver of the strong quarter.
Very good. And obviously, the dominance of questions are all about the wealth management and the custody business. So I want to pivot because it's always good to ask you folks about credit quality since it's always so superb. You guys obviously don't take a lot of risk in lending. Your portfolio is not that big relative to your asset size. Can you share with us, what are you guys seeing in the credit quality trends? They're very strong. We understand that. Have things changed meaningfully from the financial crisis and pandemic that customers are more resilient today? Any color there? Sure, Dave.
Yeah, I mean, so just keep in mind when I look at Northern's portfolio that we're very tilted toward investment grade on the corporate side. And our clients and wealth, we're usually doing secured facilities. And so, you know, at the end of the day, for those to be in the stress scenario would take quite a bit of downside to do that. So that's why you see our credit quality so high. And we're not obviously also exposed to the same extent, you know, in the private equity and or private credit space either where there's some pressure right now. You know, we don't lend on the valuation or performance of the underlying fund investments. And so we do subscription facilities where the underlying obligor, which most of whom are institutional borrowers, are really quite strong. And so from our perspective, we're not in the high-yield market. We're not in the leveraged loan market, if you will. So we're not seeing the same kind of pressures that other firms might be experiencing in that regard.
Thank you, Dave. Sure. Thanks, Jared.
Operator
And it appears there are no additional questions at this time. I will now turn the call back to Jennifer Child for closing remarks.
Thanks for joining us, and we look forward to speaking with you again in the future.
Once again, Jennifer, thank you very much. Thanks, Jennifer.
Operator
This concludes today's call. Thank you for your participation. You may now disconnect.