Operator
Good day, everyone. My name is Rob, and I will be your conference operator today. At this time, I would like to welcome everyone to the Sephora Healthcare REIT First Quarter 2026 Earnings Call. All lines have been placed on mute to prevent any background noise. After the speaker's remarks, there will be a question and answer session. If you would like to ask a question during this time, simply press star followed by the number one on your telephone keypad. If you would like to withdraw your question, press star one again. I would now like to turn the call over to Lucas Hartwich, EVP Finance. Please go ahead, Mr. Hartwich.
Thank you and good morning. Before we begin, I want to remind you that we will be making forward-looking statements in our comments and in response to your questions concerning our expectations regarding our future financial position and results of operations, including our earnings guidance for 2026 and our expectations regarding our tenants and operators and our expectations regarding our acquisition, disposition, and investment plans. These forward-looking statements are based on management's current expectations and are subject to risks and uncertainties that could cause actual results to differ materially, including the risks listed in our Form 10-K for the year ended December 31, 2025, as well as in our earnings press release included as Exhibit 99.1 to the Form 8-K we furnished to the SEC yesterday. We undertake no obligation to update our forward-looking statements to reflect subsequent events or circumstances, and you should not assume later in the quarter that the comments we make today are still valid. In addition, references will be made during this call to non-GAAP financial results. Investors are encouraged to review these non-GAAP financial measures, as well as the explanation and reconciliation of these measures to the comparable GAAP results included on the financials page of the investor section of our website at SauberHealth.com. Our Form 10-Q, earnings release, and supplement can also be accessed in the investor section of our website. And with that, let me turn the call over to Rick Matros, CEO, President, and Chair of SauberHealth Care REIT.
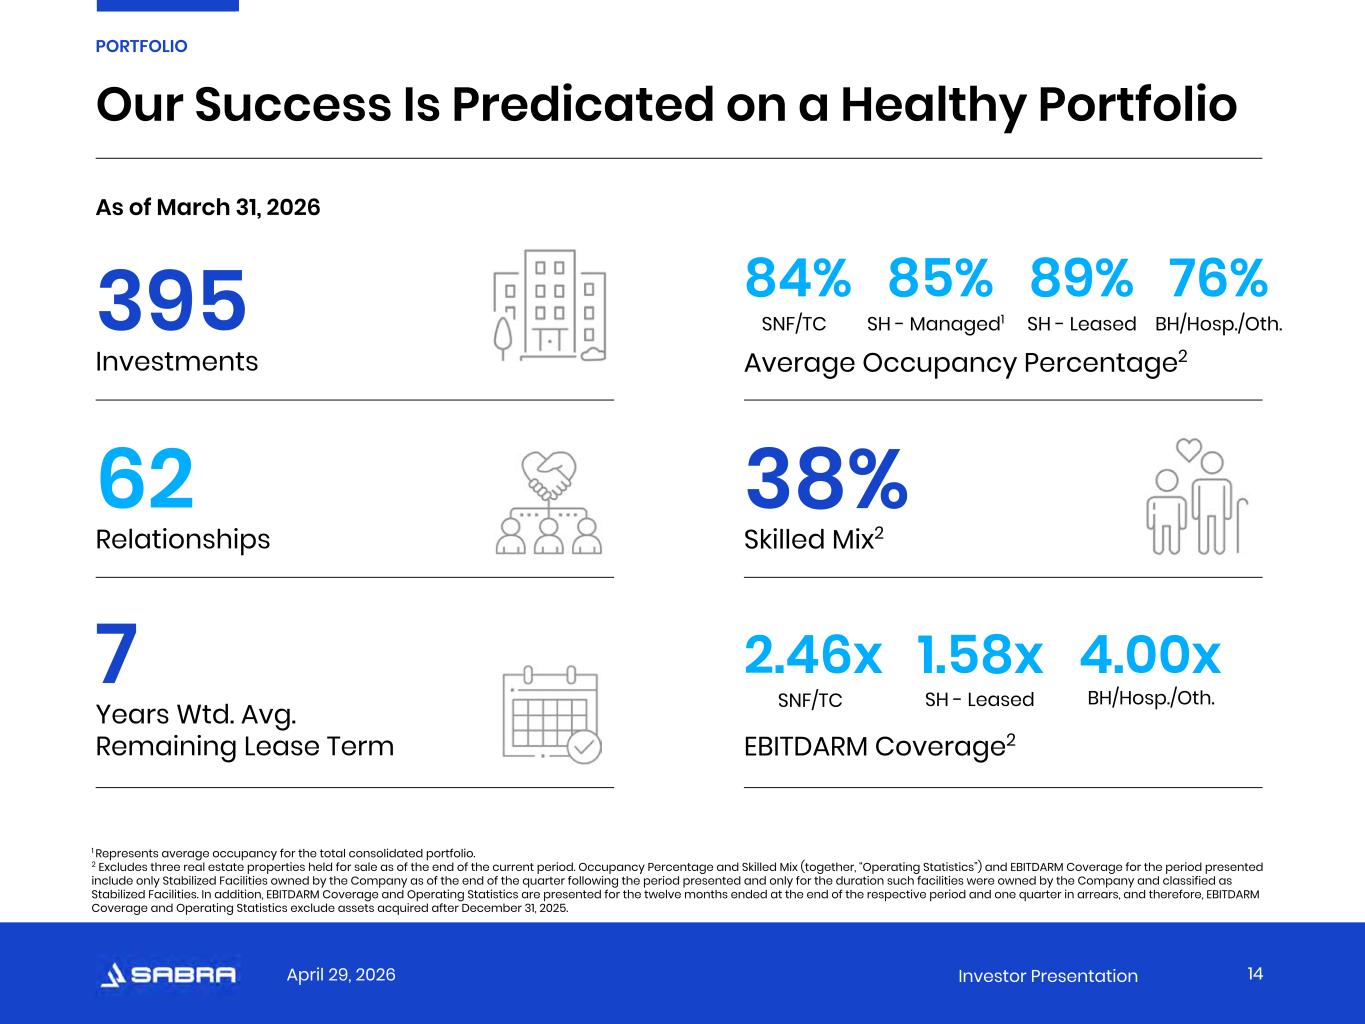
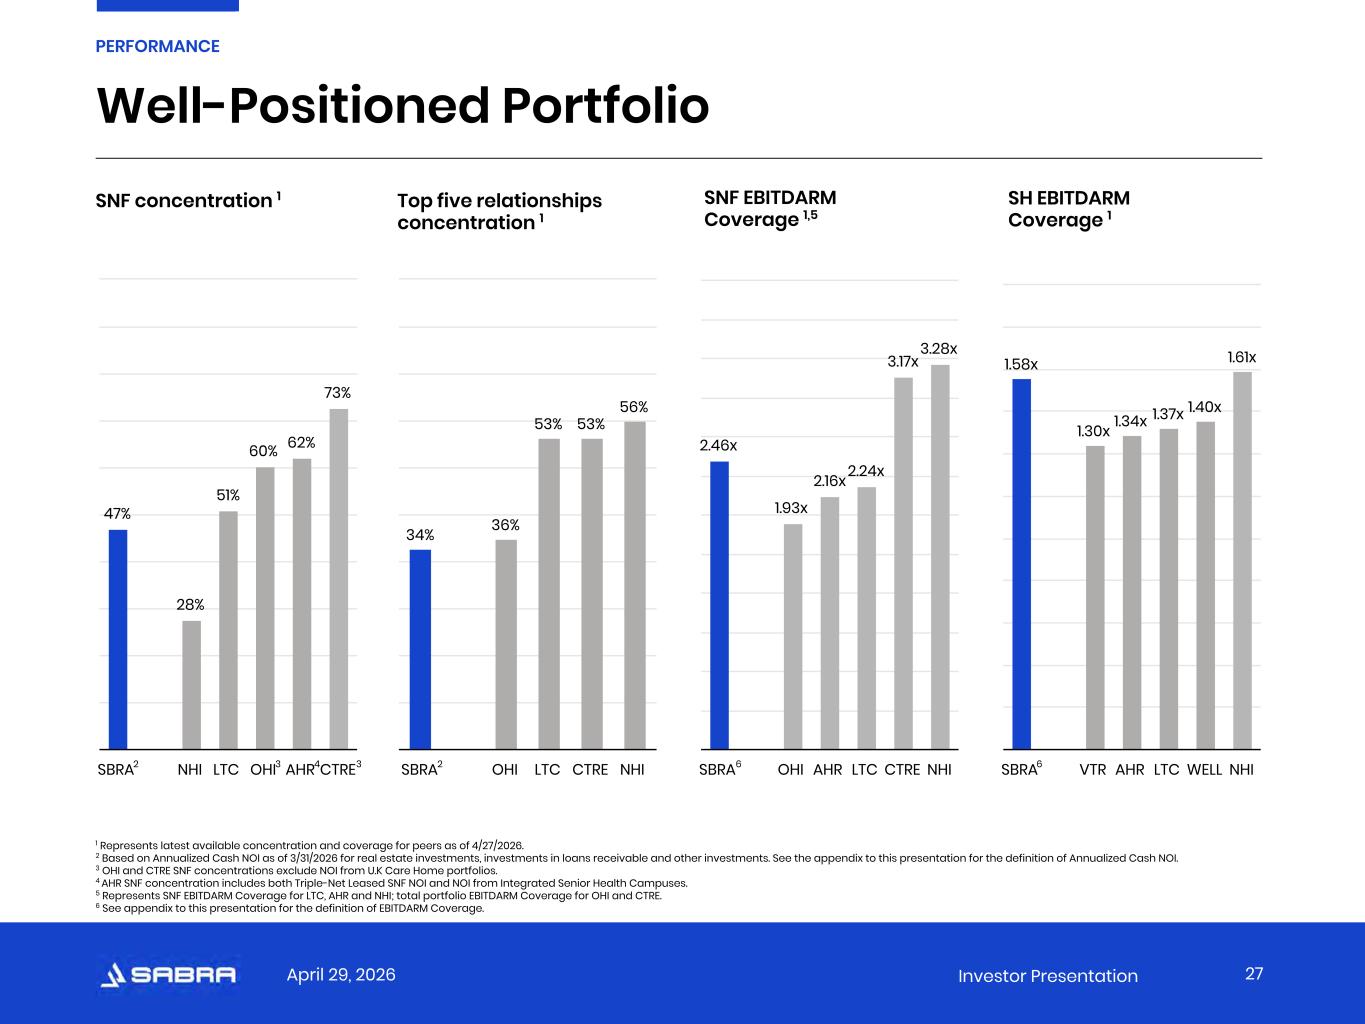
Thanks, Lucas, and thanks everybody for joining us today. Starting with our deal flow, our deal flow continues to be robust. We fully expect to materially exceed 2025's total investments. We've already been closed. We've already closed or been awarded 400 million year to date in addition to opportunities we see in shop we're also seeing someone's skills but the ones that are appealing are off-market deals both acquisitions and development brought to us by existing operators our skilled nursing rent coverages continue to grow as did our senior housing triple net and behavioral all of which hit new highs in coverage our occupancy growth continued in our skilled and senior housing triple net portfolios. Our top 10 coverage is stronger than it's ever been. Our shop margins continue to grow in our consolidated, unconsolidated, and same-store portfolios. Our year-over-year same-store shop NOI growth came in higher than the two previous quarters. Shop occupancy dipped slightly overall, but it was all in Canada, which had very strong year-over-year growth and currently sits at 93.4. So it's almost effectively full, and there'll be ups and downs a little bit with that portfolio. The U.S. portfolio was up 10 basis points sequentially. For the first time in the company's history, our private pay concentration is now over 50% of the portfolio. Our leverage ticked up slightly, but it's still on current target. The regulatory environment is stable. The Medicare market basket proposal is within our expectations. We expect Medicaid rates to be within expectations as well. We have a number of AI initiatives that will streamline and enhance the effectiveness of Sabra corporate. Our intent is to be an AI-enabled REIT. This, of course, is in addition to the numerous clinical pilots we have ongoing primarily in our shop portfolio, which have been really exciting to watch evolve. We're affirming guidance, but we will be revisiting guidance in Q2 given all the current trends. And with that, I will turn the call over to Darren.
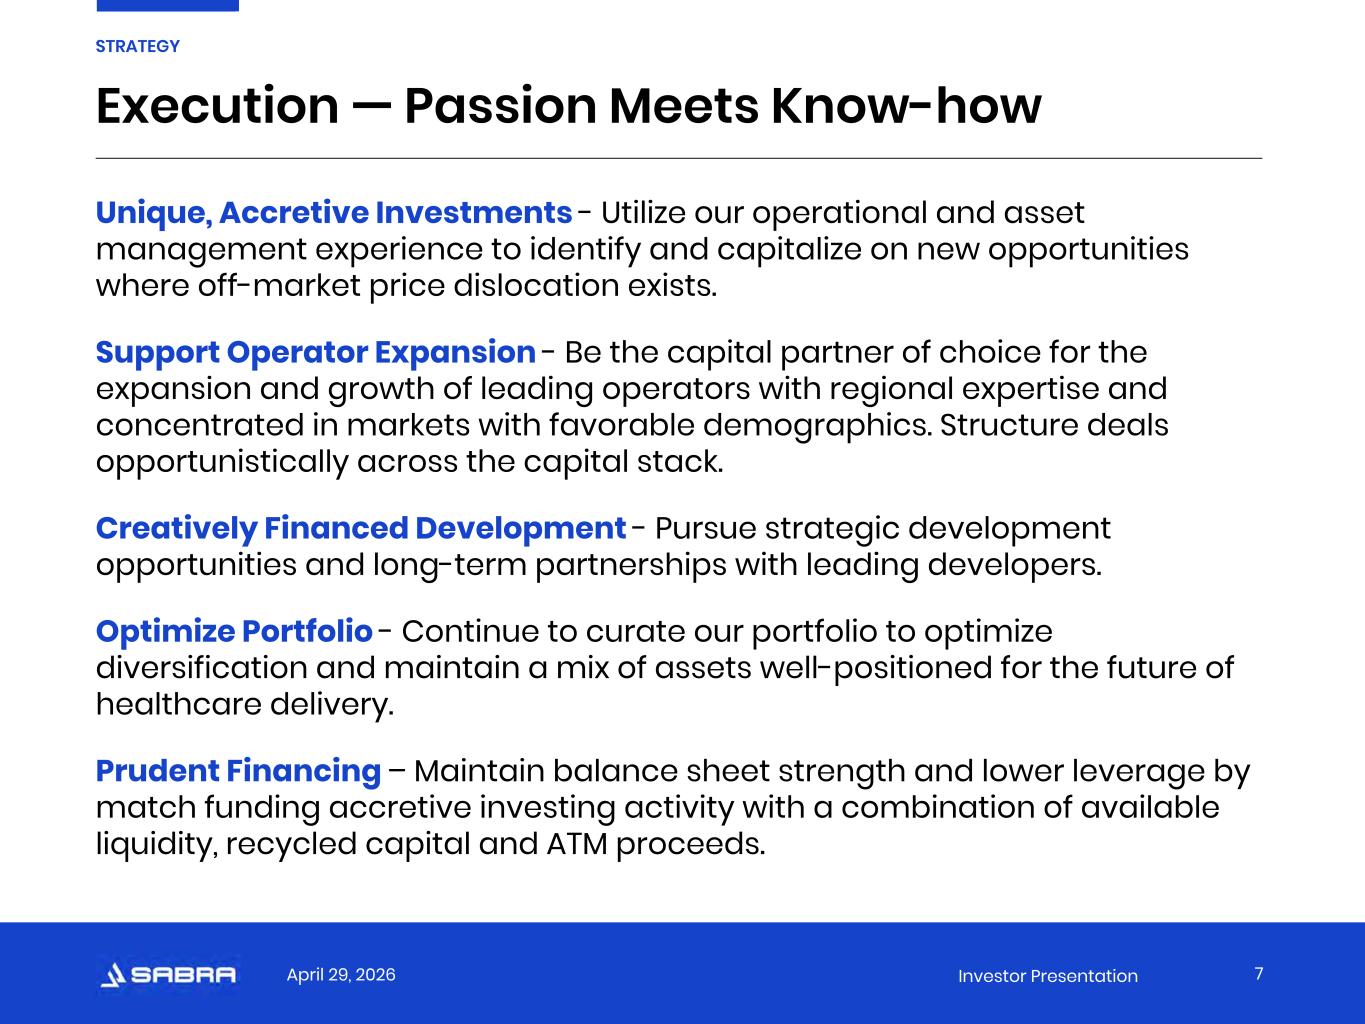
Thank you, Rick. Sabra's managed senior housing portfolio had another great quarter with continued growth. The total managed senior housing portfolio, including non-stabilized communities and joint venture assets at share, had sequential revenue growth of 7.2%, cash NOI growth of 9.5% with margin expansion of 60 basis points. These statistics demonstrate sequential improvement and operating results that reflect the continued growth and strong performance in SABRA's senior housing portfolio. During the first quarter, SABRA invested $102 million, adding three properties to SABRA's managed senior housing portfolio, one skilled nursing community, and preferred equity investment in a senior housing development. Subsequent to quarter end, SABRA invested an additional $104.1 million, adding two properties to SABRA's managed senior housing portfolio and the redevelopment of the senior housing community, bringing total year-to-date investments to roughly $206 billion, with an estimated initial cash yield of 8%. Additionally, SOBRA has another $107 million of additional awarded managed senior housing and $94 million of awarded skilled nursing investments, most of which should close in the second quarter. In addition to the over $400 million in closing awarded investments, SOBRA has an additional $690 million of managed senior housing investments that we are actively pursuing. On a year-over-year basis, SABRA added 21 assets to our managed senior housing portfolio in nearly 25% increase by number of assets and 62% increase in total managed senior housing NOI. Deal flow shows no signs of slowing and SABRA remains competitive on new investments. As our investment pipeline continues to be extremely active, particularly in managed senior housing, we've remained focused on ensuring foundation underneath is built to accommodate that growth. Over the past several quarters, we've been advancing automation, data, and AI-enabled initiatives to support faster, more consistent decision-making, deeper operating insights across the portfolio for us and our operators, and importantly, meaningfully increase the scalability of our platform. This is a continuation of how we've evolved the platform over the last decade, and we view it as an accelerator of portfolio and earnings growth, as well as long-term value creation. Moving on to the same-store portfolio. Sabra's same-store managed senior housing portfolio, including joint venture assets at share, continued its strong performance in the first quarter. The key numbers are revenue for the quarter grew 7.9% year-over-year, with our Canadian communities growing revenue by 9.6% in the same period. First quarter occupancy in our same-store portfolio was up 280 basis points to 88.4% year-over-year. Notably, our domestic portfolio occupancy increased 280 basis points to 85.6 percent during that period, while our Canadian portfolio grew 270 basis points to 93.4 percent in the same period, marking the eighth consecutive quarter where occupancy was over 90 percent. Rev4 in the first quarter continued to rise with an increase of 4.6 percent year-over-year, with our Canadian portfolio increasing 6.5% in the same period. While RevPort and occupancy continue to grow, ExPort increased only 1.8% for the same period, providing for cash NOI growth of 14.4% on a year-over-year basis. With over $400 million in closed and awarded investments today, a very robust pipeline and industry tailwinds our backs, we should continue to see solid growth in our portfolio. Our net That lease in your housing portfolio continues to do well with continued strong rent coverage. And with that, I will turn the call over to Michael Costa, Sabra's Chief Financial Officer.
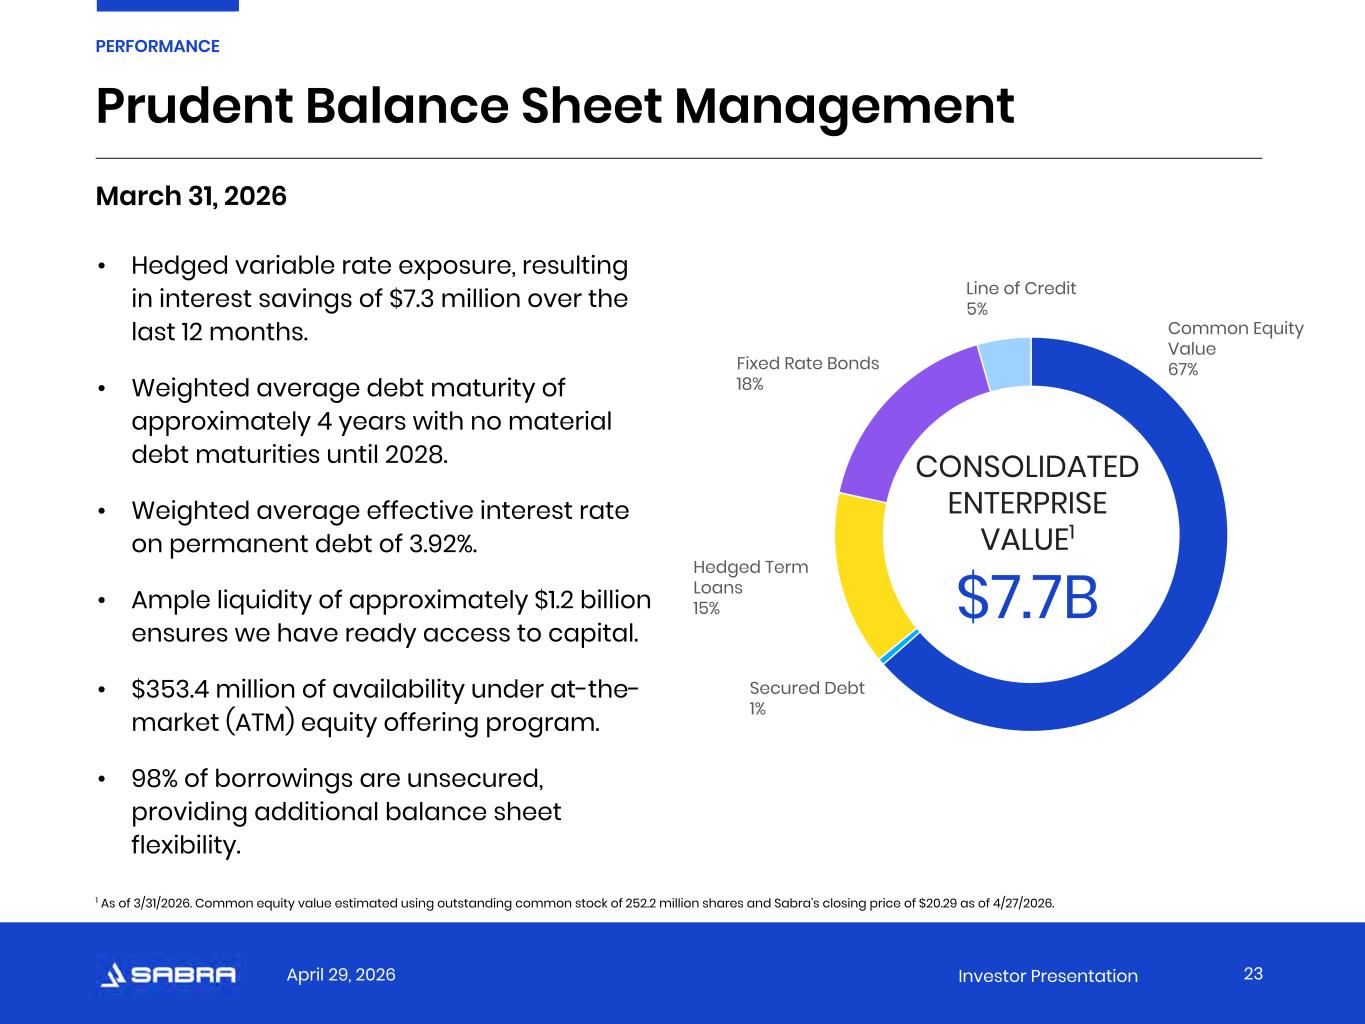
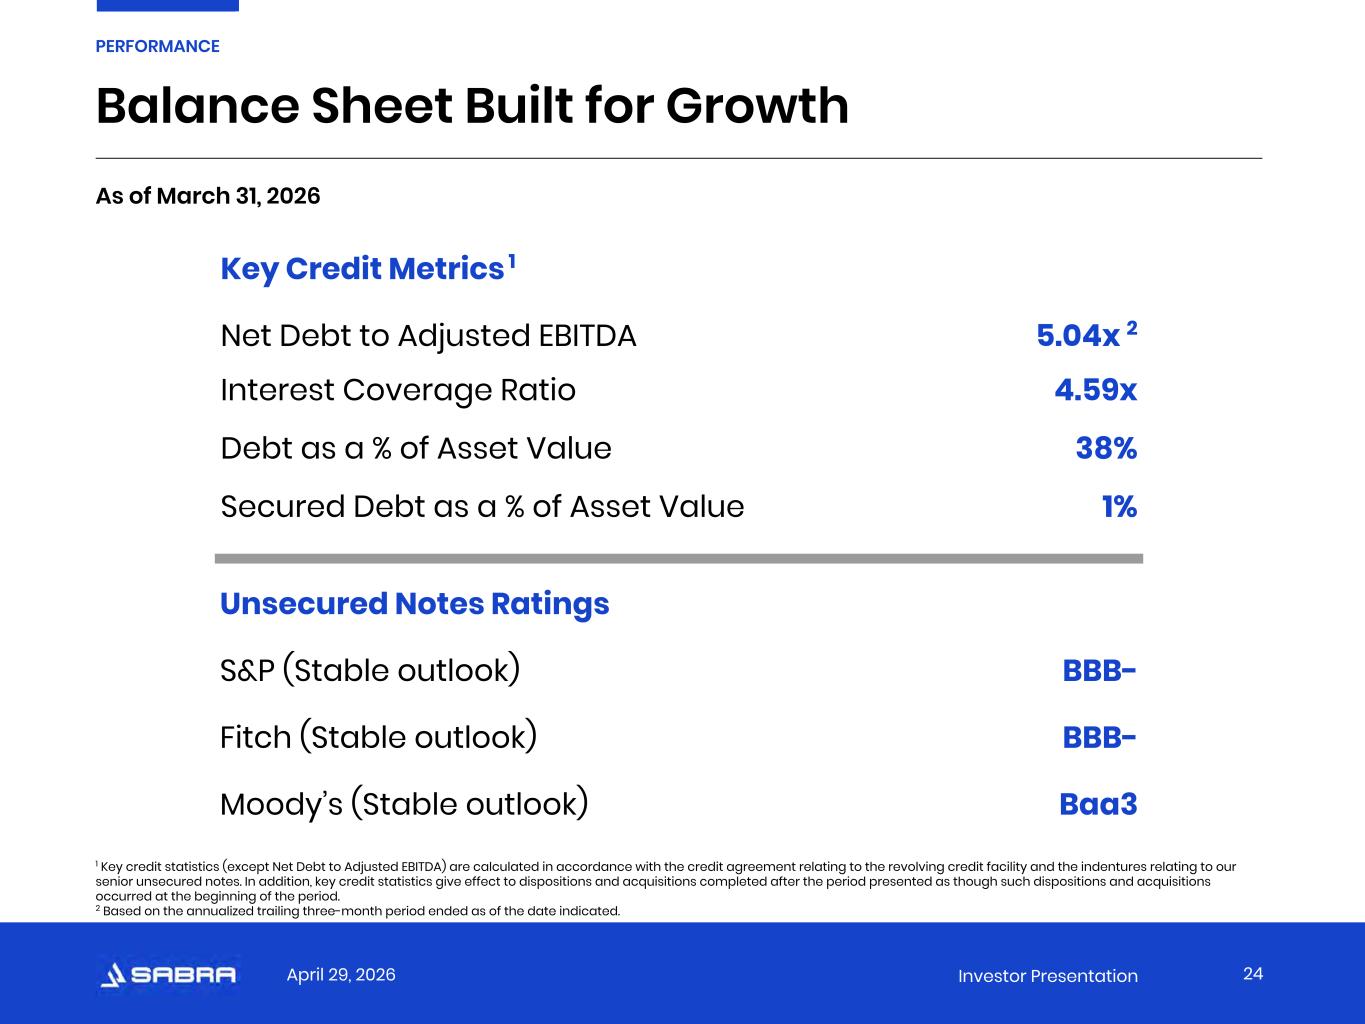
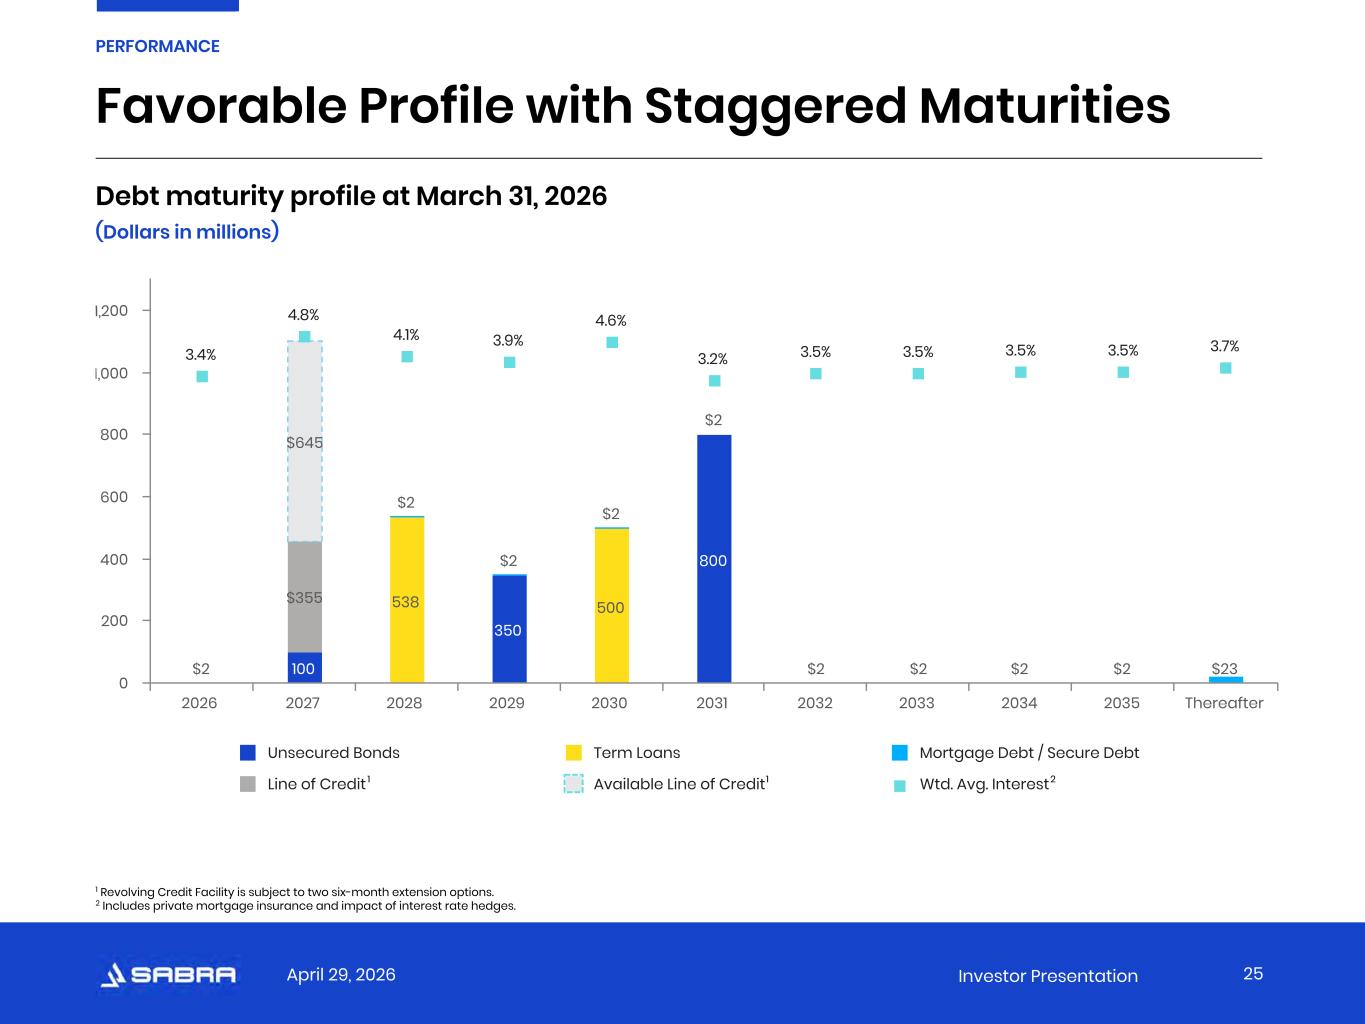
Thanks, Darren. For the first quarter of 2026, we recognized normalized FFO per share of $0.38 and normalized AFO per share of $0.39, which represents a 9% and 5% increase respectively over the same periods in 2025. In absolute dollars, normalized FFO and normalized AFFO totaled $96.1 million and $100.6 million this quarter, respectively. Cash NOI from our triple net portfolio increased $2.2 million from last quarter, primarily due to annual rent escalators and increased collections from certain cash basis tenants. Cash NOI from our managed senior housing portfolio totaled $39 million for the quarter, compared to $35.6 million last quarter. This $3.4 million increase was primarily the result of recent investment activity, together with sequential growth in our same-store portfolio. Interest and other income was $10 million for the quarter, compared to $10.6 million last quarter. This decrease was primarily due to paydowns received during the quarter and lower interest income on our cash balances. Cash interest expense was $26 million compared to $26.6 million last quarter. Normalized cash G&A was $11 million this quarter compared to $10.6 million last quarter. This increase was primarily related to hosting our 2026 Operator Conference last month. Subsequent to quarter end, we completed the disposition of three skilled nursing facilities in Maryland leased to Communicare for gross proceeds of $79.4 million, equating to a 6.8% lease yield. These facilities were classified as held for sale as of March 31, 2026. As noted in our earnings release, we have reaffirmed our previously issued 2026 earnings guidance and the results for this quarter are in line with our assumptions underlying that guidance. Now briefly turn to the balance sheet. Our net debt to adjusted EBITDA ratio was 5.04 times as of March 31st, 2026 and continues to be in line with our targeted leverage. As we have stated previously, while we are comfortable with our leverage level, we will continue to assess opportunities to reduce leverage over time where doing so supports our continued focus on strong year-over-year earnings growth. As of March 31, 2026, the cost of our permanent debt was 3.92% and the weighted average remaining term on our debt was approximately four years, with the next material maturity being in 2028. Additionally, we have no floating rate debt exposure in our permanent capital stack, with the only floating rate debt being borrowings under our revolving credit facility. As Darren noted, our pipeline of investment opportunities has remained extremely active, and that has coincided with continual improvements in the cost of our equity capital. Accordingly, we have been actively utilizing the forward feature under our ATM to lock in this attractive cost of capital to fund our investment pipeline. During the quarter, we issue $128 million on a forward basis at an average price of $20.19 per share after commissions. And in total, we have $451 million outstanding under forward contracts at an average price of $19.03 per share after commissions. We expect to use a portion of the proceeds from the outstanding forward contracts together with the proceeds from the Communicare asset sales to close on the investments we have been awarded on a leverage-neutral basis while still retaining meaningful dry powder to fund additional investments. As of March 31, 2026, we are in compliance with all of our debt covenants and have ample liquidity of approximately $1.2 billion, consisting of unrestricted cash and cash equivalents of $117 million, available borrowings under our revolving credit facility of $645 million, and the $451 million outstanding under forward sales agreements under our ATM program. As of March 31st, 2026, we also had $353 million available under the ATM program. Finally, on April 29th, 2026, Sovereign's Board of Directors declared a quarterly cash dividend of $0.30 per share of common stock. The dividend will be paid on May 29, 2026 to common stockholders of record as of the close of business on May 15, 2026. The dividend is adequately covered and represents a payout of 77 of our first quarter normalized AFFO per share. And with that, we'll open up the lines for Q&A.
Operator
Thank you. We will now begin the question and answer session. If you would like to ask a question, please press star one in your telephone keypad. If you would like to withdraw your question, simply press star one again. Your first question comes from a line of John Kilikowski from Wells Fargo. Your line is open.
All right. Thanks for taking my question. Rick, really appreciate the opening remarks. It sounds like it was a great quarter all around on the shop side. We got the acquisitions done. Looking at the guide being held still here, what's the reason for the conservatism there? I understand that that's typical in one queue for you, but it sounds like things are working and I understand future acquisitions aren't considered, but, you know, what would it really take at this point to get to the lower midpoint?
So, yeah, we are typically conservative this early in the year, but all the trends are obviously going in the right direction. You see the yields that we're investing in. So, that looks good for us as well. So, it's really just kind of as simple as that. We'll reevaluate earnings, guidance rather for the second quarter.
Okay. And then on the opening remarks, you know, you have the 200 awarded. If you could talk to maybe a cadence of that closing and then beyond that, the 690, you know, if you think about deals historically that have been in that level of the funnel, what's been your historical rate of execution on those deals? Just trying to distill what, you know, what might be the final number that you execute on?
I'll make one comment and kick it over to Darren. The 200, from our perspective, will close. We don't have any doubt or concerns about the 200. Darren?
Yeah. So with respect to the 690, these are investment opportunities that we are actually pursuing. These include opportunities where we have submitted an initial LOI and are moving forward in the process. As far as the probability of success, it's hard to tell because it is a bit of a competitive environment, but we would expect to close on a fair number of that investment opportunity.
Yeah, you know, the volume is so high, John. There really hasn't been a precedent for this in terms of trying to be a little bit more predictive about what the percentage of deals will close on. But it'll be a good enough percentage that, as I said in my opening remarks, will exceed pretty materially how much we did last year.
Very helpful. Thanks, Rick.
Operator
Your next question comes from Alina Farrell-Granath from Bank of America. Your line is open.
Thank you so much. This is Farrell Graneth. I first wanted to ask about your pipeline also. What percentage of that are you sourcing off market or just through your relationships and what percentages through marketed deals?
Yeah, I don't have the exact percentages, but on the skilled nursing side, it's 100% off market through existing relationships. On the senior side, it's maybe, say, 20%. We do have existing relationships that bring us off-market deals. But the bulk of the pipeline that we have is marketed.
And I also just want to note on the Communicare sale, it's not indicative of us sort of aggressively looking to sell the skilled assets. This is a very unique situation where Communicare approached us wanting to exit Maryland, which is not an easy state. We actually had other buildings in Maryland that we Exodus several years ago. There's a lot of markets in Maryland that are over-bedded, so we are happy to work with Communicare on that. And Communicare is also one of our operators that we're doing some of these off-market things with.
Okay, thank you. And I also wanted to touch on the export growth that you highlighted, the 1.8 percent. Is that being driven just based on the operating leverage of where you are in your occupancy, or are there other puts and takes that are going into that number?
It's the operating leverage. So we should, we would expect it to continue at levels that low for the foreseeable future.
Operator
Your next question comes from the line of Austin Werschmidt from KeyBank. Your line is open.
Great. Thanks. Just within the shop portfolio, just wondering how you're feeling about the exit velocity and kind of leading indicators from March looking into kind of April and May. And I think you surpassed the one-year anniversary this month since transitioning the communities away from Holiday, which is sort of the latest update and trajectory for that portfolio?
Yeah, it's definitely getting better.
Yeah, you know, we're not disclosing the numbers on that, but it is progressing. We were also assessing, you probably noted that was a slight change in same store. So, and that's just a function of having had these new operators in that portfolio for a year now we've determined that a few of those assets are assets that we no longer want to be, want to retain in the portfolio.
Yeah, that's a helpful detail. And I guess, you know, how deep is the opportunity set for shop investments in that 8% yield range? And can you provide some characteristics just around the size, vintage of the facilities that you acquired in the first quarter, and as well as, you know, what's in that awarded pipeline?
Yeah, so there's definitely some cap rate pressure. Most of what we see on the market and the opportunities right now are in the 7% range, low sevens. What we closed on is IL, AL, and memory care, although it's more heavily weighted to AL and memory care. On the vintage, these are roughly 14 years old is the average age with With respect to the 690 that I mentioned, that has an average age of 8 and also low 7 percent for those that are more stable, but we are actually also looking at some slight value-add opportunities where there's lower occupancy but a clear line of sight to stabilization and some of those we're looking at will have initial yields in the 6s but should provide more meaningful IRRs with the upside opportunity.
And as you know, we focus on secondary markets, so we're not seeing the same level of cap rate compression in the secondary markets as you all see in the primary markets.
Operator
Your next question comes from a line of Juan Sanabria from BMO Capital Markets. Your line is open.
Just hoping you could talk a little bit more about those shop assets that you transitioned last year that you're now seems like looking to sell you know if you can comment on the book value or the expected proceeds and if you had not excluded those from the same store pool do you know what shop same store NOI would have been for the quarter on a year-over-year basis we're just we're just selling those right now um one so we're not we don't know what the outcome is going to be we're not disclosing any of that information at this point so um you know when a couple of quarters ago when we talked about the transition of that portfolio we did say that we'd be evaluating the viability of retaining all these assets going forward so that's just kind of a normal process and um but we're not breaking out all these different portfolios in terms of the individual growth of shop noi in these portfolios Just to confirm these were old or original holiday assets, is that fair? Yes, they are. Okay, great. It's three assets that we're selling and we brought another holiday asset into the same store that it's stabilized.
Great. And just to switch gears, I appreciate that. Thanks, Rick. Just on the behavioral, could you just give an update on Landmark that was in the press and any updated thoughts on how we should be thinking about the RCA loan?
Sure. And we always reserve the RCA question for you, Juan, just so you know, it's special. So on Landmark, we had been working with them, obviously, in the court system for an exit with those facilities. and we were able to we actually helped bring somebody in to buy a bunch of the assets the landmark team is buying some of the assets themselves so we were able to get a price that was actually pretty attractive from our perspective outside of that group of landmark assets we've got three others that we are in the process of selling as well so we'll have some more proceeds to add to the ones that you saw in the article. So, you know, as we've talked about, you know, that team did a really good job running that company for a while. And then they had those unfortunate incidents with resident deaths in Indiana and got shut down by the regulators. So just a bad turn for them. And we hung in for a while. But at this point, we felt it was better just to get out from under and on RCA our talks are continuing to progress and we it's possible we'll be in a position to make an announcement on that before our second quarter call and if that's the case we will do so but it's as I mentioned on the last call Deerfield it's their biggest investment they really believe in the portfolio and our talks are very constructive.
And was there any NOI or rent collective related to landmark flow into the first quarters? And should we think about that as, how should we think about, I guess, that going forward?
Yeah, there's somewhere around like a million and a half, I want to say, one in the first quarter that we collected on them. And we would expect that same run rate through whatever these assets ultimately transact.
Operator
Your next question comes from the line of Seth Berge from Citi. Your line is open.
Hi, thanks for taking my question. You mentioned in the prepared remarks from AI initiatives. Could you just kind of expand on some of those and how you're using AI within the platform and maybe talk a little bit about what differing treats kind of the Sabra platform from like an AI perspective versus some of the peers that are also competing in the shop and skilled businesses?
Yeah, so I'll take that one, Seth. So at a corporate level, as Darren mentioned, we've been leaning into automation and AI over the last several quarters. And primarily at the corporate level, it's been to speed up back office workflows and data processing, primarily in our shop portfolio. And at the same time, we're also advancing some initiatives that are going to further reduce manual processes and accelerate analysis. It's not the sexiest thing in the world. I'll be very, you know, I'm very cognizant of that. But it is very impactful, particularly as it improves how we interact with our operators, what kind of value we could give back to our operators in the form of data and insights. and it could have some really meaningful benefits, not only to us, but to our operators as well. And then as Rick mentioned, you know, we have pilots going on at the facility level that, you know, in addition to several prop tech solutions that have already been deployed, there's a whole bunch of other solutions like medical records and fall detection that are leveraging AI that are going to make operations more efficient and more importantly, improve resident care.
And then maybe just a little bit on kind of the deal flow and the opportunity set. What's kind of the mix between shop and field of the opportunity set? And are there any particular geographies you're looking at?
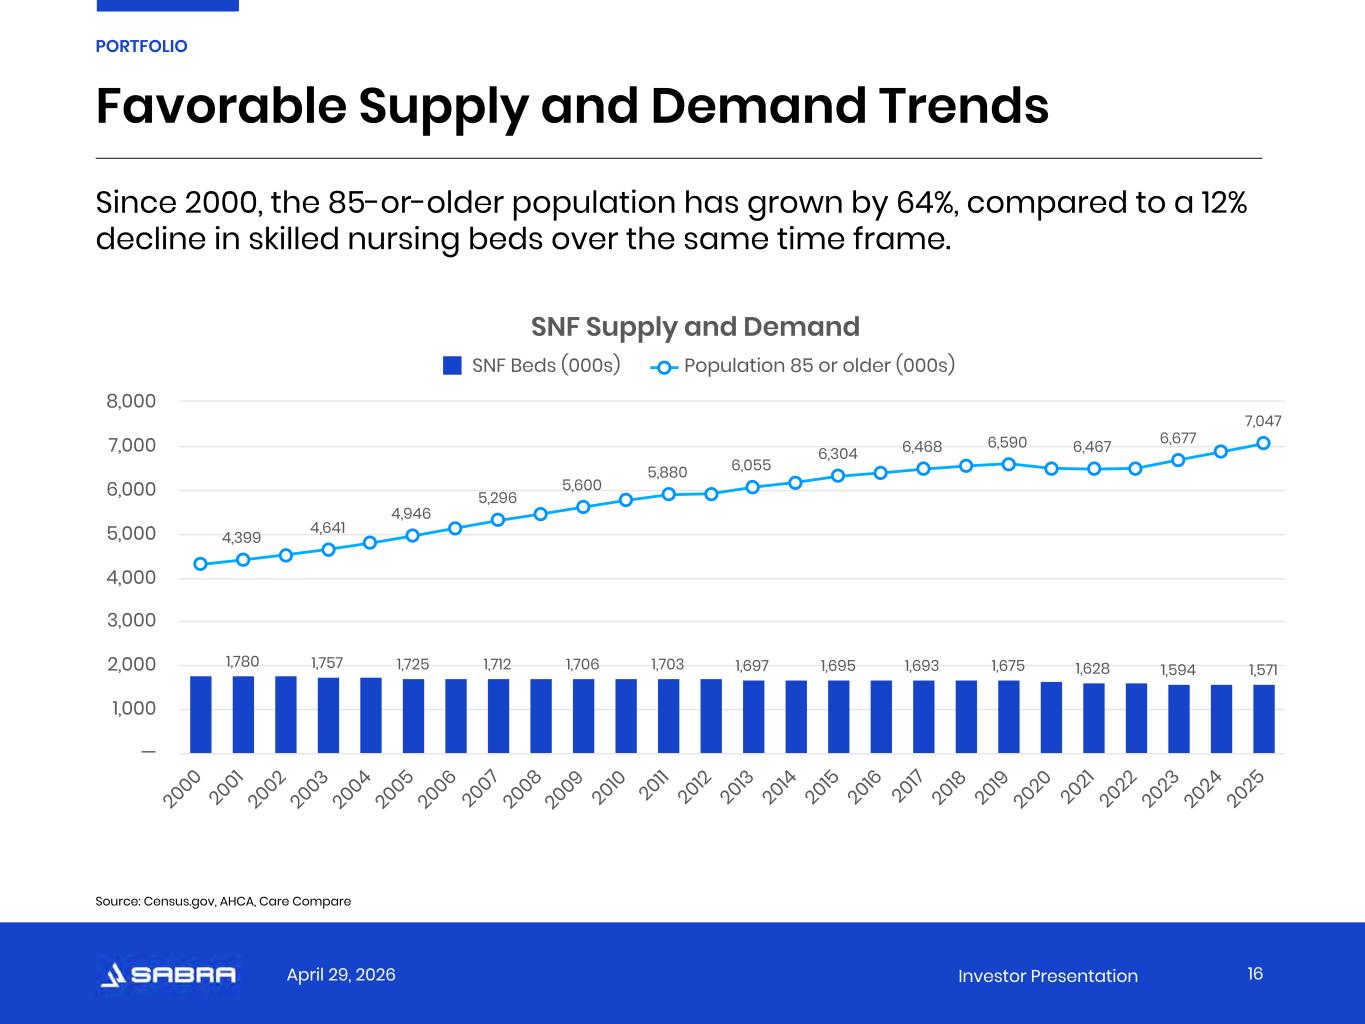
Nothing has really changed. It's still, I'd say, 95% plus shop is the opportunity set. The skilled nursing investments and the opportunities that we've announced were all done off-market with direct relationships. still don't see that much volume in the skilled space. And when you do, it's very heavily competitive. And the private groups tend to be able to pay up a little bit more.
Yeah, remember the private buyers that we're all up against are buying Opco and Propco. And they also are feeding ancillary businesses. So as a buyer of real estate, we just can't compete with that. And there's not enough volume out there. for everybody, to go around for everybody, as there is on shop, or there was on skill, if you go back to prior to the pandemic, when there was enough for everybody to go around. And at this point, we don't see that changing, at least for a while. I think a lot of it's just a function of a lot of these operators who don't have to sell, but really slammed during the pandemic, it had pretty huge losses. And now you've had a couple of years of some really good performance, and that performance will continue to improve. So I think for a lot of the operators out there that don't have to sell, that normally would put their assets on the market, they're just recouping and they're probably enjoying some really nice cash flow. That wasn't the case a few years ago. So maybe we'll see that change later on in the year or going into 2027, but it's a little hard to tell.
On the shop side, as far as the markets are concerned, we're still looking at secondary markets is the focus here. And as far as the volume is concerned, it's showing no signs of slowing whatsoever. In fact, it actually feels like it's picking up speed.
And we're geographically agnostic, though, in terms of what states will be in for either asset class.
Operator
Your next question comes from a line of Michael Stroyek from Green Street. Your line is open.
Thanks, and good morning. Maybe following up on that question and just going back to the strong pricing on the Communicare sale and your comments on not being able to compete as well in the SNF transaction market, I guess just what sort of yields or multiples are you seeing there on those marketed SNF deals and how different is that versus, you know, the typical, call it 9 to 10 percent lease yields we see in SNFs? there's not a lot of data out on that um it's a problem because they are all private they are all private deals and um so i don't really have a good answer for that darren i don't know if you've seen anything no i mean uh it's definitely a couple hundred basis points uh inside of of what the standard skilled nursing transaction would typically run at all right okay um and then And maybe going back to the behavioral health discussion, one of your peers had talked about labor being a challenge within that business. Are you experiencing a meaningfully tougher labor backdrop within behavioral health versus, call it, other areas of the portfolio?
No, not at all. I'm a little bit surprised to hear that. We haven't seen that at all in our portfolio.
Understood. Thanks for the time.
Operator
Your next question comes from a line of Alec Fagan from Baird. Your line is open.
Hey, thanks for taking my question. Can you maybe comment on how the opportunity set of funding for development and redevelopment projects have trended? And do you expect this to be a bigger part of your investment activity going forward?
As far as the developments, we still see a fair amount of development opportunities that come in. I would say of those development opportunities that come in, maybe 10% pencil, you're still having, and basically when I say pencil, always looking for a stabilized return on cost on the development to be 200 to 250 basis points wider than the current market cap rate equivalent, maybe only 10% of those. I do expect that it's going to pick up, but not meaningfully for some period of time. and can you comment are these development opportunities also in the secondary market or i guess tertiary markets secondary markets yeah so the one prep equity um development that we announced is in uh it's in indiana it's about uh and then the other one is a actually it's a redevelopment of a former sniff property that was shut down and we're redeveloping that into a senior housing property, and that's in Kentucky.
Got it. Thanks for the time.
Operator
Your next question comes from a line of Vikram Malhotra from Mizuho Securities. Your line is open.
Thanks for seeing the question. I guess I just want to go back to the question on the guide. Just the cadence of FFO or ASFO, you just take your quarterly number and, you know, just multiplied by four, you're very, very easily in the range. So I'm just wondering, is there a one-time item? Is there maybe this loan that you've got baked in? Any other asset transition or say, like, how should we, you know, what should we infer is a pretty steady number? So I'm just, if you can go back and give us any more color on, like, what are there other puts and takes for the year that we should be modeling?
Yeah, so as you rightly pointed out, if you take our first quarter results and you annualize them, they're right at, or if you do it on actual dollars and run the math out, you're probably just slightly below where our midpoint is. So there's that data point. I think the other data point is we guided towards low to mid-teen, same-store NOI growth in our shop portfolio, and we came at 14, so right in the middle of that range as well. And as we talked about, you know, many times before, the biggest driver of where we end up landing on an earnings perspective, especially relative to our guidance range, is going to be dictated by our shop and wide growth. So given that our current quarter earnings are right at the midpoint or even slightly below the midpoint, given that our shop growth is right where we guided for the full year, you know, and we reaffirmed our guidance. Let's not lose sight of that. We reaffirmed the guidance that we put out. We still feel, as we say here today, two months after we put out our initial guidance, that reaffirming where we stand or where we put out previously still makes sense. As Rick mentioned, we've historically taken the approach that in Q1, we're not going to generally revisit guidance unless there's some material change one way or another. There hasn't been. And we're going to reevaluate it in Q2 as we have a better line of sight into what the shop growth is going to look like for the year and as our investment pipeline takes greater form.
And we totally get the questions, particularly since some of our peers raised guidance in some form or fashion over this past week. So, you know, we totally get it. We like the trends we're seeing, as I said earlier. We like the volume that we're seeing, and we like the yields we're getting things done in. So we'll see how it goes.
Okay. And then, I mean, I'm not reading into the Communicare pricing, but in general, there seems to be downward pressure on cap rates for SNFs given, especially this hope to improve the operations. So I'm wondering, is there an opportunity for you to, given your desire for SHOP, to do a bigger portfolio sale in SNFs and reach 500 million, a billion, and recycle that into SHOP?
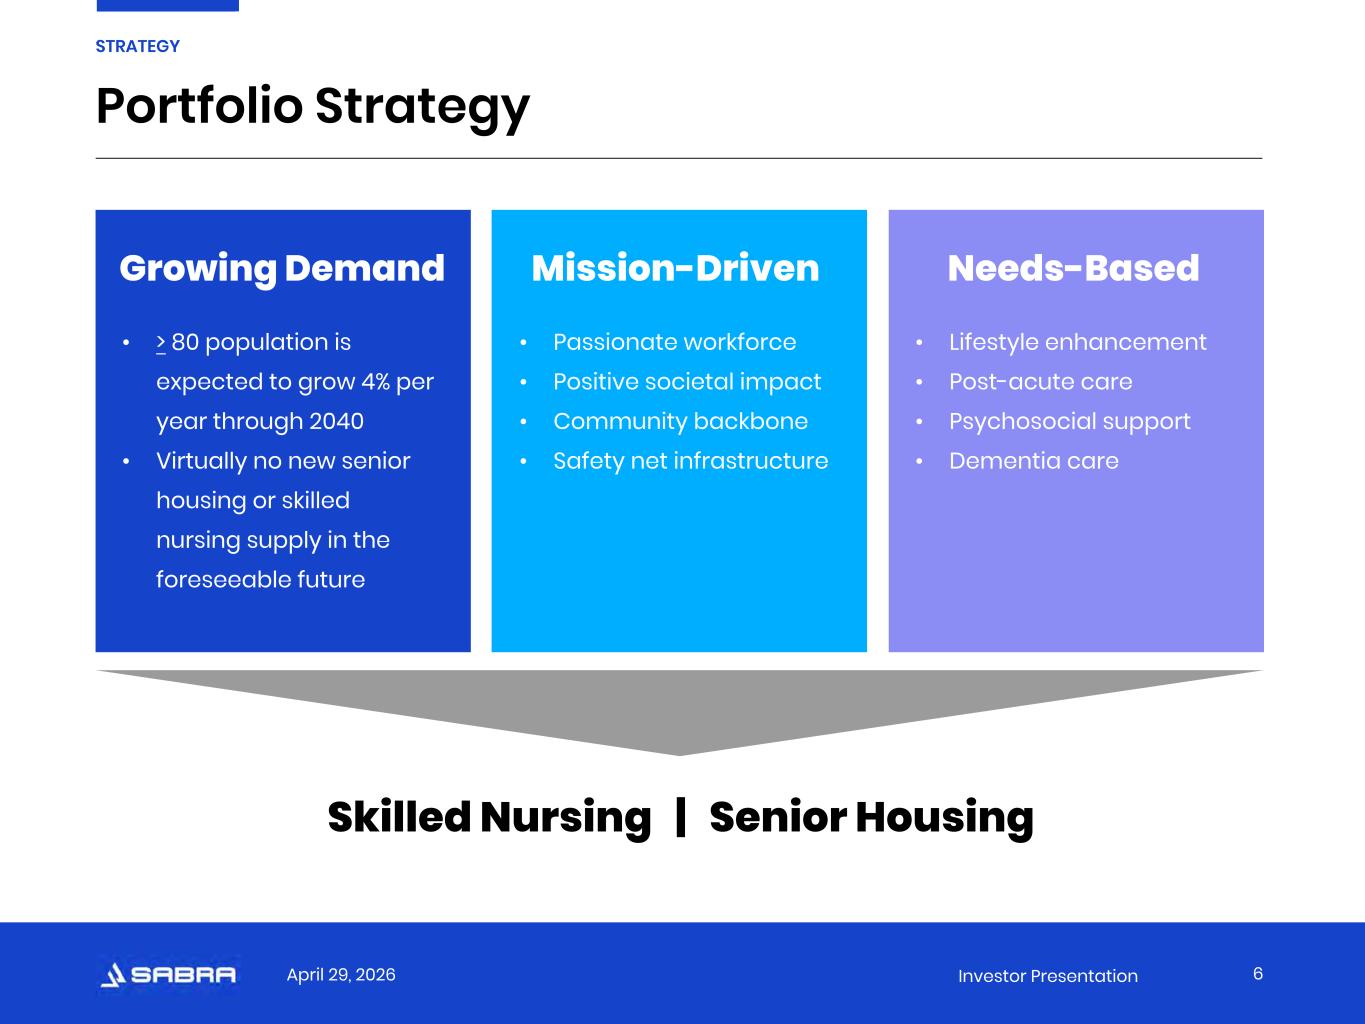
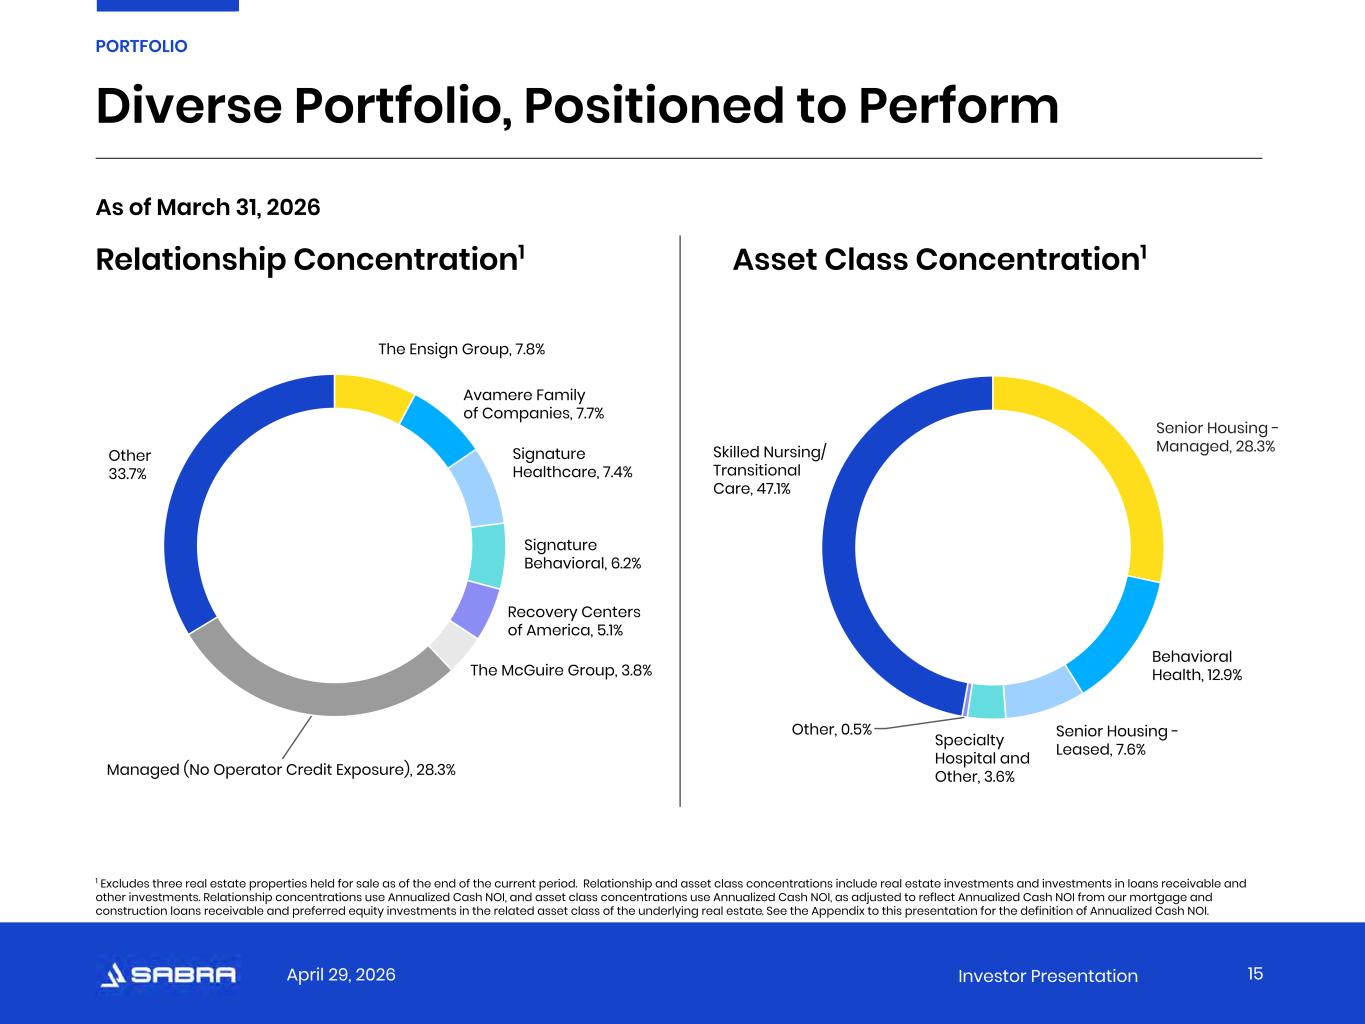
Well, I'm not sure there's downward pressure on cap rates because of the private buyers. the REITs are pretty disciplined about holding firm on the cap rates that we've historically acquired SNFs at. But we like the fact that we've got a very strong triple net skilled nursing portfolio. We're at all-time highs on rent coverage. We're at all-time highs on margins. Occupancy continues to grow, so there's still upside there. And it's something, it's a base that we have that everybody can depend on. And then the shop side of it, which gets bigger and bigger for us, obviously provides more outsized earnings growth. So we like having that balance. And our portfolio today is better balanced than it's ever been. For us to pass the 50% mark on private pay revenues is a material change. We started out as a 96% skill read. So we've evolved quite a bit, but we're not going to sell portfolios that we think are really good just to shift the percentages of shop. We've got plenty of access to capital. We have plenty of liquidity available to invest in all the shop opportunities that we have ahead of us. Okay.
And then if I can just clarify, Rick, I think you said the Canadian portfolio is 93. You think it's essentially full, but I guess in this environment, a lot of folks are talking about 95 plus. So, you know, is 93 sort of the peak for the Canadian portfolio in absolute?
No, no, not necessarily. I just think when you start to get to the mid-90s, you'll have some ups and downs. But look, we have a facility up there that's 100% almost all the time. That's unusual, you know, but it happens. So I think it's important to focus on, I think we had a 270 basis point year-over-year growth in that Canadian portfolio. So, yeah, we expect occupancy to continue to trend up there, but it's not going to be sort of the same, at the same velocity as if it was still, you know, 86% or 85%. Okay, thank you. Yeah.
Your next question comes from a line of richard anderson from cantor fitzgerald your line is open thanks good morning um on communicare um you're selling or sold omega is selling i think to communicare if that's correct me if i'm wrong about that um and if i'm no that's not right that's not right okay excuse me it's not right no okay um in their case i believe that's the case but both maryland i'm just curious, is there any dotted line between what Omega is doing and what you're doing that you could share on, you know, Communicare, and if there's some sort of trend that we can draw from both of those transactions?
I don't really think so. I mean, they were hoping to get cooperation from both us and Omega, and they just really wanted to exit a state that was a really, really tough state for them. They thought it would strengthen their portfolio overall and um and we're seeing seeing that as a result and when they first called us i mean it resonated with us because i said as i said earlier um we shed facilities in maryland several years ago um it's you know it's just tough there so um yeah but i don't think there's any trend here or anything like that communicator still wants to grow um or as i said earlier we're seeing some growth with them. Omega may or may not be as well. So yeah, but no dotted lines or anything like that other than we think the Omega team's a great team.
Okay. Fair enough. Rick, no guidance update, which is fine with me, but also no change to your target shop, I think it's 40% as of last quarter. Let's say you bite into this 690 million to a certain degree between now and three months from now. Are you closing in on 40%? And might we have an update on a new target for shop this time in three months?
Well, we will be closing. I mean, if we say we're to do a billion this year, we definitely are going to be in pretty in shape in terms of the 40%, but then we'll just set a higher target. So, you know, as I said earlier, we're not going to shed any sort of major skilled portfolios, but there's always some stuff that you sell. So between some of that, which is probably incremental around the margin and almost all of our investment activity being on shop, you're just going to continue to see skill being a smaller percentage of the portfolio and shop continuing to grow but we don't have any any sort of guardrails or anything about how much we want to do and shop and as you know because we've been doing shop for over 10 years and with all the improvements we're making in the existing platform with our ai initiatives we're going to be more our platforms could be more scalable than it's ever been. We'll be able to continue to grow our shop exposure, and the amount of infrastructure we'll have to add as a result of that will be lower than it normally would have been in the absence of the AI initiatives.
Okay, great. And last for me, and this is just more of a theoretical sort of big picture question, but obviously a lot of your peers are taking a shop on goal, i guess they'll say it that way and um and you know a lot you know kind of working in individual silos um it seems to me that you know it you guys have been doing it for a while so it's not a conversation about sabra in particular but what do you think about the potential that there'll be some sort of combination activity to attack the shop opportunity um you know uh it seems like it makes sense. It's a business that requires scale and, you know, some of the things that you're doing. I'm just curious if you could comment on that at all, you know, just generally.
Rich, are you talking about M&A activity with the roof?
So, look, we all know there are too many of us now with everybody jumping on the shop bandwagon like it's, you know, a new form of breakfast cereal or something that everybody likes better now. I mean, we, the only concern I have, and look, there's a lot of mutual respect in our space between all of our teams. We all know each other really well. We hang together when we have the opportunity, but, and there's plenty to go around. I just hope people are prudent in making sure they have the infrastructure in place to support the operators and to assess the quality of deals that are being looked at. This is much, much different than a triple net business. And I think for us, we've been able to be successful, not just because we've been doing it for a long time, but as you know, and I think most others do, Rich, our entire asset management team are operators. So the transition for them to work with, to transition from working with triple net to shop really wasn't that difficult. So you get a little bit concerned about missteps with everybody and their brother jumping into it, and hopefully that won't be the case. But as far as M&A activity, yeah, I mean, you're right. There should be some M&A activity. But it seems like that's hard to make happen in REIT world.
Yeah, fair enough. Okay, thanks very much.
Operator
Your next question comes from the line of Michael Goldsmith from UBS. Your line is open.
Good afternoon. Thanks a lot for taking my question. Maybe first, can you comment on the Medicare rate proposal for 2027 of 2.4 percent? Maybe we can get your high-level outlook on Medicare and Medicaid and just the overall health of reimbursement.
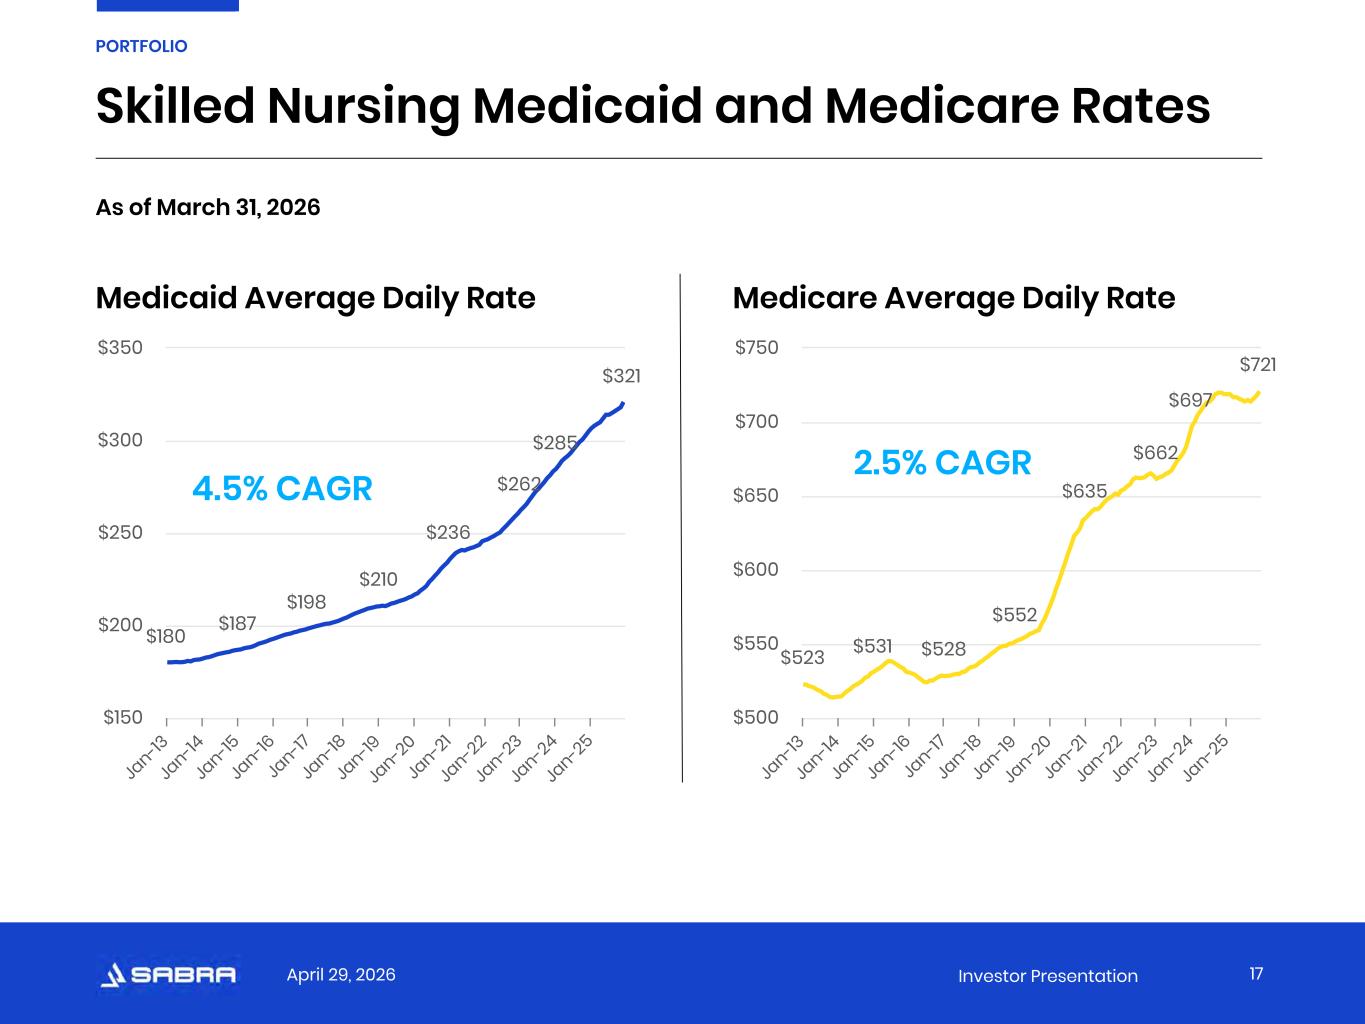
Sure. So, I'll give myself a little credit because I did predict that the Medicare market basket would have a two-handle, and I predict that the Medicaid rate increases and the aggregate will have a three-handle. So it really did meet our expectations. But the other thing that we've talked about is coming off of the pandemic and the really extraordinarily high inflation that we saw during the pandemic, everything's normalizing. And we should expect to see rates both on the Medicaid and the Medicare side revert back to the historical norm before the pandemic. So that's really what we're seeing. I think Medicare and Medicaid rates peaked in 2024. They were still really healthy last year, but we did see them come down quite a bit last year. So it's all formulaic, so it's pretty normal stuff. So while you can't predict the exact number, you know, the trend is going to be pretty apparent.
Got it. Thanks for that. And then just doing a little math, which can always be a little bit of a dangerous thing, But, you know, from your occupancy and unit numbers in the sub unit, we estimate your non-same sort of shop occupancy is in the high 70s percent. So, I was wondering if you could write a little bit of color into the types of shop assets you've been accumulating over the past year. It looks like these have been unstabilized with a little bit of occupancy upside. And, you know, if you could talk about, like, what market the assets are in and the unit mix, that would be helpful.
Yeah, so the total just in the entire overall senior housing managed portfolio for the quarter ended, I think the occupancy for the entire portfolio is 85.6%. As far as the assets we've been acquiring, we've been acquiring assets in the upper mid, I'd say upper 80s to the low 90s percent occupancy. So I'm not sure. I'd like to see that 70% math.
All right. Where are you getting that from, Michael?
We ran some numbers based on what we saw in this up, but we'll take another look at it or catch up offline. But maybe just to round it out, when do you expect some of these AI initiatives to translate to measurable financial outcomes like a lower G&A or higher margins or better asset level decision making?
Yeah, I mean, from a G&A perspective, you know, I wouldn't expect there to be a ton of G&A savings. What is going to be more impactful from a G&A perspective, it'll slow down the ramp of G&A as we grow. I think that's the right way to look at it. And that's going to be incremental and ongoing as we speak, right, because we're in the middle of a lot of these initiatives. And as they continue to be implemented, we're going to see the real benefits to how we operate and how we scale as a company. Additionally, as we continue to roll out this information to our operators and give them better insights into their own businesses and help them operate their facilities better, there will be, we firmly believe there's going to be a tangible improvement in their performance. When that's going to be, how quickly that's going to be, it's hard to tell at this point.
And it's also going to make it easier for us to absorb the increased level of volume on investments that we're seeing. We do have some 90-day milestones in place, so we'll start to see some benefits in the near term with the initiatives that we have.
Thank you very much. Good luck in the second quarter. Thank you.
Operator
Your next question comes from a line of Ometeo Oksena from Deutsche Bank. Your line is open. Ometeo, your line is open.
Good morning out there. I wanted to continue along the lines of the Medicare-Medicaid questions and get your thoughts around CMS's increased focus on these value-based care programs on the Medicare Advantage side. I'm kind of curious, what are you hearing from your operators about how it's impacting like a referral rate, some hospitals, or are they potentially kind of changing their business and how they're kind of responding to it?
Sure. Thanks, Kyle. So we're not seeing that much impact yet, but we are really bullish on value-based care. And we are working with our operators. Some operators are already pursuing it. They already have agreements in place. There's sort of different levels that you can do with the insurers. You can have arrangements with ACOs. There's a lot of different levels of arrangements that you can have with value-based care that have different levels of risk, starting with upside but no downside. And then as they get better and better, they'll take on some downside risk, but they'll have more upside risk. So we think it's a really big deal. We think it's great for the space because we know our operators can take care of patients that are being cared for in much higher cost settings, like LTAPs or like rehab hospitals, with really good outcomes. In fact, a few weeks ago, last month, we had our operators conference, and value-based care was the central topic for the conference, and just a lot of excitement from our operators on it. And there's also similar opportunities for senior living as well. It isn't just skilled. So there's maybe more there for skill, but there's opportunities there with the insurers and with ACOs particularly on the senior housing side as well. So we were able to talk about initiatives, and we had some great speakers coming in and gave great examples. In fact, one of our board members, Lynn Katzman, who runs a senior living company called Juniper is probably front and center further ahead on those kind of initiatives with AL and memory care than anybody else in the space. So her expertise has been great as well. So, yeah, really excited about that.
Gotcha. So I guess how do we kind of juxtapose that versus comments coming out, you know, for example, during this earnings season? when some of the hospital names are saying, you know, it's helping them reduce referrals to skilled nursing and things of that like?
I think it's just a function. Are you going to embrace what's inevitable and coming down the line and make sure that you've got the clinical products in place to take advantage of that? And then you'll have increased referrals. So, you know, I think, I just think you have to be really forward thinking on this. And we've got a number of operators who are. And as I mentioned, we've got operators who have already embraced this and made inroads into it. And they're doing well with it. So I think if you have operators out there that are more passive, then yeah, it's not going to kind of go your way. Because as more and more time goes by, those insurers, the ACOs are going to have more opportunities to divert patients to operators that are really embracing these opportunities thank you very much yeah again if you'd like to ask a question press star one in your telephone keypad your next question comes from the line of austin werschmidt from keybank your line is open great thanks for taking the follow-up um i just want to go back to something to make sure i understand some of the components of guidance with the one and a half million of income received from Landmark in the first quarter.
Was that contemplated in initial guidance, or is that a source of upside when you go and reevaluate guidance in the coming quarters? And then, I guess, is it appropriate to annualize the first quarter number given your plan to sell those assets?
So, to answer your first question, the 1.5 was included in our original guidance. Now, in terms of annualizing that, yeah, I mean, that's something that's going to go away at some point this year, you know, probably, I would say probably end of the second quarter is probably when we would realistically think that would go away, but, you know, it could slip as well. But it isn't something we expect to have in there for the entire 12 months, if that's what you're asking.
Yeah, no, that's helpful.
Thank you okay and that concludes our question and answer session i will now turn the call back over to rick matros for closing remarks thanks everybody for your time today and your continuing support and um we'll look forward to seeing a lot of you at the wells conference and at nary in june thanks very much have a great day and for any moms that are on the call happy mother's day this concludes today's conference call thank you for your participation you may now disconnect.