Operator
Good day, everyone. My name is Abby, and I will be your conference operator today. At this time, I would like to welcome everyone to the SABRA fourth quarter 2025 earnings call. All lines have been placed on mute to prevent any background noise. After the speaker's remarks, there will be a question and answer session. If you would like to ask a question during that time, simply press star followed by the number one on your telephone keypad. If you would like to withdraw your question, press star one a second time. I would now like to turn the call over to Lucas Hartwich, Executive Vice President of Finance. Please go ahead, Mr. Hartwich.
Thank you and good morning. Before we begin, I want to remind you that we will be making forward-looking statements in our comments and in response to your questions concerning our expectations regarding our future financial position and results of operations, including our earnings guidance for 2026 and our expectations regarding our tenants and operators, and our expectations regarding our acquisition, disposition, and investment plans. These forward-looking statements are based on management's current expectations and are subject to risks and uncertainties that could cause actual results to differ materially, including the risks listed in our Form 10-K for the year ended December 31st, 2025, as well as in our earnings press release included as Exhibit 99.1 to the Form 8K we furnished to the SEC yesterday. We undertake no obligation to update our forward-looking statements to reflect subsequent events or circumstances, and you should not assume later in the quarter that the comments we make today are still valid. In addition, references will be made during this call to non-GAAP financial results. Investors are encouraged to review these non-GAAP financial measures as well as the explanation and reconciliation of these measures to the comparable gap results included on the financials page of the investor section of our website at sabrahhealth.com. Our Form 10-K earnings release and supplement can also be accessed in the investor section of our website. And with that, let me turn the call over to Rick Natros, CEO, President and Chair of Sabra Healthcare REIT.
Thanks, Lucas. Happy Friday the 13th, everybody. So, Sabra's NOI growth for the SHOP portfolio, excluding our transition facilities, is expected to be sturdy in 2026 as it has been in 2025, and we expect the transition facilities as they continue to improve to add to the overall growth in our SHOP performance. Our guidance at 4.9% and 5.4% growth at the midpoint for normalized FFO and normalized AFFO, respectively, reflects continuing execution of our strategy. Our pipeline continues to be robust. We completed approximately $450 million in investments for 2025. We had discussed on our last call exceeding $500 million. A couple of those deals fell over into 2026, but no deals fell out. So we're closing on everything that we said we would close on on our last call. Our investment activity has grown $200 million since our last call, and we're currently in the process of closing $240 million of awarded deals, most of which will close in Q1 and early Q2. Our expectation is that we will materially exceed the volume of 2025 investments and are clearly up to a strong start in 2026. Moving on to our operational results, they continue to be impressive. Our shop operational performance showed strong occupancy gains and increased cash NOI margins. Our same-store senior housing also showed occupancy gains and margin improvement. Our same-store senior housing, TripleNet, showed improved occupancy and maintained high rent coverage. The skilled nursing portfolio again showed increased rent coverage, hitting an all-time high, as well as increased occupancy. And our top 10 TripleNet relationships also had another strong showing. Our leverage stayed steady at our current target of five times, and the regulatory environment remains stable. And with that, I'll turn the call over to Darren for detail on our senior housing portfolio.
Thank you, Rick. Sabra's managed senior housing portfolio had another solid quarter with continued growth. The total managed portfolio, including non-stabilized communities and joint venture assets at share, had sequential revenue growth of 15.8%, cash NOI growth of 18.4%, with margin expansion of 60 basis points. These statistics demonstrate sequential improvement in operating results that reflect the continued growth and strong performance in Sabra's senior housing portfolio. During the quarter, Sabra invested over $150 million, adding four properties to Sabra's managed portfolio, bringing total year investments to roughly $450 million with an estimated initial cash yield of seven and a half percent and an average age of less than 10 years. Additionally, Sauber closed on $27 million of additional managed senior housing assets subsequent to year end and has another $220 million of awarded senior housing and $20 million of awarded skilled nursing investments, most of which should close in the first quarter or early second quarter. Deal flow shows no signs of slowing, and despite increased interest in the sector, Sabra remains competitive on new investments. Moving on to the same-store portfolio. Sabra's same-store managed senior housing portfolio, including joint venture assets at share, continued its strong performance in the fourth quarter. The key numbers are revenue for the quarter grew 6.4% year-over-year with our Canadian communities growing revenue by 10% in the same period. Fourth quarter occupancy in our same store portfolio was up 160 basis points to 87.9% year over year. Notably, our domestic portfolio occupancy increased 80 basis points to 84.7% during that period, while our Canadian portfolio grew 300 basis points to 94.2% in the same period, marking the seventh consecutive quarter where occupancy was over 90%. Rev4 in the fourth quarter 2025 continued to rise with an increase of 4.2% year-over-year, with our Canadian portfolio increasing 5.2% in the same period. While Rev4 and occupancy continued to grow, Expor increased only 1.6% for the same period, providing for cash NOI growth of 12.6% on a year-over-year basis. With industry tailwinds at our backs and a very robust pipeline, we should continue to see both organic and external growth in our portfolio. Our net leased senior housing portfolio continues to do well with continued strong rent coverage reflecting the underlying operational recovery. And with that, I will turn the call over to Michael Costa, Soberts Chief Financial Officer.
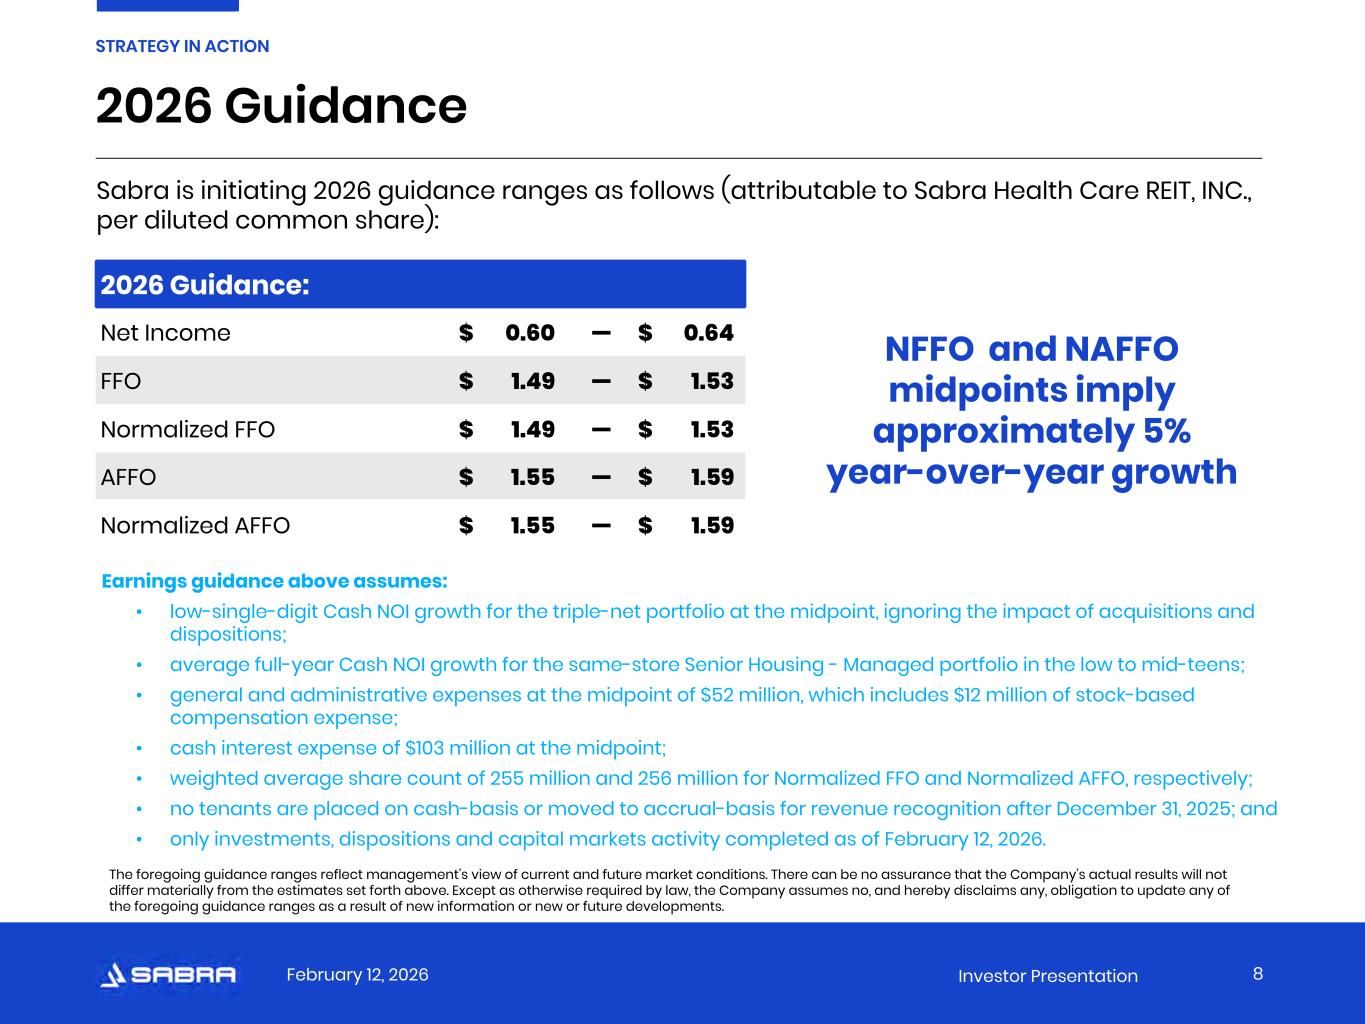
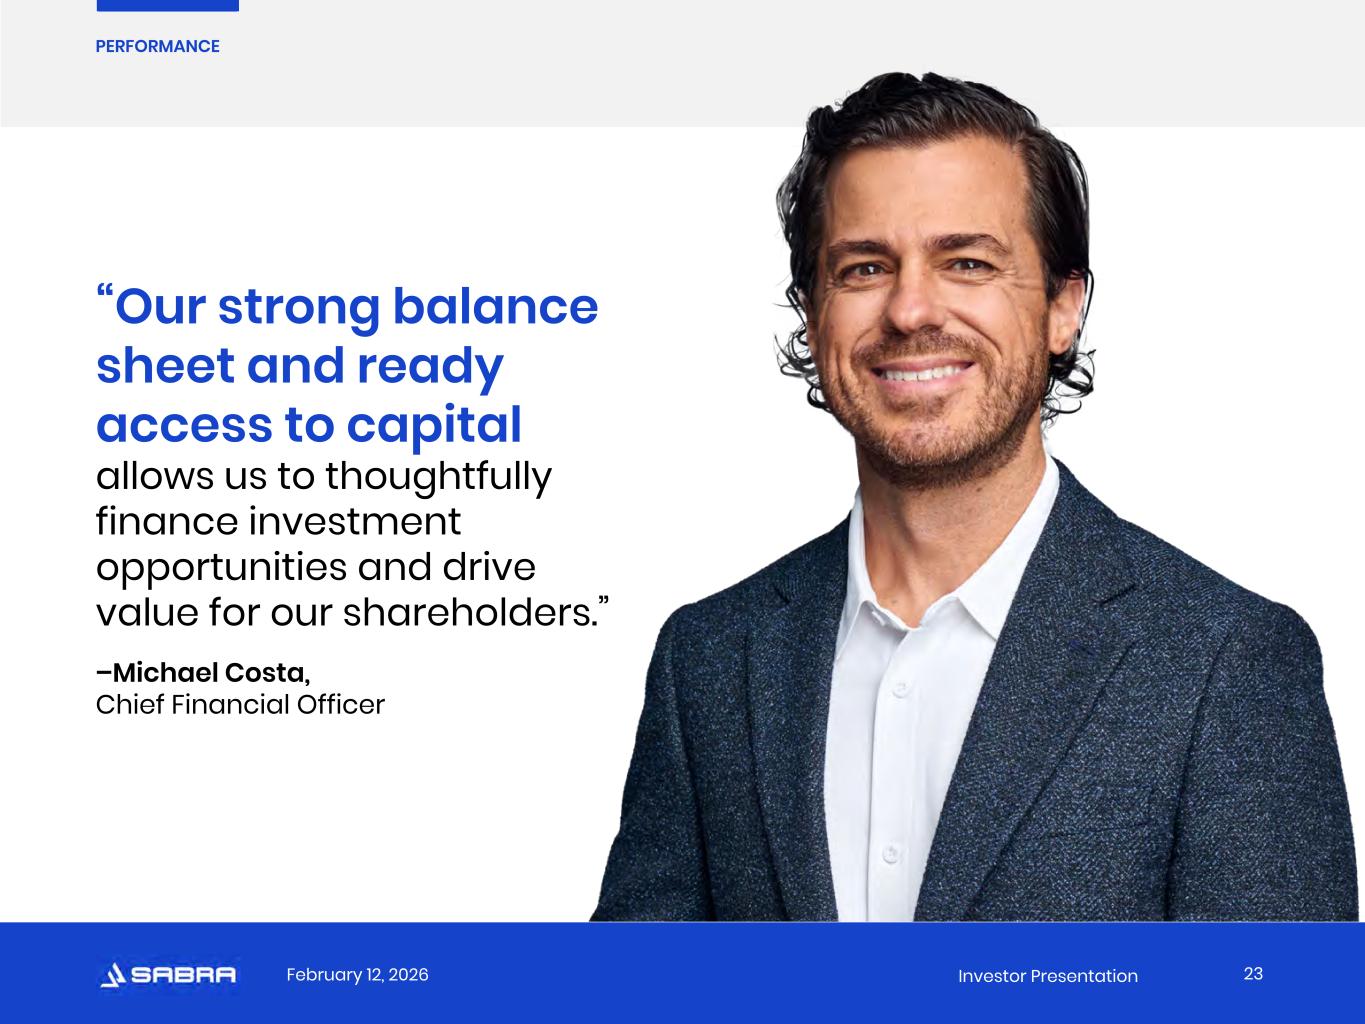
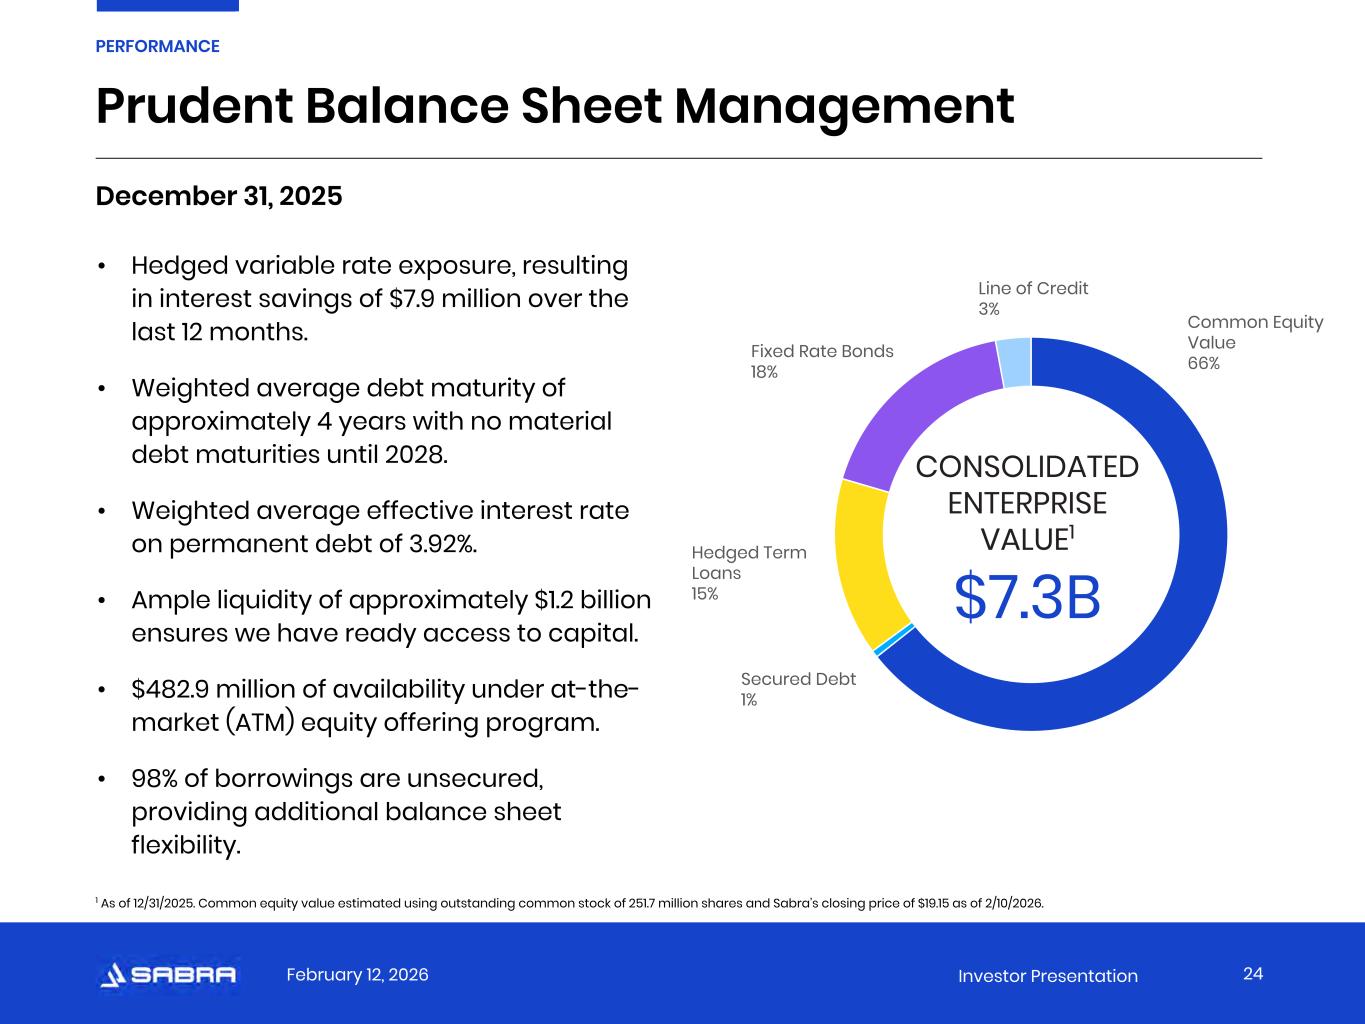
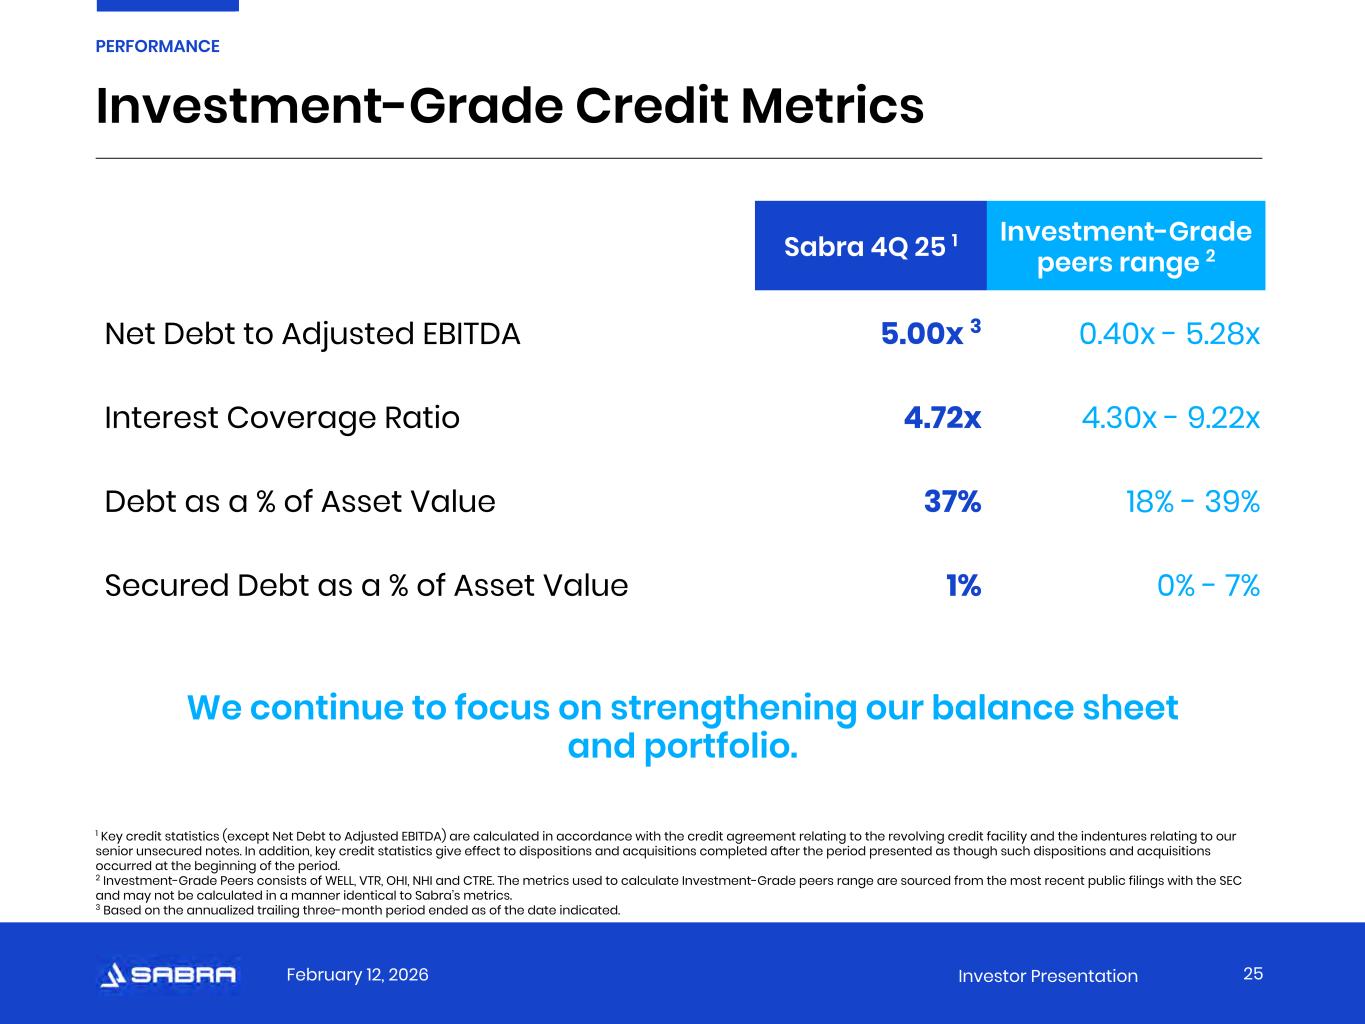
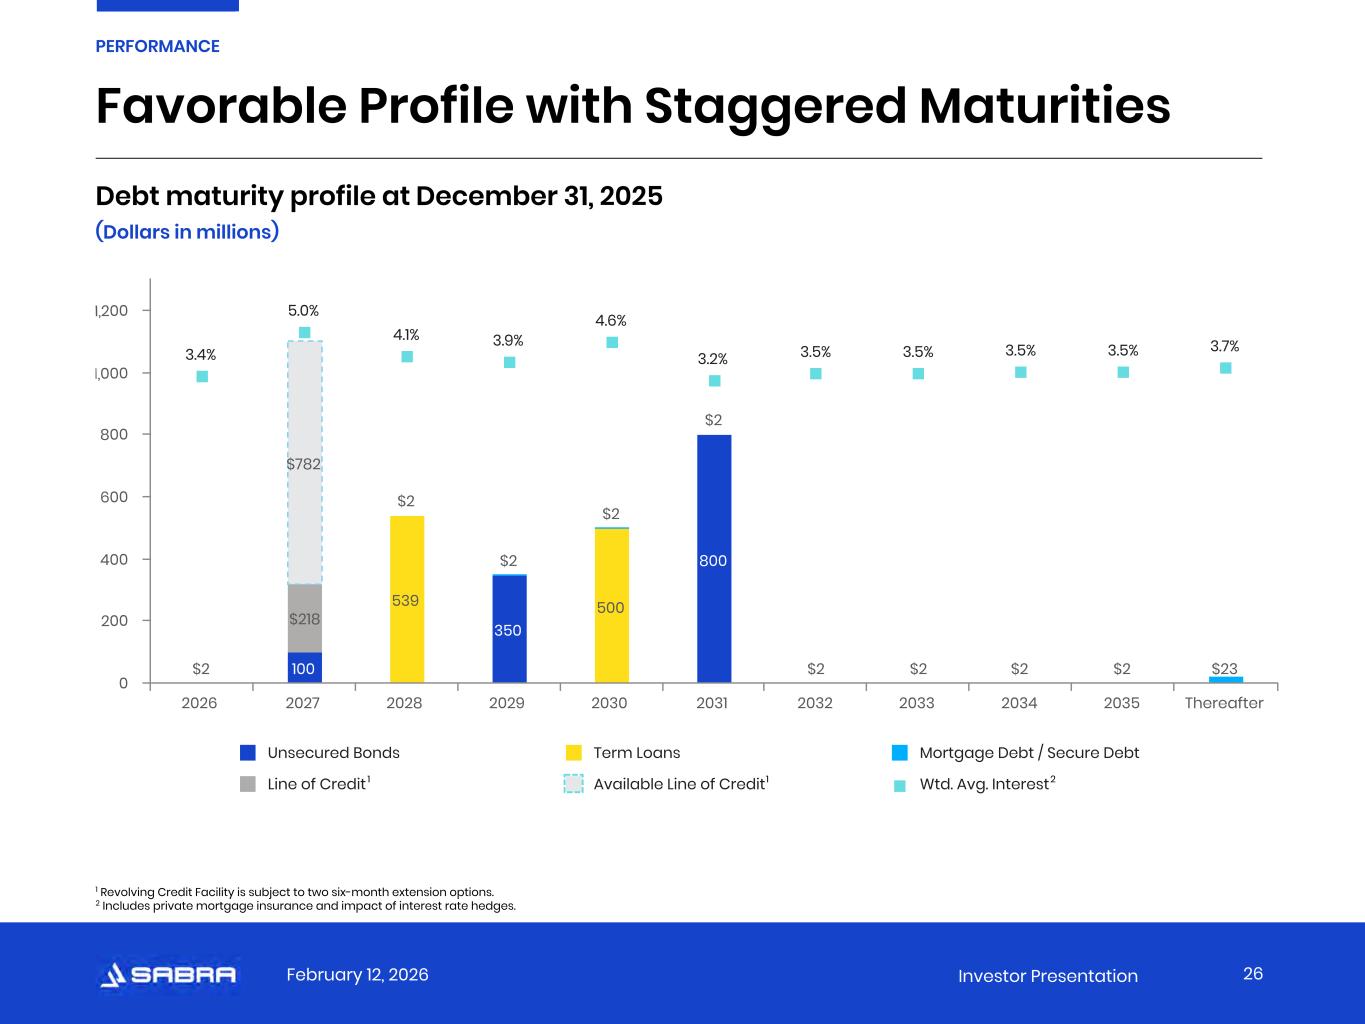
Thanks, Aaron. For the fourth quarter of 2025, we recognize normalized FFO per share of 36 cents and normalized AFFO per share of 38 cents. In absolute dollars, normalized FFO and normalized AFFO totaled $91.2 million and $95.2 million this quarter, respectively. Cash NOI from our triple net portfolio decreased $1.3 million from the third quarter, while cash NOI from our managed senior housing portfolio increased $5.5 million for a net sequential increase of $4.2 million. As noted last quarter, we transitioned four previously triple net leased senior housing facilities to our managed senior housing portfolio during the third quarter, which accounted for the $1.3 million sequential decrease in triple net cash NOI from the third quarter to the fourth quarter. Cash NOI from our managed senior housing portfolio totaled $35.6 million for the quarter compared to $30.1 million for the last quarter. This $5.5 million increase was primarily the result of investment activity completed during the third and fourth quarters together with sequential growth in our same store portfolio. Interest in other income was $10.6 million for the quarter compared to $12.7 million last quarter. This decrease was primarily due to $2.8 million of lease termination income recognized last quarter and backed out of normalized FFO and normalized AFFO. Cash interest expense was $26.6 million, which is consistent with last quarter. Cash G&A was $12.5 million this quarter compared to $9.1 million last quarter. The increase of $3.3 million was primarily due to truing a performance-based compensation compensation expense for the year as a result of hitting certain performance targets. Normalizing for the portion of this adjustment that related to prior periods, cash G&A was $10.6 million for this quarter. As noted in our earnings release, we have introduced 2026 earnings guidance, which I will discuss in further detail. Our full year 2026 guidance on a diluted per share basis is as follows. net income $0.60 to $0.64, FFO and normalized FFO $1.49 to $1.53, AFFO and normalized FFO $1.55 to $1.59. At the midpoint, we expect both normalized FFO per share and normalized AFFO per share to increase approximately 5% over 2025. As a reminder, our guidance does not assume any 2026 investment disposition or capital markets activities that have not yet been completed. There are a few other important assumptions built into our guidance that I would like to point out. Cash NOI growth for our triple net portfolio is expected to be low single digit at the midpoint in line with contractual escalators. Additionally, our guidance assumes no additional tenants are placed on cash basis or move to accrual basis for revenue recognition. Average full-year cash NOI growth for our same-store managed senior housing portfolio is expected to be in the low to mid-teens. General and administrative expense at the midpoint is expected to be approximately $52 million, which includes $12 million of stock-based compensation expense. Cash interest expense is expected to be $103 million at the midpoint. The weighted average share count assumed in our guidance is approximately $255 million and $256 million for normalized FFO and normalized AFO respectively and is in line with our fourth quarter weighted average share count after adjusting for the timing of ATM share issuances during the fourth quarter. Now briefly turning to the balance sheet, our net debt to adjusted EBITDA ratio was 5.00 times as of December 31st, 2025, in line with our targeted leverage and a decrease of 0.27 times from December 31st, 2024. As of December 31st, 2025, the cost of our permanent debt was 3.92% and the weighted average remaining term on our debt was 4.2 years, with the next material maturity being in 2028. Additionally, we have no floating rate debt exposure in our permanent capital stack, with the only floating rate debt being borrowings under our revolving credit facility. We have continued to proactively use the forward feature under our ATM to issue equity when prices present an opportunity to lock in attractive cost of capital to fund our active pipeline of deals. During the quarter, we issued $206 million on a forward basis at an average price of $18.79 per share after commissions, and in total, we currently have $322.7 million outstanding under forward contracts at an average price of $18.60 per share after commissions. We also settled $40 million of outstanding forward contracts to fund this quarter's investment activity. We expect to use the proceeds from the outstanding forward contracts to close on the investments we have been awarded and do so on a leverage neutral basis. As of December 31st, 2025, we're in compliance with all of our debt covenants and have ample liquidity of approximately $1.2 billion, consisting of unrestricted cash and cash equivalents of $71.5 million, available borrowings under our revolving credit facility of $782.4 million and the $322.7 million outstanding under Ford sales agreements under our ATM program. As of December 31, 2025, we also had $483 million available under the ATM program. Finally, on February 2, 2026, Software's Board of Directors declared a quarterly cash dividend of 30 cents per common share of stock. The dividend will be paid on February 27, 2026 to common stockholders of record as of close of business on February 13, 2026. The dividend is adequately covered and represents a payout of 79% of our fourth quarter normalized AFFO per share. And with that, we'll open up the lines for Q&A.
Operator
Thank you. And at this time, I would like to remind everyone in order to ask a question, press star and then the number one on your telephone keypad. We'll pause for just a moment to compile the Q&A roster. And our first question comes from the line of John Kilikowski with Wells Fargo. Your line is open.
Hi. Thanks for taking the question. Maybe you're starting on the building blocks of your same store growth. I know you don't give specifics, but maybe you could help us think about it in relation to what you accomplished in 25 from a Rev4 export and occupancy perspective. And then maybe just as we look forward to 27, 28, how does the success that you're achieving today make you feel about the long-term growth prospects of this business given the supply demand profile that you're facing?
Yeah, I'll take your first question, John, with regards that I'm assuming you're referring to our 2026 same-store guidance, correct?
So, I mean, the main building blocks are, you know, we expect to see continued occupancy growth in our same-store portfolio. We closed, you know, fourth quarter just under 88%, and, you know, we fully expect our portfolio to get into the low 90s. So that is one of the key building blocks in our guidance. We do expect there to be, you know, some rate growth probably, you know, along the lines of what we've seen this last year, you know, in low single digit rate growth and potentially more. On the expense side, especially since these assets in that pool are approaching kind of that 90% occupancy level, the overall expense growth should be inflationary, right, or somewhere in line with inflation. There's not a lot of incremental expense that's going to be added on as they keep pushing past that 90% occupancy level. So the export growth should remain, you know, pretty muted and below, you know, an inflationary level. Hopefully that helps.
Yes, that was helpful. And then maybe if we could just jump to the loans receivable book. It looks like there's a maturity towards the end of the year. I don't know if you could tell us a little bit more about that, the yield, and then obviously what's included in guide. I'm assuming that there's nothing on the other side of that. So is there any incremental upside from recapturing that and putting some of that back to work, or is there an assumption of what you do with that capital at the end of it?
Yeah, so the loan you're referring to is the RCA loan, and we're having conversations with Deerfield, who's the equity sponsor, as well as the RCA team kind of as we speak. And so there's nothing really to report on that. They're servicing their debt as they should be, so everything is copacetic there. And since it doesn't expire until the end of the year, the assumption of guidance is that the lease stays in place. It doesn't mean that's going to be the ultimate outcome, but it made the most sense for this year's guidance.
Operator
And our next question comes from the line of Juan Sanabrio with BMO. Your line is open.
Hi, maybe just piggyback on the back of that last question. You know, on the RCA loan, could you just make any comments or could you update us on kind of how the tenant's health in terms of financial strength, how they're positioned?
Yeah, there's nothing else for us to comment on. We're having discussions. As I said, they're servicing the debt, which should give you an indication of their health. And they're a great operational team.
Fair enough. And then just with regards to CapEx, could you just give us a sense of how much you're expecting to spend on maintenance CapEx as well as anything kind of over and above? You know, if y'all look at what you've disclosed, and thank you for adding disclosure there around shop CapEx. It's been a bit outsized. I'm sure there's some preferred CapEx you've seen it with So, just curious if you can give us some rough expectations, you know, what you think you'll spend in 2026 on the shop portfolio.
Yeah, I mean, in terms of maintenance capex, I think you could expect it to be at similar levels like we've been disclosing on our portfolio, you know, quarter for quarter. On the, you know, non-maintenance capex, the non-recurring as we call it in our supplement, it's probably going to be somewhere in that 20 to $30 million range if I had to ballpark it for 2026. Yeah, no problem.
Operator
And our next question comes from the line of Michael Goldsmith with UBS. Your line is open.
Good afternoon. Thanks for taking my question. Maybe following up on the first question on occupancy, I think you taught fourth quarter just under 88%. I think you said are expected to get in the low 90 percent, is that expected for 26 and then what is the maximum? You know, is this something that kind of caps out at low 90s, mid 90s, high 90s? How are you thinking about the opportunity on occupancy there?
Yeah, so we think we can exceed 90 percent. How much further just in 2026 we'll see, but once you get to the mid 90s, you're kind of effectively full as people are moving in and out. I mean, we have buildings. We have a building in Canada that runs 100% for long periods of time, but that's unusual. So, if you're looking at a decent-sized portfolio in the aggregate, probably mid-90s is a pretty decent number to think about as effectively full.
Thanks for that. And then as a follow-up, a small portion of the $240 million of awarded deals is skilled nursing. In your view, what held back that the skilled nursing investment in 2025, do you expect that to change in 2026?
No, we still expect the lion's share of the investment activity to be SHOP. Of all the transactions we see, it's probably SHOP represents probably 95% of the opportunity of the skilled nursing investments that we have, that we're looking at that either have been awarded or we're looking at from an off-market basis, that they're all coming directly from existing relationships. I would expect that to continue, but it will be minimal compared to the senior housing investment.
Thank you very much. Good luck in 2026.
Operator
And our next question comes from the line of Austin Bershment with KeyBank Capital Markets. Your line is open.
Great. Hello there. Just when thinking about the shop and the why guidance, should we think about the holiday transition assets as lagging a bit versus the rest of the portfolio currently, but maybe there's potential for those to catch up and being a source of upside as the year progresses?
Yes, definitely the holiday portfolio is lagging, the overall same-store portfolio, but they have a much longer runway as far as upside with respect to occupancy and all the other metrics.
Yeah, and that goes to my opening comment that that's going to bolster our overall shop growth of the year. Our non-holiday portfolio has been doing really well, and so that should bolster because we do expect it to improve.
Can you give us just a sense of what that delta is between the holiday transition assets in the fourth quarter and maybe what the rest of the portfolio did to just, you know, understand what the the catch-up opportunity is and then does guidance assume that it fully catches up or or just you know kind of makes some additional progress through the year?
Yeah no I would I think the way we would answer that question is I mean you saw the year-over-year growth for our entire same store portfolio and it's about for the ex-holiday portfolio that we transitioned last year you know it's somewhere below that right and we're not going to give specifics on to what degree it is below that, but it's not at, you know, 13%, 12% like the entire portfolio was. But to Rick's earlier point, Darren's earlier point, you know, as those continue to recover, we do expect there to be some additional NOI uplift as a result.
So we came in at 15% for the year. Prior to the transition, we were in high teens. And so that's an expectation that we have. It's just hard to pinpoint the timeframe under which the transition facilities will improve enough to get us back there. That's the direction.
And then just one more. I'm just curious what the driver of the outsized occupancy growth for the shop assets in Canada I think you said it was 300 basis points year-over-year. I think that was closer to 150 base points last quarter. I mean, anything specific that's driving that sort of acceleration in occupancy upside?
No, nothing specific. I would just say that the Canadian market is ahead of the U.S. market as far as the recovery is concerned. And from a new supply perspective, I think Canada has even has a lower sort of construction rate that's happening there versus in the U.S., which we all know is at near historic lows.
The lack of supply. Thanks for the time, everybody.
Operator
And our next question comes from the line of Seth Berge with Citi. Your line is open.
Maybe just going back to kind of the overall investment opportunity set, what part of the 240 is skilled versus shop? And then maybe broadly, you know, how are you seeing kind of the investment landscape change and the opportunity set change? Are your return requirements changing at all? Or, you know, how is the acquisition pipeline changing as a result of, you know, as we kind of see more REITs kind of get involved in the shop space?
So, number one, the $240 million of awarded transactions is significantly weighted towards SHOP. There are a couple of skilled nursing – actually, there's one skilled nursing opportunity that we discussed, which is only $20 million of that $240. As far as the continued competitiveness in the market, you know, we're definitely seeing more competition, but with such an enormous deal volume in the market, we're still able to find high-quality, newer vintage assets at good yields.
And our return expectations haven't changed, so our IRR return expectations are still low double-digit.
Operator
And our next question comes from the line of Michael Schreieck with Green Street. Your line is open.
Thanks. Good morning. Can you shed some light on how the non-same store shop assets are growing and are you expecting meaningfully different NOI growth within that portfolio relative to the same store pool in 2026?
Yeah. I mean, in terms of the facilities that are not included in our same store pool, you know, there's a component of that that are more recent investments, right? And they just don't meet the same sort of criteria because we haven't owned them long enough. And as we've talked about on calls, the last couple of calls, the investments that we've been making are we're going into those with, call it, you know, high 80%, maybe even low 90% occupancy, but there is still some room to run there on the NOI side. And once those get folded into the same store pool, you know, those will be, their performance will be reflected. And then in terms of other assets that may not be included in the pool that are not recent transactions, you know, their occupancy is a little bit lower. They're excluded for a reason. You know, there may have been some renovations done, some repositioning of the asset at some point in time, and those assets are in the process of recovering. And once they get to a reasonable spot, then we'll include them into the pool. But those assets, you know, by definition, will have some opportunity for increased NOI growth given where they are performance-wise today.
But as a non-same store gets folded in over time, it's not going to result in reduced numbers for us.
Understood. And then maybe one question on pricing power. How long do you expect that mid-single-digit rev for growth to continue within the Canadian Canadian portfolio and then when or if you expect the U.S. business to catch up?
I would expect the Canadian portfolio should continue on with that same sort of trajectory at least over the next year and it depends with respect on the U.S. portfolio, it depends on occupancy. As occupancy continues to increase, there will be more pricing power and we should see some elevated growth at that point.
But it's pretty impossible to sort of even take a guess at how long it's going to take for the U.S. market to catch up to the Canadian market because it's a pretty big gap right Makes sense.
Operator
And our next question comes from the line of Ferrell Granite with Bank of America. Your line is open.
Thank you for taking my questions. My first one is regards to, as you're entering into these shop assets, largely which auspency are you trying to enter in at, and does that allow a greater ramp as that enters from your non-same store into your same store, providing potentially greater duration as we're talking about the same store NOI growth?
Yeah, a lot of the assets that we're acquiring are sort of 86, 87 percent. There are some that are a little bit higher, but mostly the sort of 86%, 87% range, so that gives us plenty of room for growth, particularly when you factor in the operating leverage, you know, once you get to those higher numbers. You just have a great pull-through on the revenue side because, as Mike mentioned earlier, you don't have much in the way of incremental costs, so the growth becomes outsized.
Great. And I guess similar along those lines, while we were just speaking about the Canadian portfolio and thinking about NOI margins going forward, at what point does that almost cap out or do you have an example of one of a facility with higher pricing power, high occupancy that's been able to really level out expenses just to give a sense of what direction this portfolio can go towards?
So, we have some anecdotal evidence in Canada with a couple of buildings where they've really maxed out and the margins are really quite high, but it's anecdotal. It's one of two buildings. You can't really extrapolate from it, much less take that and make assumptions about the U.S. But, you know, the margin growth is, we saw a pretty nice runway there. So, to expect, you know, assisted living margins to exceed 35% is not low-balling it or high-balling it. It's a realistic expectation. From our perspective, the question is how much higher can it go than that? And obviously, independent living is even higher.
Operator
Thank you. And our next question comes from the line of Alex Fagan with Baird. Your line is open.
Hey, Ed. Thanks for taking my question. Maybe if you can speak on deal flow and how competition is evolving, maybe where are you seeing cap rate compression and where is pricing holding up? Sure.
We're definitely seeing cap rate compression as the sector gains more and more popularity and then private equity as well as getting involved. However, the private equity investment, they haven't made a big splash. Typically, when you see them transacting on opportunities, it's kind of a one to three asset sort of acquisition, and they tend to be focused more on either trophy assets in premier locations or deep sort of value add opportunities, neither of which we're focused Fortunately, the cap rate compression, although it's definitely there. We've still been able to find and continue to find newer assets in solid markets in that seven-cap range.
And just sticking with the shop stuff, are you willing to lend to the development of new shop? Are there any of those opportunities bubbling up?
Yes, actually, we have a program that's preferred equity, so we're not lending, but we'll will provide preferred equity on developments. Those typically carry with them, you know, double-digit returns with a purchase option and then a kicker on the back end. So it creates – provides us with a solid investment return along the way and provides optionality in the future and to some extent creates a future pipeline. Although I continue to see more development opportunities, most of them still don't pencil, but I am starting or we are starting to see deals that actually pencil. So I think it will pick up, yeah.
Thank you, guys. That's it for me.
Operator
And as a reminder, it is star one if you would like to ask a question. And our next question comes from the line of Omotayo Okusanya with Deutsche Bank. Your line is open.
Hi, yes. Good morning out there. Great to see all this activity. On the skilled nursing side for a second, could you just talk a little bit about how you're seeing the regulatory outlook for the rest of the year, whether it's on the Medicaid side, whether, again, also on the Medicare Part A side, just kind of given some of what we saw with the Medicare Advantage?
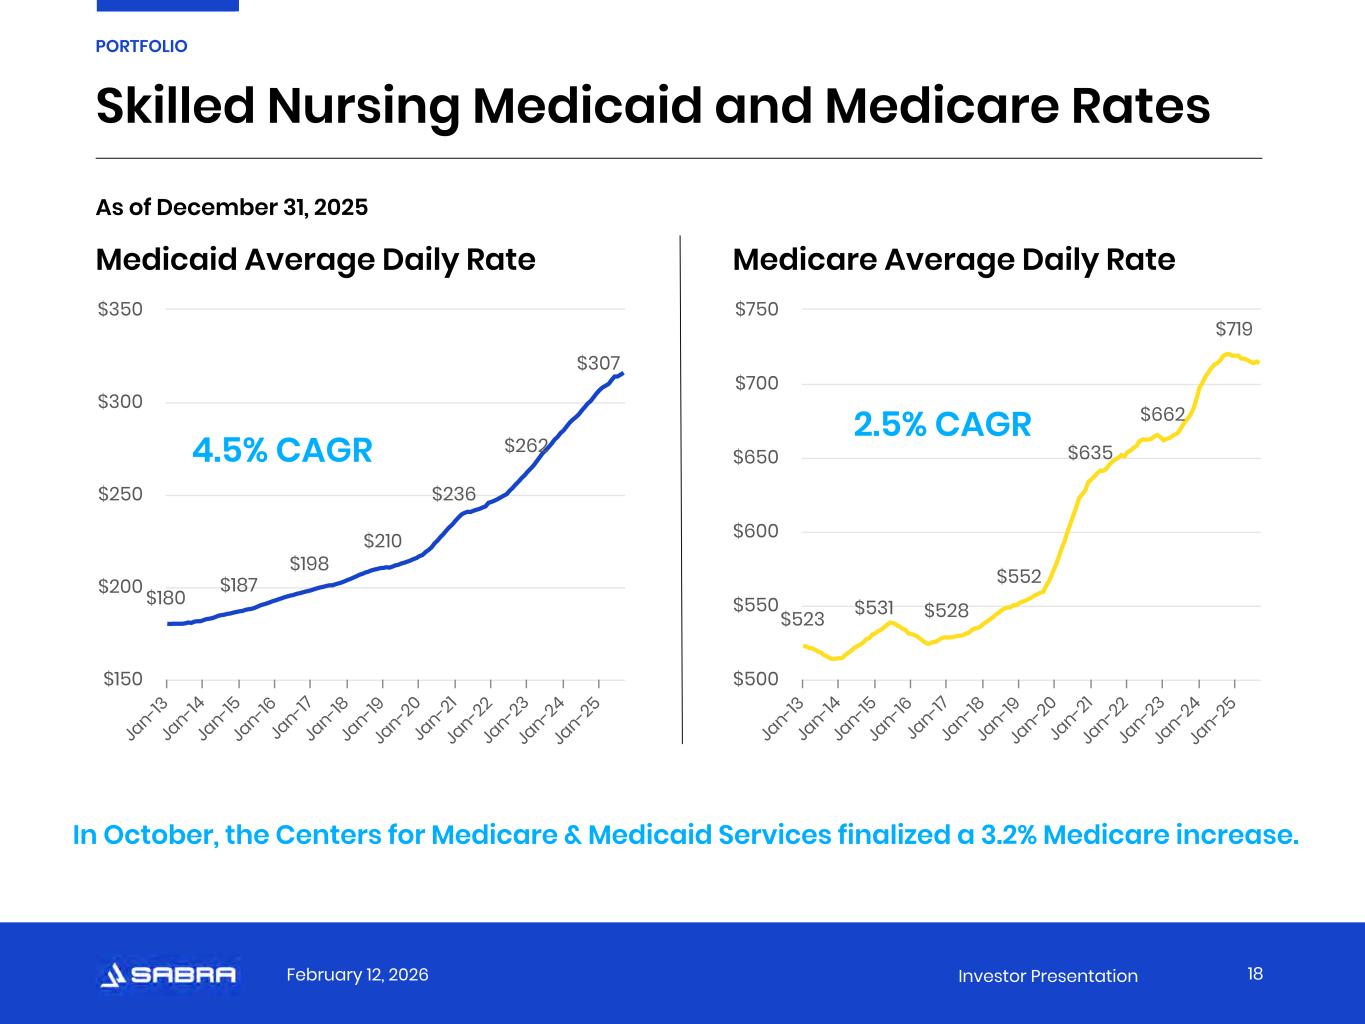
Yeah, I don't think there's a read through from the MA rate decision. So I think for our space, it's very formulaic, kind of as I said over the last couple of calls, the outsized rate increases both on the Medicaid side and the Medicare side. We got through the pandemic, you know, really started tapering down a little bit last year. We hit a high point, I think in 2023 on both Medicaid and Medicare rates, because of time frame through which the cost report process runs and when all that inflation was captured. So they came down a little bit in 25, but it was still quite robust, and we're expecting to come down some more this year and then maybe when you get into 2026, you sort of back to where you were with historical averages. So, I don't see anything unusual there at all. There's no dialogue that's happening at the state level around Medicaid rates that are causing us any concern.
That's helpful. And then also on the shop side, again, first kind of six weeks of 2026 have been a little bit strange, kind of higher flu season, very strange weather. Just kind of curious if that's impacted and even move that activity at least for the first six weeks of the year and if it is, if that started to stabilize out?
Yeah, not really. It's been pretty muted. Flu season's been relatively muted. So, yeah, not much.
Operator
And our next question comes from the line of Rich Anderson with Cantor Fitzgerald. Your line is open.
Hey, thanks, and good morning out there. So I have just one question as it relates to shop and the execution of a shop platform. You know, Ventos and Welltower have established programs to grow, you know, in the year following. I'm not worried about people finding acquisitions. I'm worried about them executing on the operations in the aftermath. You guys have been doing this for 10 years on the shop side. Now a lot of your peers are sort of getting into it today. Do you find or do you think back that, boy, you kind of learned a lot of lessons out of the gate? that having been in it for 10 years has given you sort of an advantage from an operating point of view. And I'm just curious if you think that it's more complicated, perhaps, as an operating business than maybe some on the outside looking in might realize. And I'm wondering if there were lessons learned earlier on in your shop existence that you put into execution over the course of past several years that puts you at a better advantage to grow. Thanks.
Yeah, thanks, Rich. So, a couple of things. One, it is more complicated. It's becoming more complicated as acuity rises under the assumption that you're aligning yourself with operators that are pushing acuity up, which we are. I think, you know, one of the lessons that got learned along the way is when you've got a team at the REIT that's used to working with just triple net, working and really getting into the details and working side by side with those operators under a shop structure is very different. And so it took some time, I think, to acclimate to that. I think one of the advantages that we have is from the very beginning, our asset management team has only been comprised of ex-operators. So that was something that we did intentionally when we first did the spin and started building up all those functions. So I know folks know kind of my operating background, but it isn't just me. We've built a really deep operating bench throughout the company. And we've added a business intelligence unit along the way as well for better data analysis. And so I think being robust in those areas has paid off for us. And so as we grow the SHOP portfolio going forward, everything that we add from an infrastructure perspective at this point is just incremental for us. So, you know, now it's a matter of continuing to fine tune, especially with all the technological from advancements and utilization of AI and things like that. But I think the formation of our business intelligent unit positions us well to do that. And I'll add something to that.
Sorry, I'll add something else to that, Rich. And it's not necessarily, I wouldn't call it a lesson learned. I think it's just good management, which is the way that we internally manage, oversee, and operate on that portfolio has evolved over the last 10 years, as you would expect. I think it'd be kind of foolish for somebody to assume somebody with a company with 10 shop assets is going to have the same infrastructure, same processes, same everything as somebody with 1,000 shop assets, right? But that willingness and that appetite to continue to evolve ourselves and reinvent ourselves in how we do that and continue getting better, that's something that has changed over the years. I wouldn't say that's a lesson learned. I think that's just the, you know, spirit of constant improvement.
When you think of, I don't know, maybe you have 60 employees at Sabra, present company excluded, how many of them would you say are sort of focused primarily on senior housing operating?
I mean, in terms of people that are completely dedicated senior housing operating, that would, we have a section of our accounting group that's probably, I don't know, six, seven professionals, that's all they do. Our asset managers spend a lot of their time, as you would expect, on that portfolio. They also spend time on our triple net portfolio as well. But I think everybody to a person here at SABRA is involved, as we should be.
And the other thing I would point out is our investment team, who don't necessarily have an operational background, they work completely in sync with the asset management team and they go out to the buildings with them. So over the years, our investment management team who doesn't have an operational background is now spent so much time going through buildings that we're looking to acquire side by side with our asset managers who are operators that their understanding of operations is really expanded tremendously, so if you look at our investment team, our asset management team, and the folks that are completely dedicated to shop and accounting and finance, it's a pretty big chunk of that with 55 people, about 55 of those 55 people.
Okay, great. That's all I got. Thanks. Thanks.
Operator
And as a reminder, just star one if you would like to ask a question, And with no additional questions at this time, I will turn the call back over to Mr. Rick Matros for closing remarks.
Thank you for your support. Thanks for dialing in for the call. And I hope you all have a great Valentine's Day weekend with whoever you spent Valentine's Take care.
Operator
And ladies and gentlemen, this concludes today's call and we thank you for your participation. You may now disconnect.