Operator
Welcome to the ScanSource Quarterly Earnings Conference Call. All lines have been placed in a listen-only mode until the question and answer session. Today's call is being recorded. If anyone has any objections, you may disconnect at this time. I would now like to turn the call over to Mary Gentry, Senior Vice President, Finance and Treasurer. Please go ahead.
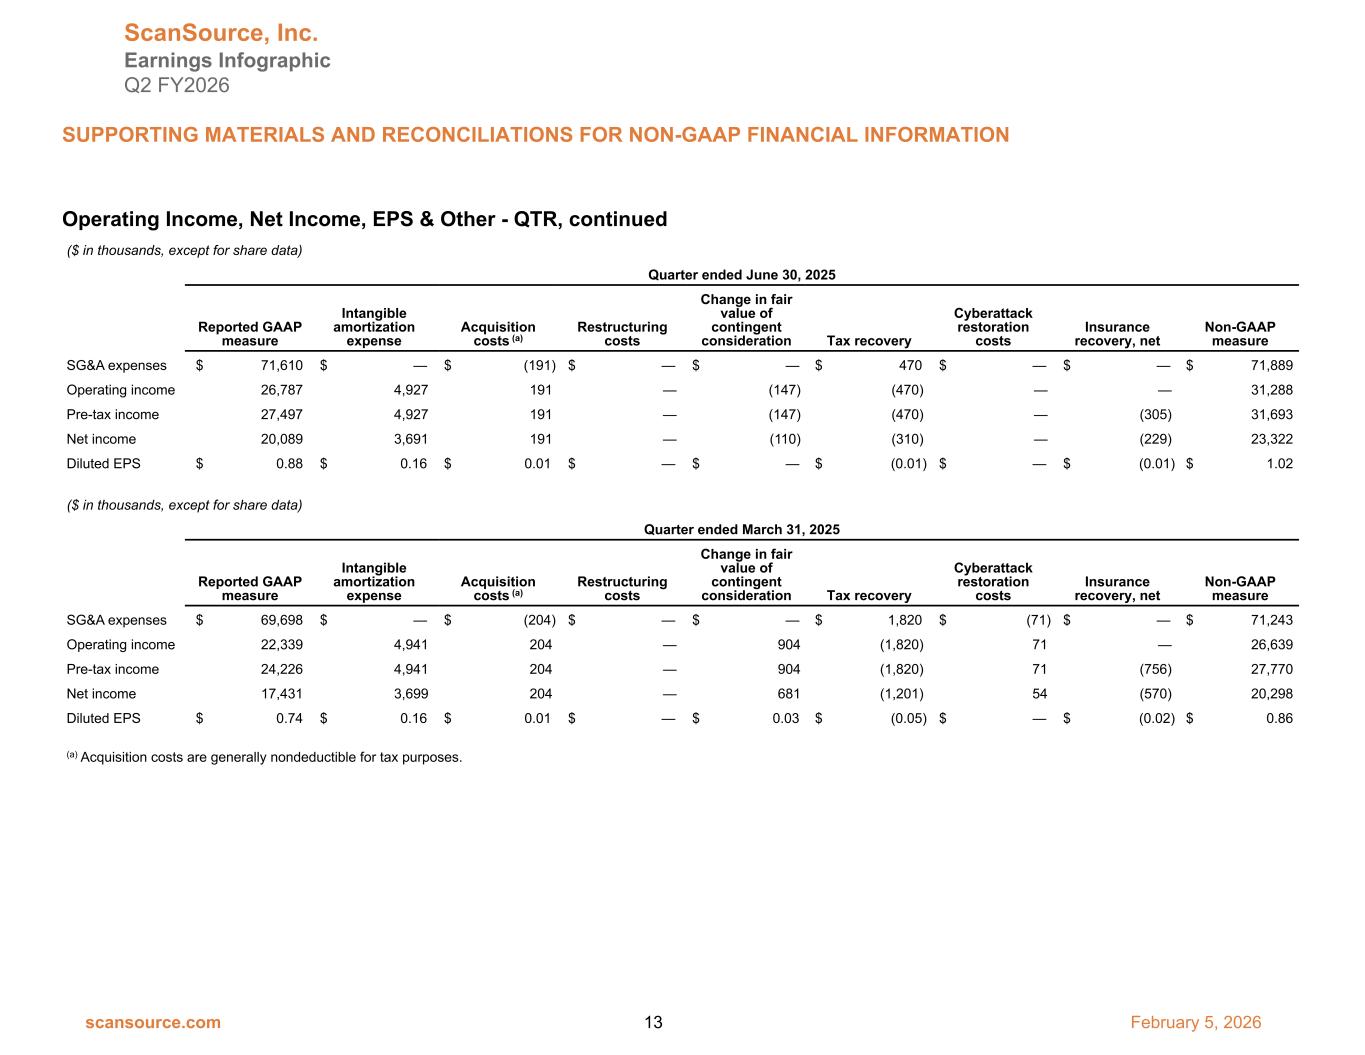
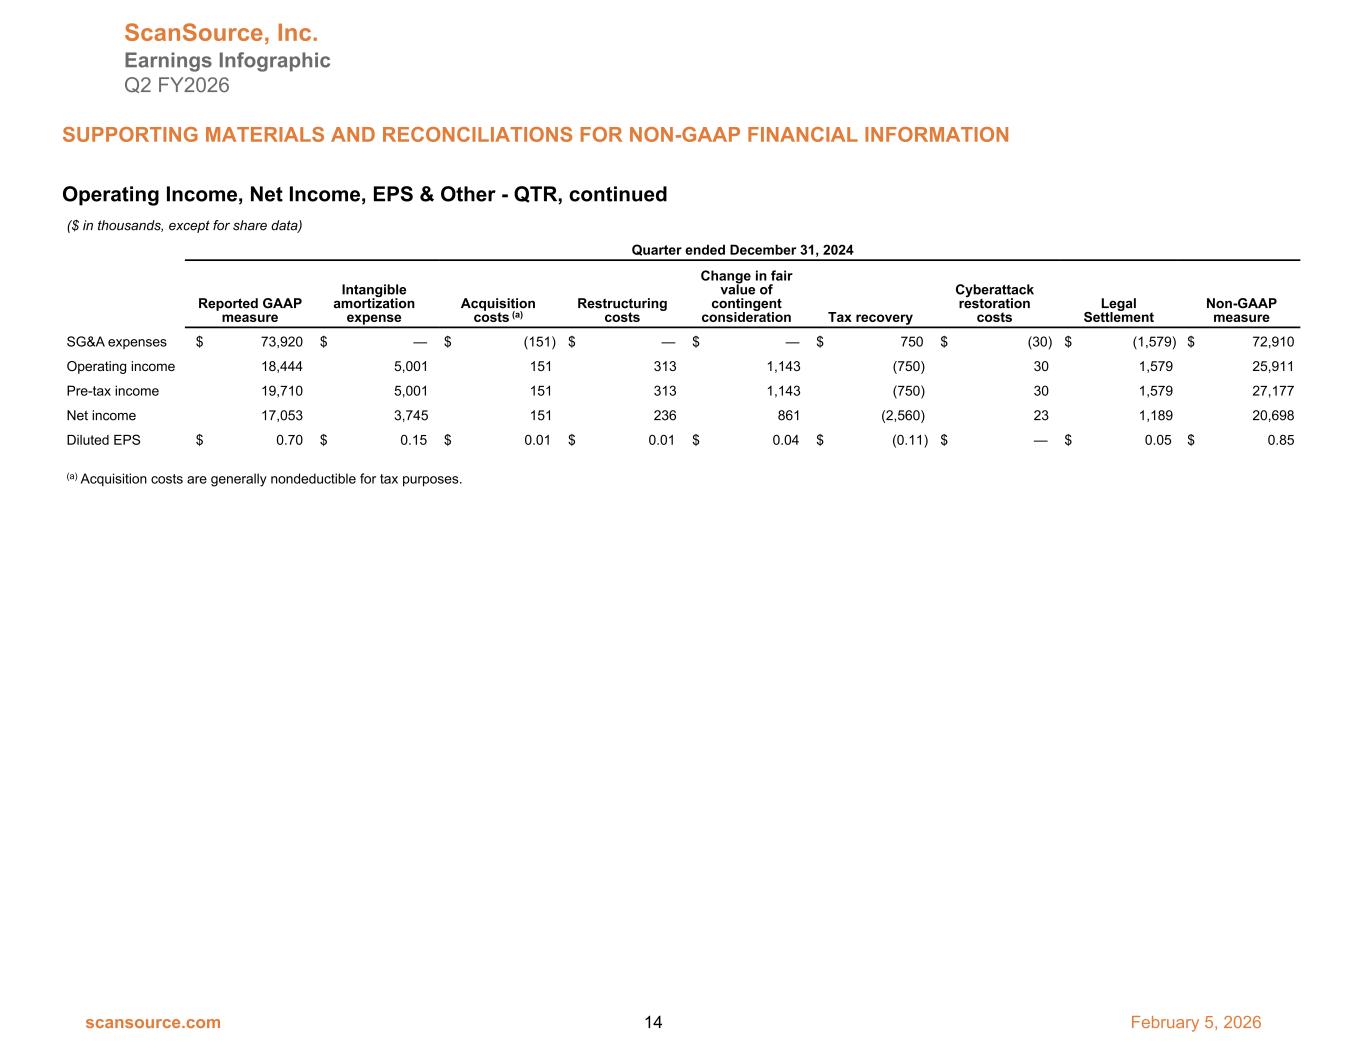
Good morning, and thank you for joining us. Our call will include prepared remarks from Mike Bauer, our Chair and CEO, and Steve Jones, our Chief Financial Officer. We will review our operating results for the quarter and then take your questions. We posted an earnings infographic that accompanies our comments and webcasts in the investor relations section of our website. As you know, certain statements in our press release infographic and on this call are forward-looking statements and subject to risks and uncertainties that could cause actual results to differ materially from expectations. These risks and uncertainties include the factors identified in our earnings release and in our Form 10-K for the year ended June 30, 2025 and in our subsequent reports on Form 10-Q. Forward-looking statements represent our views only as of today and ScanSource disclaims any duty to update these statements except as required by law. During our call, we will discuss both GAAP and non-GAAP results and have provided reconciliations on our website and in our Form 8 file earlier today. I'll now turn the call over to Mike.
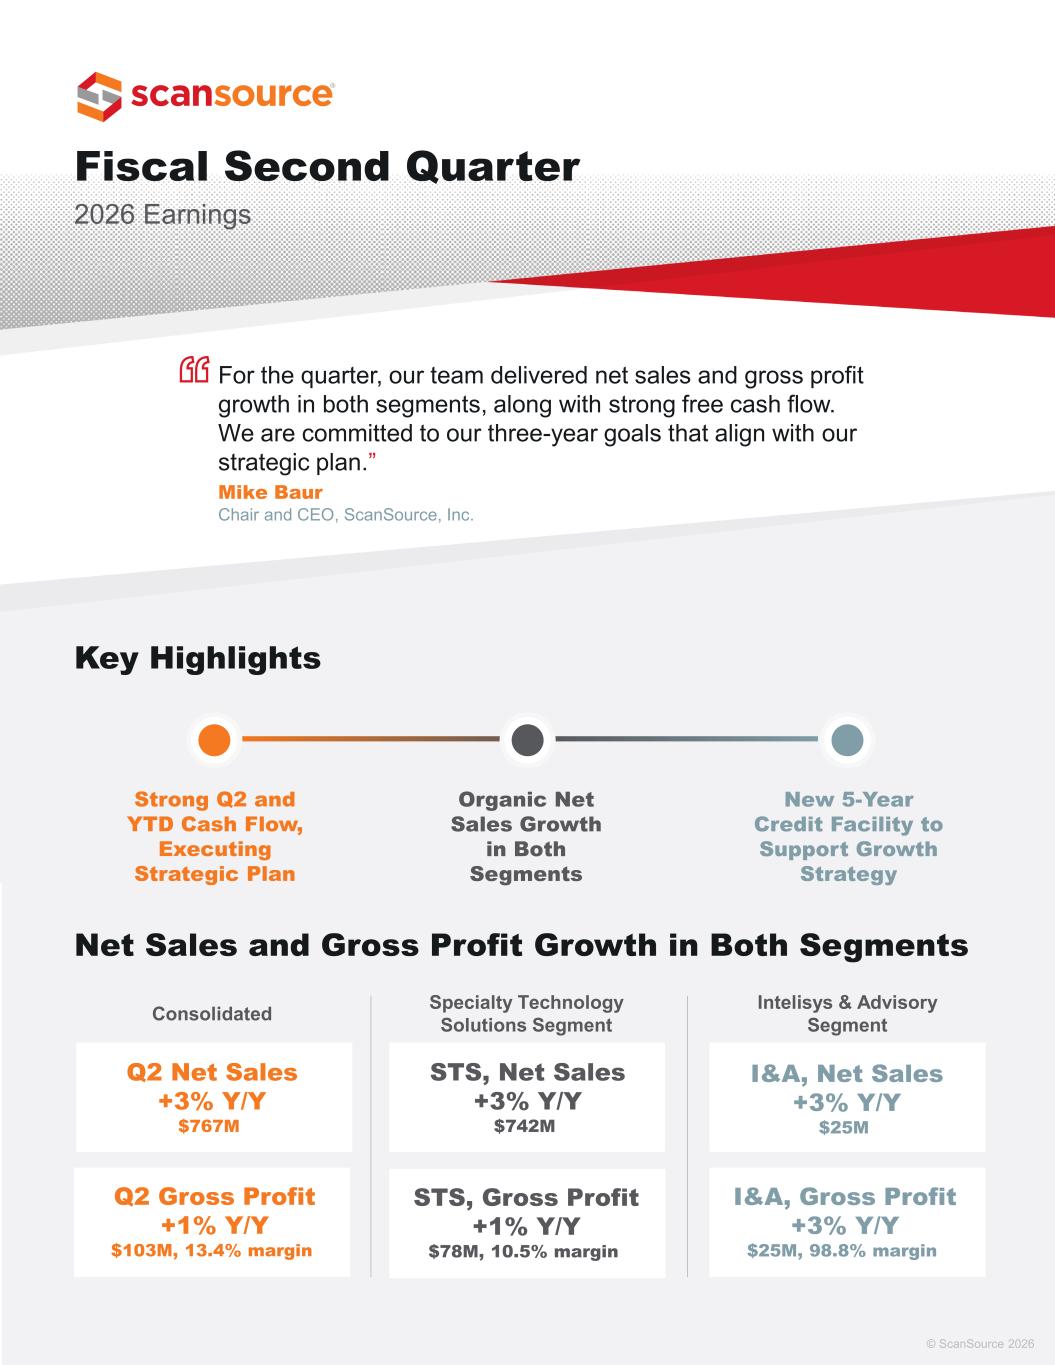
Thanks, Mary, and thanks everyone for joining us today. In the second quarter, we generated strong free cash flow and delivered net sales and gross profit growth in both segments. However, our profitability was negatively impacted due to some unexpected expenses contained in the quarter. This resulted in declines in both gross profit and EBITDA margins compared to our very strong first quarter. In Q2, we had organic net sales growth for both segments, though slower than expected for our specialty technology solutions segment. Today, we're excited to announce the launching of a new converged communication sales team at ScanSource. This communications team unifies the ScanSource communications products and the IntelliSys products and services to fully embrace the accelerating convergence of hardware, cloud, and customer experience technologies. We believe end users are embracing cloud-based UCaaS and CX platforms, and this is a growth opportunity for our channel partners. We're bringing together the expertise of our people to form one unified sales team, a team with deep knowledge of communications products and IntelliSys cloud-based CX solutions. By giving this one team responsibility for both the hardware and recurring cloud business for these partners, we are strengthening partner alignment, expanding our share of wallet, and positioning Scamsource at the center of this converging ecosystem. In our IntelliSys and advisory segment, our investment strategy is driving growth and momentum in new orders. We make these investments ahead of the revenue, understanding that it typically takes about a year for new orders to convert into billings. As a result, we're seeing our new orders increase at a faster rate than our current revenue from billings. New investments for IntelliSys include building out our new Converge communication sales team, team, which is designed to further accelerate growth and capture new in-user solution opportunities. As we move ahead, our strategy centers on helping our channel partners deliver innovative converged solutions, driving both organic net sales and free cash flow through solid execution of our strategic plan. Our team is focused on profitable growth, executing our strategy, and making progress toward our three-year strategic goals I'll now turn the call over to Steve to take you through our financial results and outlook for fiscal year 2026
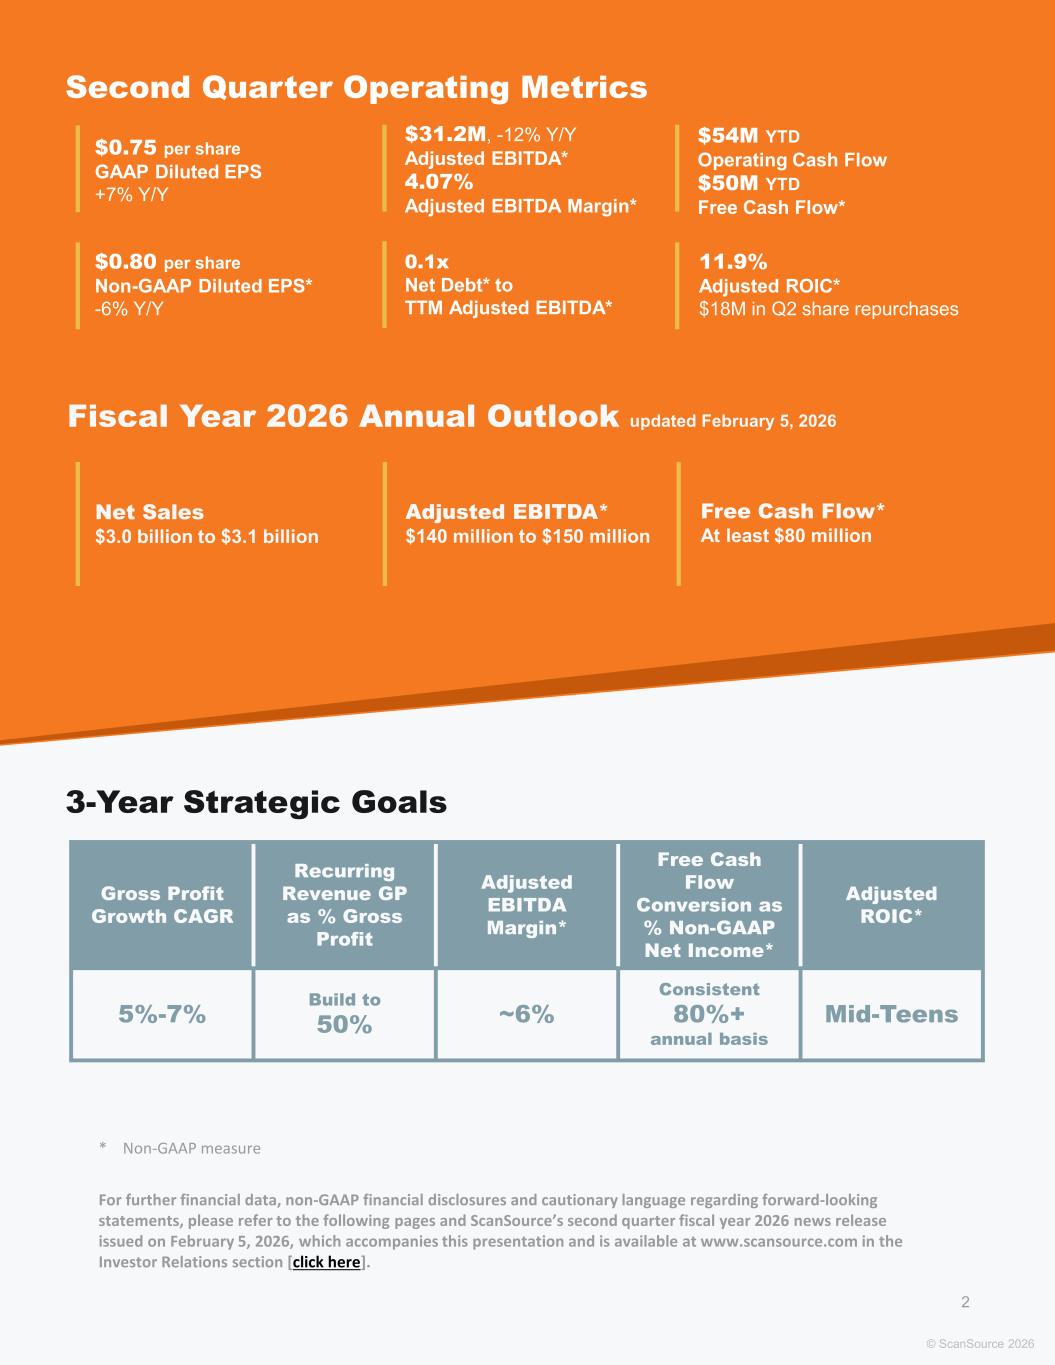
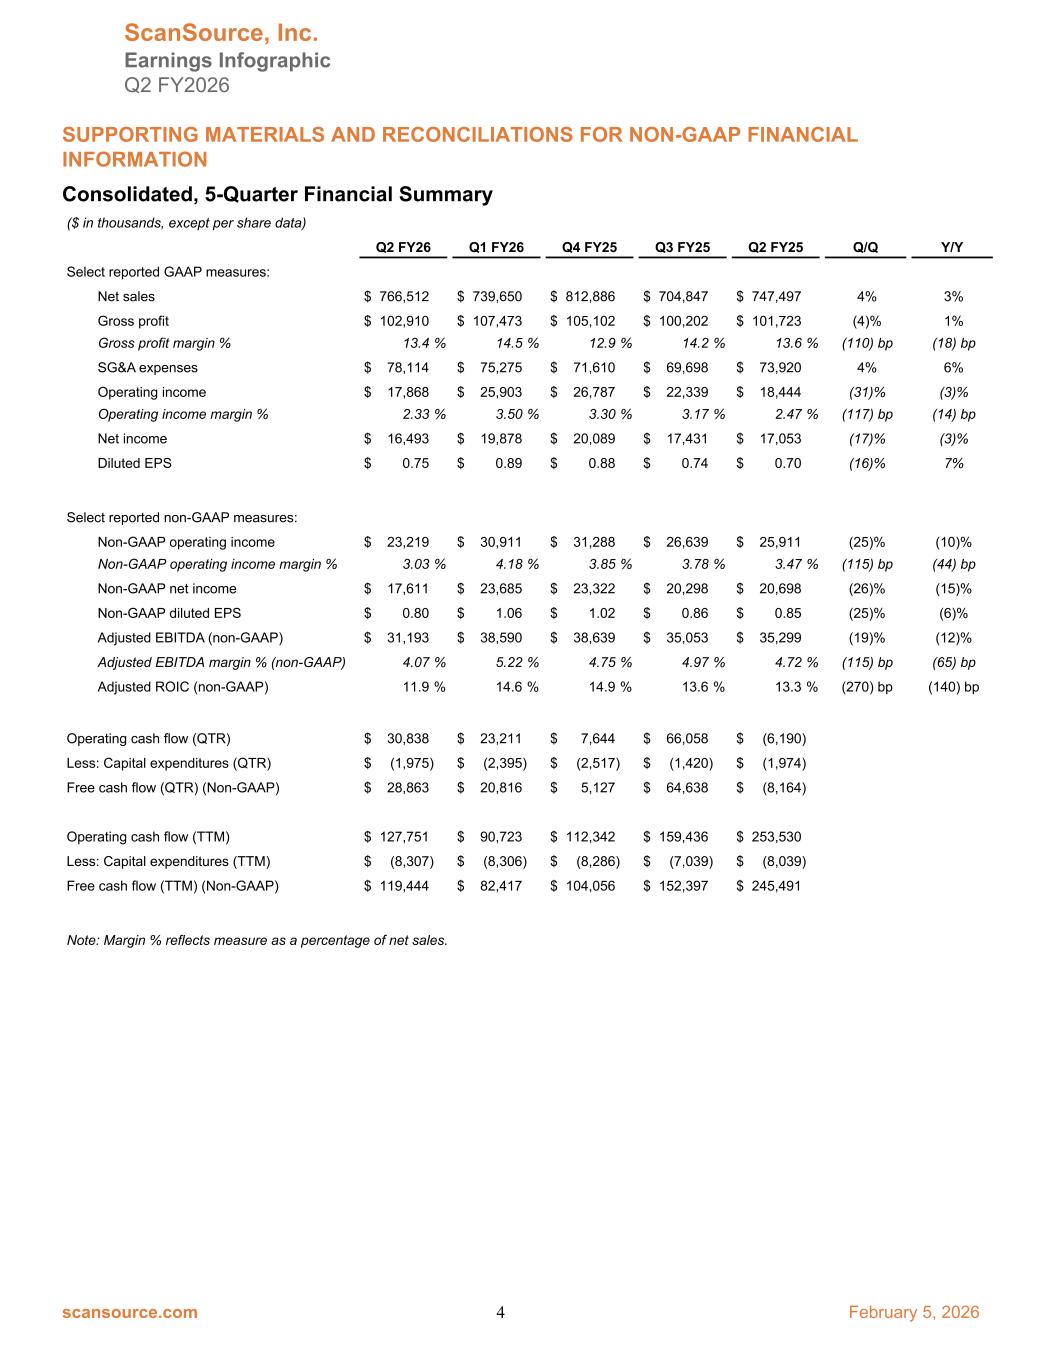
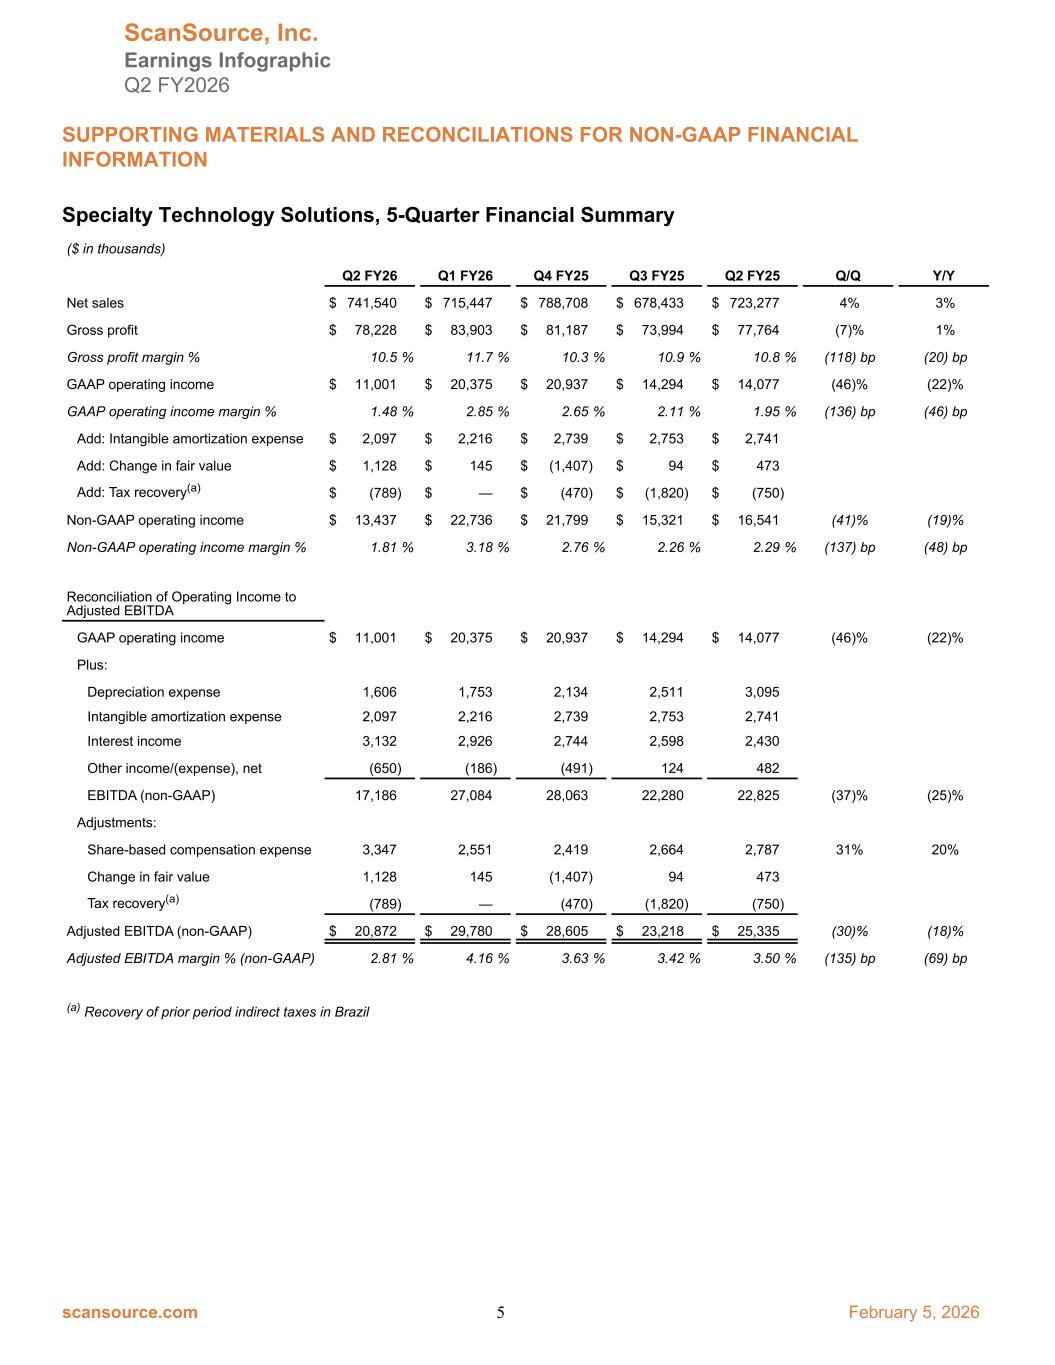
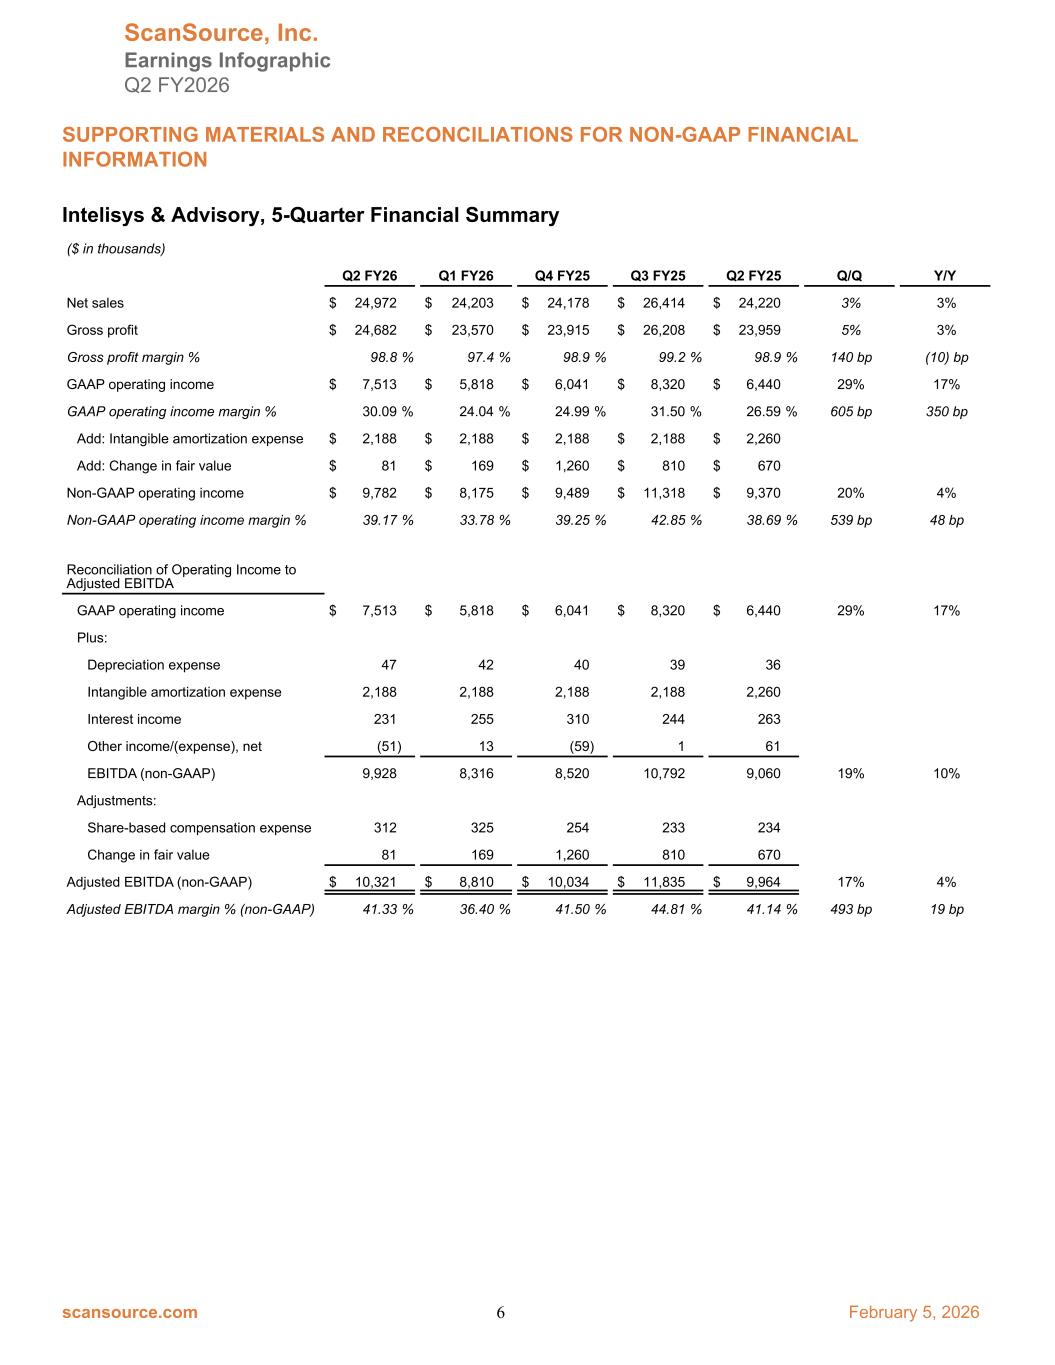
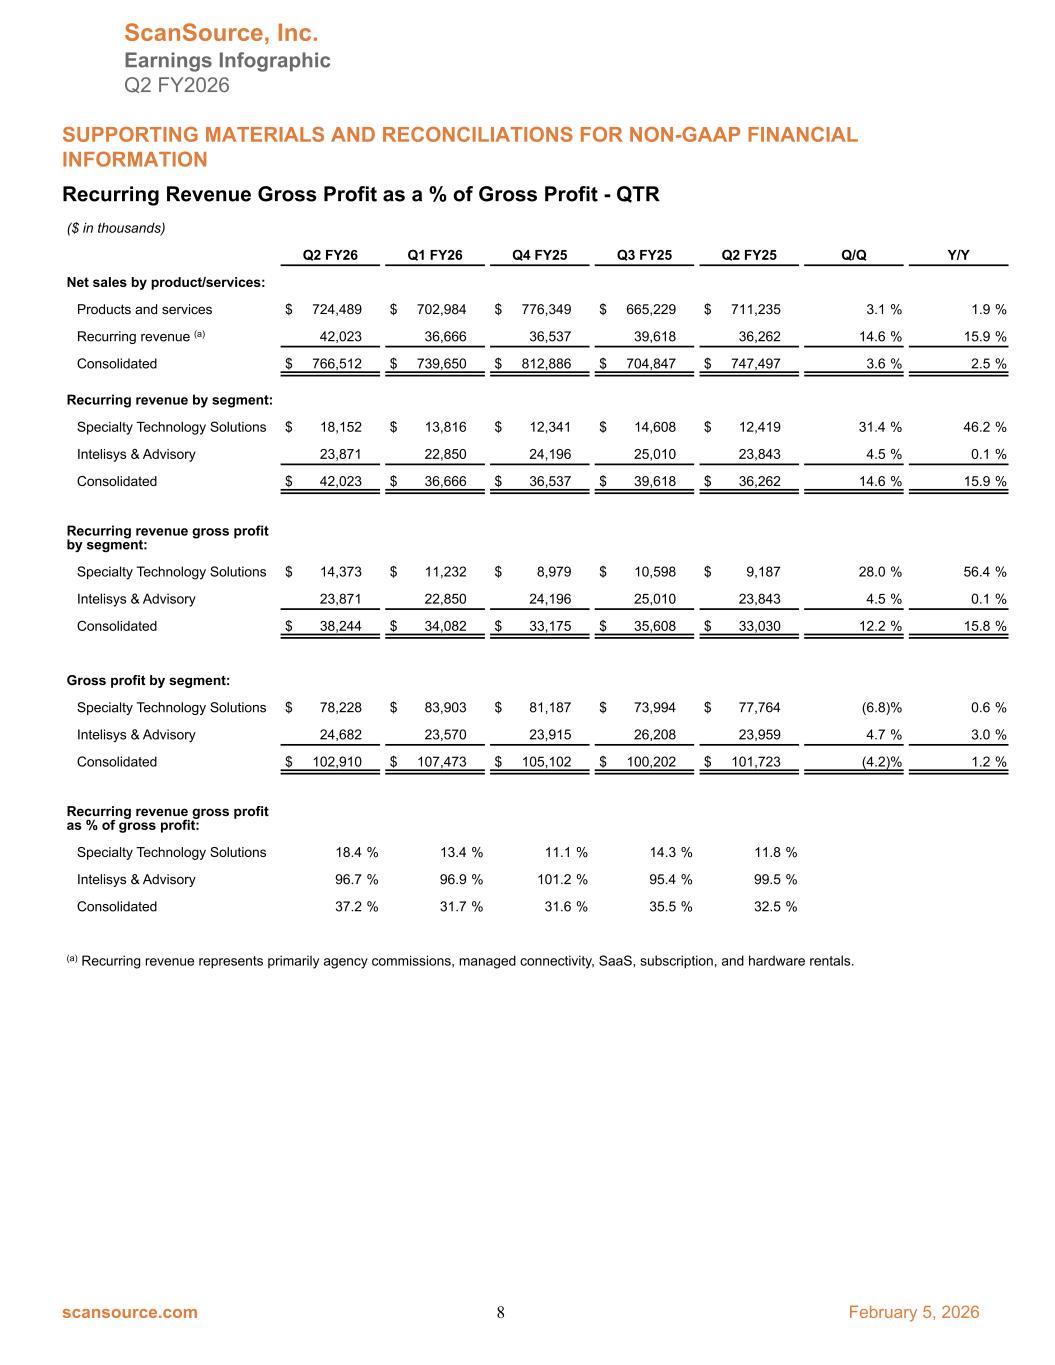
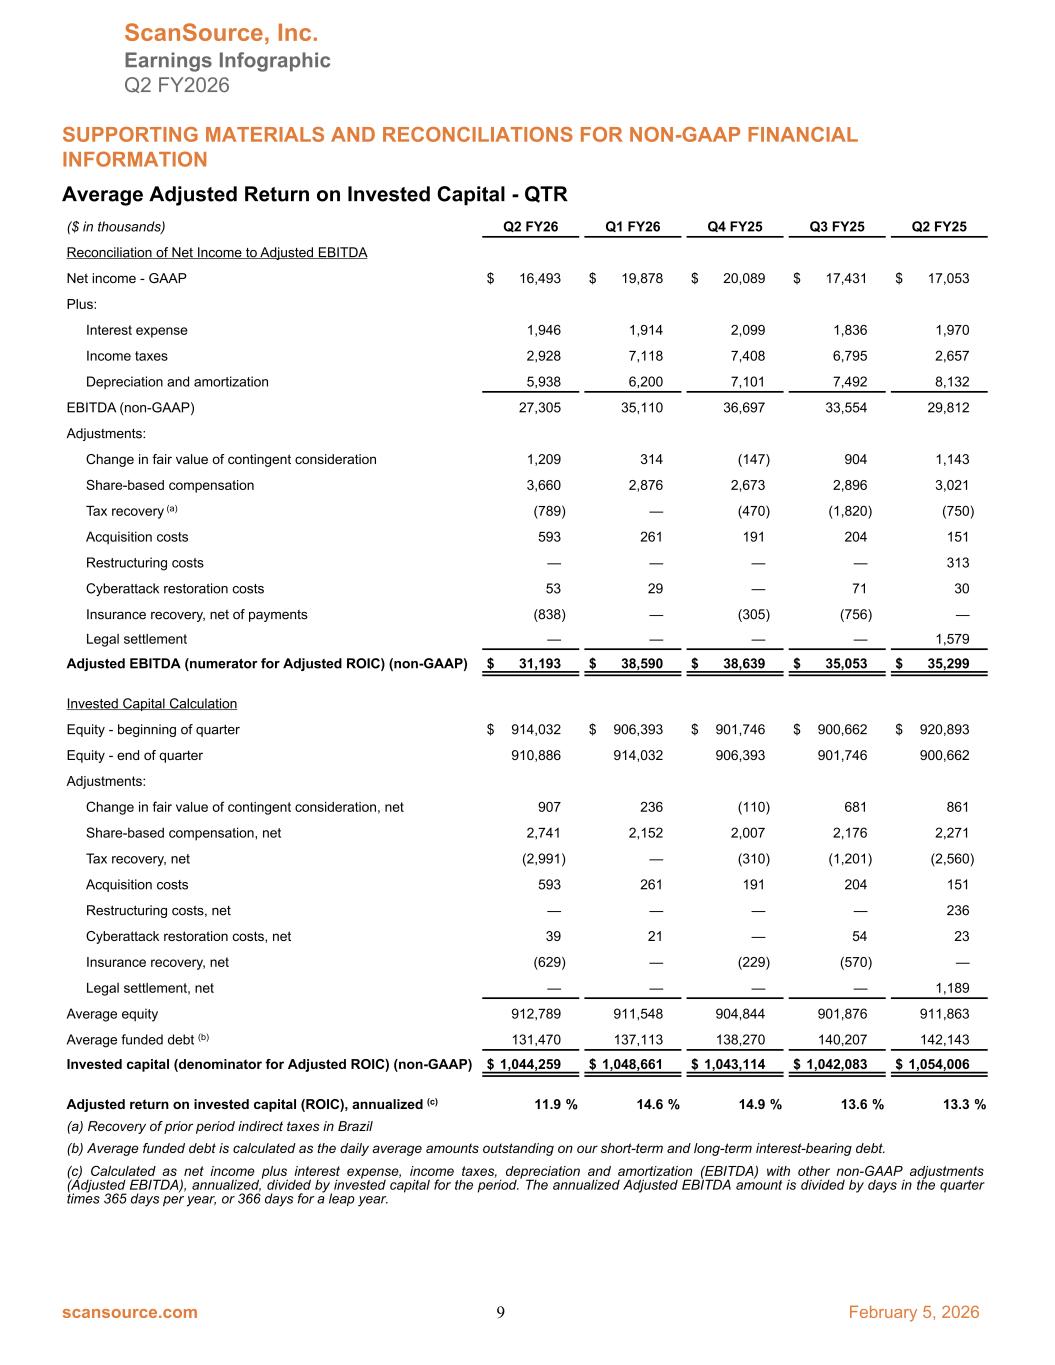
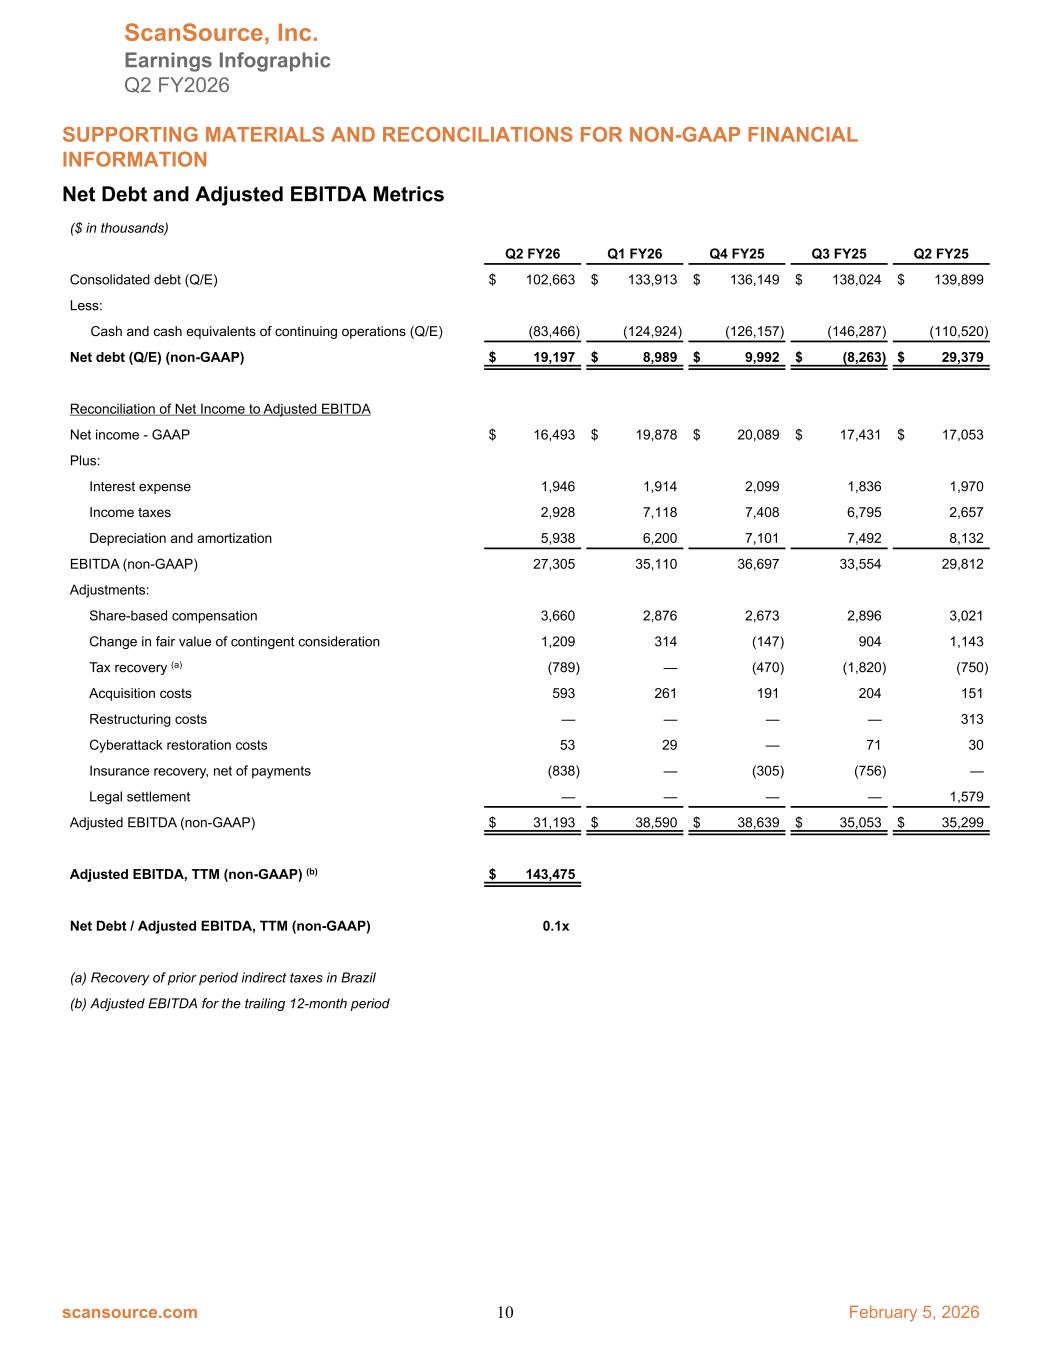
thanks Mike Q2 net sales grew 3% year-over-year in both segments and gross profits increased 1% year-over-year profits for the quarter were negatively impacted by some higher period expenses in our specialty technology solution segment impacting both cogs and SG&A we delivered strong free cash flow in the quarter, and closed on a new five-year credit facility that will support our strategic objectives and capital priorities. Turning to our segments, I'll start with our specialty technology solution segment. Net sales increased 3% year-over-year and 4% quarter-over-quarter. Gross profits increased 1% year-over-year. Higher period expense, including freight cost and mix, impacted gross profit margins by approximately 30 basis points. Excluding these costs, gross profit growth would have been in line with the revenue growth for the segment. The percent of gross profits from recurring revenues grew to approximately 18% for the segment and includes positive contributions from the acquisition of Advantix and Datazune. The specialty technology solution segment adjusted EBITDA margin was 2.8%. For the quarter, the impact on segment-adjusted EBITDA margin from higher period expenses is approximately 60 basis points. In our IntelliSys and Advisory segment, net sales increased 3% year-over-year, in line with our expectations. Annual net billings increased to approximately $2.85 billion, growth and profits increased 3% year-over-year, while adjusted EBITDA margin for the segment was 41%. Going a bit deeper on our balance sheet and cash flows, we ended Q2 with approximately $83 million in cash and a net debt leverage ratio of approximately zero on a trailing 12-month adjusted EBITDA basis. Adjusted at ROIC was 11.9% for the quarter and 13.3% for the first half of FY26. Share repurchases for the quarter totaled $18 million and we have $179 million remaining under our share repurchase authorization. We continue to have a strong balance sheet and are well positioned to execute our strategic priorities and achieve our three-year goals. Our three-year goals focus on growing the company's gross profit contributions from recurring streams, expanding our profitability, delivering strong free cash flow, and disciplined capital deployment. You can find our goals in the infographic and our investor presentation in the Investors section of our website. We are pleased with the contribution from our acquisitions, including the most recent acquisition of DataZoom and what they bring to our channel capabilities and our strategic We continue to explore acquisition opportunities that could expand our technology stack, our capabilities, and help us drive additional value across our partner ecosystem. Our capital allocation priorities also include continued share repurchases. We are confident in our business model and are optimistic for growth in the second half of our fiscal year. For the first half of our fiscal year, our gross profit margin was close to 14 percent, and our adjusted EBITDA margin was over 4.6 percent. We are updating our full-year projections based on our first-half performance. We now believe that full-year revenue will be in the range of $3 billion to $3.1 billion, and adjusted EBITDA will be in the range of between $140 million and $150 million. For annual free cash flow, we maintain our expectations of at least $80 million. Our expectations include an increase in the second half of large deals, as well as investment in our IntelliSys and advisory segment to drive new order growth. We'll now open it up for questions.
Operator
Ladies and gentlemen, if you have a question or comment at this time, please press star 11 on your telephone keypad. If your question has been answered or you wish to remove yourself from the queue, simply press the pound key. I'm sorry, simply press star 1-1 again. Again, if you have a question or comment, please press star 1-1 on your telephone keypad. Please stand by while we compile the Q&A roster. The question or comment comes from the line of Greg Burns from Sidoti. Mr. Burns, your line is open.
Can you just give us a little bit more color, maybe on the period costs that you highlighted and, you know, whether or not you expect that to continue into the second half of the year, or are they just going to remain kind of localized into this quarter?
Hi, good morning, Greg. This is Steve. I'll take that question. Yeah, you know, in our 10-Q, we outlined some of the costs both in our COGS and in our SG&A. You know, in the COGS piece of it, it's really around mix and freight expense in the quarter that pushed our margins down. We also called out some bad debt expense driven by a customer-specific reserve that we took. And we closely managed our receivables, and we have a very healthy receivables portfolio. So when we look at that, we do think that's more period-related.
Okay. And I guess you mentioned also a little bit slower than expected growth in the technology segment. And could you just maybe give us a little bit more color on, you know, where specifically the lower growth was coming from or, you know, maybe some detail around product categories that might be helpful for us to better understand the dynamics?
Hey, Greg. I think what I would say about that is the large deals are really part of the story here, And maybe that's where I'll talk about it. We saw large deals get broken up into smaller pieces. And so as they're rolling out, they're not happening normally. And we saw this even last quarter. And so I believe that's the real story here is that we've got a slowdown in large deals that are being invoiced in the quarter. And we see that, by the way, we see that as part of the challenge for the hardware business as we look out. And implicit in our adjusted guidance is that we do need the large deals to resume, and we believe that that will happen.
Okay. Is there any specific reason why you have more confidence in that? Are you seeing anything specifically, you know, anything you hear from your customers?
Well, it is based on information. We just had last week our sales kickoff for our internal specialty sales teams, and so we spent a lot of time talking to our sales teams about what they're hearing from partners, from suppliers. So, yeah, it's based on surveys of our partner community and what they believe as they look at their calendar year. And many of these partners, as we all know, you know, they don't have large, long pipelines, and so they generally have very good shorter-term information. And we believe that the information we're getting suggests that the large deals will continue to happen. But, again, they may be broken up over the quarter. And so this is really more of a for the year we feel good about it. Q2, we had expected more than we actually booked.
Operator
Our next question or comment comes from the line of Keith Hewson from North Coast Research. Mr. Hewson, your line is now open.
Can you guys hear me okay?
I appreciate it. Hey, Mike, I understand the memory issue that's affecting a lot of the technology world. You know, and the price side may not impact you guys so much because you guys, you know, pretty much passed through the prices. But what are you hearing from the customers in terms of are you seeing prices increasing now and, you know, any concerns that you have that perhaps should be some sort of supply shortage at some point through not only the second half of your fiscal year, but, you know, throughout all of 2026?
Yeah. Good morning, Keith. We talked about that for sure is the suppliers are indicating that the memory issue will affect them. They don't know, you know, what's the near-term impact versus long-term. and some of it is a pricing issue, as you know, and some of it potentially could be a shortage issue, right? And since so many technology companies use the same memory sources, I think that'll be a challenge for some of our suppliers. So we certainly think that we're going to be in the same position as everyone else in the channel to manage through this. But right now, there's just a lack of visibility as to the near-term impacts. So, we've adjusted our guidance, knowing what we know today about the potential for that to happen. And right now, it's not significant in our guidance, okay?
Appreciate it. I'm going to ask you to look into your crystal ball a little bit here as we talk about the intelligence business. You know, you guys have been restructuring that business now for a few quarters. Are we thinking, you know, the second half of 2026, the calendar year, we should see and tell us as sales start to accelerate from the current levels?
Well, I would say this, Keith. We probably didn't restructure as much as we added additional sales capabilities as well with framing and what we expected from our sales teams when we brought on Ken Mills, which will be over a year and a half ago now. So, for sure, we believe we had to get more aggressive at acquiring new customers and focusing on new orders and not just at the existing book of business that many of our partners had. And I think part of it too is we went through a couple of years ago an aging of the IntelliSys partner community where we had many of the partners, as you recall, that were selling their books of business, they were selling their agency, and we kind of saw the peak of that, I believe a year and a half ago, and I believe that has diminished to some extent, and so I believe even the partners that have been around a long time are now focused more on new orders, and I believe the new order growth that we referenced that is growing faster than our billings is indicative of what we'll see next year. Already in 26, we're benefiting from what Ken put in place a year ago, and I think that's why we're starting to see momentum, and I expect it will continue to grow at a faster rate than new orders, yes.
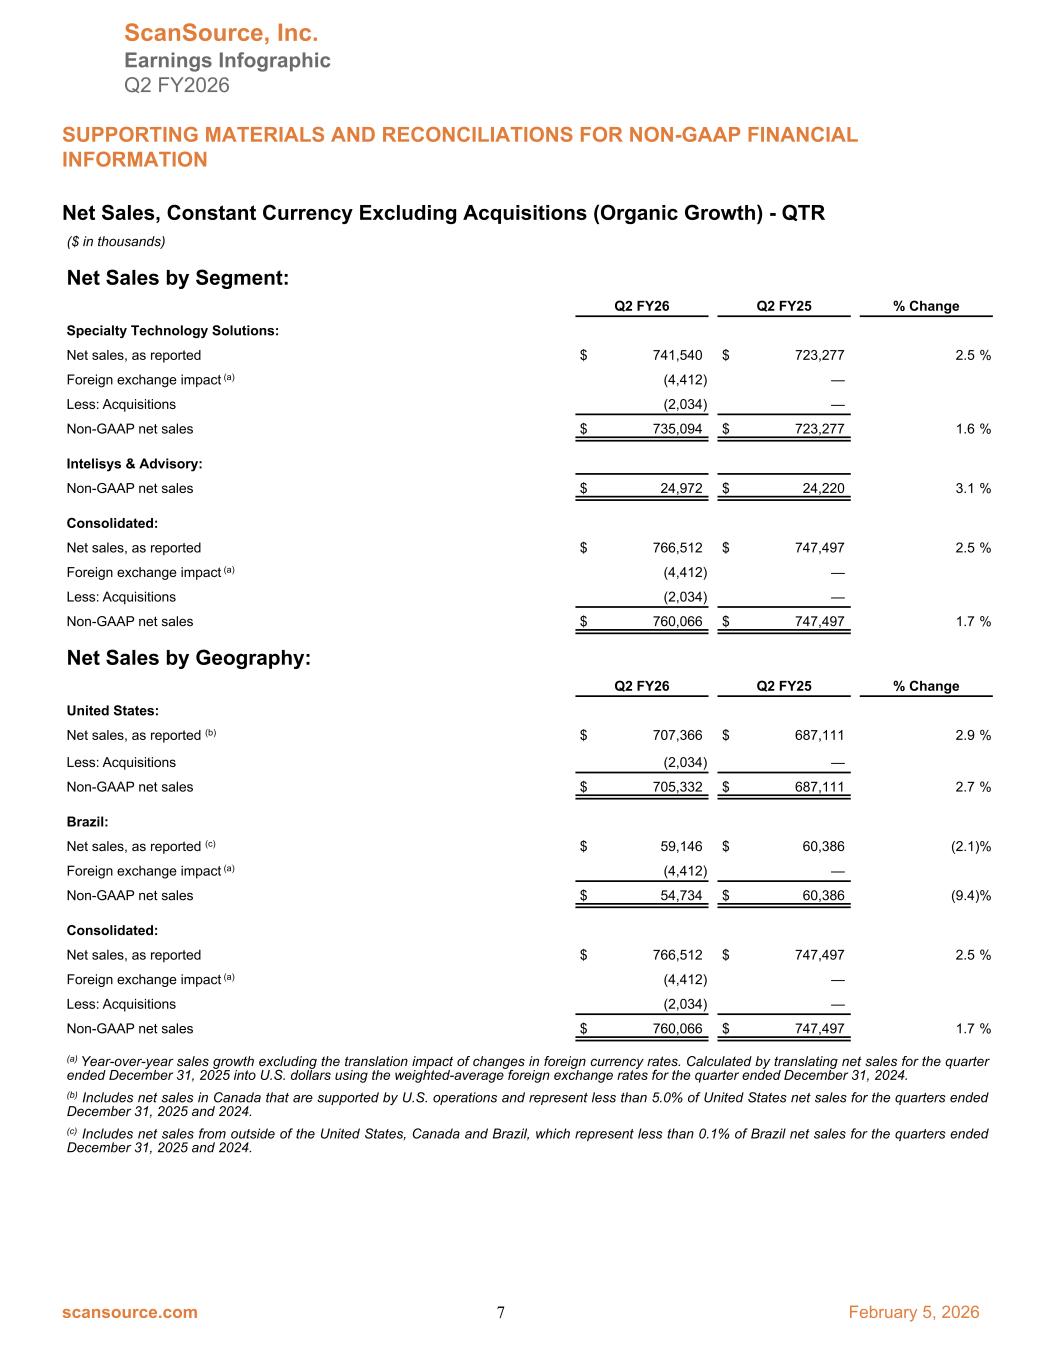
Okay. And in Brazil, I see it was down 90% organic this quarter. Anything new happening there? I know a year or two ago we lost Broadcom, but I was kind of surprised by how much that declined year over year.
Yeah, I don't think there's anything specific we can call out, but certainly we wish that market would recover. It's a market condition that we're in with all the other distributors in Brazil. From a market perspective, we feel like our management team is managing and pulling the levers that are under their control, whether that's managing expenses or whether that's managing inventories and bringing on new suppliers to replace the supplier that we lost. So, I think the management team is operating at a very high level, but it's a challenging market right now for the distribution segment in Brazil.
And that's a higher than company average gross profits, correct, in Brazil?
Yes, that's right. And I would say historically, I don't know how much we talked about it, Steve, but it would drop to the bottom line as well. It would be a higher profitability, Steve. Yeah, that's right.
I would say that a lot of their GP flows through. They manage costs very well, and a lot of that does flow through.
So that's certainly not helping your gross profit line either.
And then maybe help me understand a little bit more in terms of the launch that you did today in terms of one communications team. Perhaps can you describe how it was operating previously and how that's going to be different going forward?
Yeah, sure. So, we've been trying to figure this out for a while as to how do we have a partner, let's say it's a traditional communications partner, it might be a Mitel partner, Keith, or Shortel, or Vi, any of our communications heavy partners that were traditionally selling premise-based equipment and maybe not selling cloud yet, or maybe they're selling cloud, but the sales team at ScanSource under specialty was only selling them the hardware. And so if a Mitel partner wanted to buy some connectivity products or services or solutions, the scan source specialty seller would have to pass that on as a lead to someone on the IntelliSys team. So now we're going to have one team that can service that partner that will sell the IntelliSys products and the specialty hardware products to the same partner. So we're going to make it much easier for the partner. It's also going to give our communication hardware sellers a lot more to sell to their I think the partner community will love this idea. We're going to enable them. We're going to make it easier, and we believe this is going to create new solutions from suppliers that will see this as a very attractive way to reach more of the VAR community.
How are we going to see that in the income statement going forward? Are you going to move some of the communications down to the intelligence segment?
Hey, Keith, this is Steve. We'll wind up with the same reporting in our segment. That's a segment reporting discussion. This is more of a management alignment and a go-to-market discussion.
Yes, because again, let me finish that part of the description. I left out the end. There'll be IntelliSys employees that will be part of this virtual team, and they will sell hardware now. So, if you've got an IntelliSys agent that's working with an IntelliSys salesperson that reports into the IntelliSys management team, they'll now have the right model so they can sell hardware whereas in the past the Intellisys the Intellisys employee here at Scansource would flip that lead the hardware over to the hardware guys and that just wasn't working there was not the right incentives and opportunities so that's what's changing okay got it thanks guys good luck yeah thank you thank you you our next question or
Operator
A comment comes from the line of Guy Hardwick from Barclays. Your line is open.
Just wondering how much of the lowering of guidance is the absence of large deals versus the potential shortages of product that you mentioned.
Hey, guys, Mike. Yeah, I think our view right now, I think this is what I was trying to say earlier, is our guidance is relative to large deals, not to shortages. So we're not in our guidance indicating that there's going to be a shortage impact on our guidance. That's not what we're suggesting today.
Okay. And just as a follow-up, could you just kind of update us on the kind of competitive environment in the TSD market? I mean, it looks like the headcount additions of your competitors have already slowed quite sharply, and it's pretty much flat or down for the last six months. So, just wondering have things improved? Have you noticed any improvements in terms of the market or not yet?
Well, I think the overall While TSD space is very competitive and has been, as you know, for a while, we believe that there has been some changes in their approach to how they're going to grow their business organically, because we know that from a competitive standpoint, there's been a lot of acquisitive activity from the TSDs, and you've not seen that, of course, from IntelliSys, from ScanSource. So we believe that has come to a slow down, and now I think the opportunity and the pressure on all the TSDs is to grow organically. And that's why you hear us talking about new order growth, and that's what we believe is the right metric, because that will show that we can obviously, in some cases, take market share from the other TSDs, and that's reflected in the new order growth. But it also talks about improving the value proposition for the TSD, both in the eyes of the partner who's the seller, but also in the eyes of the suppliers because the suppliers, they need organic growth to happen, not just share shift among the TSDs. So we're very focused on organic growth and we believe that you will see a change in the market share between all the TSDs over the next year as we execute on our strategy.
Operator
Thank you. Again, ladies and gentlemen, if you have a question or comment at this time, please press star one one on your telephone keypad. Our next question or comment comes from the line of Adam Tyndall from Raymond James. Mr. Tyndall, your line is open.
Okay, thanks. Good afternoon. Mike, I just wanted to take a step back. I know we've gone through a lot of detail in this call, but if we take a step back and think we're two quarters into the fiscal year now, you're reducing guidance. if you were to rewind to your initial fiscal 26 plan, what would be sort of the biggest variance areas versus your expectations entering this year? I hear you on the large deals. I just want to push back. I mean, we would think that would be just kind of more of a timing issue throughout the course of the year. So if you were to kind of, you know, sit yourself back in the seat when you were entering this year versus, you know, now, what are kind of the key areas that maybe have been a little bit disappointing relative to your expectations that caused the reduction in guidance.
Yeah. Good morning, Adam. Well, let me go back to something I used to say a lot, is that our business is very hard to forecast. Orders come in today, they go out today. This is in the specialty business, which is where the challenge has been. So no news there that that's how that business has always worked. Very difficult to forecast what we're going to do beyond today. We get orders in today, we ship today, right? We don't work off of a backlog traditionally. We get information on large deals that will happen, but there's no guarantees when they'll actually ship. So, if I go back to, and to answer your question directly, Adam, if I go back and remember what we were saying back in August, we were saying, like the year before, this is going to be a second half loaded year. That we believe, and given annual guidance, is again not something that I enjoy doing, but we did because we have the last few years and so given annual guidance back in August with the visibility I have today I would have said well we probably should have forecasted the first half a little lower expecting the second half to be bigger and what we're trying to say now is the second half is going to show growth and the second in the in this guidance that you'll see like at the midpoint that's going to show that we're going to have modest growth year over year for the second half. For the year, that's not a great number, but if we can in the second half show growth, we believe we'll then build momentum going into 27. And that's the way
we've always built our business. Yeah, I understand. Trust me. I think we can fully empathize with the difficulty in forecasting. I think you're telling my boss that I need a raise. um exactly yeah exactly exactly exactly steve uh i i wanted to ask on the magnitude of the cut i mean um i think it makes a lot of sense for investors to kind of take the medicine now and you know rather than set uh expectations to climb back for the year let's just go ahead and reduce but on the magnitude um understand you don't guide you know on a quarterly basis necessarily but But, you know, relative to, I think, a lot of our expectations in the quarter of this guidance was reduced by kind of more than that annualized-ness, quote-unquote. How did you think about, you know, the magnitude of the guidance reduction? And I also noticed that I think you maintained free cash flow, so maybe touch on how you're able to do that.
Yeah, good morning, Adam. Yeah, a couple of things. When we look at the second half, we look at it a couple of ways, right? We're trying to take the information that we have from our customer base, what they're working on, and then we put that against – really, if you look back over our years and you look at first half versus second half of performance, and I'm thinking about the last two years, we've been kind of 49-51, 50-50, and so that's how we get confidence in – the second half looks a whole lot like the first half, a little bit of growth that we see coming because, again, we're thinking large deals are going to have to return. To your point before, it's been more of a push-out than it is a loss, and so that's what's really guiding our expectations. On the free cash flow, I think this comes back to the way we've changed our business model and the confidence we have in our business model, and this is what should happen if we're growing in that low single digits rate. So we have a lot of confidence in our team's ability to deliver that at least $80 million in free cash flow, which has a really good cash yield for us.
Yep, that makes sense. And you know I'm going to ask about capital allocation following that question, of course. Mike, I mean, you know, obviously, you know, one day is not necessarily a trend, but the stock's now hovering below book value. You know, does this, you know, obviously you're going to maintain free cash flow for the year, as Steve just mentioned, so you have some, you know, cash to work with. how are you thinking about priorities around capital allocation and does this
you know perhaps elevate share repurchase I think what we'd like to do as a management team and at our board level is talk about what are we trying to do on a three-year basis and our three-year goals we believe are still intact and we said that in our call and we believe if you look at a three-year goals we believe we can have we can have growth and from a gross profit perspective, which is where we've been saying we've got to focus on gross profit growth. To do that, we have to have some top-line help, there's no doubt about it. We believe that, for us, there's a combination of organic and inorganic that needs to happen on the growth side. At the same time, as we said, I believe we said our share repurchase authorization is still like $179 million, and the first half of this year we bought about $40 million in Steve, is that right? So, we believe that's indicative of our strategy, that our strategy hasn't changed this quarter. We hope our investors don't believe our strategy has changed. We hate to deliver news that's not what we expected, but again, if we think about this is a quarter, this isn't the year, and we wanted to be fair though to everyone about our expectations for this second half and make sure that we're not oversteering, and And we believe we're being – we have a – as you know, we have a strong history of doing our best to give our investors an accurate, clear view of what we know today. But our goal is let's keep our three-year strategic goals in mind, and we believe those are very strong. And again, as we look at the second half, based on our annual guidance that we've adjusted to, that's really very strong, even the margin for the year that'll come in consistent with what we're doing from a three-year goal perspective. And I think that's the important part is look at the metrics that will still deliver. This is a very strong company, excellent balance sheet with strong profitability.
I'm going to do one more. I think I might be last in the queue. So on Intellisys, I did want to ask, Mike, the dynamic of, I think, billing lagging new orders was something that sounded a little bit newer. I just wanted you to, you know, maybe double-click and help explain that dynamic. I mean, you've been operating IntelliSys for many years now. I could have missed it, but I don't recall hearing that dynamic much over the past number of years. So maybe just kind of double-click on what that was and what changed to drive that. And, Steve, is there any way to – and this is probably a difficult one – but to quantify that, the impact that that's having, and maybe when that, like, catches up, how we think about it in the financial statements?
Well, let me – the reason we started talking about new order growth was – I'm going to think back now, it was probably three years ago, Adam, that we started talking about this margin pressure, if you recall, the margin pressure that was happening at IntelliSys and in the TSD community as all the other TSDs started bringing in new ownership, PE investments, and there was a market share land grab, which drove margins down for IntelliSys, which drove down our revenue growth, right? And we would start talking, as you know, about our revenues, and we talked about end-user billings. And generally, the end-user billings were really, at the end of the day, a great metric for is this market growing, because we would have margin pressure that in a year or a quarter would reduce our growth because of just margin compression. But it looked like the TAM was slowing down or the opportunity was slowing down. That wasn't the case. So we decided a year ago that we needed to start being able to talk about new orders. If we can have a – and we decided not to give a number because we're in a competitive market against other private companies. And so we believe new orders growth faster than our revenues is indicative of what will come. And so this delay that happens, because if we close an order today, it may not get billed for 6 to 12 months from now, maybe even 15 months. And so it's this focus, Adam, on new orders that you won't see in the quarter that are indicative of future revenues. And that's why this pivot to that is important that we communicate it.
Yeah, Adam, this is Steve. I'll take the second half of that question, the impossible one to answer, right, is how do we know? Well, we believe, and I think the message to our investors is, as we invest, we're looking for the right ROI on those investments. So if you're hearing us continue to invest in IntelliSys and in that order growth, we believe that there's a good ROI on that, because this all has to hold together with our three-year goals and the goals that we've laid out and we're committed to. So that's the best way to think about, are we still confident that we're continuing to accelerate the new order growth? If we're still investing in there, our expectation is it's a good ROI and we continue to do it.
Very helpful, thanks, look forward to seeing you next month at our conference.
Operator
Yeah, thanks Adam. Thank you. I'm sure no additional questions in the queue at this time. I'd like to turn the conference back over to Mr. Steve Jones for any closing remarks.
Yeah, thank you, and thank you for joining us today. We expect to hold our next conference call to discuss March 31st quarterly results on Thursday, May 7th, 2026 at approximately 10.30 a.m.
Operator
Ladies and gentlemen, thank you for participating in today's conference. This concludes the program. You may now disconnect. Everyone, have a wonderful day. Speakers, stand by.