Operator
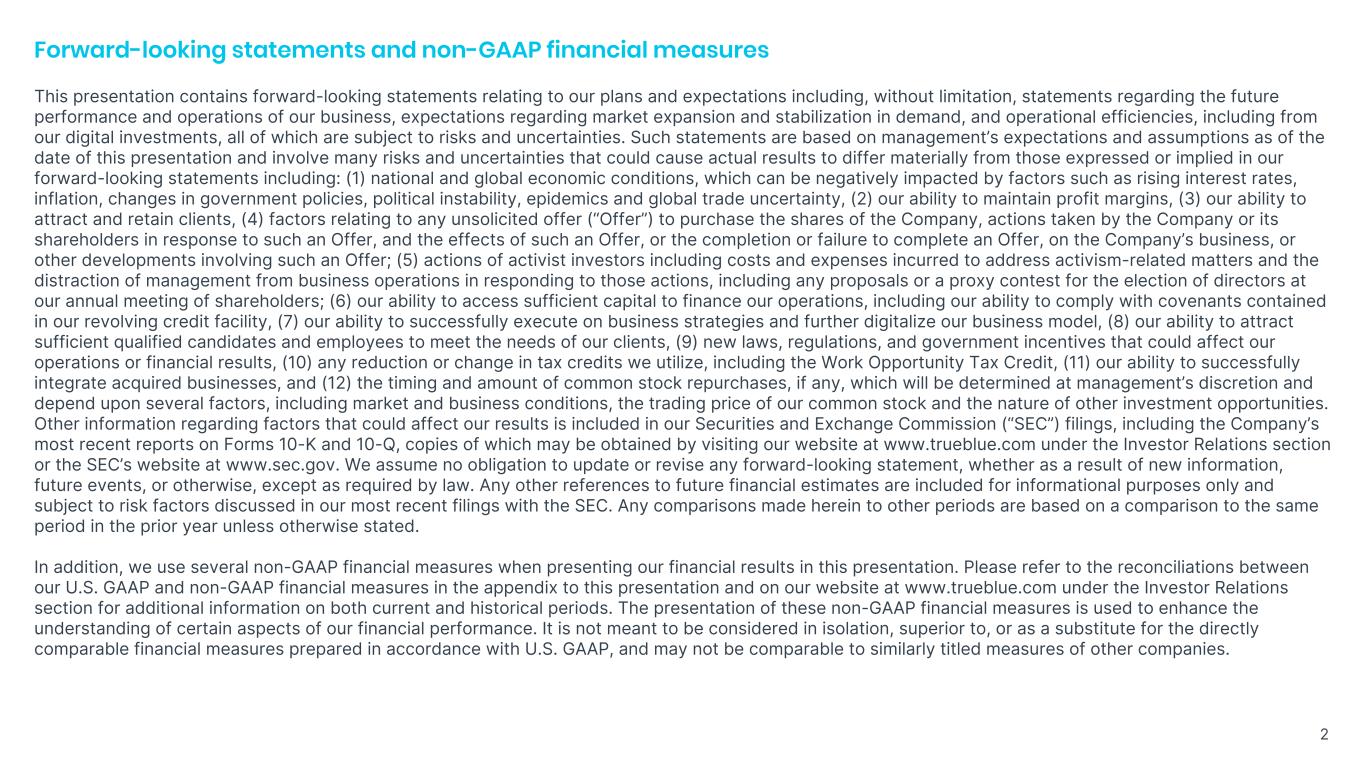
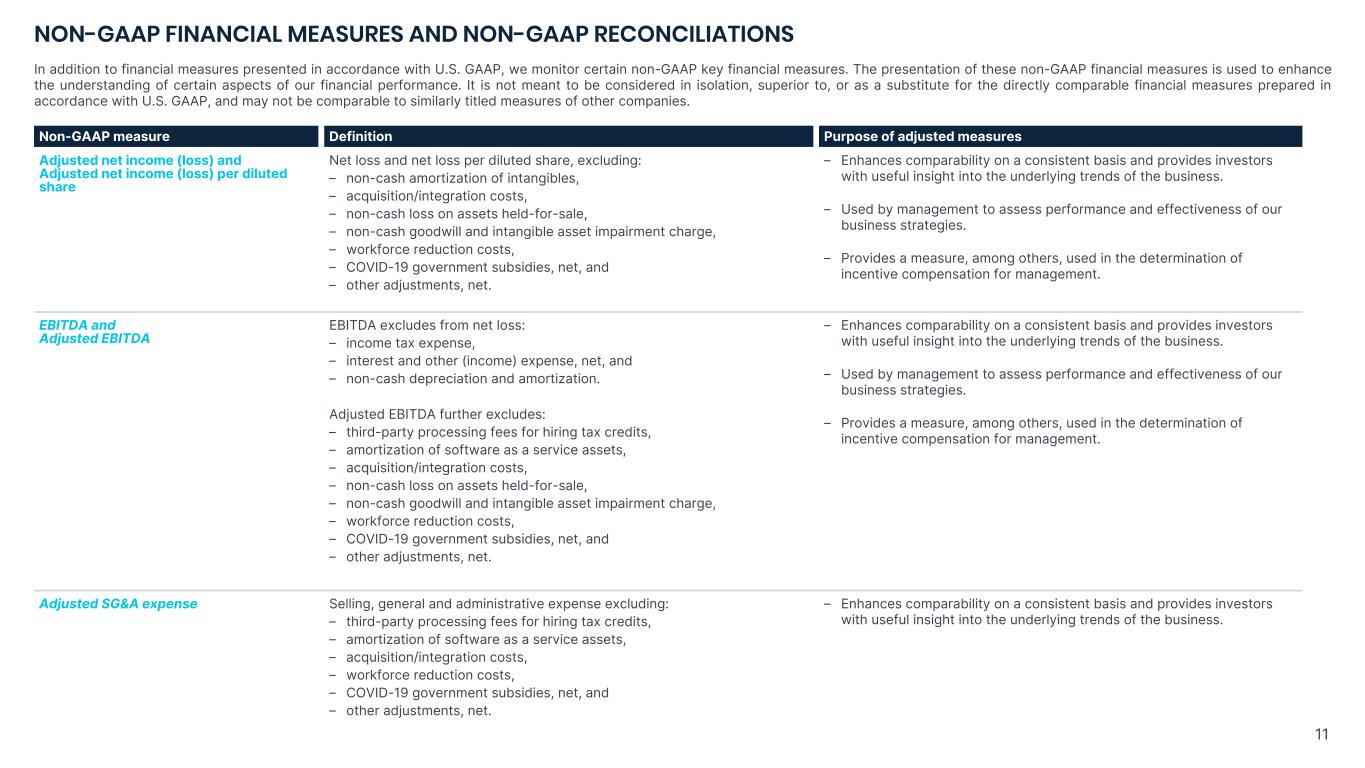
Greetings and welcome to the True Blue Second Quarter 2026 Earnings Call. At this time, all participants are in a listen-only mode. A question and answer session will follow the formal presentation. If anyone should require operator assistance during the conference, please press star zero on your telephone keypad. As a reminder, this conference is being recorded. At this time, I want to remind everyone that today's call and slide presentation contain forward-looking statements, all of which are subject to risk and uncertainties, and management assumes no obligation to update or revise any forward-looking statements. These risks and uncertainties, some of which are described in today's press release and SEC filings, could cause actual results to differ materially from those in the forward-looking statements. Management uses non-GAAP measures when presenting financial results. You are encouraged to review the non-GAAP reconciliations in today's earnings release or at TrueBlue.com under the Investor Relations section for a complete understanding of these terms and their purpose. Any comparisons made today are based on a comparison to the same period in the prior year, unless otherwise stated. Lastly, a copy of the company's prepared remarks will be provided on True Blue's investor website at the conclusion of today's call, and a full transcript and audio replay will be available soon after the call. It is now my pleasure to turn the call over to Taryn Owen, President and Chief Executive Officer. Please go ahead.
Thank you, Operator, and welcome everyone to today's call. I'm joined by our Chief Financial Officer, Carl Schweiss. We delivered a strong second quarter, exceeding expectations and continuing to build momentum through disciplined execution. We achieved double-digit top-line growth for the quarter with continued expansion in skilled verticals, and a return to growth in our general on-demand business as our strategy takes hold in a meaningful way. Behind this performance is a clear set of strategic priorities we have been steadily advancing across the business. Our focus is straightforward, strengthening our sales model, expanding in attractive markets, and driving efficiency through technology and disciplined operations to deliver sustainable, profitable growth. Strengthening our sales function continues to be a top priority, and we are seeing positive momentum with the improved trends across our portfolio, including a return to growth in our on-demand business. We have transitioned our on-demand operating model to a more effective territory-based structure and invested in sales resources throughout the business to expand our reach in priority markets. We continue to strategically increase sales capacity to enable more targeted, localized sales strategies and deeper client engagement. Together, these actions are strengthening execution and positioning us to drive further scalable growth. Enterprise-led partnerships and cross-selling initiatives are creating a practical growth advantage. Our strategic partnership program continues to open new client channels with a strong multi-brand pipeline, while greater collaboration across our enterprise is driving more cross-selling opportunities to deepen relationships and expand with existing clients. These efforts are allowing us to better leverage the full breadth and strength of our workforce solutions to support continued growth. Our strategic focus on attractive and market expansion continues to deliver strong results. We are capturing demand in skilled verticals supported by our strong market position and deep expertise. Our revenue in the energy sector nearly doubled, marking a fifth consecutive quarter of growth, while our commercial driver business grew for the 10th consecutive quarter. This sustained growth speaks to our success capturing share in target markets with powerful growth drivers that play to our strengths. We see additional opportunity ahead as structural labor shortages and growing secular forces signal further growth potential, especially as we expand into adjacent subsectors like data centers and energy storage facilities. As we pursue more resilient, higher-value demand, the government and healthcare verticals represent attractive long-term growth opportunities to further diversify our business. We are making meaningful progress in the government sector as we continue to build momentum and expand our market share. In the U.S. healthcare market, we are thoughtfully scaling as we leverage our deep expertise, recruitment agility, and sophisticated technology to capture sustained demand. While advancing our strategic priorities for top-line growth, we are equally focused on delivering improved profitability. We are operating with discipline, managing costs, driving efficiencies, and leveraging technology to scale. These efforts are producing results as we reduced total operating costs, even as revenue grew double digits for the quarter, and all three segments delivered increased profitability with expanded margins. This improved operating leverage, combined with continued cost discipline, positions us well for sustainable margin expansion as we advance our growth strategies. Our portfolio of proprietary technology platforms is a key enabler of our ability to drive efficiency and extend our reach. We continue to enhance our digital ecosystem with AI-powered features across the talent lifecycle, allowing us to connect people and work with speed, precision, and transparency. Continued innovation and advancement of our digital transformation remain the priority, positioning us to deliver greater value to the customers and talent we serve with a differentiated experience while supporting operational efficiency as we accelerate growth. The progress we are seeing today reflects our disciplined execution of our strategy, and while we are encouraged by the results, there is still more work ahead. We remain committed to realizing long-term, sustainable value for our shareholders, and we are confident our strategic plans to enhance our sales model, expand our share in attractive and markets, and unlock efficiencies with technology and operational excellence positions us well to capitalize on the growth opportunities ahead. I will now pass the call over to Carl, who will share further details around our financial results and outlook.
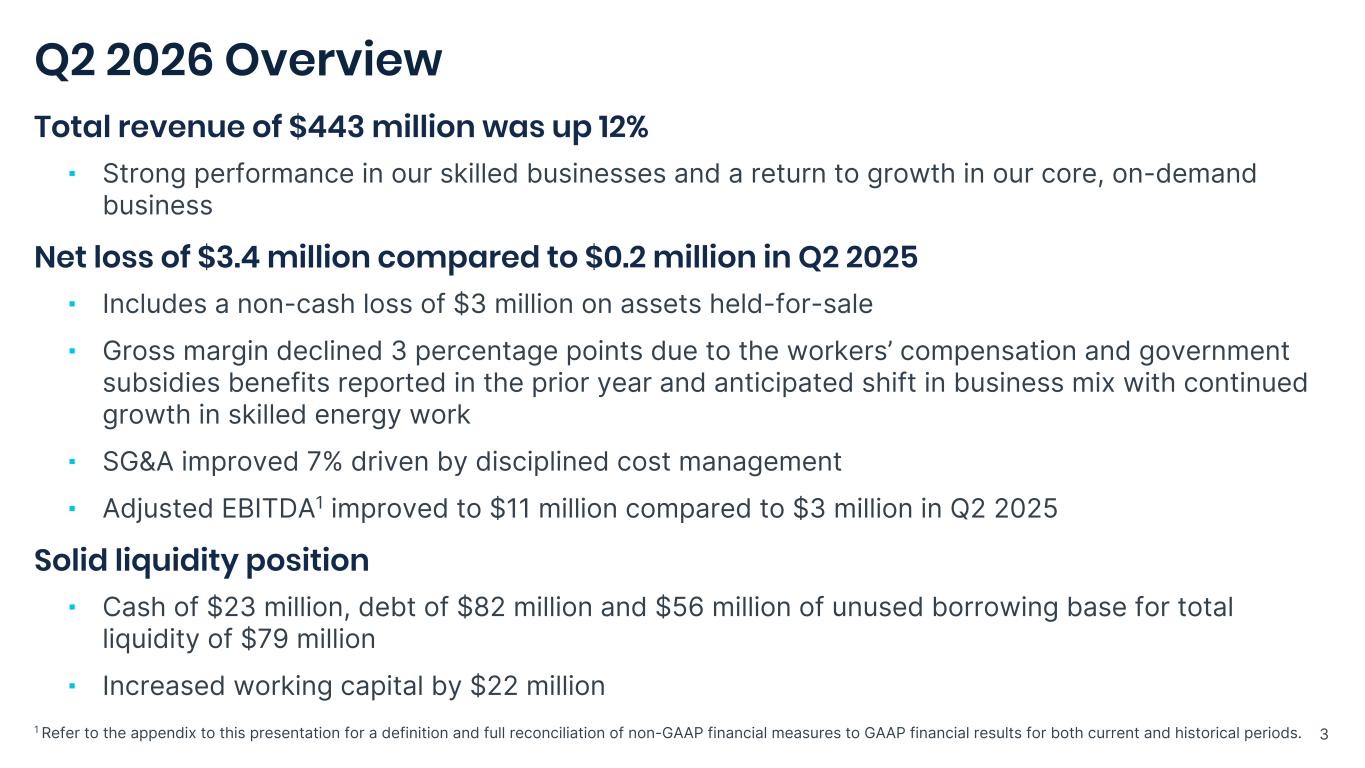
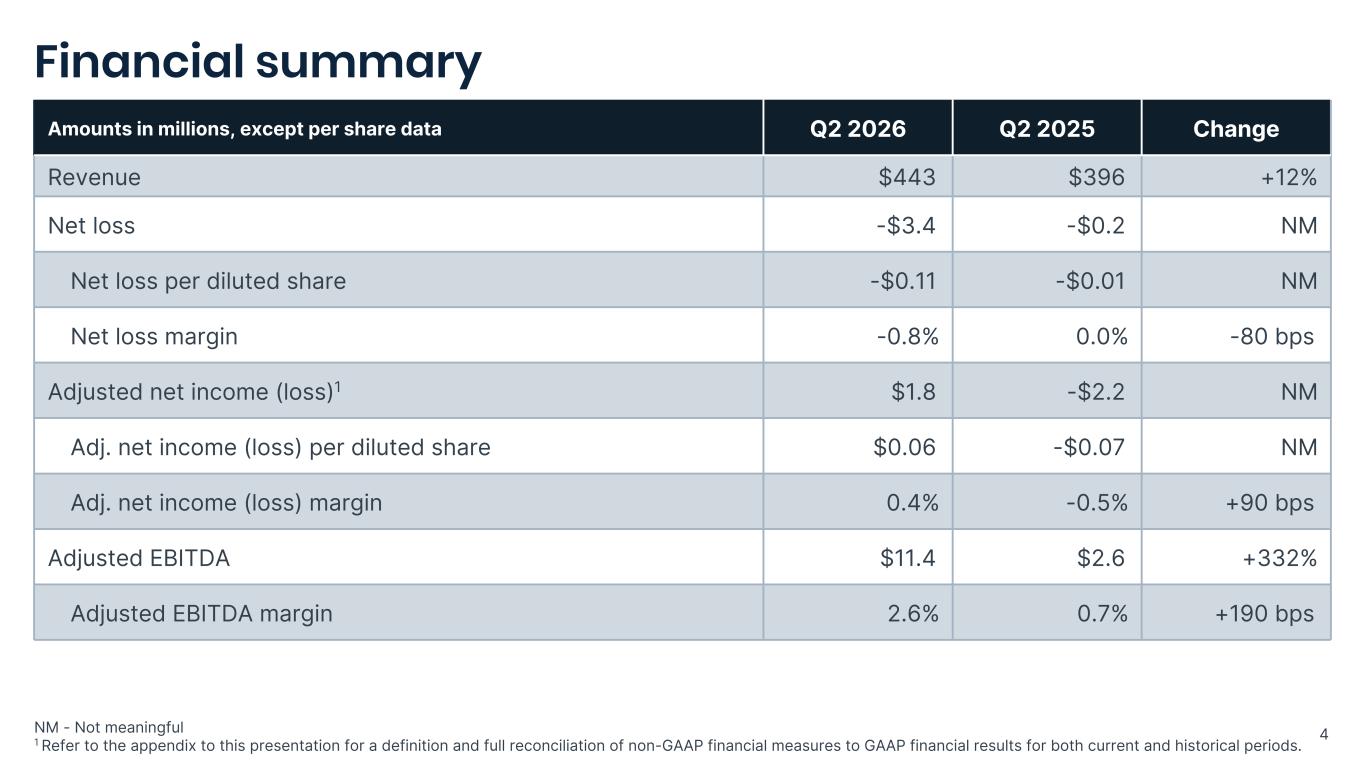
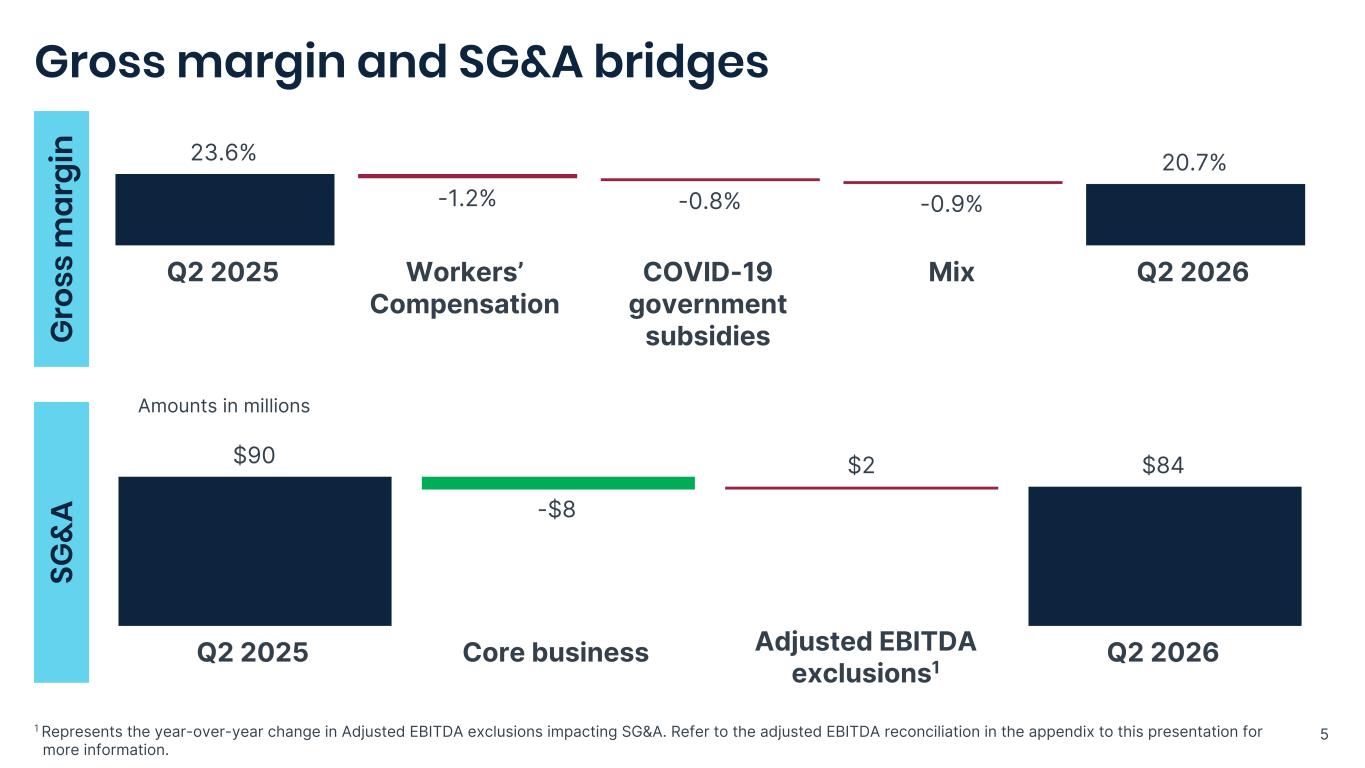
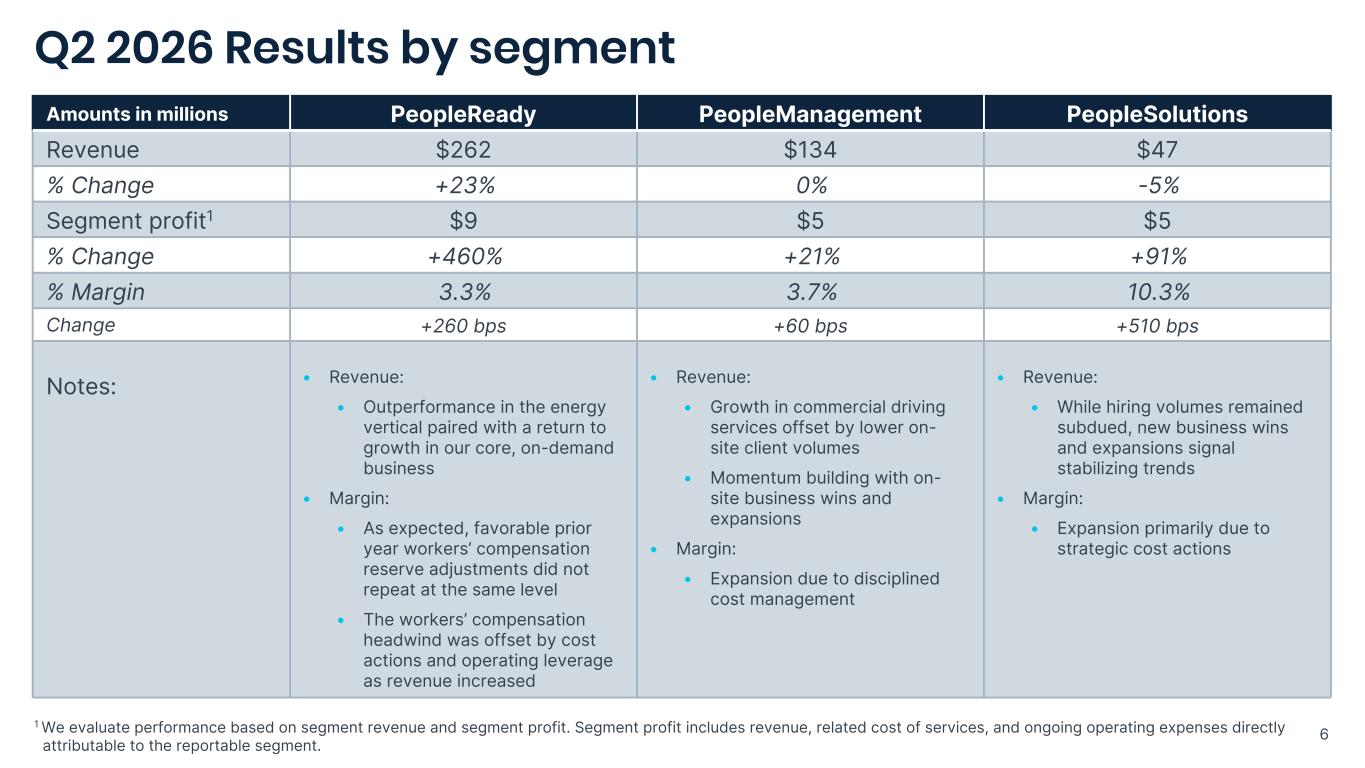
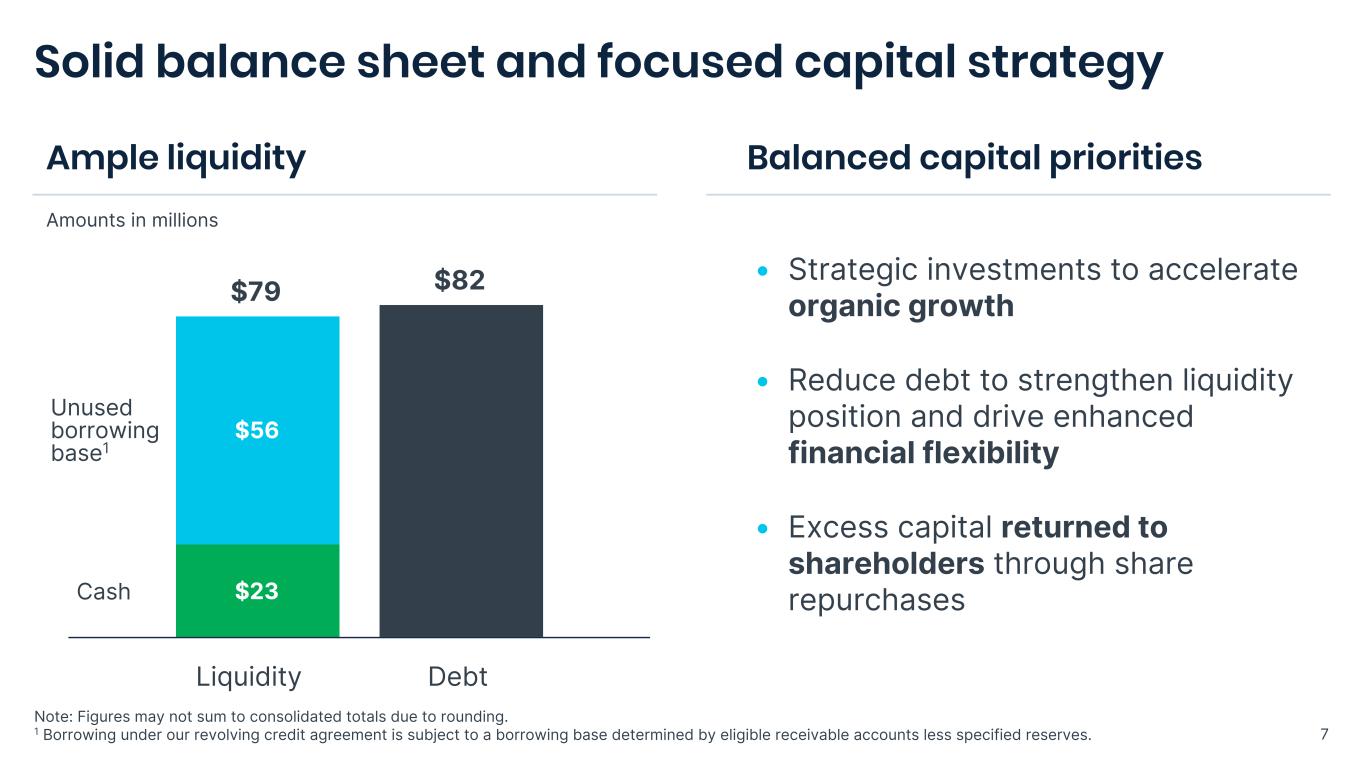
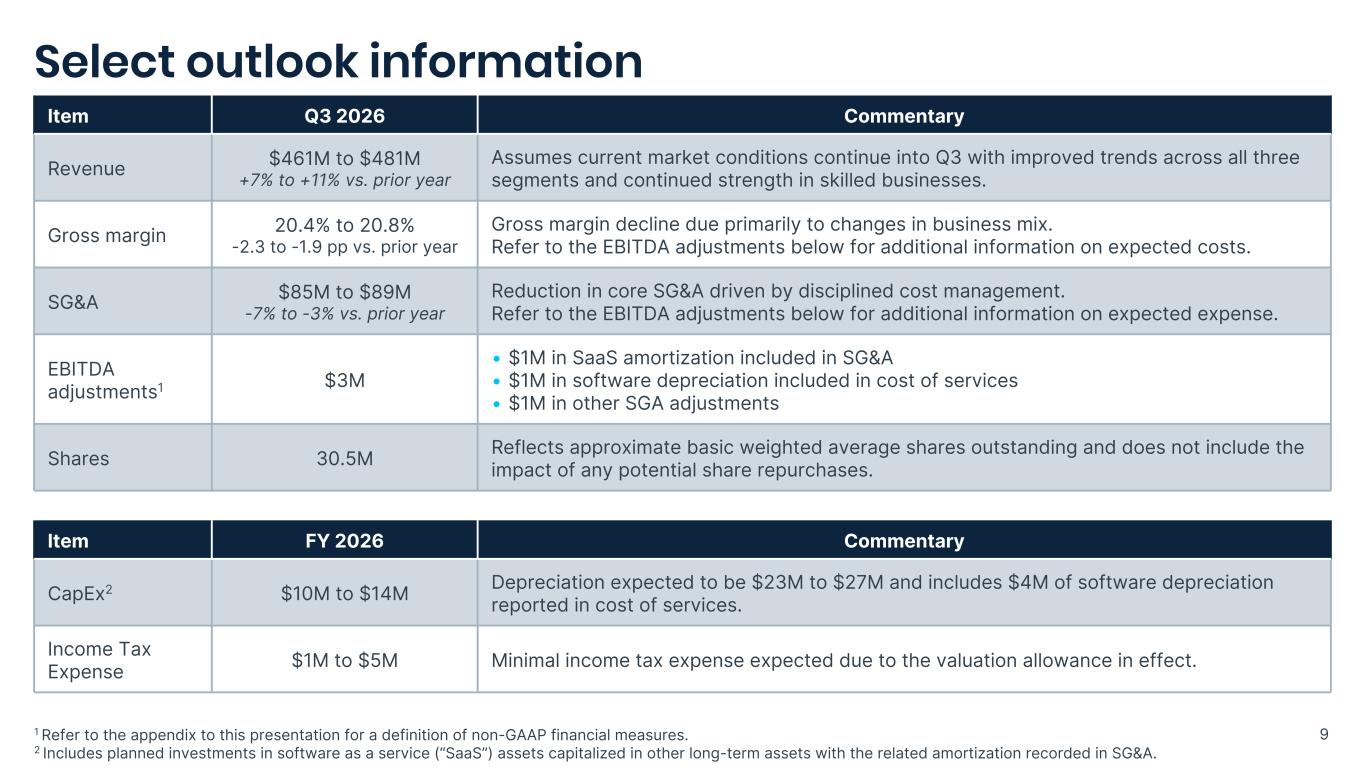
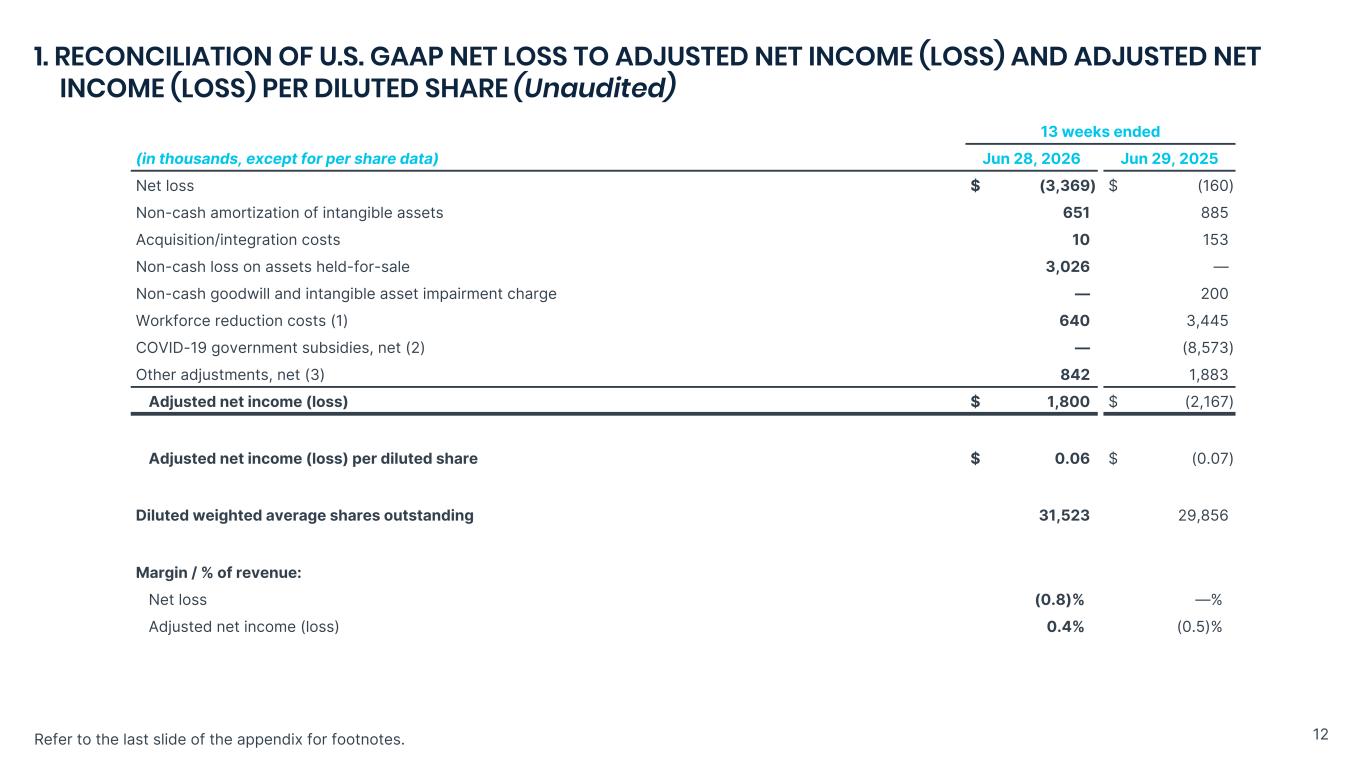
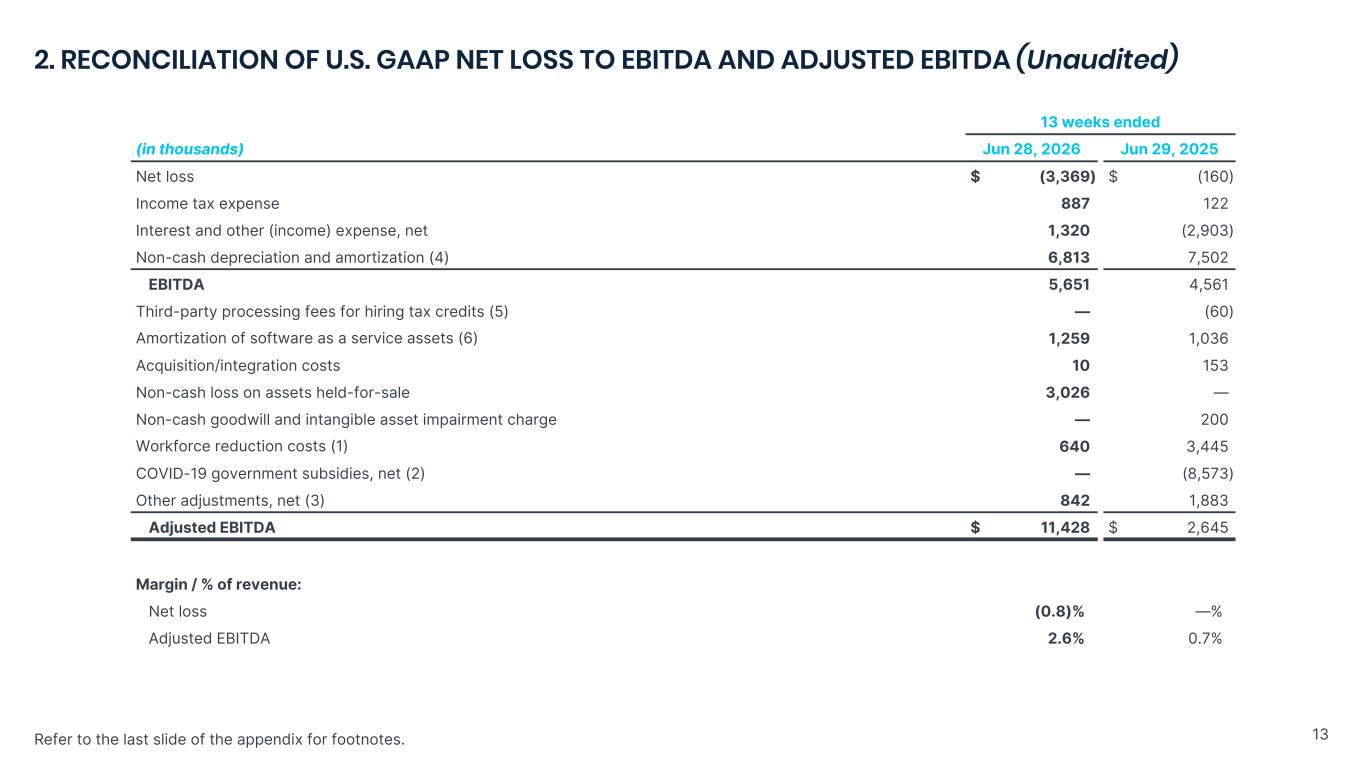
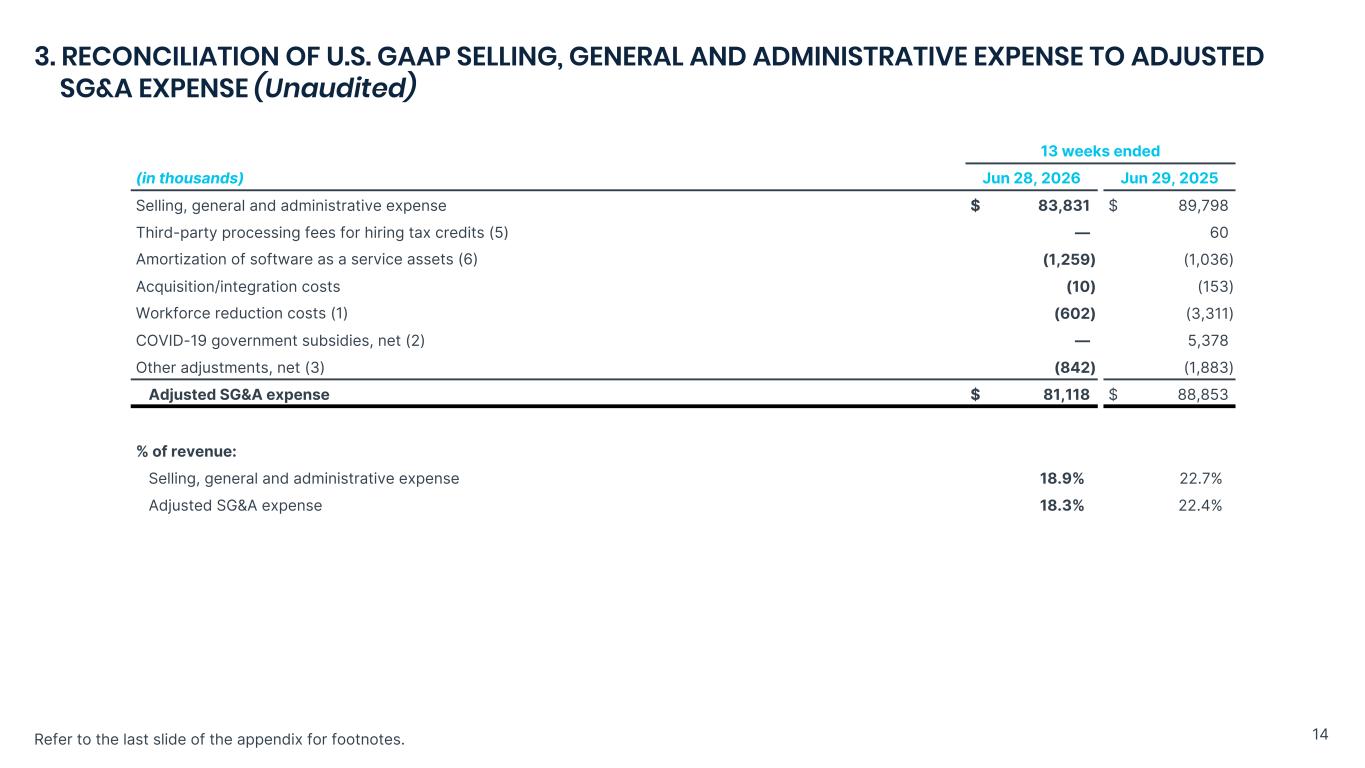
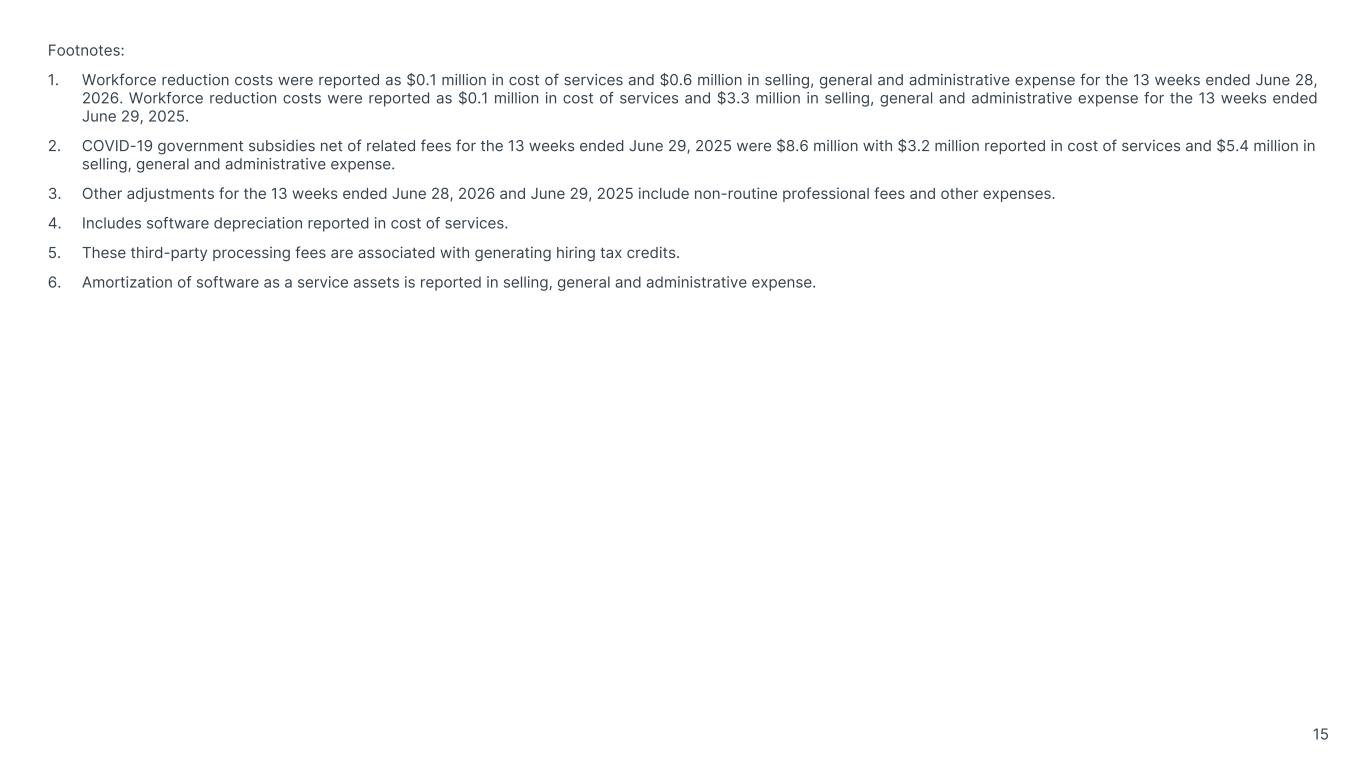
Thank you, Taryn. Total revenue for the quarter was $443 million, up 12% and exceeding our outlook range due to outperformance of our skilled businesses. Our teams continue to capture share in high-demand skilled verticals, delivering a fifth consecutive quarter of double-digit growth. As demand for skilled trades remains strong, we are encouraged to see broader demand trends continue to stabilize and our strategic focus taking hold with our on-demand business returning to growth this quarter and driving solid momentum as we enter the back half of the year. Gross margin was 20.7% for the quarter, down from 23.6% in the prior year period, primarily due to the known workers' compensation and government subsidy benefits in the prior year, as well as anticipated changes in revenue mix. You may recall that last year's gross margin benefited from a significant reduction in workers' compensation costs due to favorable development of prior year reserves. As expected, that degree of favorability did not repeat this year. The prior year margin also included a non-reoccurring government subsidies benefit of $3 million. The revenue mix impact stems from outsized growth in PeopleReady energy work. As a reminder, the underlying margin for energy work is consistent with other large PeopleReady accounts, but the pass-through travel costs involved result in lower reported gross margin. We successfully reduced SG&A by 7% while revenue grew 12% for the quarter, demonstrating improved operating leverage and our continued focus on delivering enhanced profitability. We've made significant progress and continue to effectively manage costs, drive efficiencies, and create greater flexibility to scale. This operational discipline positions us well to deliver strong, incremental margins as industry demand improves and we continue to advance our growth initiatives. We reported a net loss of $3 million this quarter, which included a $3 million non-cash write-down of our Tacoma headquarters as a result of the challenging commercial real estate market. Our results also included a small amount of income tax expense primarily associated with our foreign operations and essentially zero income tax benefit on U.S. operations due to the valuation allowance in effect on our U.S. deferred tax assets. As a reminder, the asset write-down and valuation allowance have no impact on our operations or liquidity. Adjusted net income was $2 million compared to a loss of $2 million in the prior year, and adjusted EBITDA was $11 million for the quarter, up from $3 million in the prior year. Now let's turn to our segments. People-ready revenue grew 23%, largely driven by outperformance in the energy vertical. Revenue in the energy sector nearly doubled this quarter as we continue to capture share in this growing market. While demand in skilled verticals has continued to rise, we were also encouraged to see our on-demand business return to growth this quarter. These improved trends in our on-demand business speak to the momentum building behind our growth strategy as we continue to invest in sales resources and expand our market reach. Despite the prior year benefiting from significant favorability in workers' compensation adjustments, PeopleReady's segment profit margin was up 260 basis points year-over-year, driven by targeted cost actions and improved operating leverage as revenue increased. People management revenue was flat to the prior year, as growth in commercial driving services was offset by lower on-site volumes. Our commercial driver business continued to outperform the broader market, leveraging strong client relationships and deep expertise to deliver its 10th consecutive quarter of growth. While on-site client volumes declined for the quarter, trends improved each month with a return to growth in June as new business wins and customer expansions built momentum, positioning the business well entering the back half of the year. People management segment profit margin was up 60 basis points due to disciplined cost management actions to drive improved efficiencies and greater scalability. People solutions revenue declined 5% as broader market conditions continue to curve hiring trends. While hiring volumes remain subdued, we are adding new clients and expanding existing relationships, particularly in higher skilled roles and growing end markets with long-term secular tailwinds. We were encouraged to see signs of stabilization with improved trends as we exited the quarter, along with growing momentum in new business, positioning us well to accelerate growth as client hiring volumes return. People Solution Segment Profit Margin returned to double digits this quarter, up 510 basis points from the prior year, driven by deliberate cost actions to deliver efficiencies and improve profitability. Now let's turn to the balance sheet. We finished the quarter with $23 million in cash, $82 million of debt, and $56 million unused on our borrowing base, resulting in total liquidity of $79 million. During the quarter, stronger-than-anticipated revenue growth drove an increase in working capital of $22 million, while our expanded profitability led to improved leverage ratio, demonstrating the strength of our operating model and driving enhanced financial flexibility. We remain committed to managing a strong liquidity position and financial foundation to ensure we are well-positioned to capitalize on growth opportunities ahead. Looking ahead to the third quarter, we expect revenue growth of 7% to 11% year-over-year, as we continue to build momentum with improved trends across all three segments and sustain growth in our skilled businesses. We expect steady sequential gross margin and disciplined cost management to continue driving improved profitability. Additional information on our outlook can be found in our earnings presentation shared on our website today. Before we open the call up for questions, I want to turn it back over to Taryn for some closing remarks.
Thank you, Carl. As you've heard today, we are seeing meaningful progress across each of our strategic pillars, translating into improved results. We are strengthening our sales model, expanding in attractive markets, and driving efficiency through technology and disciplined operations to deliver sustainable, profitable growth. As we continue to execute with focus and consistency, I am confident in our path forward and our team's ability to deliver results and advance our mission to connect people and work. This concludes our prepared remarks. Operator, please open the call now for questions.
Operator
Thank you. We'll now be conducting a question and answer session. If you would like to ask your question, please press star 1 on your telephone keypad. A confirmation tone will indicate your line in a student question queue. You may press star 2 to remove your question from the queue. For participants using speaker equipment, it may be necessary to pick up your handset before pressing the star keys. One moment, please, while we poll for questions. Thank you. Our first question is from Mark Riddick with Sidoti & Company.
So there's certainly some encouraging things here to talk about, but I was wondering if you could talk a little bit about the overall sort of demand environment and what you're seeing there, whether you kind of feel as though we're at that positive inflection point at this point or do you sense it's maybe a little too early to call that a trend? I think you're prepared to make some commentary around monthly trends improving and people management, but maybe you could talk a little bit about the demand front and maybe talk a bit about sort of how you're feeling about that.
Thank you for the question, Mark. We are encouraged by what we're seeing in the market, but more importantly, our strategy is driving results. As we mentioned, our core on-demand business returned to growth in the second quarter, driven by our sales territory strategy. People Ready On Demand exited the quarter with all four regions growing, and a majority of our territories are now in growth for the year. We're also seeing our in-market strategy take hold. Energy revenue nearly doubled this quarter as we continue to capture share in high-value verticals that play to our strengths. Our deliberate focus on our strategic priorities and discipline execution positions us really well to continue taking share as the market conditions improve.
And just to build on that, Mark, with a few data points, what's most encouraging is that the recovery is broad-based, spanning many geographies rather than what we talked about in Q1 with a few isolated markets that we saw previously. The strength was really led by our West region and California with Florida and Texas improving as well, really a broad set of our largest markets all moving in the right direction. And most importantly, we delivered it profitably. Double-digit top-line growth alongside expanded margins in all three segments and meaningfully higher adjusted EBITDA.
Excellent. And then maybe you could talk a bit about the pacing of energy there. Things are doubled over the quarter, but was that consistent through the quarter? Did it accelerate? How do we think about the pacing of that and then how you see things currently?
Yeah, thanks for that, Mark. Just as we think about kind of people-ready revenue trends, they did improve throughout the quarter, really driven by that continued strength in our skilled businesses, as well as that return to growth and on-demand. I'd say people ready exited Q1 at plus 16% and then accelerated to exit Q2 at plus 30%. Really kind of monthly trends were improving throughout the quarter. Within people management, I'd say it followed a similar improving trajectory. We moved from about minus 7 exiting Q1 to plus 4 exiting Q2 with steady improvements within the monthly trends. July trends, I'd say, have been similar to how we exited the quarter, and our outlook reflects our typical seasonal build in Q3.
And, Mark, if I could just build a little bit on energy. We are seeing strong interest in data centers, and that's part of a broader trend. Energy overall continues to be one of our fastest-growing verticals, and that strength is showing up across all three of our segments, not just one part of the business, which speaks to how deep our presence in this space has become. And as a matter of fact, we just signed a new deal this week with a large battery storage provider through our People Scout business, which reflects momentum that we have in this area.
Okay, great. And then maybe one more, if I could. In the prior quarter, you talked about the benefits of the strategic partnership and the activity there, if I remember correctly. There was about $11 million in annualized business in the first quarter, and I think you talked about some new relationships there. Maybe you could talk a bit about how those are going and if there are any additional activities there with those partnerships.
Yes, thank you for the question. They're progressing very well. Strategic channel partnerships have become an important way that we have extended our sales reach to accelerate growth. Our partnership with the leading group purchasing organization that we spoke about previously is one example of that strategy within a broader strategy. That partnership is continuing to build momentum. We're encouraged by the pipeline that we're filling, which we expect will contribute to our growth going forward. Despite the long-term nature of these partnerships, they are already producing results. The wins we highlighted previously are now converting to revenue. As you can see, that show up in our stronger results this quarter. And then finally, another example of our strategic partnership approach is the landmark U.K. Armed Forces engagement that we announced previously. And just as a reminder, that work is ramping now, and we expect it to reach full value in 2027.
Okay, great. And then last one for me. I was wondering if you touched a little bit in your prepared remarks around digital transformation adoption for clients, and maybe talk a little bit about what you saw through the quarter, whether it was through JobStack or sort of where those activities lie, given the bit of uncertain macro, but maybe you can talk a little bit about what you saw with client activity and both digital demand, AI-type adoption.
Yeah, I'll get us started here. Thanks for the question. We're leaning into AI across our proprietary platforms. So that's Jobstack, Affinix, and StaffTrack, and it's showing up in our metrics with an all-time high time to fill, fewer manual steps, and a more consistent experience for our clients and our talent that we're serving. We are a people business at our core. So for us, this is about productivity enablement, helping our teams work more efficiently and effectively, which, again, is showing up. You know, I would say what sets us apart here, Mark, from a fragmented field of regional and digital-only players is the combination that we have of our national network and local presence combined with the digital tools and support that those tools provide to our team.
Operator
Our next question is from Kartik Meta with North Coast Research.
Hey, good afternoon. Carl or Taryn, maybe just looking at the operating leverage as we look over the next couple quarters, I think you've been able to leverage SG&A even though you're investing in sales. And I'm wondering, as you look at the next couple quarters, what you think incremental margins for the business could be?
Yeah, thanks for the question, Kartik. I will say, look, we're in our fourth consecutive quarter of growth. We continue to expand this quarter, double-digit top-line growth, and we've continued to decline from an SG&A perspective. We're guiding the Q3 to be very similar. You know, I'd say we continue to remain very disciplined in managing costs. It's core to how we operate. Our ongoing work to optimize our fixed cost base as well as enhance the digital capabilities that Taryn just mentioned, they give us room for additional revenue growth while protecting our margins. So we'll continue to invest selectively where we see some opportunities to drive incremental growth. And as demand improves, we believe that lean cost structure positions us for meaningfully incremental margins going forward. I'd also say if you just look at kind of the drop-through rates, i.e., the percentage of, you know, adjusted EBITDA that we get from our gross margin dollars, steady improvement here in Q2, and expect that to expand in Q3 and going forward.
Carl, then maybe just as you look at the business segment, kind of maybe your expectations for the third quarter. I know you gave some color on a couple exit rates, so I'm wondering if you'd give your perspective on what your expectations are for the quarter for your segment.
Yeah, so, you know, we have – we tightened our range here a little bit from plus 7 to plus 11, so feel good about kind of where our guide is from an overall perspective. perspective, that includes kind of, and I'll use, you know, ranges here for our people ready business from plus 11 to plus 15 people management from plus three to plus eight and people solutions from minus six to plus three. You know, we feel good about kind of where we've been able to perform and we always look to outperform or go to the, you know, upper end of our guidance.
Perfect. Thank you very much. I really appreciate it.
Operator
Thank you. There are no further questions at this time. I'd like to hand the floor back over to Taryn Owen for any closing comments.
Thank you, Operator, and thank you, everyone, for joining us today. I want to take this opportunity to thank the entire True Blue team for their tremendous efforts executing on our enterprise strategy and their commitment to advancing our mission to connect people and work. We look forward to speaking with you at upcoming investor events and on our next quarterly If you have any questions, please don't hesitate to reach out.
Operator
This concludes today's conference. You may disconnect your lines at this time. Thank you again for your participation.