Operator
Ladies and gentlemen, thank you for joining us and welcome to the Thrive Second Quarter 2026 Earnings Call. After today's prepared remarks, we will host a question and answer session. If you would like to ask a question, please press star 1 to raise your hand. To withdraw your question, press star 1 again. I will now hand the conference over to Cameron Lessard, Senior Vice President of Corporate Development and Strategy. Cameron, please go ahead.
Good morning, and thank you for joining us for Thrive Holdings' second quarter 2026 earnings conference call. With me today are Joe Walsh, Chairman and Chief Executive Officer, Grant Freeman, President, and Paul Rouse, Chief Financial Officer. Before we begin, I'd like to remind you that today's call may contain forward-looking statements, including statements about our business outlook and strategy, future financial results, growth prospects, and other matters that are not historical facts. These statements are subject to risks and uncertainties, and our actual results may differ materially. Please refer to our most recent filings with the SEC for a discussion of factors that could cause our results to differ materially from these forward-looking statements. We do not undertake any obligation to update these statements. In addition, today's discussion will include references to non-GAAP financial measures. Please refer to the press release we issued this morning for a reconciliation of our non-GAAP measures to the most comparable GAAP measures. The press release and investor presentation are available in the investor relations section of our website at investor.thrive.com. With that, I'll now turn the call over to Joe Walsh.
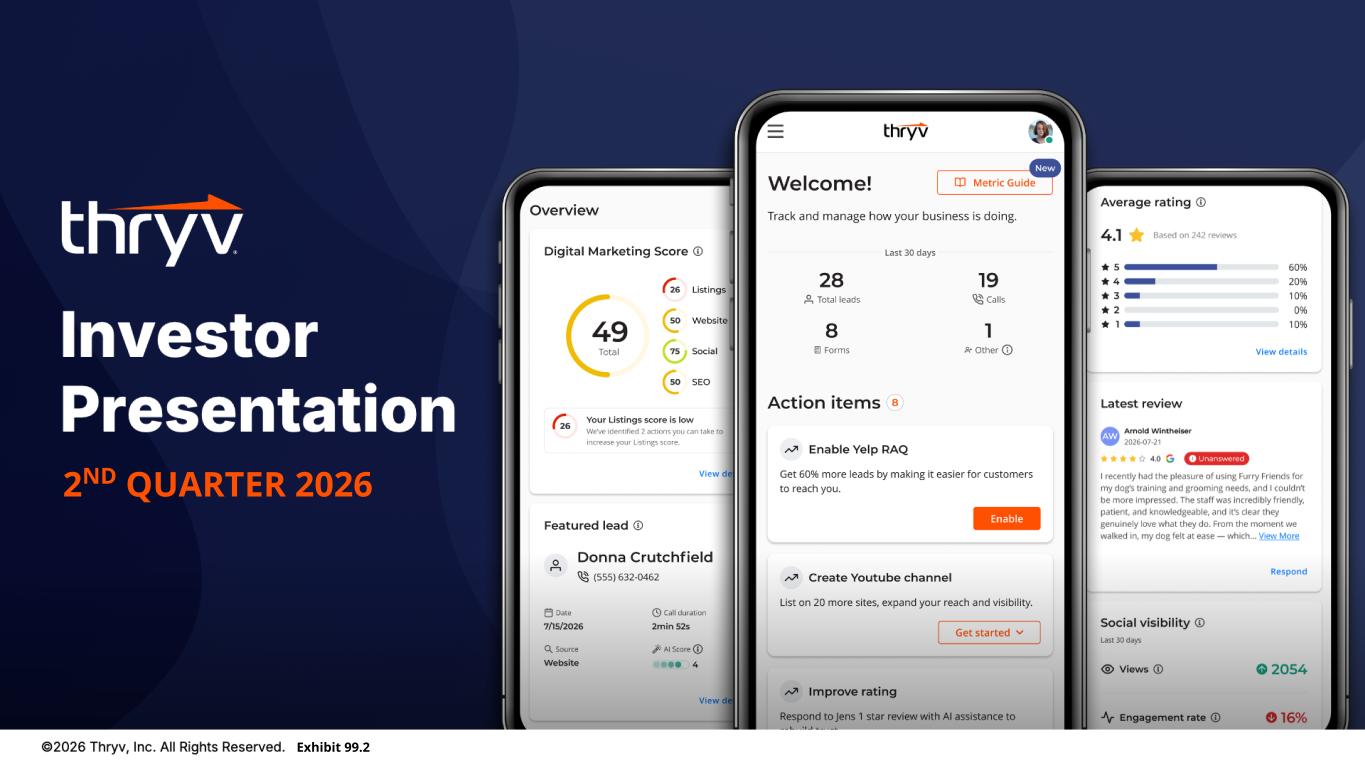
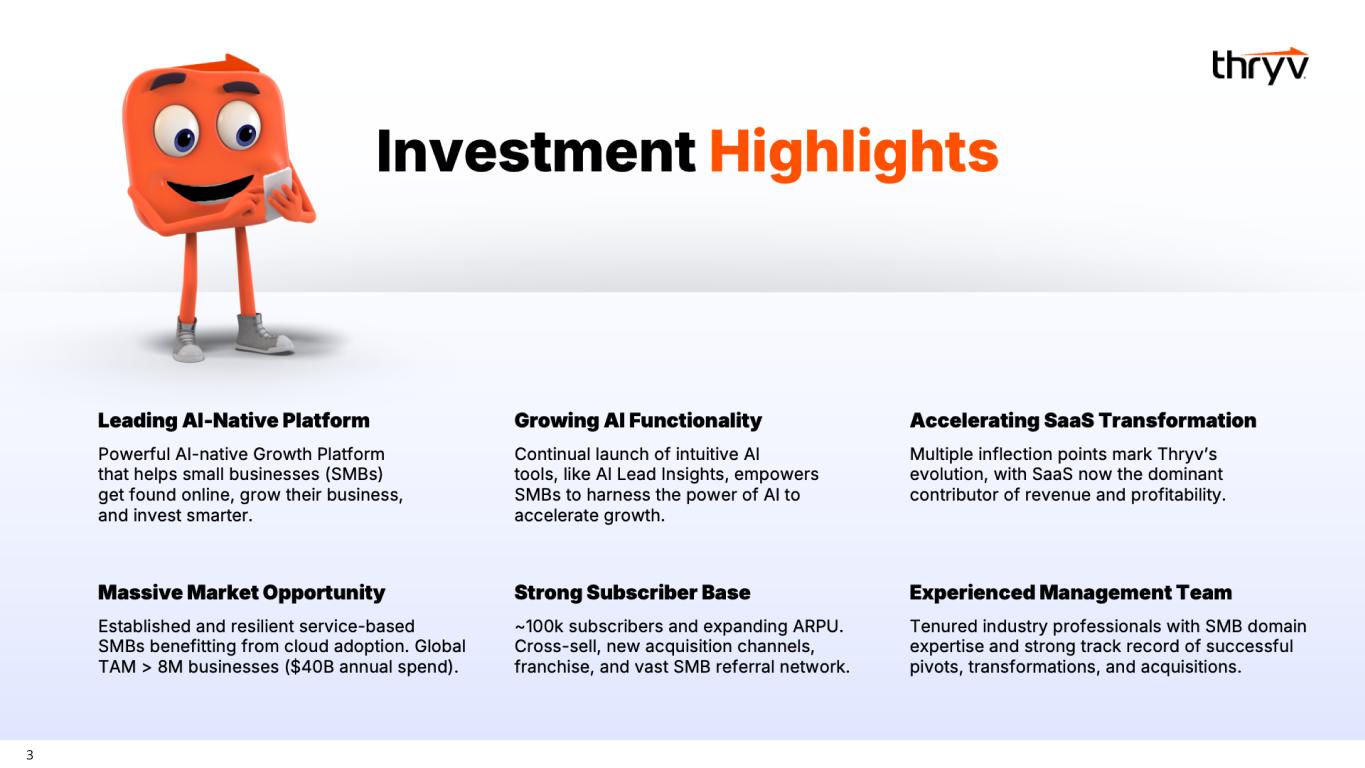
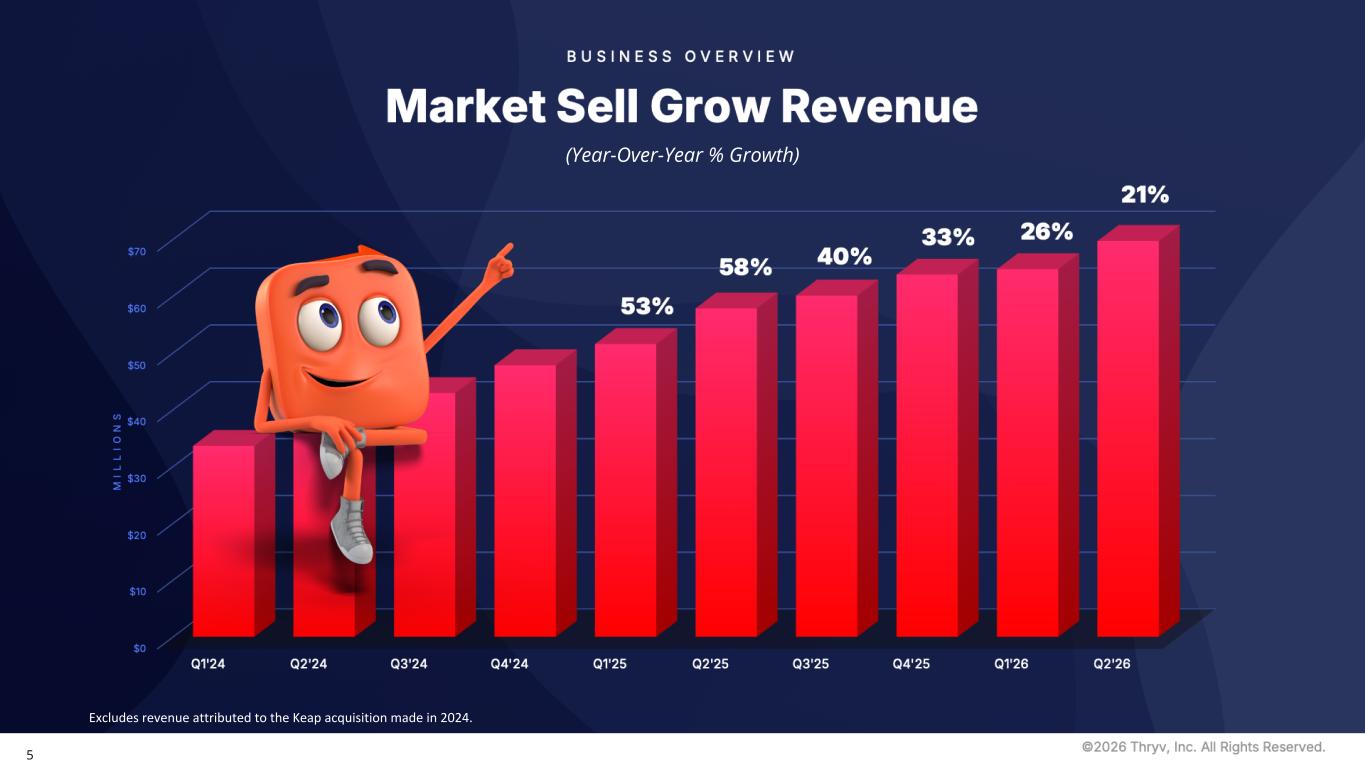
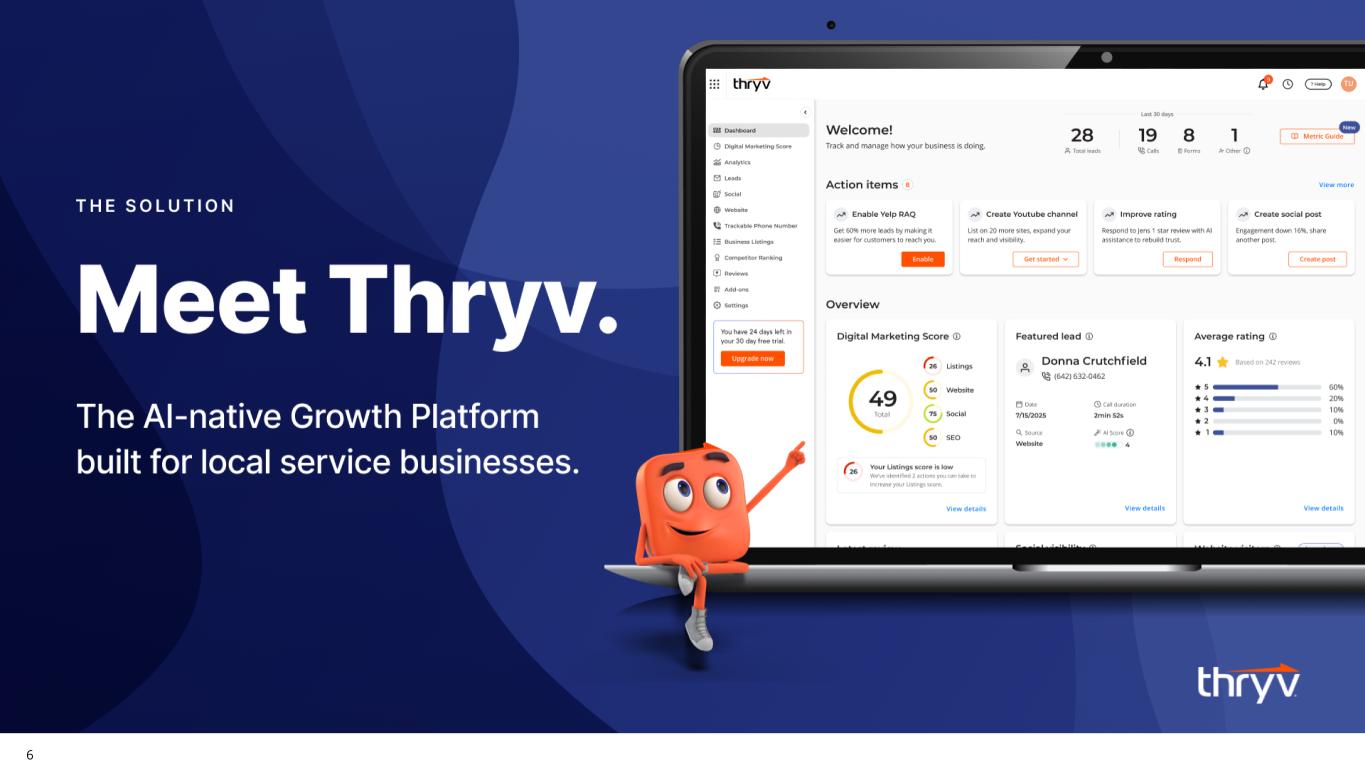
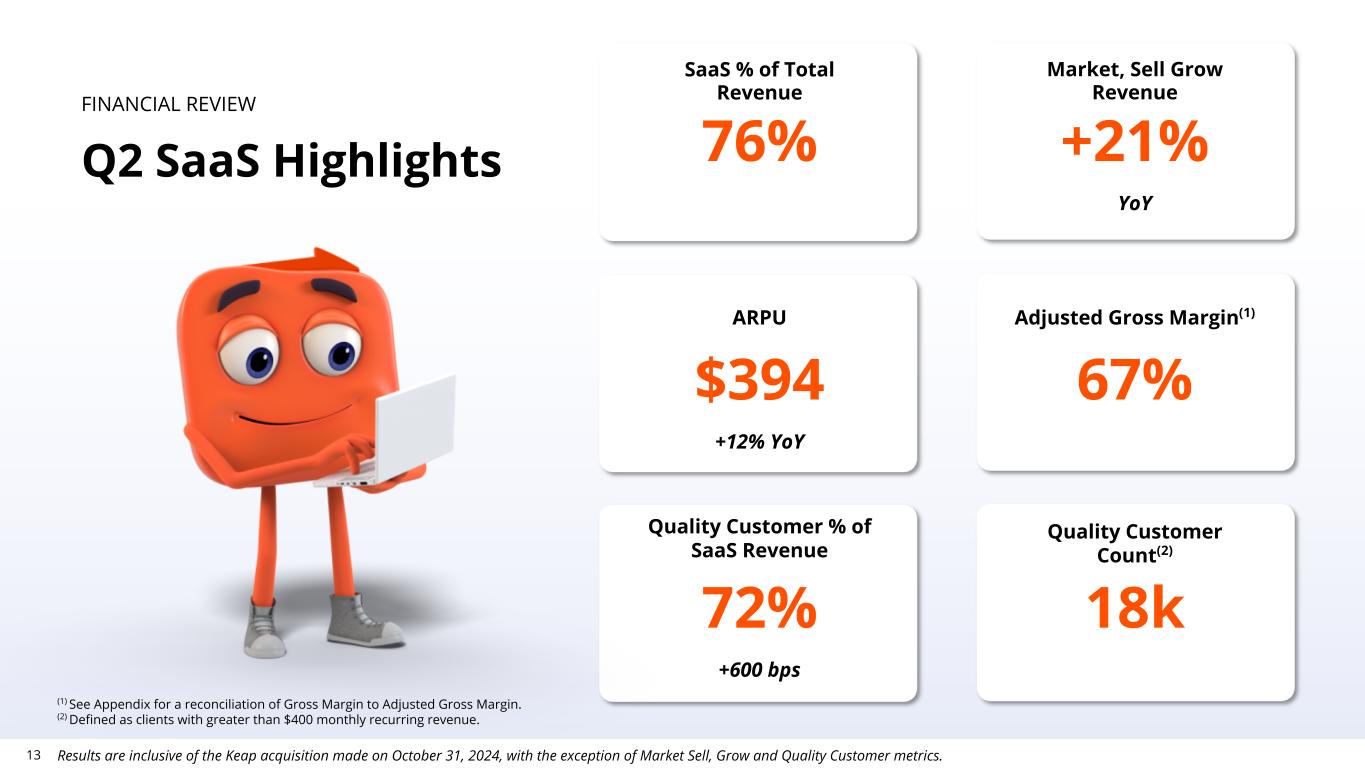
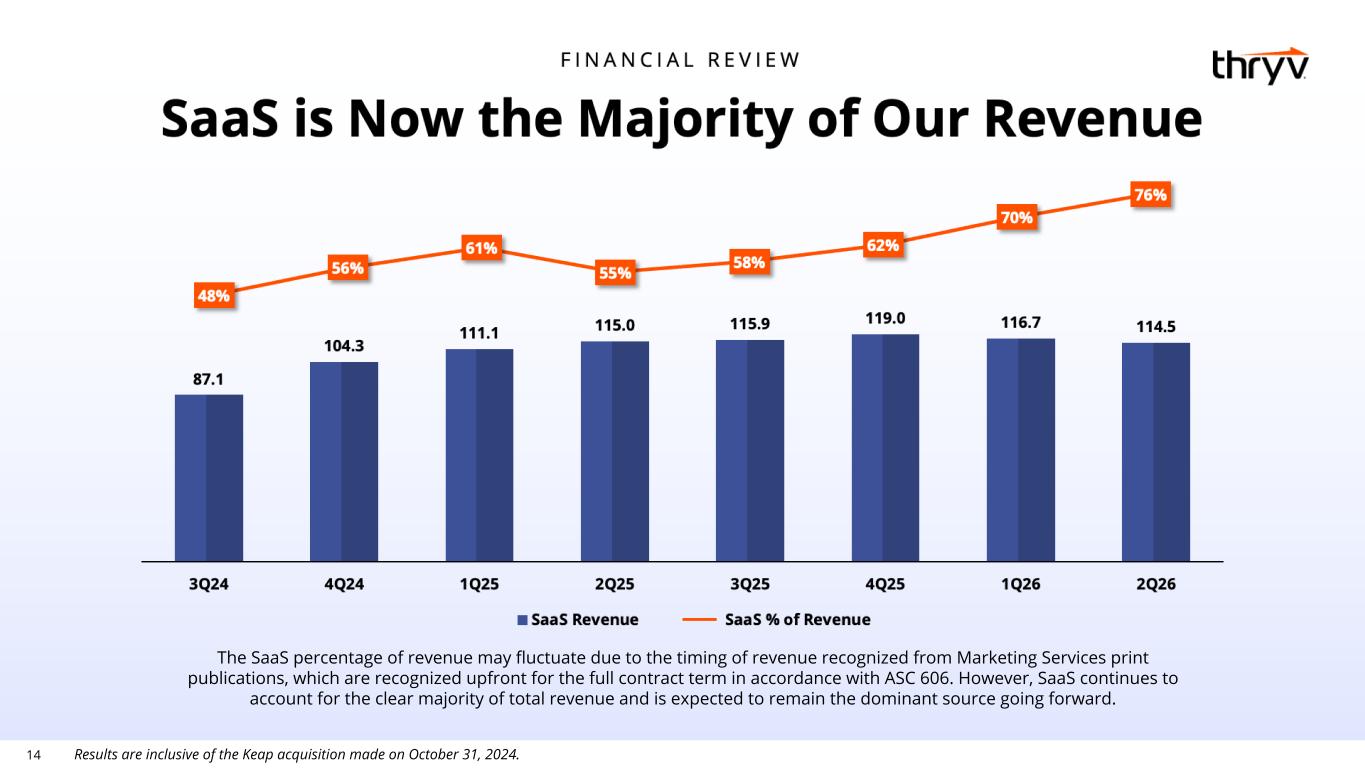
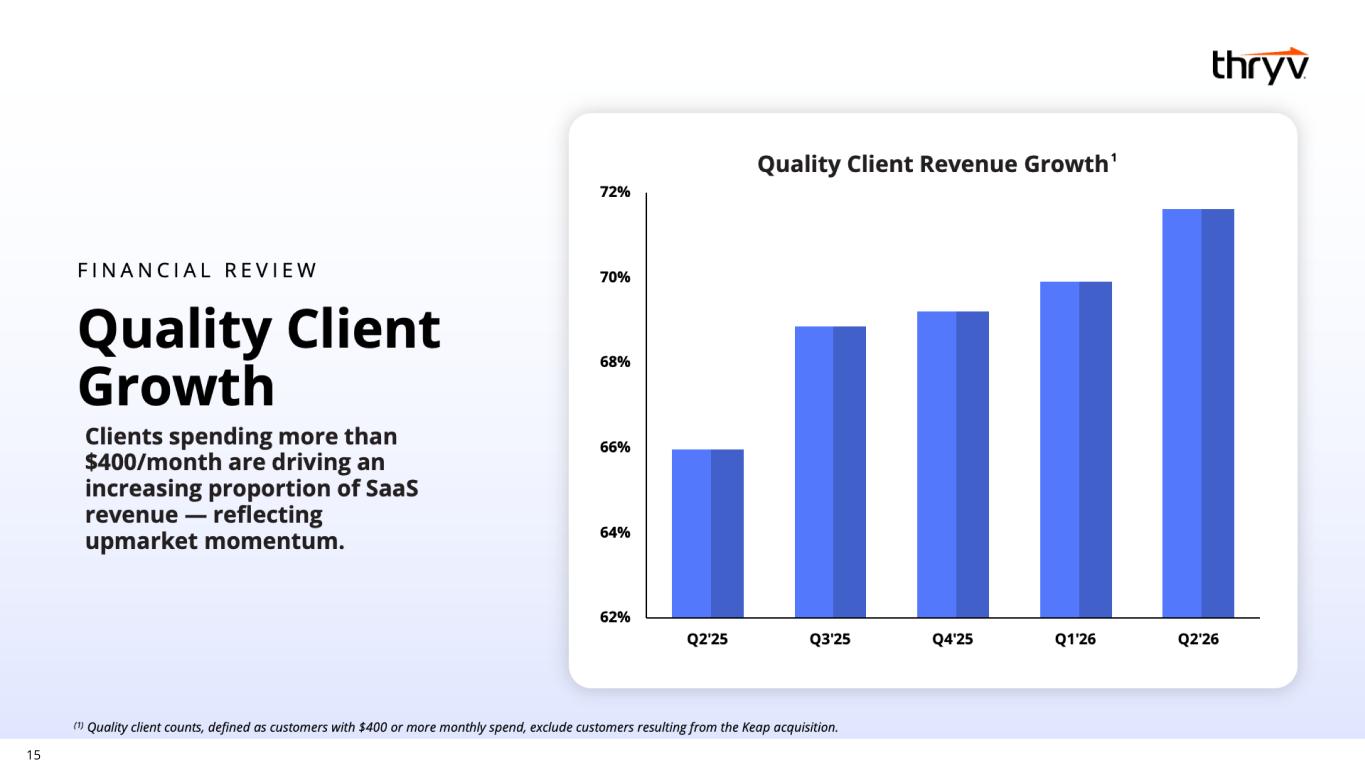
Thank you, Cameron. Good morning, everyone, and thank you for joining us. Let me start with the Q2 headline, Thrive Delivered on the Quarter, and I'm going to start by focusing on our strategy and highlight the numbers that tell the story. Cameron will take you through some new partnerships that we've landed, and Grant will focus on our new Thrive Growth platform. Following that, Paul will walk you through our Q2 results and updated guidance. Our transformation to a pure play SaaS company is not something that happened to us. It's something that we have executed year after year, running two motions at once, streamlining and taking costs out of our business while growing a leading SMB software business inside it. Every year, leaner. Every year, more software. That's the work that's making this a fit company, and fit companies win. We took more of these actions this quarter, and we'll walk you through the restructuring and savings elements at the end of the call. You will see that we are revising our full-year outlook. As we made a choice, we narrowed our focus to Marketing Center, its add-ons, and getting the Thrive Growth Platform to market. During this period, we invested less in sales headcount and marketing in order to prioritize the push we're now making behind the new growth platform launch. SaaS is now 76% of total revenue. And this quarter, that transformation has been validated. We've been added to the JIX as a software company. The market now classifies us as what we have spent years achieving. The engine of that progress is our growth platform and its add-ons, what we call our Market Sell Grow, or MSG. MSG grew 21% year over year, and that's not a one-quarter story. It has grown double digits quarter after quarter up and to the right for more than a dozen quarters, and it's working, especially as we move upmarket. ARPU grew 12% year over year this quarter. 72% of our clients now spend $400 or more with us, up two points from the prior quarter. Bigger clients spending more on the platform we have put at the center of our company. Yesterday, August 3rd, we took the biggest step yet. We rolled out the Thrive Growth Platform, an AI-native product built from the ground up for the AI era. Marketing Center has served us well, but it has been in the market for a few years. Design before this generation of AI existed. You cannot bolt the future onto a product like that. You have to rebuild around it. And that is exactly what we did. This upgrade is a huge positive for our clients. And the timing is deliberate. In this new AI world, we cannot compete with everyone across every product. So we made a choice. We are sharpening our focus on the Thrive Growth platform. Rather than being an all-in-one software business, we are driving growth with businesses small and large through that focus. We invite investors and analysts to attend our webinar featuring a demonstration of the platform this Thursday, August 6, at 2 o'clock Eastern Time. Further information on the event will be provided later today. Grant is going to take you inside the platform in a few minutes, and I will let him tell you that story. What I want to do first is have Cameron go into more detail about exciting news around some of our recent announcements and how it fits into our strategy.
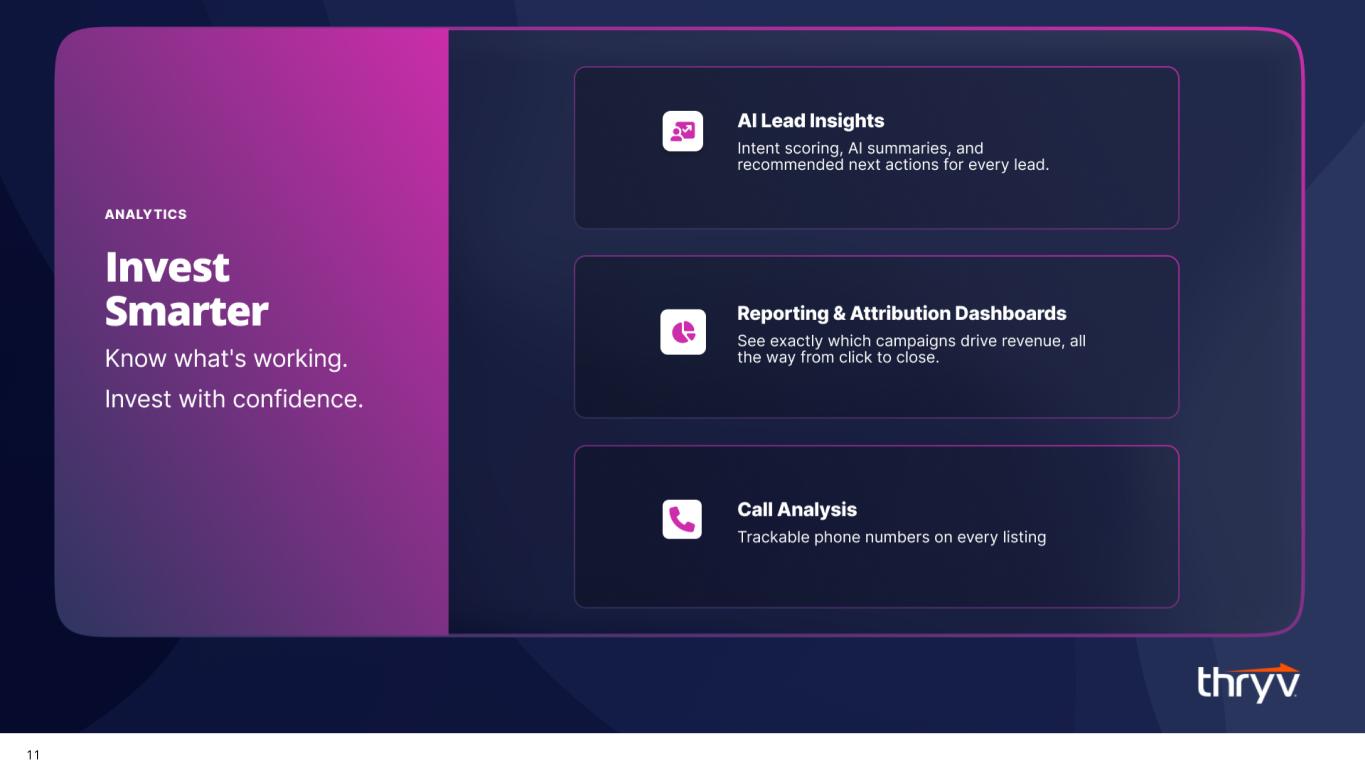
Thank you, Joe. I'm excited to talk about a few announcements today because a great product only wins if you can put it in front of enough of the right owners. and that brings me to distribution. This quarter, we entered two strategic partnerships, Wix and UMA. We also are happy to announce two new integrations, Breezy and Jobber. These are not side deals, but done with partners. We own the layer where small business growth happens, the marketing, the leads, the customer relationships. Everything else, we go find the best in the world and plug it in. Let's start with Wix, a partnership we are very proud of. It brings together two of the most recognized platforms serving the S&B market. Thrive's comprehensive marketing platform and Wix's global website and unified commerce solution. Each of us is a leader in what we do. Wix has built one of the great digital platforms in the world, the place where businesses establish their online presence and transact with customers. Thrive built a platform where local service businesses market, win, and keep those customers backed by decades of relationships in one of the largest dedicated S&B sales organizations in North America, Australia, and New Zealand. Apart, we each serve a piece of the small business owner's day. Together, we cover it end-to-end, winning the customer and getting paid. That is why this is a broad, multi-pillar agreement, not a single integration. and is positioned to deliver significant value to our combined base of hundreds of thousands of SMB customers. Among the early benefits, our clients gain access to Wix's world-class payments and commerce capabilities, online, point of sale, on the go, plus business checking and access to growth capital. Essentially, getting paid becomes as easy as getting found, and the strategic fit runs deeper still. Many of the businesses WIC serves are exactly who we built the Thrive Growth Platform for, the established local service business. This partnership puts our best product in front of them. When two leaders built for the same customer decide to build together, that customer wins and so does both companies. We expect to be announcing new pillars of this relationship in the future. Now let's talk about UMA. We have spent our careers making phones ring for small businesses, so believe us when we tell you the phone is still where the money shows up and the missed call is a lost job. UMA is one of the most respected names in business communications, ranked at the top of its category time and again, with more than a million users and a base full of exactly the entrepreneurial service-based owners the Thrive Growth platform was built for. That is what this strategic partnership is really about for us, reach. Thrive will be featured inside the UMA office customer portal, right where UMA's business customers go looking for ways to grow. Joint webinars, sales incentives, and cross-promotions launched this quarter. Every one of those touch points is a warm introduction to an owner who already invests in their business and already fits our platform. And because the growth platform now opens with a free trial, those introductions have somewhere to land. An owner can step in, see what it does for their business, and convert without us spending a dollar of traditional acquisition costs. We will be recommending UMA to our clients as a communication solution we stand behind because our clients need great phones and UMA delivers them. Beyond partnerships, we shipped two new integrations this quarter and they follow the same playbook. We own the lead, and we connect it to wherever the work gets done. The first is Breezy AI, an AI operating layer built for franchise-based home service organizations. This is how it will work. Thrive drives the inbound leads and customer engagement on the front end, and Breezy converts those opportunities into revenue, giving owners visibility from the first marketing touchpoint to the final invoice. The handoff is clean. Franchise leaders can now see which marketing sources produce the best jobs, where ad spend is being wasted, and where opportunities are slipping through the cracks. This integration is live today, and it extends Thrive's reach into a segment we have not fully served before, multi-location franchise organizations. The second is Jobber, one of the leading field service management platforms for home service businesses. Thrive is now live on the Jobber marketplace. Qualified leads generated by the Thrive growth platform are automatically scored, summarized, and synced into Jobber in near real time. With AI-driven intent and lead summaries powered by our AI lead insights, built-in score filtering means only high-intent leads reach the customer's Jobber pipeline, and their existing workflows and system of records stay intact. We do not ask the owner to change how they run their business. We just make the pipeline better. Here is why this matters to the business we are building. Wix and UMA each serve large communities of small business owners. And these partnerships give us a natural path into those communities, a warm introduction rather than a cold call, without buying that reach and without building it. Breezy and Jabber make sure that once a lead is ours, it lands wherever the owner actually runs their business. But none of it works without something at the center, strong enough to receive all of those introductions and turn them into growth. That is the Thrive Growth Platform, and it is the reason every partnership and integration I just described exists. No one knows it better than our president, Grant Freeman. So I will let him take it from here. Grant, over to you.
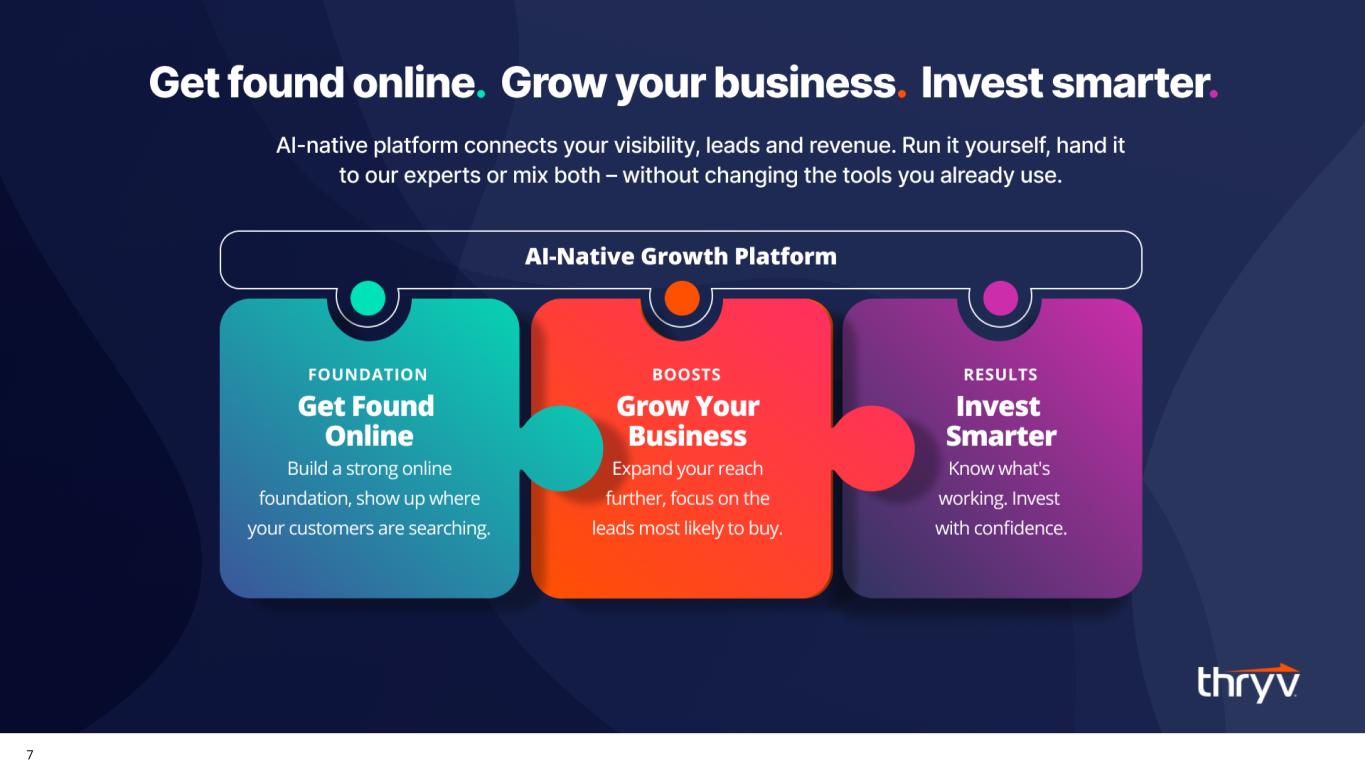
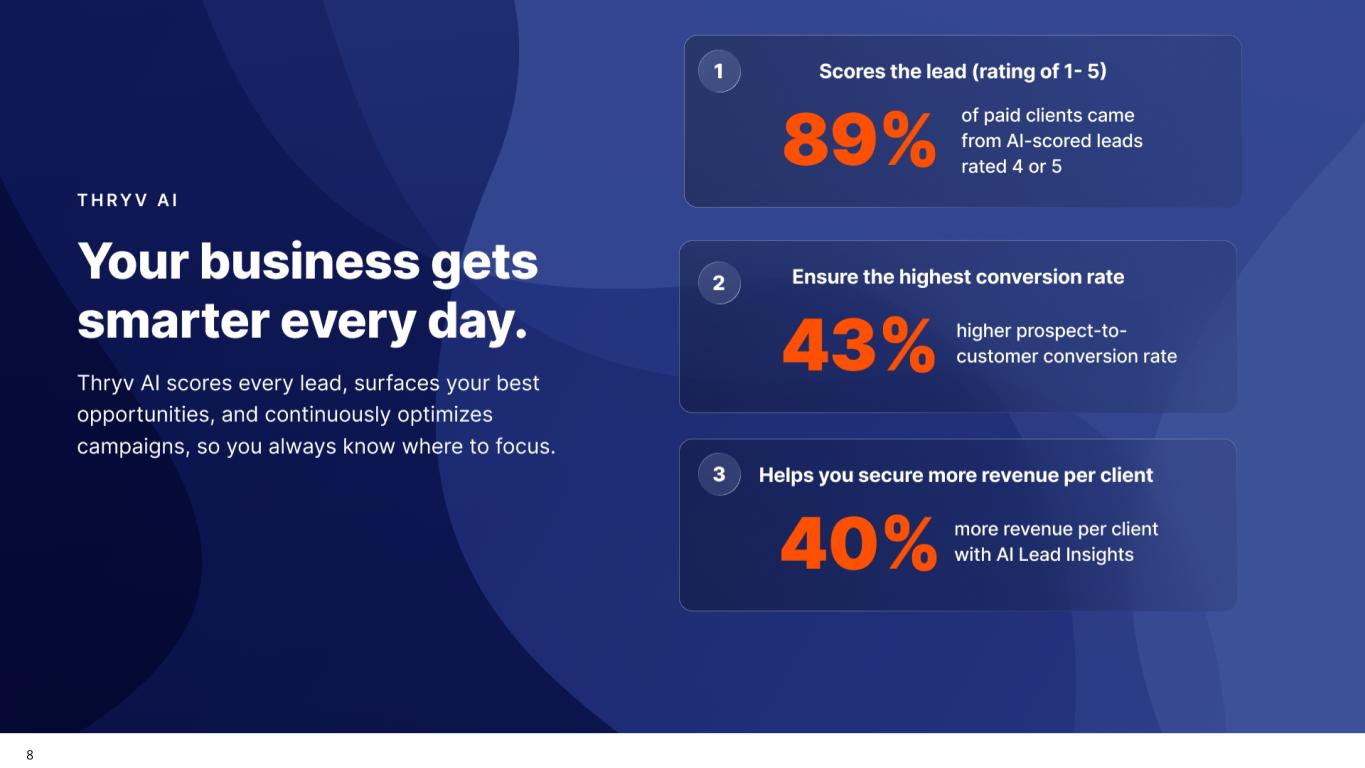
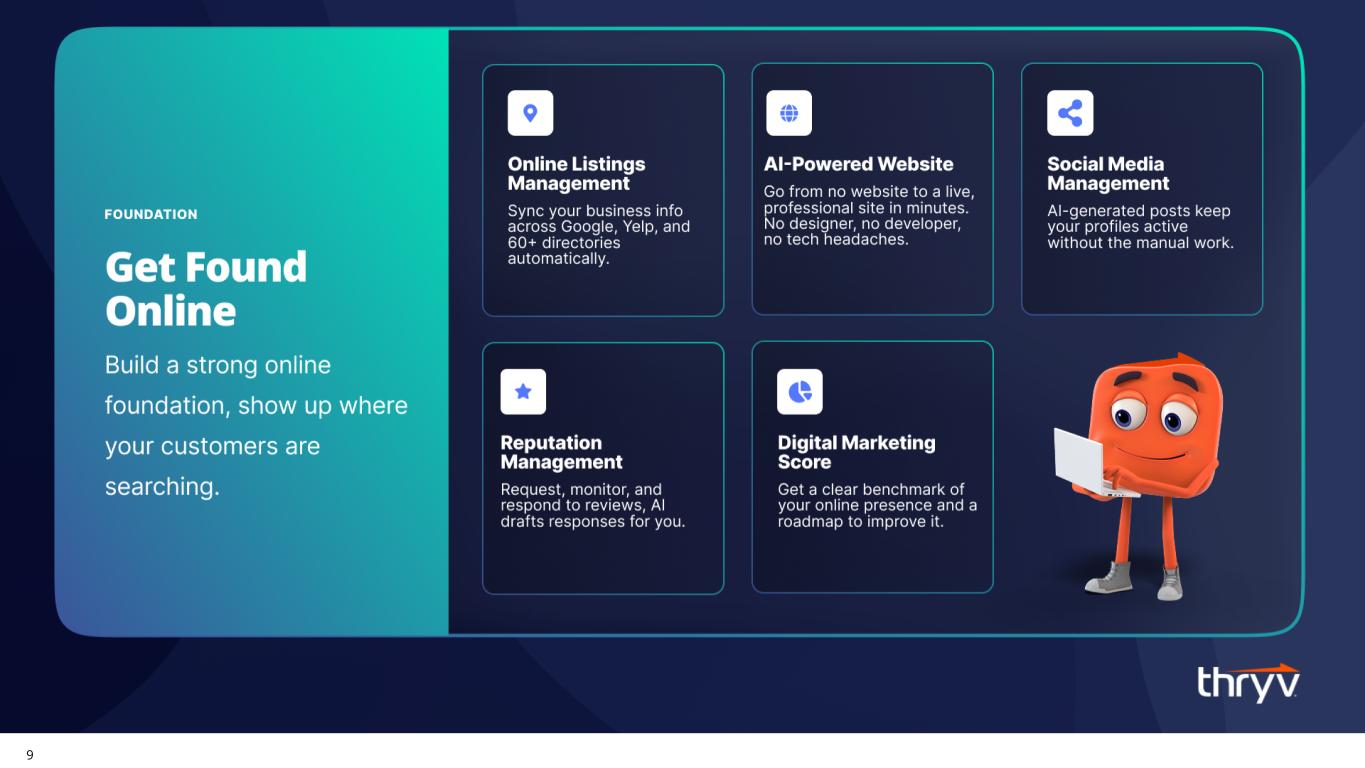
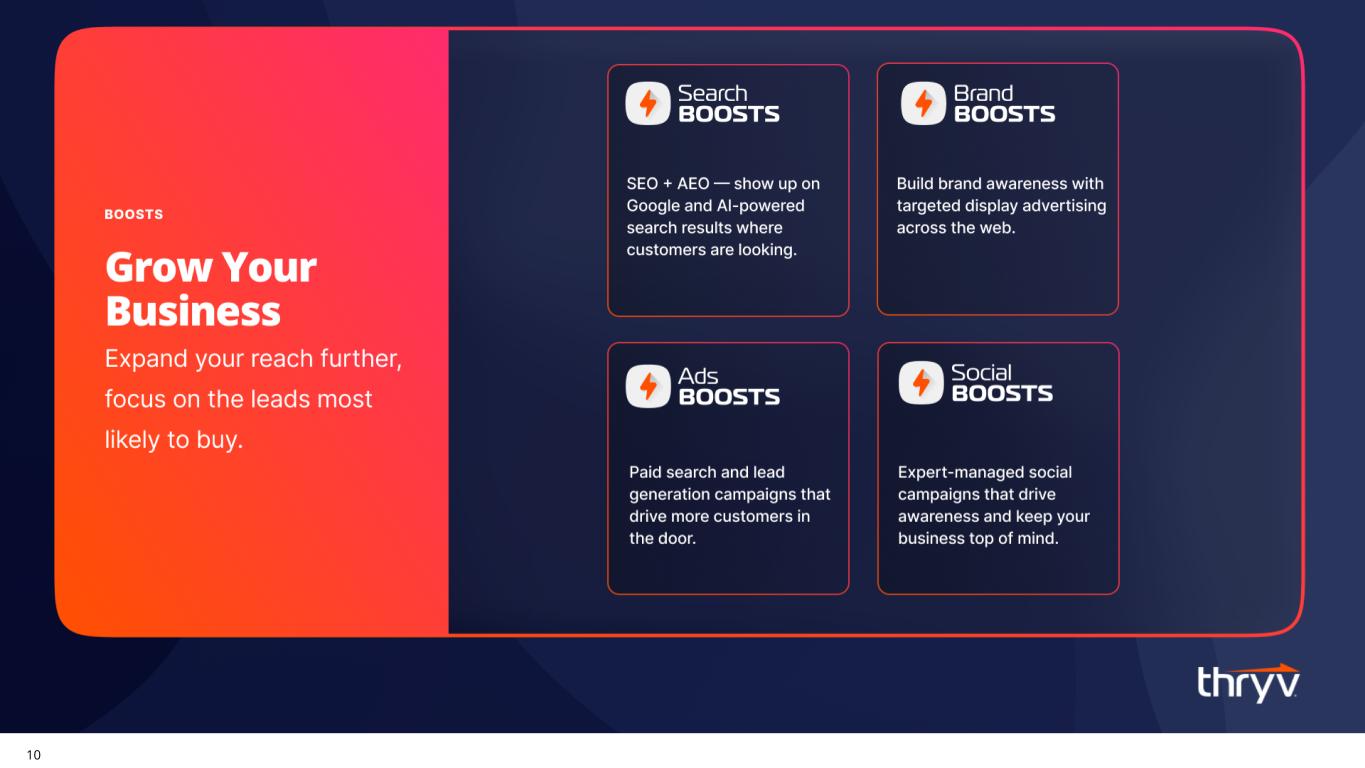
Thank you, Cameron. Good morning, everyone. I wanted to spend a few minutes on the Thrive Growth platform because everything Cameron just described, whether it's partnerships with Wix and UMA or integrations with Jobber or Breezy, all of that only matters if what sits at the center is strong enough to receive it. So that's what I wanted to spend a few minutes talking about. As Joe said, on August 3rd, the platform became generally available. But to understand what that means, you really have to understand who it was built for. There are millions of established local service businesses, plumbers, lawyers, dentists, chiropractors, run by owners who have built something real. They've gotten some traction, but then they hit a ceiling that they can't break through alone because at their core, they're not marketers. Their marketing runs on a patchwork of disconnected tools. Good leads slip through while they are out doing the work. The software industry sells them tools and walks away. The agency world can be costly and often keeps them in the dark. nobody has served the owner who wants both control and results. That is a large, underserved segment, and nobody knows this owner better than we do. So we built the platform around one structural insight. The choice between running your own marketing and having someone run it for you should not be permanent. It should be a dial, not a door. Software when they want it. Our done-for-you boost products when they want us. And AI working underneath all of it, reading every lead, scoring which ones are worth their time, pointing every marketing dollar at what works. The work of a full marketing department delivered at a price a small business can afford. Early results support this. Clients are seeing 40% more revenue and AI scored leads close one and a half times faster. It's important to understand this is also a completely new platform. 70% new code built AI native from day one. Marketing Center is a strong product, but it was designed before this generation of AI existed. You can't bolt the future onto a product like that. You have to rebuild around it, and that's what we did. So why does this model win? It's because of the feedback loop. An agency can tell you an ad ran, and a phone rang, and you got this many clicks. But our loop runs all the way through the money, the lead, the job, the invoice, the customer created. That closed loop trains our AI. Better AI improves client outcomes and better outcomes retain clients longer and longer relationships deepen the data. It's a flywheel and every quarter that it spins, our advantage compounds. A point solution cannot replicate it. An agency can't replicate it. The hybrid lane is ours to lose. One more decision shapes the economics. The platform works alongside the tools small businesses already run. Jobber, HubSpot, Housecall Pro, and others. We do not ask owners to rip out what works. We fill those systems with better leads. That removes the biggest objection in every sales conversation and is exactly why the integrations Cameron described matters so much. For shareholders, three things. First, revenue per client becomes a staircase. Owners land on the software and layer on services as they grow. Our next dollar of revenue increasingly comes from clients we have already won, which is the cheapest, highest quality revenue a company can book. Second, lifetime value expands. The deeper the platform sits in a client's business, connected to their existing tools, scoring their leads and running their campaigns, the harder it is to leave and the less reason there is to leave. We are playing for duration, not the quarter. Third, category leadership is available. It's wide open. The hybrid lane has no dominant brand. We have the footprint, the relationships, the data asset, and now the platform, and we intend to take it. On sequencing, we are starting with net new clients through our direct sales channel, letting the platform prove itself before we begin migrating our existing base in 2027. Disciplined rollout protects retention, and retention is the foundation everything I just described is built on. The promise to the owner is simple. Get found, grow your business, invest smarter. We will report progress the way we always have, measured, transparent, grounded in the numbers. And starting August 3rd, the numbers began. Paul, over to you.
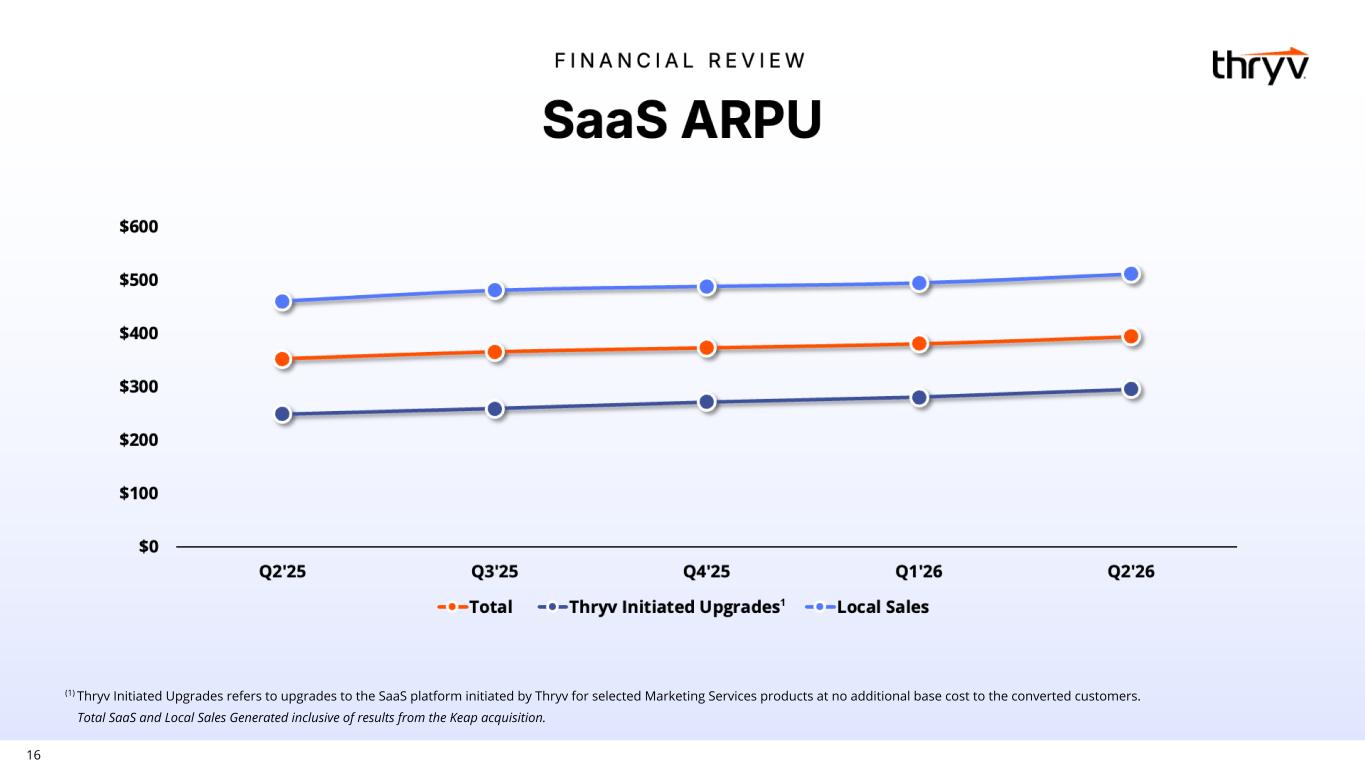
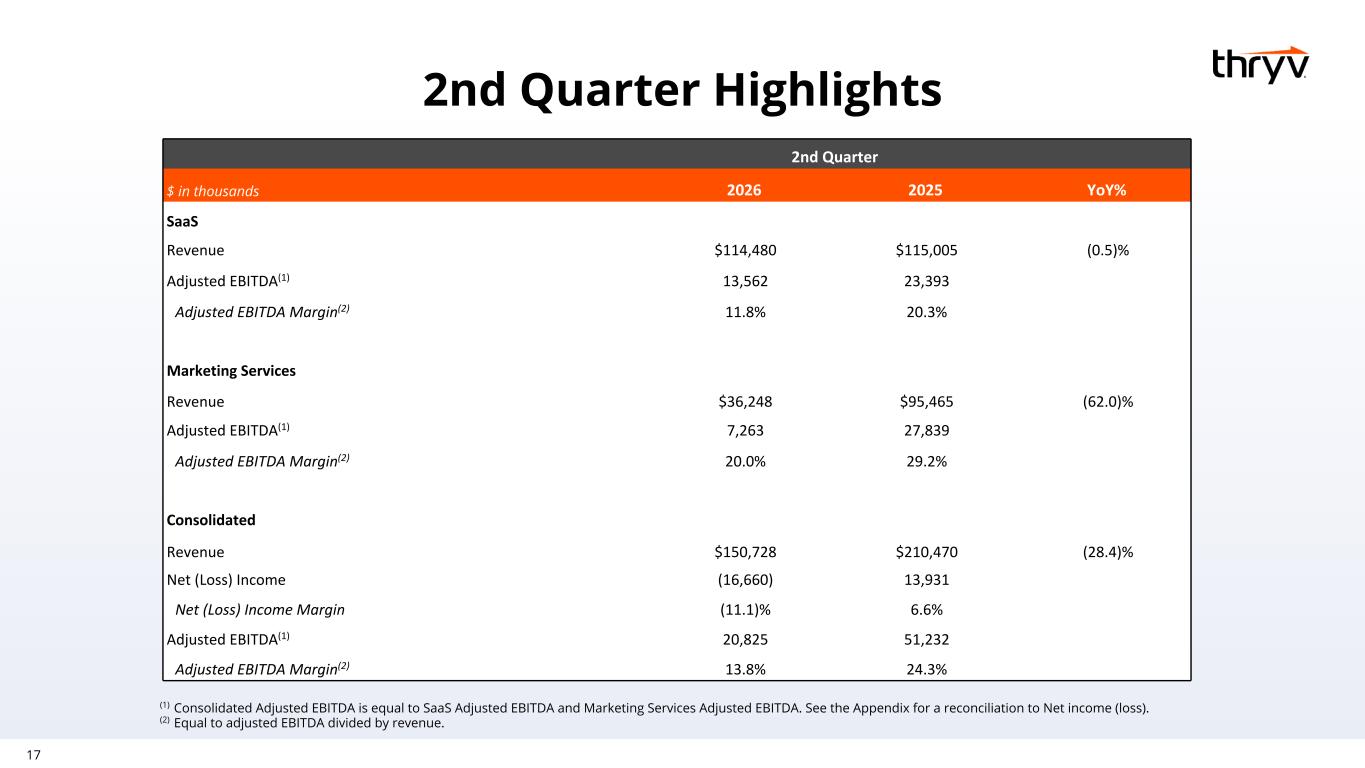
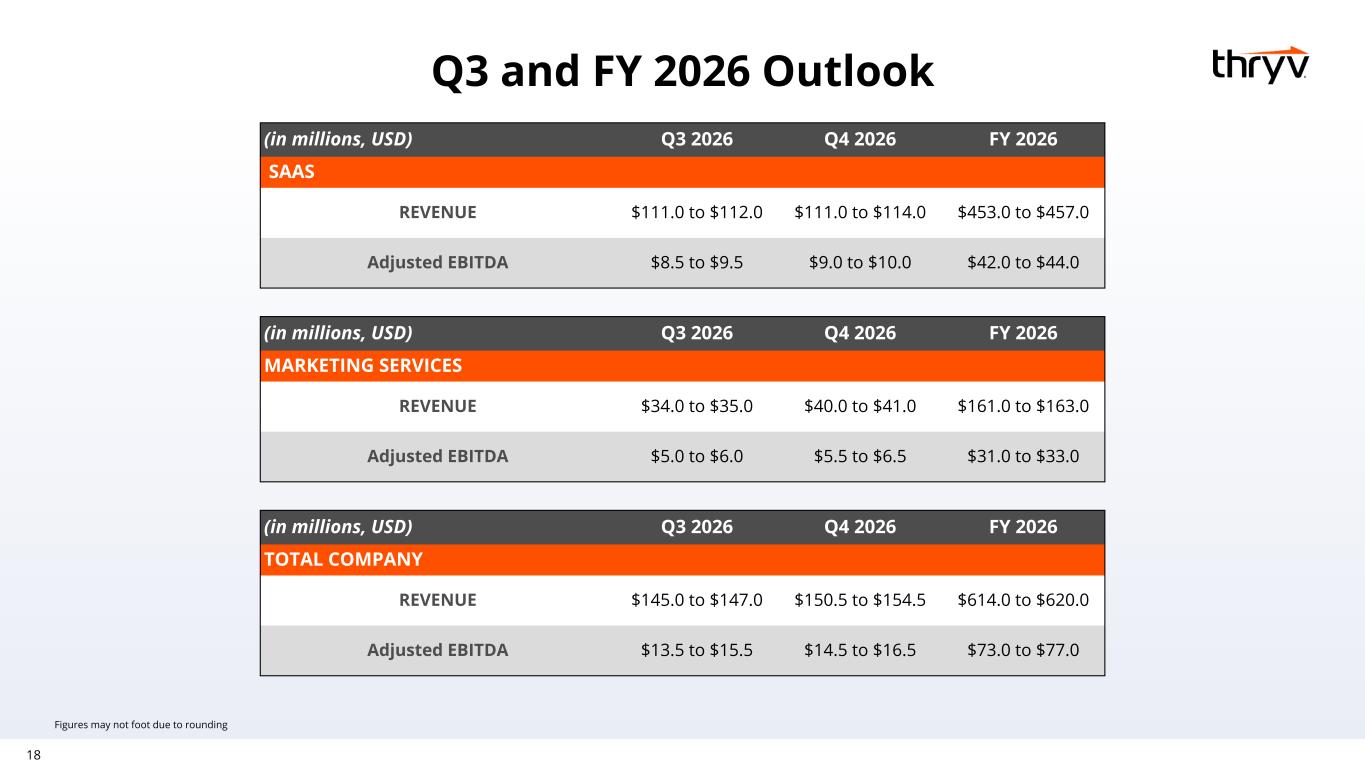
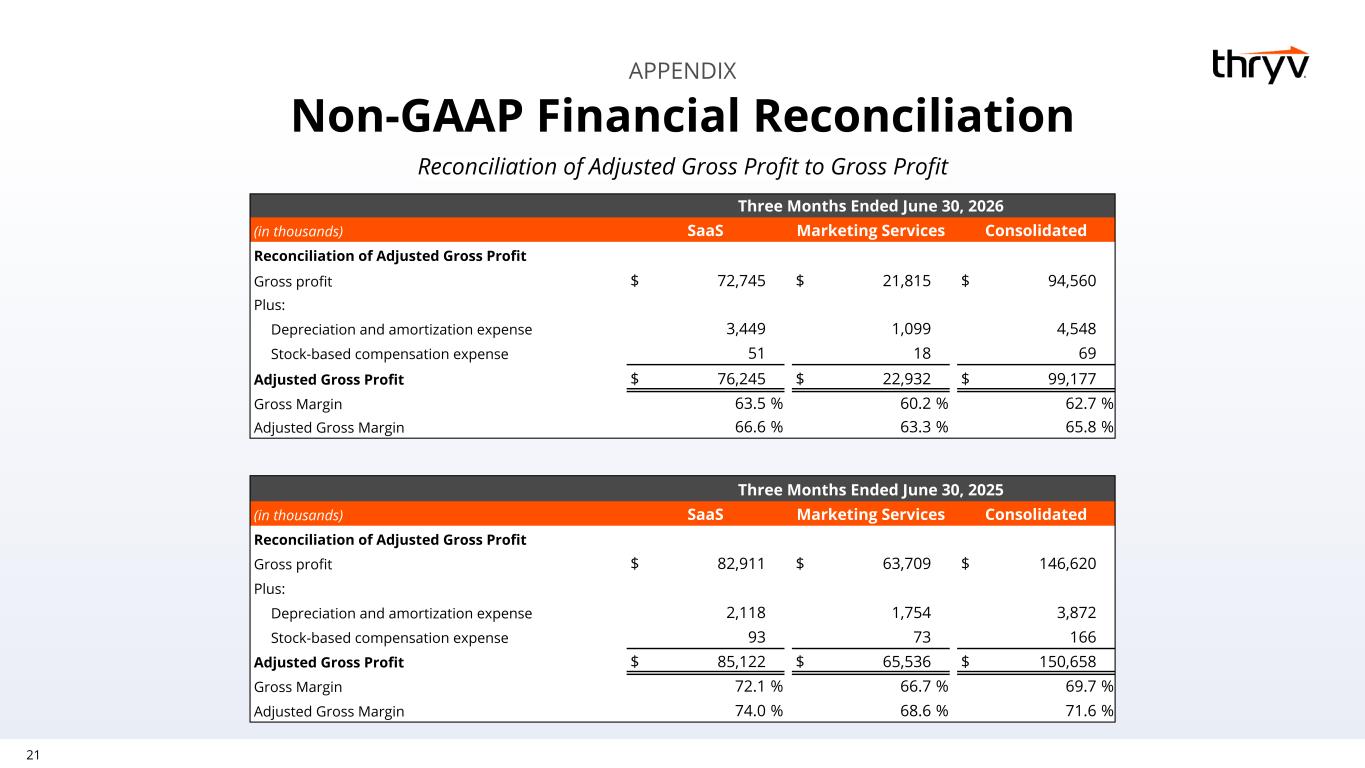
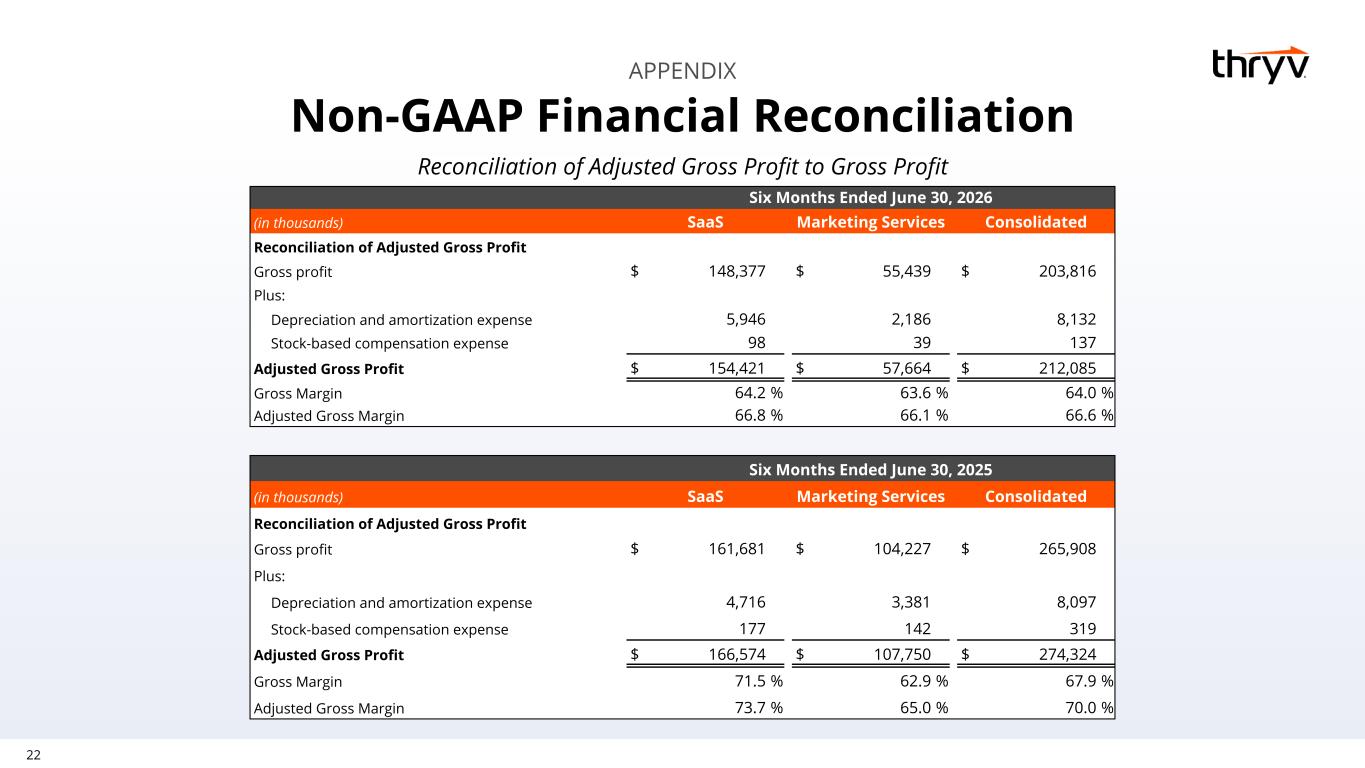
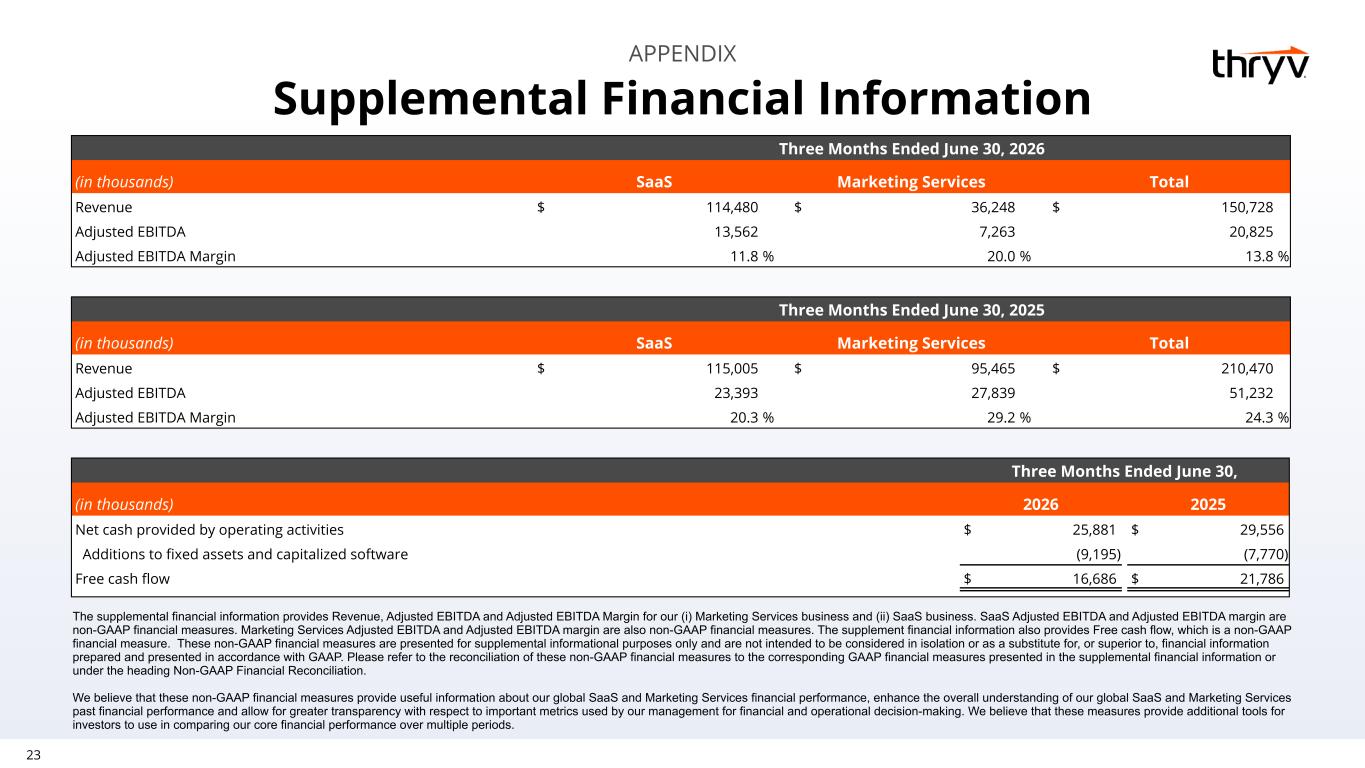
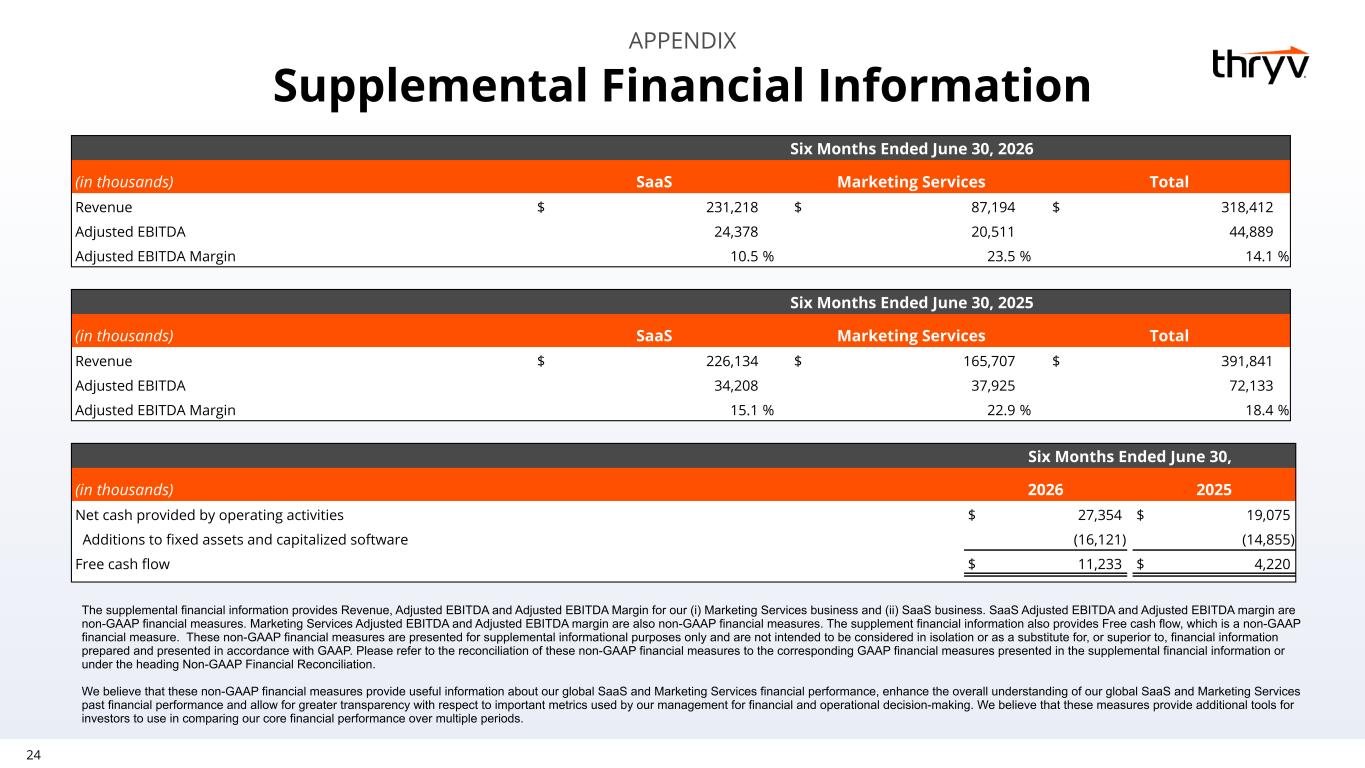
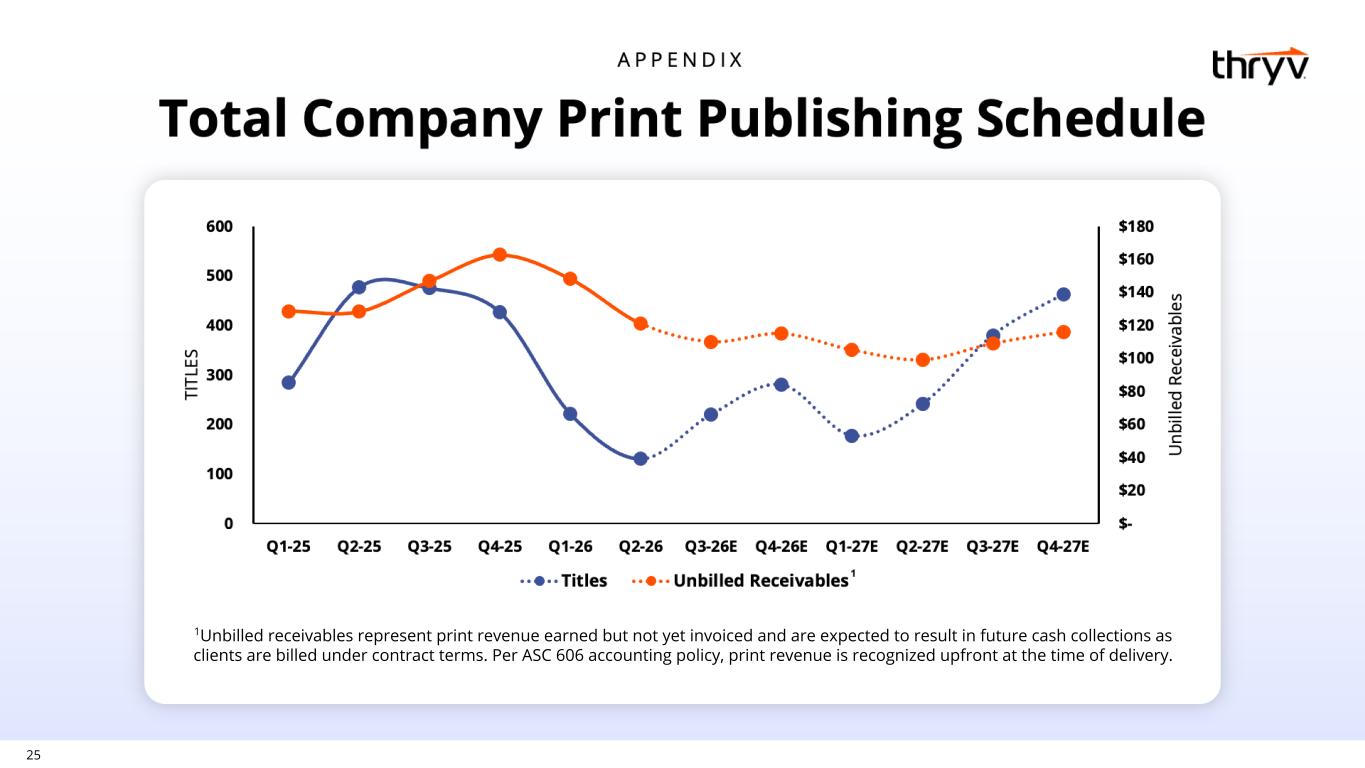
Thanks, Grant. Let's dive into the numbers. SAS reported revenue was $114.5 million in the second quarter and within our guidance. SAS adjusted gross margin was 66.6% and SAS adjusted EBITDA was $13.6 million in the second quarter, resulting in an adjusted EBITDA margin of 12%. percent. Gross margin movement is a mixed story. More of our clients are purchasing add-ons alongside our marketing center, and that revenue carries traffic expense. So it arrives at a lower gross margin than our platform software. It is a trade we can accept right now, because add-ons are doing exactly what they were designed to do, moving us up market, attracting larger clients, and driving higher spend per client. In the second quarter, SaaS ARPU grew to $394, an increase of 12% year-over-year. We ended the second quarter with 95,000 SaaS subscribers. Seasoned NRR of 90% reflects the natural attrition of smaller, lower-spend clients within our base. Multiproduct adoption continues to be strong, with clients with two or more SaaS products representing 29% of our base in the second quarter compared to 28% a year ago. Moving over to marketing services, second quarter revenue was $36.2 million and above guidance. Second quarter, marketing services adjusted EBITDA was $7.3 million, resulting in an adjusted EBITDA margin of 20%. Consistent with our expectations, this performance reflects the natural second-half weighting of our print publication schedule from a revenue recognition standpoint. Second quarter marketing services billings totaled $48.7 million, down 36% year over year. These results reflect the deliberate execution of our strategy as we systematically migrate legacy digital marketing services clients to our SaaS platform. The decline will continue, but at a pace we control and anticipate. We ended the second quarter with net debt of $241 million, bringing our leverage ratio to 2.1 times. Before I take you through the guidance, let me cover the restructuring program we announced today. We are simplifying the business around a single growth platform and consolidating teams, systems, and vendor spend as non-core products wind down. We expect a charge of approximately $25 million, primarily severance and related employee benefits, along with contract exit and early termination costs. Our expectation is that roughly half of these charges will be incurred in 2026, with the remaining half in the first half of 2027. In return, we expect approximately $60 million in run rate savings. Now let's dive into our guidance, starting with marketing services. For the full year, we are raising the low end of our marketing services revenue guidance, bringing the range to $161 million to $163 million. On marketing services adjusted EBITDA, we are revising full year guidance to a range of $31 million to $33 million. Now for SaaS. In the third quarter, we expect SAS revenue in the range of $111 million to $112 million and SAS adjusted EBITDA in the range of $8.5 million to $9.5 million. For the full year, we are revising SAS revenue guidance to a range of $453 million to $457 million, and SAS adjusted EBITDA guidance to a range of $42 million to $44 million. This revision reflects deliberate resource allocation decisions we made in the first half, and I want to walk you through the sequencing. In the first half, we were deliberate about where every dollar went. We directed investment into product, deepening marketing center and add-on products, and building the Thrive Growth platform to be ready for market. We were more measured with other spend, including sales headcount, while that work landed. We chose to build the thing worth selling before we scaled the team to sell it. The near-term costs were visible, lighter headcount pressured revenue, which flows through to EBITDA, along with elevated traffic expense as we drove expansion within the installed base. But the investment is now in market as Thrive Growth Platform. With the platform now in market, we are redirecting investment towards sales and marketing and ramping through the back half. We enter 2027 at full strength, an expanded product set, and a sales organization size to monetize it. We recognize the optics. We are lowering guidance while stepping up investment. But this is disciplined sequencing, product first, narrowing our focus, then distribution. Absorbing this in 2026 is a better trade than arriving at a larger opportunity in 2027 unprepared to capture it. With that, operator, let's move to questions.
Operator
We will now begin the question and answer session. Please limit yourself to one question and one follow-up. If you would like to ask a question, please press star 1 to raise your hand. To withdraw your question, press star 1 again. We ask that you pick up your handset when asking a question to allow for optimal sound quality. If you're muted locally, please remember to unmute your device. Please stand by while we compile the Q&A roster. Your first question comes from the line of Scott Berg with Needham and Company. Your line is open. Please go ahead.
Hi, everyone. Thanks for taking my questions here. I guess a couple of them. Joe, I just want to talk about general strategy for what you're seeing on the SaaS side. I know the business is going through a lot of different bunch of transformations here as you focus, obviously, on the marketing center side of the business. When do you think we get to a spot of stability in both product and go-to-market strategy? And that's a question because the new guidance and Paul's explanation of some of the changes that are going on kind of reflect, I guess, a pattern of every couple quarters. It looks like you keep tweaking different aspects to it. And I think we should expect every company to tweak things as they go, but they seem to be a little bit bigger jumps than maybe what we're expecting than something that should be a little bit more consistent here. So just help us understand when we think we'll be at a kind of a consistent, you know, kind of level, both on the product side and the go-to-market side, so we can, you know, get, I guess, to some pretty consistent expectations.
What a polite way to ask that question. Thank you, Scott. I appreciate it. So the new platform came out yesterday, went GA. And on Thursday, we're going to have a demonstration webinar opportunity to come in and take a tour and see it and understand it in more detail. It's been a heavy lift. We've spent a couple of years really working very hard developing this AI native new platform that replaces Marketing Center and is vastly better, vastly more up to date, vastly better. And look, the world around us with AI is moving much, much faster. And, you know, the marketing center platform is only, you know, four, four and a half years old. And it aged very quick with so much going on in AI with customers' expectations moving the way they did and so on. So, you know, I accept and respect the point that we've been pivoting around a little bit, trying to find exactly where we want to be. The decision we've made about that, and it's been backed up with a lot of strong data, is focusing on the growth of local businesses. And that's really where we kind of came from originally, and we spread out beyond that, and we've made a decision to really sharpen our focus on really just that. And so to sum it up and answer your question, the new platform is now out. We're ramping the sales organization and our marketing into this new platform. And we expect over the next few quarters for that growth that we've been seeing within Marketing Center and its add-ons to become the main story in the company. And, you know, the directory business and some of the other software initiatives that we have will continue to be sort of runoff business as we focus on driving growth around this new growth platform.
Thanks, Joe. And then, Paul, as I look at the updated guidance here, you brought down a just EBITDA on the SaaS side by, we'll call it $30 million round number. And think about the interest payments that you have on the debt in the second half. And I'm struggling to come up with how you service your debt and make those payments here effectively for the rest of the year because you haven't paid down any of the debt year to date. How do we think about your ability to hit those kind of requirements here? And how do we start thinking about maybe early next year if it's not too early to ask?
Hi, Scott. Thanks for the question. Yeah, this cash flow is still strong, so we don't see any problem making our debt payments. We were focusing really on lowering our revolver as opposed to the term loan. And from a cash flow point of view, particularly when we have these cuts in place, we don't see any issue servicing our debt for the remainder of this year into next.
Thanks for taking my questions.
Operator
The next question comes from the line of Arjun Bhatia with William Blair. Your line is open. Please go ahead.
This is Alinda Lee on for Arjun Bhatia. Thank you for taking my question here. Joe, what's the partnership with Wix and UMA? And right away, congrats on the partnerships there. And how should investors expect or should investors expect more partnerships to come? with similar partnerships that has happened for this past quarter here?
Yeah. Think of it as when I used to talk about hunting in the zoo, basically going out into the big base of marketing services customers and talking to warm relationships, warm prospects. These partnerships are really designed to give us more zoos to hunt in. It's really following sort of the ecosystem-led growth model of plugging in to complementary services. In order to do that, we narrowed our focus in on this growth platform that we've built and the add-ons that go with it that allow us to be very complementary when we work with, you know, other tools like CRM tools in the market or in the case of UMA, you know, voice over IP. So, I think you're going to see we're going to continue to do more partnerships and be very much running an ecosystem plug-in type strategy, fitting nice. We believe that will propel faster and more growth and, you know, great margins as well.
Got it. And then in terms of restructuring, how much of the restructuring is anticipated to be related to workforce reduction versus vendor efficiency?
I'm going to turn that over to Cameron and let him talk a little bit about our thoughts on restructuring.
Yeah, Linda. So roughly the $25 million that we quoted in the prepared remarks, half of it is vendor spend and the half of it is workforce reductions. And think of it as, you know, half taking place in fiscal 26 and then the remaining half in the kind of first half of 27.
Operator
The next question comes from the line of Matt Swanson with RBC. Your line is open. Please go Great.
Thank you so much for taking my question. Maybe kind of building off the first questions about how the model normalizes, the slide that you guys have on the SAS ARPU by the three different lines, the one that's really interesting is that Thrive initiated upgrades of the people that you're bringing in, kind of this product-led growth strategy to try some of the new features. Could you just talk about how you think about the renewal cycle for those customers? and just like anything you've seen in terms of when those features, you know, shift to kind of that, you know, cross-sell, up-sell motion, how you expect that to impact the business?
I'm going to let Grant take that question. Grant?
Yeah, good morning, Matt. So, it's a really good question. I think that when we bring in these customers on the Thrive Growth platform, probably the most important thing to realize is that all of the native AI features do a far better job than ever at proving the value of the foundational platform itself. And as you spend time in the platform, you are receiving suggestions, AI-generated suggestions for how to increase the value that you're receiving through performing different actions. And some of those obviously result in upsell and in cross-sell. And as you've seen before, with the percent of our revenue that's now with quality clients and our ever-increasing ARPU, we are growing to be a more stable software base. And a lot of that is down to the expansion that's taking place now. And we expect that to continue with the invention of the Thrive Growth platform as well.
No, I appreciate that. And then, Joe, in your prepared remarks, you talked a little bit about the age of AI also being part of this idea of going more around depth and breadth of platform, which leads to some of the integrations and partnerships as well could you just talk a little bit if you've seen anything from ai that is changing you know the competitive environment at all or is this more um you know company specific self-directed that you're trying to get out of things yeah look i think um let's you know our our original kind of og software product business center was a an all-in-one
management tool for small businesses and uh you know at the heart of that is really a straightforward crm and in in the current environment you know i think crm has been commoditized a little bit and you know we don't really want to make our primary focus on something that is more kind of in in the crosshairs of how the market is changing and at the very same time We've seen a dozen consecutive quarters of double-digit or better, really strong growth on our Market Sell Grow initiative. Our sales force is getting phenomenally good feedback out there in the field, and we're using these very strong capabilities that the company has in these areas to move up market. And so that's why you're seeing more quality customers. You're seeing ARPU go up because each sale that we're making is a larger sale to a larger business, which we believe over time will have stronger retention characteristics and be stickier. So in answer to your question, I think certain areas within software, I think, would be here, you know, going forward, you know, if you just had a fairly simple generic CRM, I think that that business gets commoditized in the future.
Operator
Your next question comes from the line of Jason Crayer with Craig Hallam. Your line is open. Please go ahead.
Thank you, guys. I just wanted to ask about the go-to-market strategy for the Thrive Growth platform. How is that different going after the existing customer base versus going after Greenfield opportunities?
Grant, why don't you take that one?
Sure, Joe. Good morning, Jason. So I would say a couple of ways. Number one, we just spoke about the partnerships that we're forging. So that will be a relatively new go to market strategy for us, which is hunting in a new zoo, a zoo where people are already investing in their business and that have an ICP profile that's more akin, very aligned with what we're going after. I would also say that the traditional, you know, using the direct sales force and going to market locally, that will continue. However, we'll be able to target them. As you know, we already are targeting them towards more up market businesses. But now we'll be able to target for people that we have deep integrations with. So we'll be able to walk in with people that are already using the job or CRM, for example, and let them know that we have a deep integration where we can put the jobs in jobber. So really narrowing the focus and using sort of precision for who we go after to give us a higher efficiency in the field. And then in addition to that, we will still have an inbound motion. And with the launch of the Thrive Growth Platform, obviously, comes the unlocking of a free trial, which will help us in distribution to larger ecosystems via partnerships and also in the realm of inbound also. So we're pretty excited about how the new growth platform and the new partnerships that we're forging give us a couple of new vectors of potential growth.
Maybe I can build off that last point you made there, Grant. um you talked about um free trials and i know that's something you and i have talked about for the last couple of years curious um how that strategy is different on on the thrive growth growth platform or different with some of these customer partnerships and and what your expectations there are for you know tapping into that greenfield opportunity uh by using free trials Yeah, great question, Jason.
So I think I think it's going to help us in the long term. A couple of things. It will be used in a few different ways. Number one, if you can imagine right now, Marketing Center, it did not have the ability to try all the software for free. whereas as of yesterday with the launch of the Thrive Growth Platform, it does. It's relatively a full unlock of the powerful platform that if you can imagine a local salesperson that used to go through a sales process and then at the end of the customer was on the fence, they sort of had to leave and leave them with nothing. Now instead, they can tease them, they can help them get set up a little bit and come back seven days later and show them the value that the platform has already delivered. And we believe that that can aid in conversions as well. In addition to the free trial, opening up the ability to more easily get into the Wix ecosystems, the UMA ecosystems as well, where it can be served up at the point of purchase of when somebody buys a website through Wix, for example, or when somebody is highly active in their website, we'll be able to serve up a free trial version, which will mean that everything is not beholden to a salesperson's direct interaction. So we do think that it unlocks a lot of doors for us and will give a really good sense of the value that the platform can deliver to people.
Operator
There are no further questions at this time. This concludes today's call. Thank you for attending. You may now disconnect.