Operator
Good morning and welcome to Wiley's third quarter and fiscal 2026 earnings call. As a reminder, this conference is being recorded. After the speaker's remarks, there will be a question and answer session. If you would like to ask a question during this time, simply press star followed by the number one on your telephone keypad. If you would like to withdraw your question, press star one again. Thank you. At this time, I would like to introduce Wiley's Vice President of Investor Relations, Brian Campbell. Please go ahead.
Good morning, everyone. With me today are Matt Kistner, President and CEO, Greg Albright, Executive Vice President and CFO, and Jay Flynn, Executive Vice President and General Manager of Research and Learning. Our comments and responses reflect management views as of today and will include forward-looking statements. Actual results may differ materially from those statements. The company does not undertake any obligation to update them to reflect subsequent events. Also, Wiley provides non-GAAP measures as a supplement to evaluate underlying operating profitability and performance trends. These measures do not have standardized meanings prescribed by U.S. GAAP and, therefore, may not be comparable to similar measures used by other companies, nor should they be viewed as alternatives to measures under GAAP. We will refer to non-GAAP metrics on the call, and variances are on a year-over-year basis and will exclude divested assets and the impact of currency. Additional information is included in our findings with the SEC. A copy of this presentation and transcript will be available at investors.wiley.com. I'll now turn the call over to Matt Kistner.
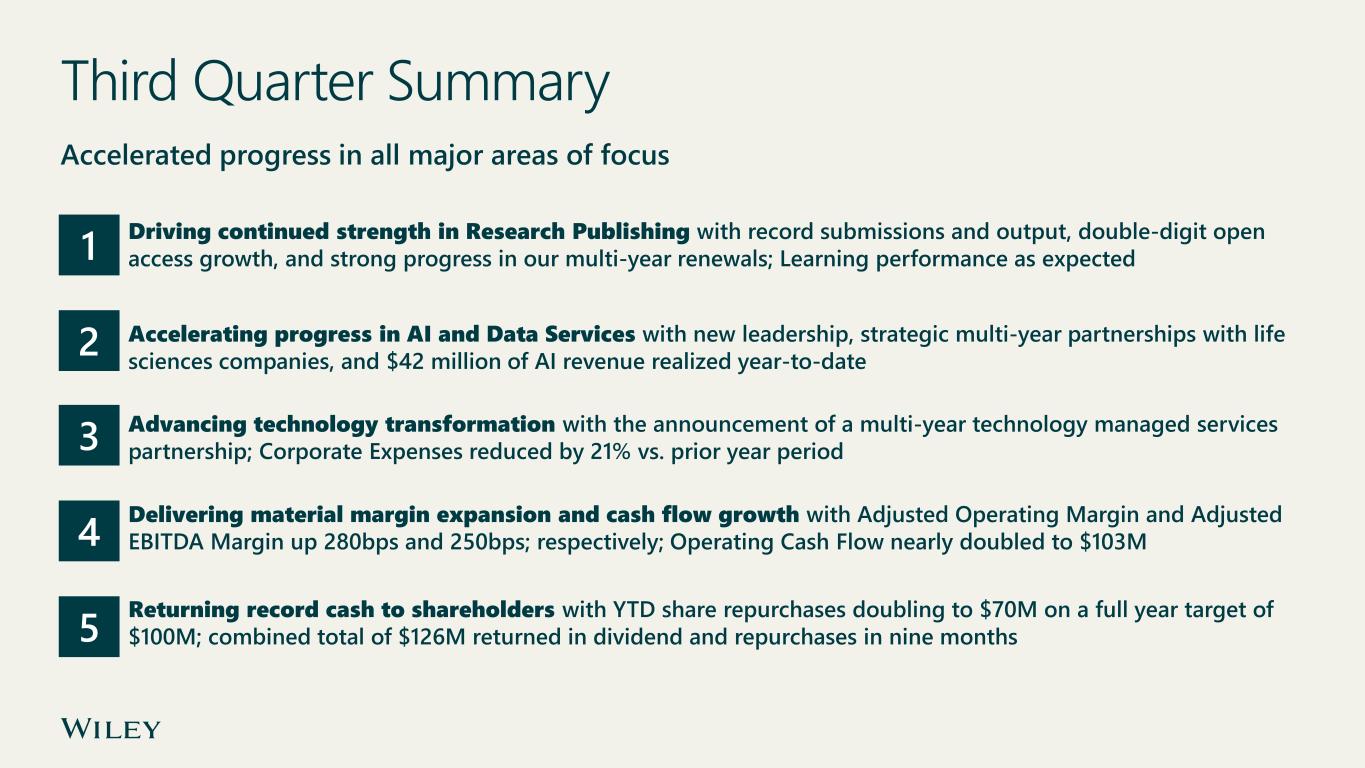
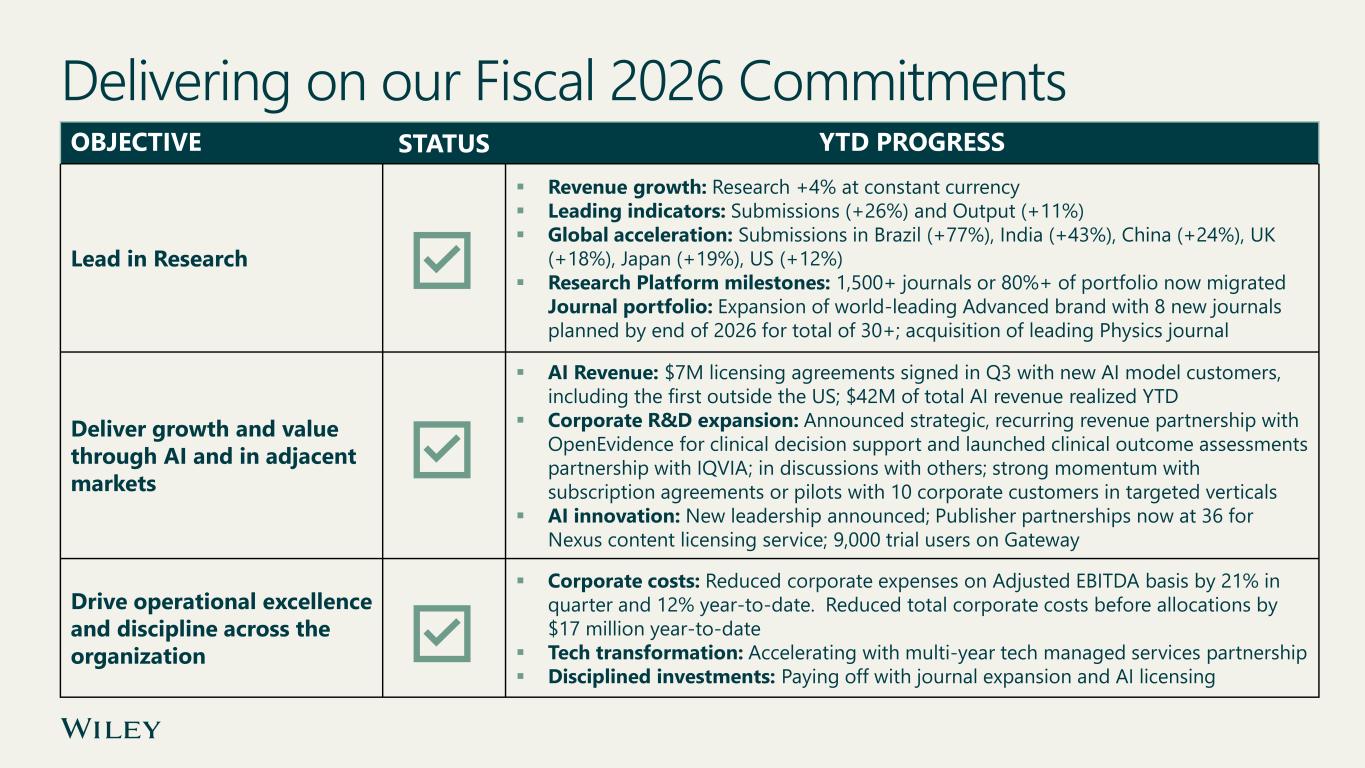
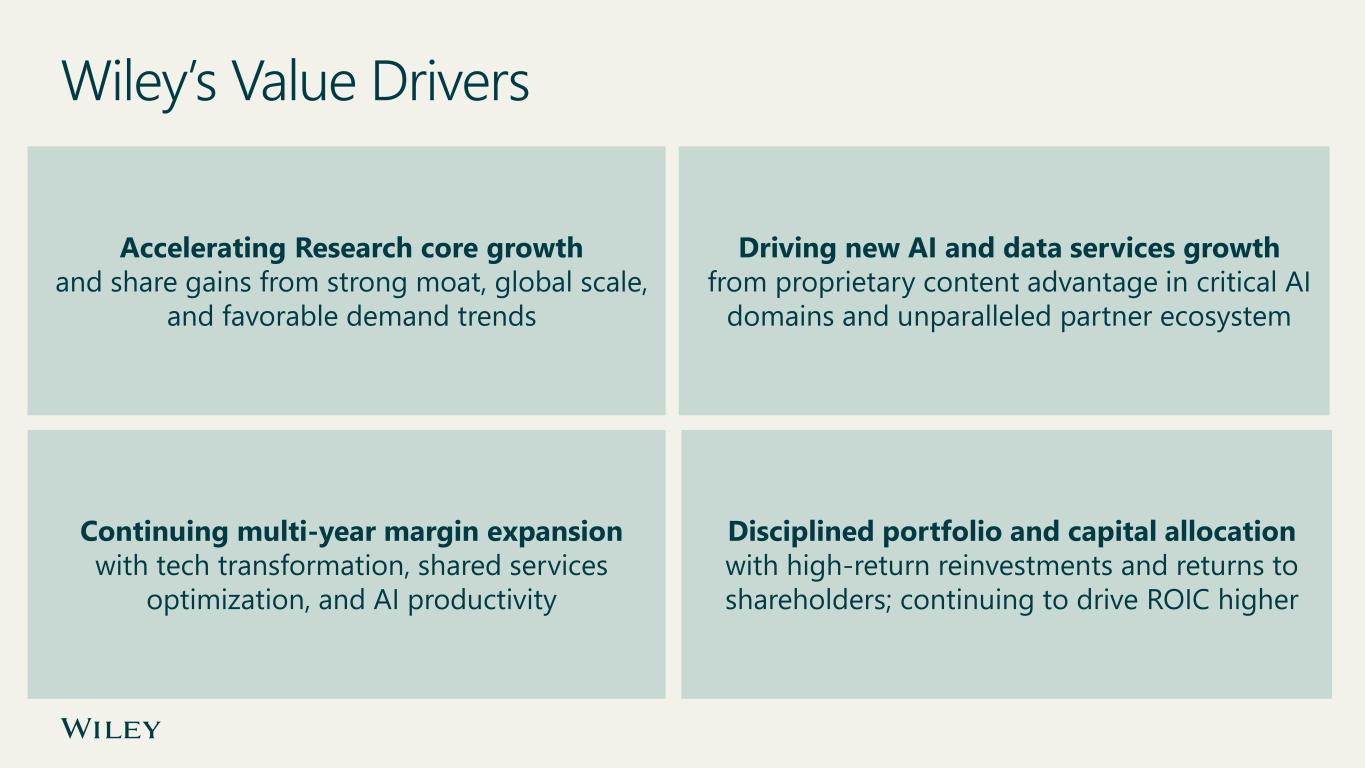
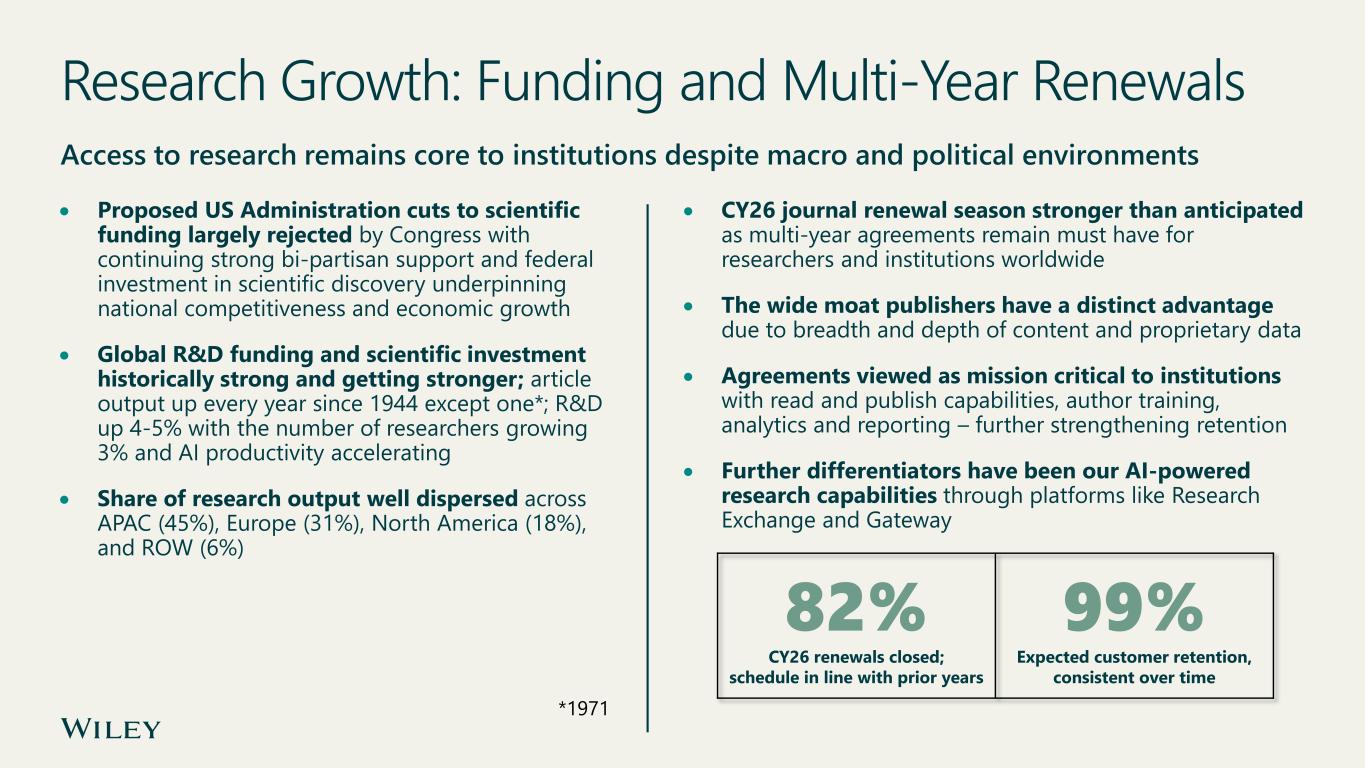
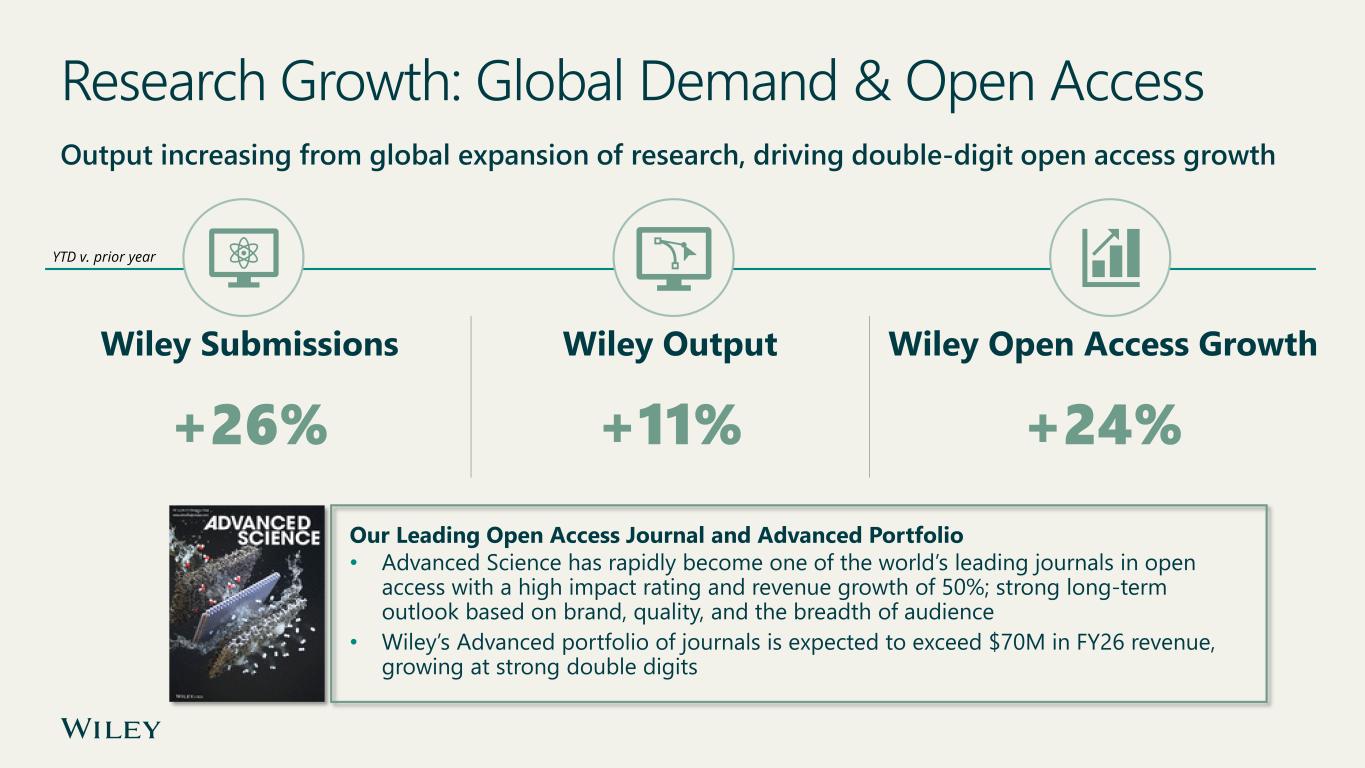
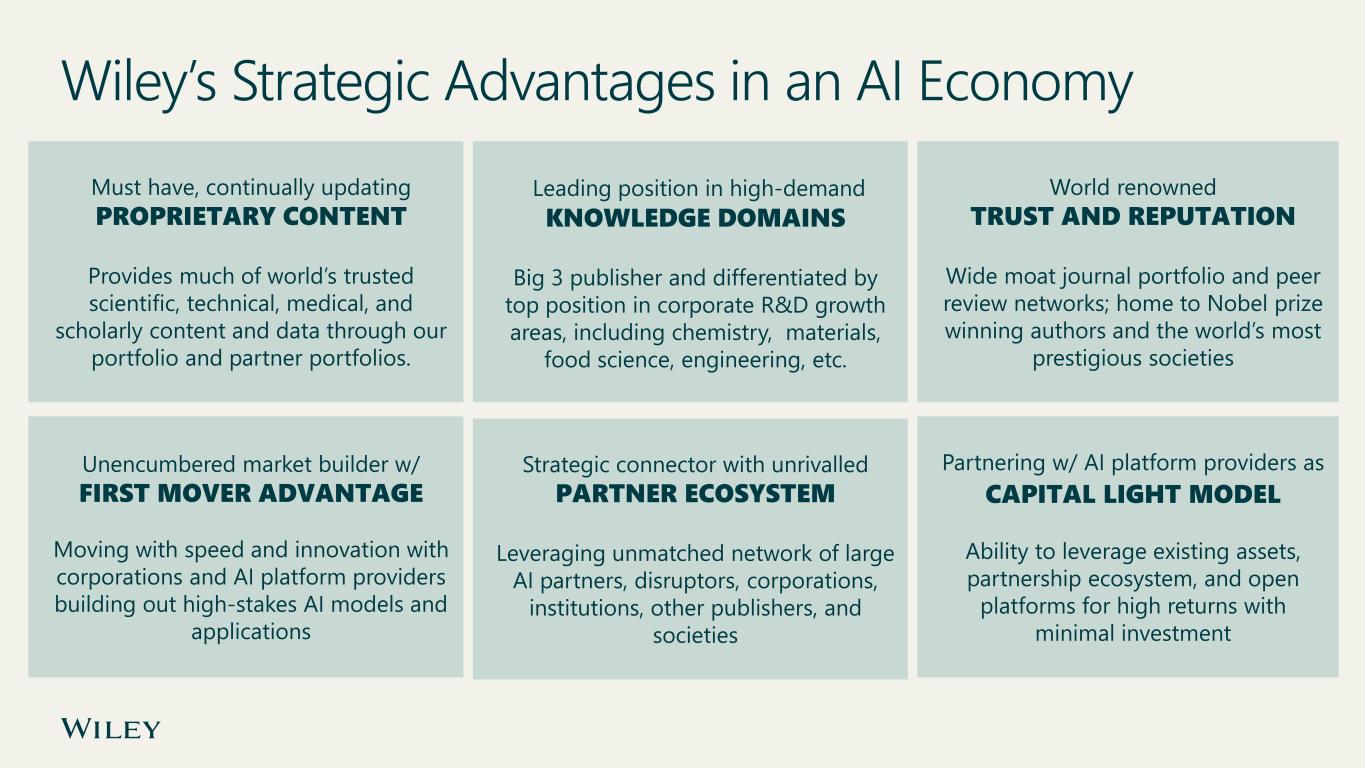
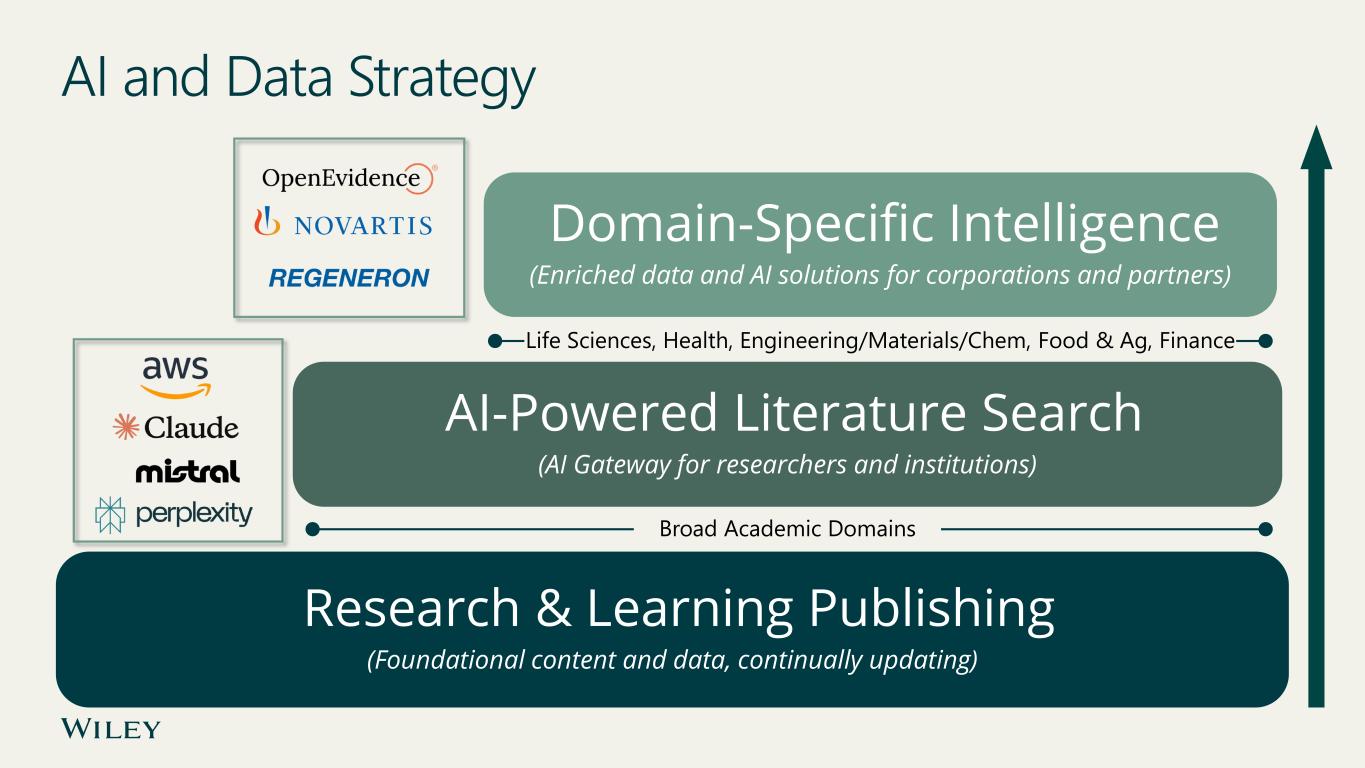
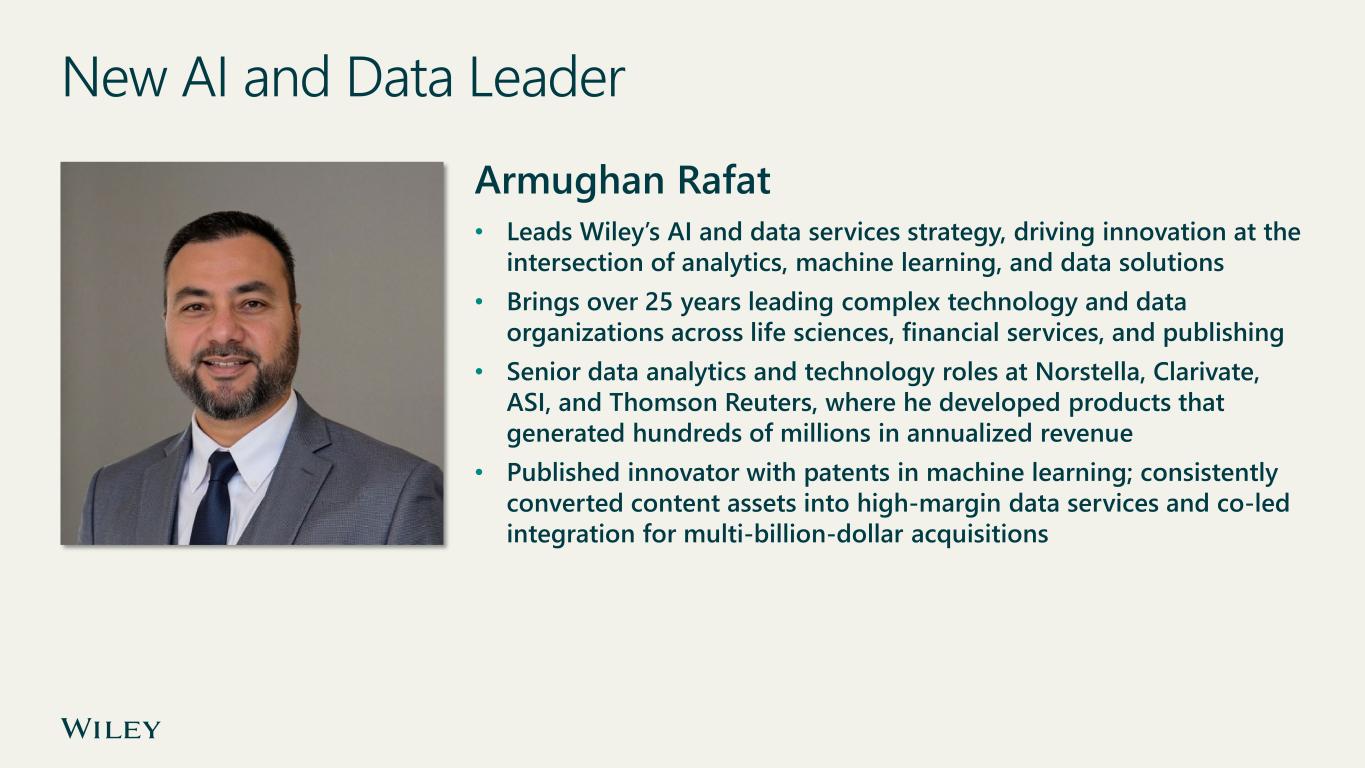
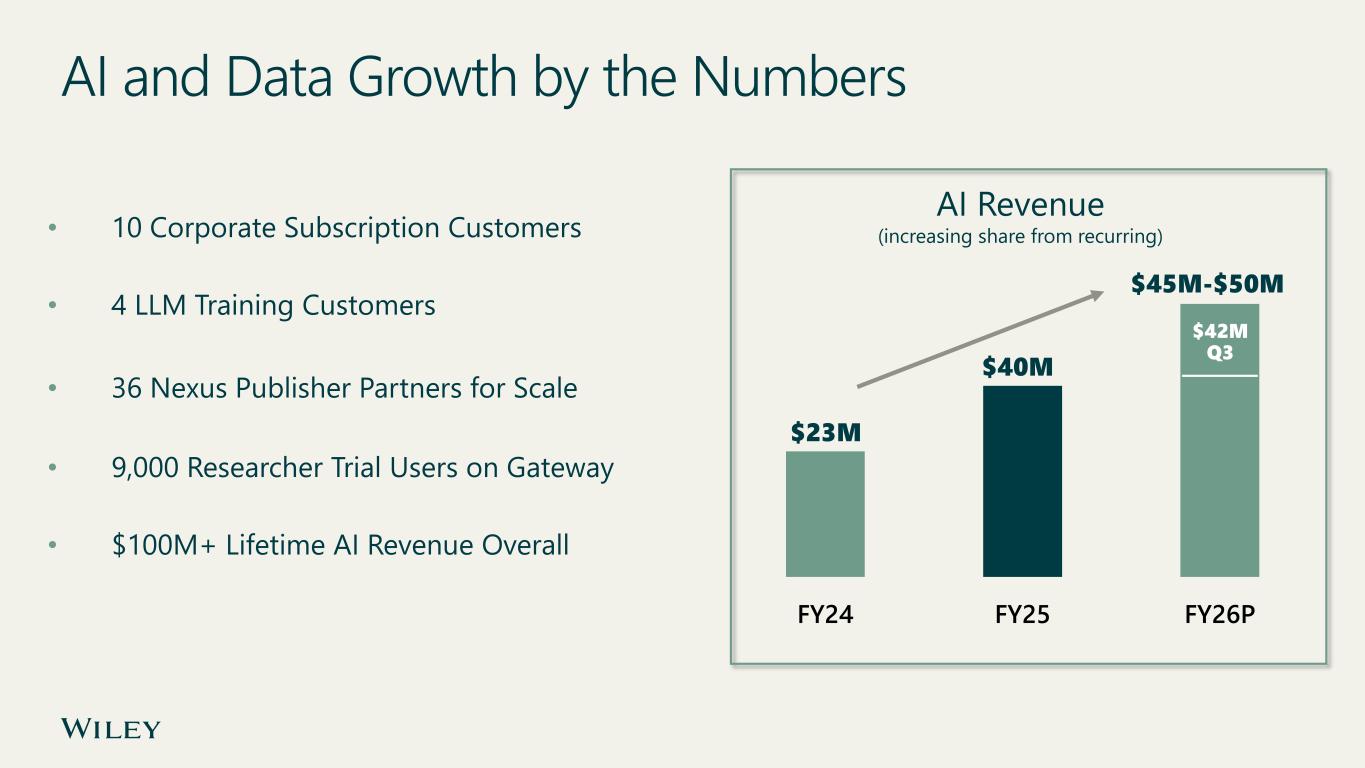
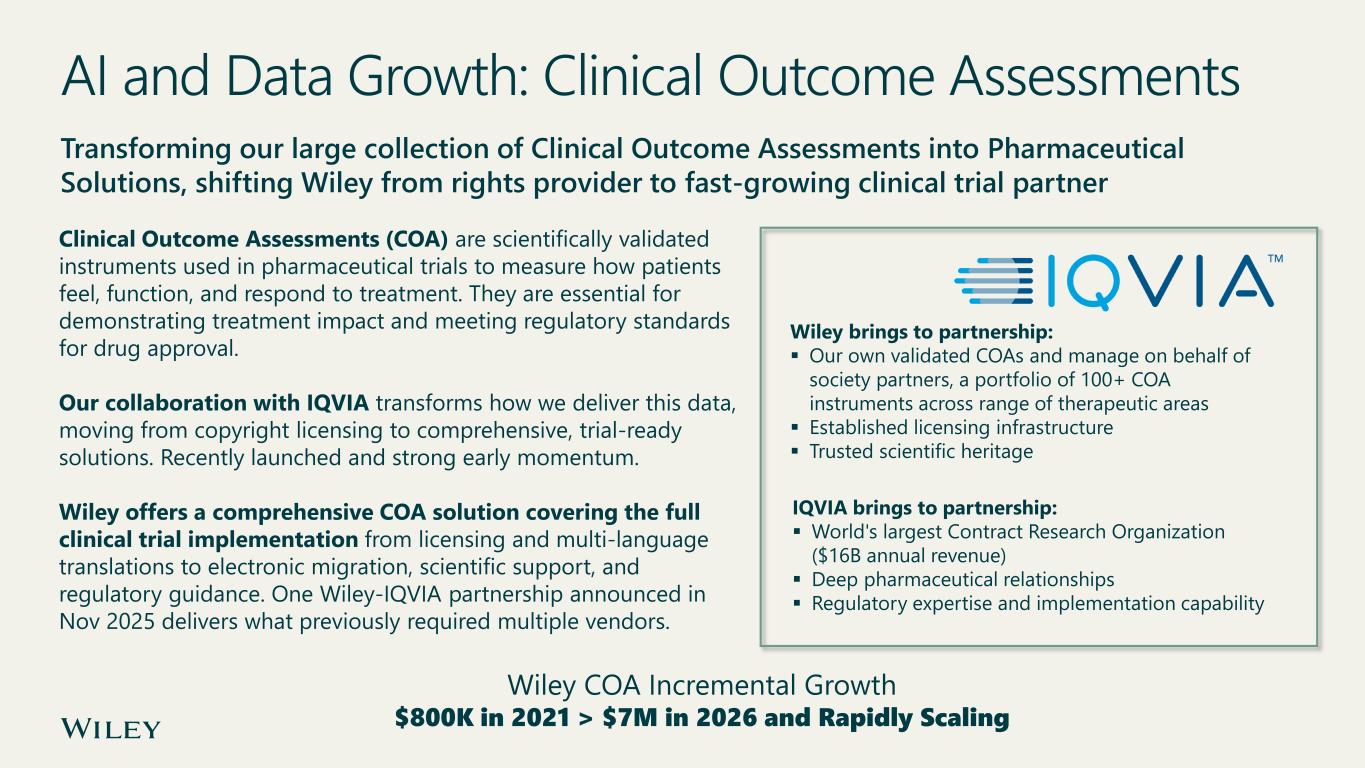
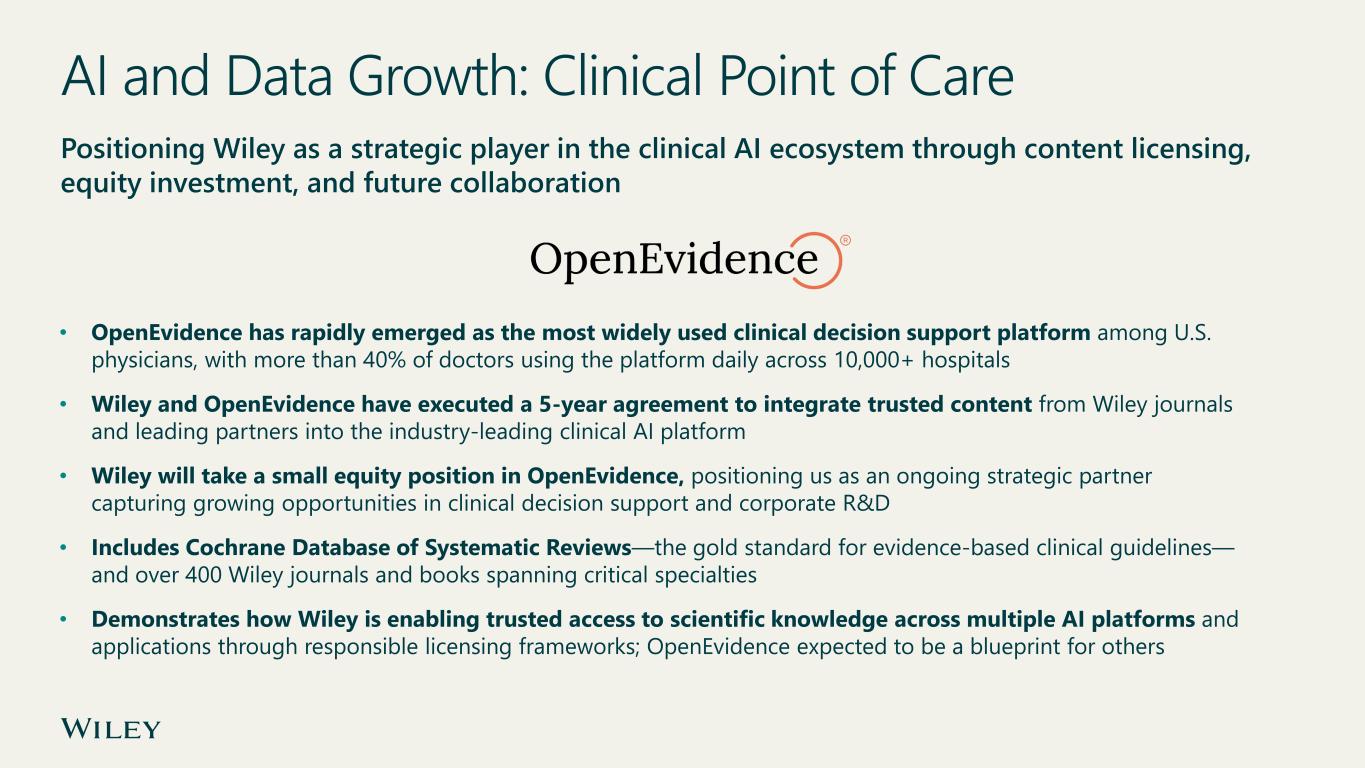
Thank you, Brian. Hello, everyone, and welcome to our fiscal Q3 earnings update. before i get to our performance in progress i want to acknowledge our price amid ai fears across the market the fact is we don't share those same fears quite the opposite we couldn't be more confident in our position in the ai economy given our proprietary content advantage wide mode in peer-reviewed research, and unparalleled partnership ecosystem. The ongoing opportunity is twofold. AI is expected to greatly accelerate scientific discovery and research publishing output, and our enriched data and AI solutions are foundational for corporate R&D, AI models, and applications. I will discuss this in more detail later in our call. The third quarter was fully in line with our stated expectations. Revenue performance was impacted by unfavorable comparables in research, which we called out in the second quarter, and soft market conditions in learning. We continued to accelerate in all major areas of focus. Research publishing continues to outpace the market with global output up 11%, revenue up 4%, excluding AI revenue, and steady growth in our multi-year renewals. In AI and data services, we announced new leadership, launched our clinical outcome assessments partnership with IQVIA, and after quarter close, executed a strategic multi-year partnership with open evidence to deliver trusted research at the point of medical care. We also secured a new AI model training customer, our first outside the U.S., and realized $7 million of AI revenue. We are rapidly advancing our technology transformation initiatives with the announcement of a multi-year managed services partnership with Virtusa. We also continue to deliver corporate expense savings on an adjusted EBITDA basis, down 21% in the quarter or $9 million versus prior year. We continue to deliver material margin expansion and cash flow growth with adjusted operating margin up 280 basis points, adjusted EBITDA up 250 basis points, and operating cash flow nearly doubling to $103 million. And we are returning more cash to shareholders with repurchases doubling in Q3 to $70 million year-to-date as part of a $100 million full-year target. We've returned $126 million in dividend and repurchases in just nine months, a 37% increase over prior year. let's turn to how we're executing on our fiscal 26 commitments our first objective is to lead in research it's been a robust year for research with revenue up four percent at constant currency and adjusted EBITDA up six percent we continue to outpace the market in submissions and output up 26% and 11%. Strong demand is evident across all regions. We've now migrated over 80% of journals to our competitively advantaged research exchange platform. Importantly, this migration is what transforms our content from published articles into AI-ready data, The foundation that makes everything we're doing in gateway, licensing, and subscription knowledge feeds possible. And we continue to expand our journal portfolio through organic investment in our flagship advanced collection, with eight new journals planned for launch and revenue growth of 50% in our leading open access journal, Advanced Science. Our second objective is to deliver new growth in AI and adjacent markets. We've generated a record $42 million in AI revenue year-to-date above last year's total of $40 million, with one quarter remaining. We continue to make critical inroads into the corporate market with strategic projects executed with healthcare innovators, IQVIA and OpenEvidence, and other customers for subscription knowledge feeds. We're now at 36 publishing partners for our Nexus content licensing service, and we are in active discussions with others. Finally, we continue to see strong researcher interest in our AI gateway for scholarly search, delivered through partnership with leading companies like Anthropic and Amazon Web Services. Our third objective is to drive operational excellence and discipline across our organization. We continue to streamline our cost structure with corporate expenses on an adjusted EBITDA basis down 21% for the quarter and 12% year to date. Tech transformation took a significant step forward with our recent managed services partnership, which Craig will talk more about in detail. Let me run through our four key strategic priorities and value drivers. First, we are accelerating research core growth and delivering shared gains from our wide moat, scale, and highly favorable demand trends from global expansion and AI productivity. The research publishing market is growing at 3 to 4 percent, and we expect to deliver at the top end of that this year. We are delivering new AI and data analytics growth from our proprietary content in critical AI domains and our extensive partnership ecosystem. As noted, we've already surpassed last year's AI revenue total with $42 million and a quarter remaining. We are driving multi-year margin expansion, with our EBITDA margin up 500 basis points since fiscal 23, and plans for continued material improvement going forward. And finally, underpinning all of this is our discipline in managing our portfolio, deploying capital on high-return investments, and returning cash to shareholders. let's turn to our core for much of calendar 25 we've been navigating around proposed u.s funding cuts to science and education a year ago i said that we remain fully confident that u.s research would continue to receive federal support given the essential role that it plays in U.S. economic growth and U.S. global competitiveness. I'm pleased to report that federal investment in scientific research remains resilient, with Congress ultimately enacting significantly smaller reductions than those proposed by the administration, and in key cases, maintaining or modestly increasing agency budgets. This outcome reflects continued bipartisan recognition that sustained funding is critical to the nation's scientific infrastructure, long-term competitiveness, and innovation capacity. Our calendar 26 renewal season is about 82% complete, and we're encouraged by the growth we're seeing there. Our subscriptions and transformational agreements are must-have content, which is core to institutions and essential to their missions. We recently marked a milestone of 125 multi-year transformational agreements for consortia, representing over 3,000 institutions. Our recurring models, representing about 70% of research publishing, remain robust. Let's talk about open access as an incremental growth engine. As discussed, research output is ever increasing, driven by global R&D spend and other factors. Submissions remain at record levels as the number of global researchers increase. and productivity gains accelerate. The rate of research output is expected to rise significantly with AI. One recent study showed a three-fold increase in the number of papers by researchers who use AI, and we're just at the beginning. Big global publishers like Wiley stand to benefit most. This volume increases the value of our multi-year subscription and transformational agreements and accelerates growth in author-funded open access, where revenue is a function of price times quantity. This model is growing consistently above 20%, and demand and pricing power remain robust. I want to call out our investment in the Advanced Journal brand and Advanced Science in particular. Researchers are drawn to multidisciplinary publications like Advanced Science for the brand, the impact factor, and the breadth of the audience it reaches. It has become one of the leading open access journals in the world. The Advanced portfolio as a whole will exceed $70 million in revenue in Fiscal 26, growing at strong double digits. Long-term trends in research look increasingly favorable. AI is expected to be a major output accelerator, and research publishing remains essential for not only discovery and prestige, but to advance researchers' careers and secure additional funding. This is what makes the business and its growth so strong and durable through continuous technological and societal change. Because of this and expected AI-driven volume acceleration, we're expanding our journal portfolio and modernizing our publishing platform and workflows to continuously benefit from this evolution. Large-scale, high-quality publishers like Wiley are reporting market share gains, and we expect this trend to continue for the foreseeable future. And as we've seen time and time again, research, funding, and publication remain must-haves across economic cycles and political uncertainties. What makes us so well-positioned for the AI economy? First, we provide access to much of the world's proprietary scientific, technical, and medical content through our own portfolio and that of our publishing partners. As we know, science is constantly evolving. In fact, over 14,000 new peer-reviewed articles are published every day. second we enjoy an industry leading position in fast-growing knowledge domains that are especially relevant for AI chemistry material science oncology technology and engineering food science and finance Wiley is the lifeblood third in an ever-changing world saturated with wrong information and skepticism our trust and reputation are distinct advantages our mode here is not only our journal brands but our unmatched peer review networks and editorial boards we are home to hundreds of nobel prize winners and the world's leading societies from the american cancer society to the american geophysical union fourth we're not encumbered by legacy platform businesses that we're trying to defend we have embraced an ai first approach and enjoy first mover advantage with model developers and corporations building out ai models and applications so much so that other publishers want to be part of our network fifth we have built an unparalleled partner ecosystem how many companies can point to a partner network that spans the world's most prestigious universities and academic societies the largest llm providers and ai innovators multinational corporations and global publishers our ecosystem approach is our secret sauce we're partnering not competing we're integrating not building we have the luxury of not having to defend existing business models which may be threatened by ai finally this gives us an advantageous capital light model we have the content advantage we can then leverage external infrastructure and interoperability while enabling broader collaboration across the ecosystem this reduces our capital requirements and creates network effects that benefit all participants it also means we don't have to bet on a particular technology as our open approach works across all platforms we see this already with our iqvia and open evidence momentum and with our connector on claude in aws with that in mind let's turn to our ai and data strategy at the foundational level we're a research and learning publisher leveraging our proprietary content and data for ai then comes our gateway platform, which addresses a problem every researcher faces today. AI tools are proliferating, but most are built on unverified or incomplete scientific content. The full potential of AI in science will only be realized if researchers have complete confidence in the authenticity of their ai tools and the ai environment gateway solves this by embedding peer-reviewed full-text wiley and partner content directly into the platforms where researchers already are claude aws perplexity and others we are gratified by the early response in just four months 9 000 researchers have registered on the platform in addition to a growing number of institutions signing up for enterprise access this is early but clear evidence of product market fit gateway is not just a search tool it is the access layer through which trusted scientific knowledge enters the ai workflow and the layer institutions will increasingly require as a baseline for responsible AI use in research. Finally, our enriched data and AI solutions become the foundation for domain-specific intelligence, which we've referred to as subscription knowledge feeds or retrieval augmentation generation customers here include corporations and partners in life sciences healthcare engineering and industrials food and agriculture and financial services wiley is at a pivotal point in its upward trajectory as ai related demand for our content and research intelligence accelerates across industry verticals The time was right to bring in a world-class leader to convert our content advantage into high-margin data services and commercialize our AI-driven offerings. And so we recently announced the appointment of Armahan Rafat as our Chief AI and Data Services Officer. Armahan brings over 25 years of experience leading technology and data organizations, serving in senior roles at Nostella, Thomson Reuters, Clarivate, and others. His track record for developing analytics products generating hundreds of millions of annual revenue has been exceptional. As he stated in the recent announcement of his appointment, in an era where AI is only as effective as the data that fuels it, the proprietary content Wiley publishes represents the verified foundational truth that AI and machine learning require. In terms of underlying momentum, we now count 10 corporate customers for our subscription services, and we have secured a new LLM customer for our training services. We continue to add more publishing partners to our licensing network. we expect to deliver ai revenue of 45 to 50 million dollars this year up from 40 million in fiscal 25 and 23 million in fiscal 24. we anticipate another big year for total ai revenue in fiscal 27. i'd like to share some examples of real use cases where we are converting our content advantage into practical solutions for major corporations and through recurring revenue models. First, Clinical Outcome Assessments, or COA, are scientifically validated instruments used in pharmaceutical trials to measure how patients feel, function, and respond. COAs are essential for demonstrating treatment impact and meeting regulatory standards for drug approval. Wiley and his partners have one of the largest collections of COAs going back decades. It is a rapidly growing area for us, expanding from 800,000 in 2021 to nearly 7 million today. What makes this different is what it means for the pharmaceutical customer previously running a clinical trial meant assembling multiple vendors from coa licensing to regulatory guidance that friction costs time and money wiley acuvia consolidates that into a single trusted relationship acuvia is the world's largest contract research organization, driving $16 billion of annual revenue, bringing deep pharmaceutical relationships, regulatory expertise, and implementation scale. Wiley brings the validated instruments, a portfolio of 100-plus COA instruments managed on behalf of our society partners and trusted scientific heritage. So it's not just a licensing deal. It's a recurring workflow transformation and the kind of deeply embedded relationship that compounds in value as trials grow more complex and the regulatory bar rises. We're really excited about this opportunity now and the scaling potential ahead. We've executed COA agreements with the top 20 pharma companies, and our global pipeline continues to grow. Two days ago, we announced a strategic partnership with Open Evidence, the most widely used clinical decision support platform among U.S. physicians, with more than 40 percent of doctors using the platform daily across 10,000 hospitals. Open Evidence will bring our trusted scientific content and that of our partners into their rapidly expanding ai platform the terms of the deal include a five-year multi-million dollar licensing agreement for a selection of over 400 journal titles and reference book as well as the cochran database of systematic reviews as part of the partnership wiley has taken a small equity position and open evidence underscoring our mutual commitment to building the future of clinical ai together. Important to note, we consider this a first step in our multi-year collaboration. Let me finish with a quote from Open Evidence CEO and founder Daniel Nadler. The hard problem in medicine right now isn't just generating new knowledge. We're living through a golden age of biomedical research. The hard problem is also that it takes 17 years for a fraction of that research to reach the bedside. Wiley is an ideal partner in solving this problem for physicians. The depth and breadth of Wiley's content reinforces the advantages of open evidence for physicians and that compounds over time. As with IQVIA, this partnership is not just a licensing arrangement. Wiley is embedding itself into the daily clinical decision-making of physicians our equity position reflects our conviction that this is where trusted scientific content meets its highest value application and importantly we see this as a template for many others bringing wiley's content advantage directly into the workflow platforms where critical high stakes decisions are made as i mentioned earlier our partner ecosystem is a huge strategic advantage for us, bringing together AI innovators, R&D-centric corporations, leading institutions, and other publishers. It's only the beginning. I'll now turn the call over to Craig.
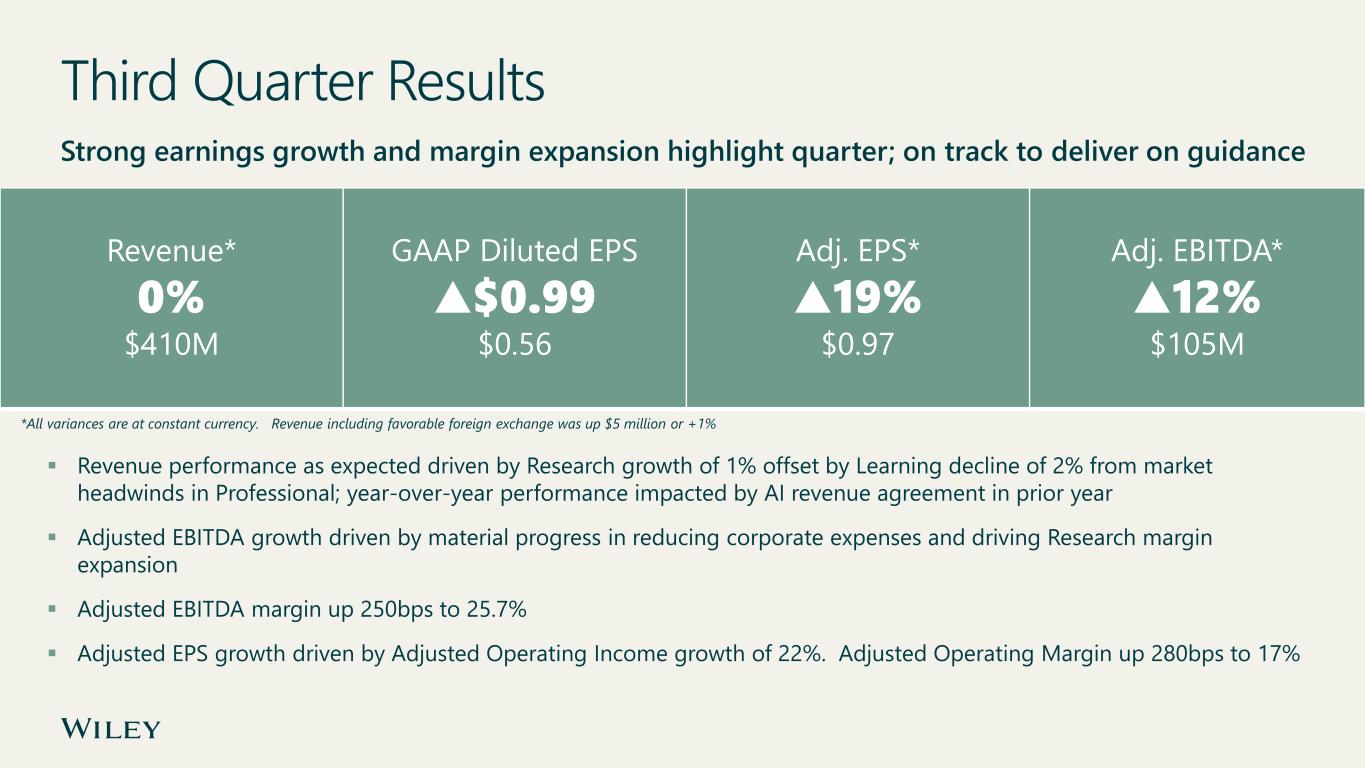
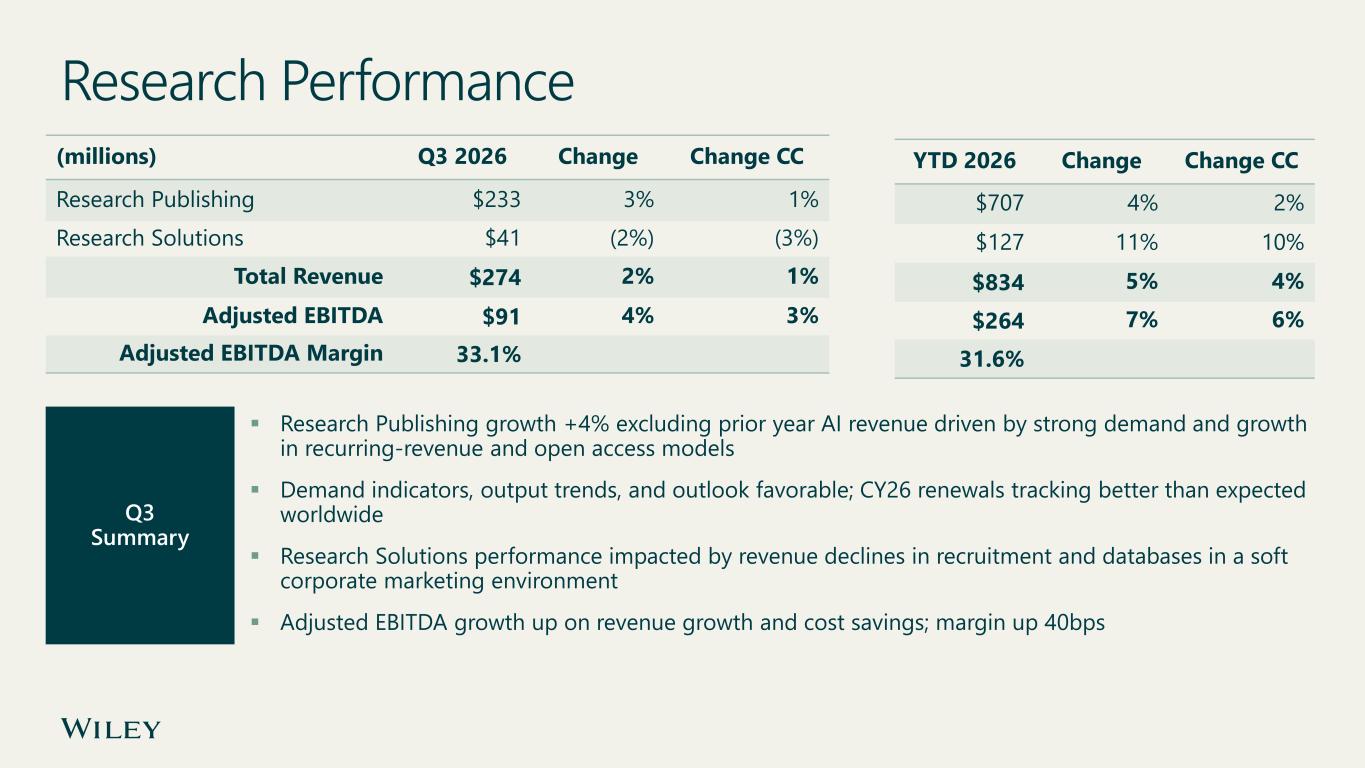
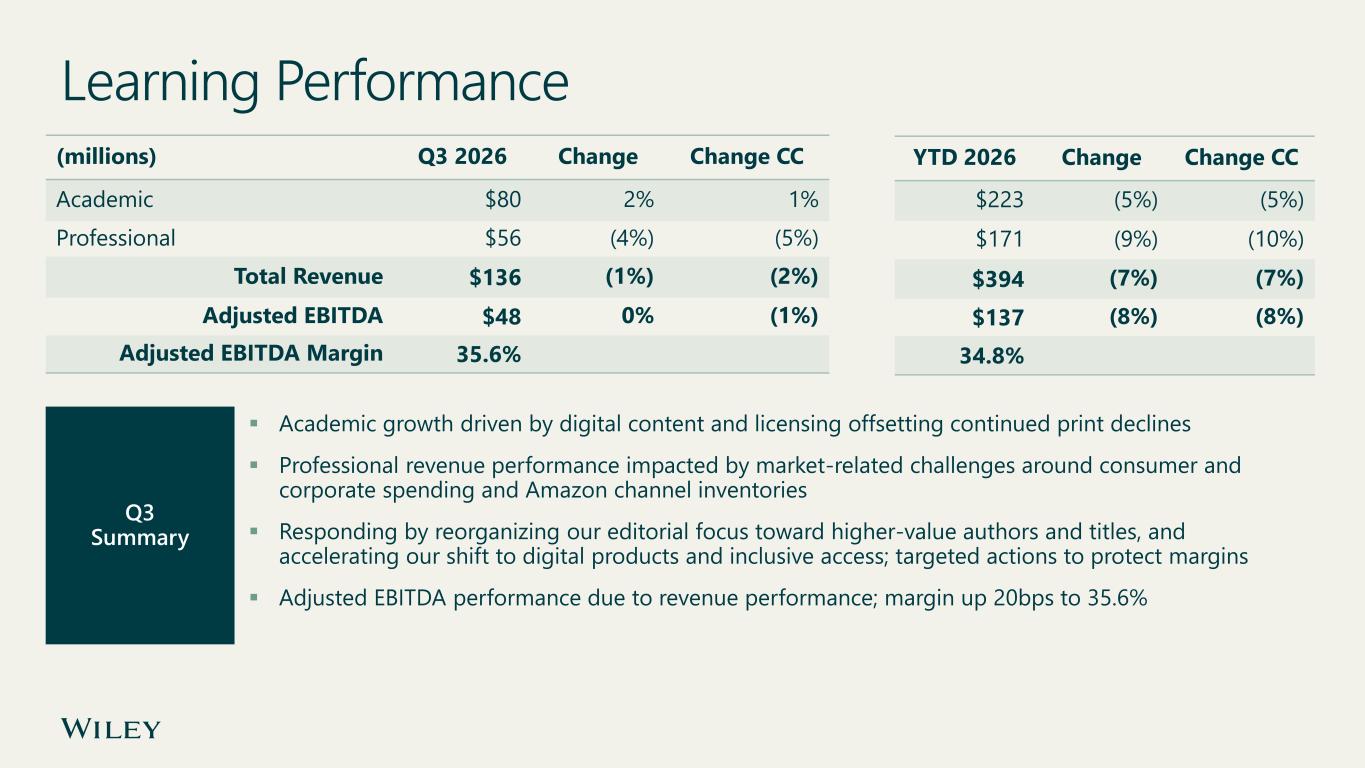
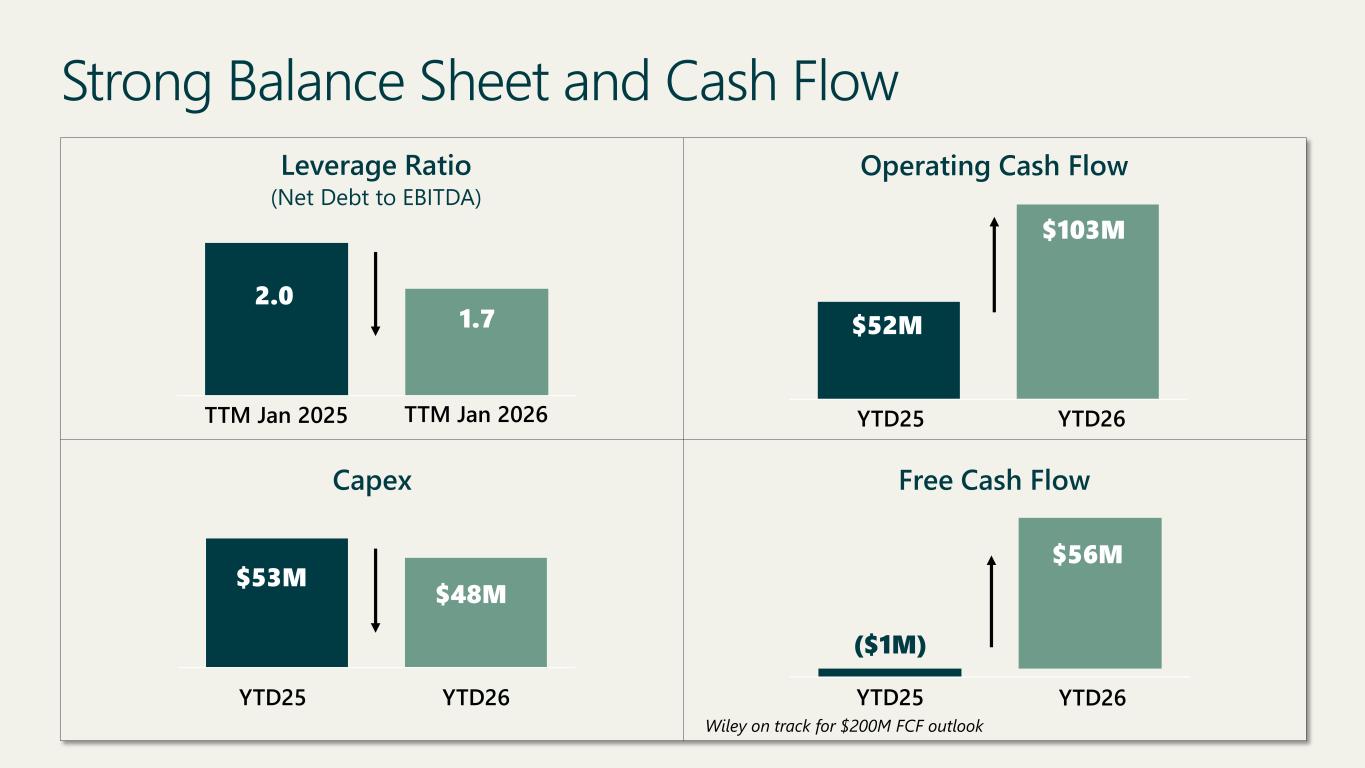
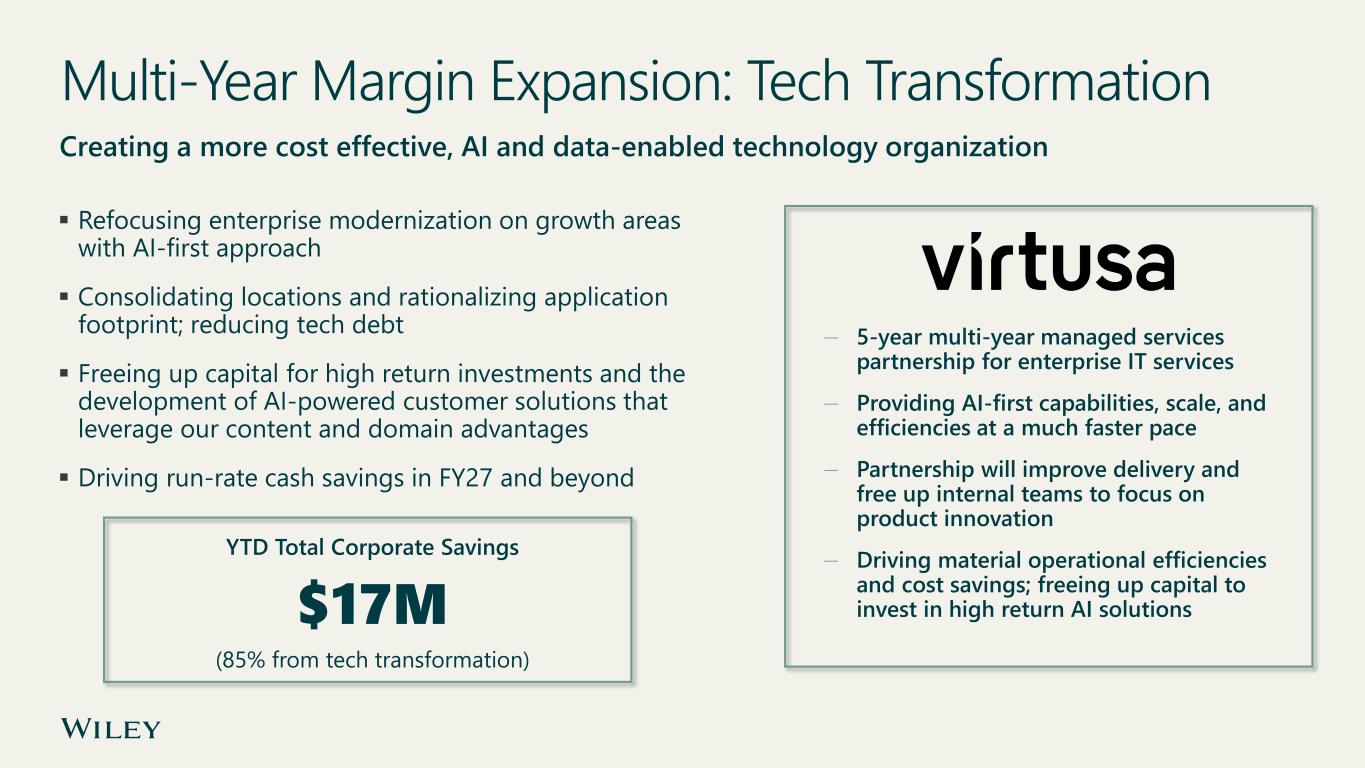
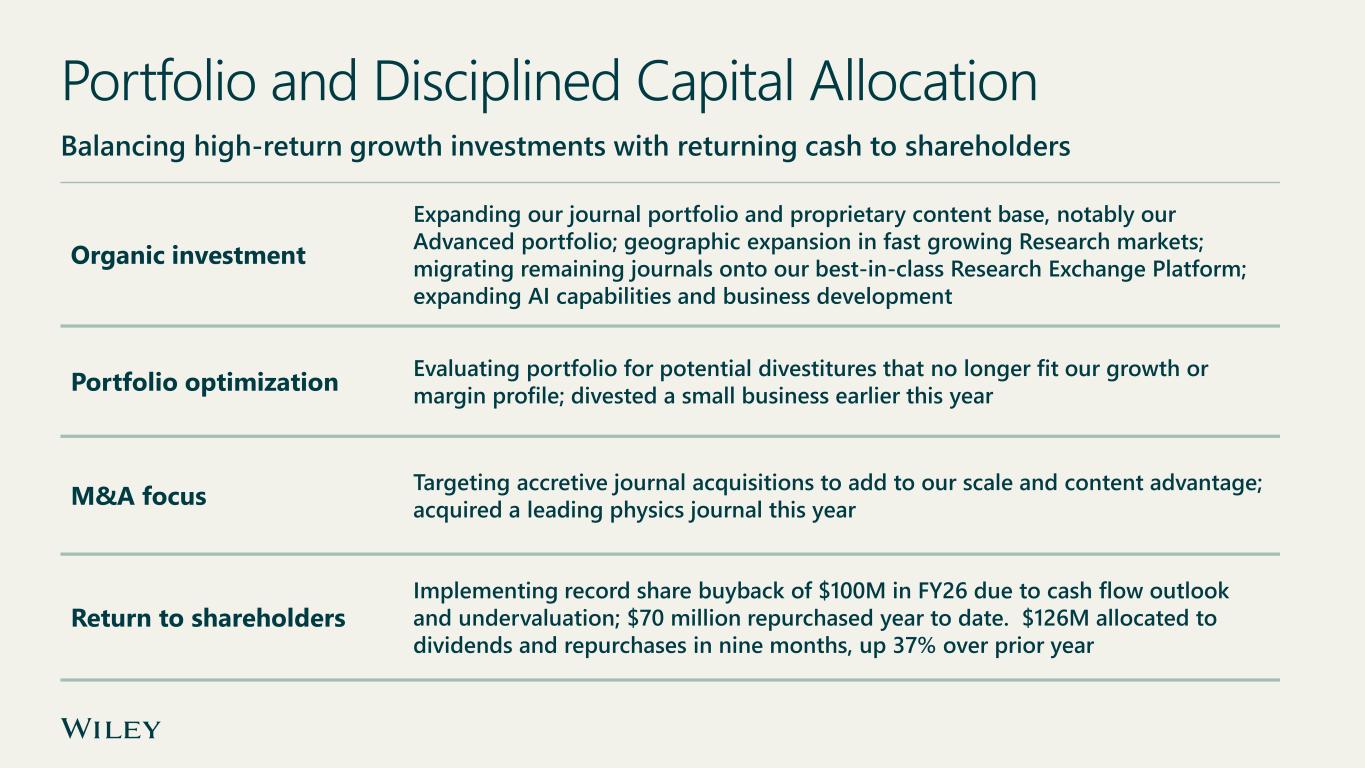
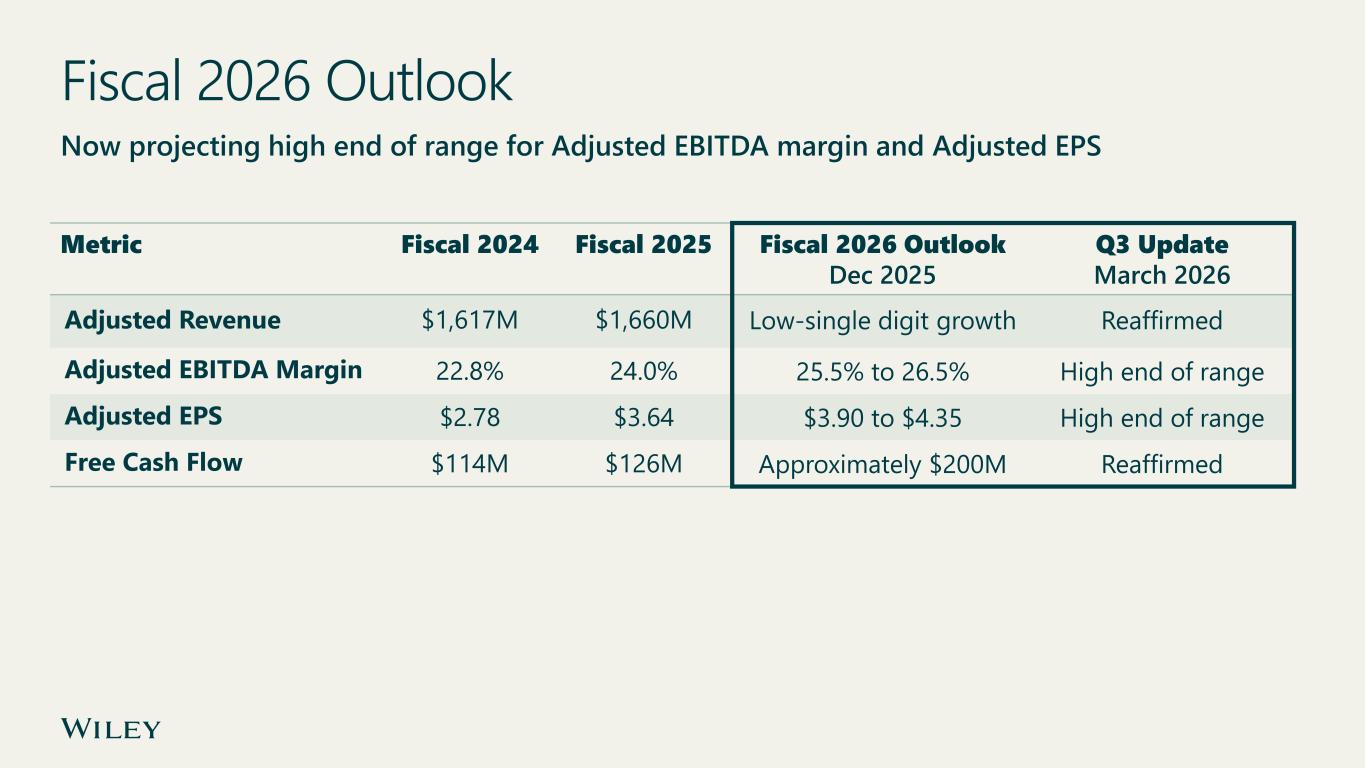
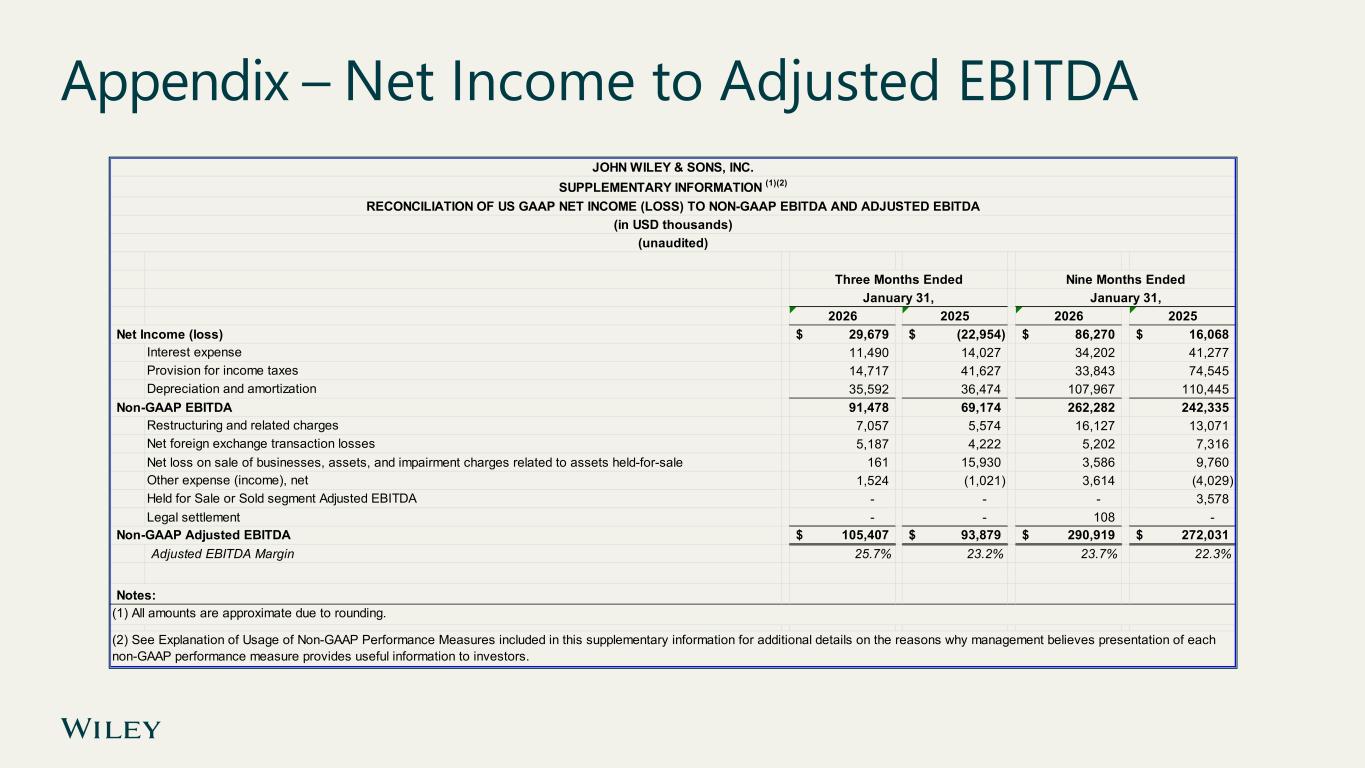
Thank you, Matt, and hello, everyone. Three summary points that define where we stand today. Research publishing is growing at the high end of the market's long-term rate. AI revenue is tracking ahead of expectations, and importantly, we're beginning to see leading indicators of recurring revenue growth in new partnerships pilots and pipeline which is where the real value gets built and our balance sheet is very strong giving us the capacity to invest in high return growth opportunities learning continues to face macro and channel headwinds that are masking the underlying earnings power of our business but we're managing through it with discipline and agility while keeping our focus squarely on the businesses and investments driving long-term value creation. Turning to our fiscal third quarter results, we projected a light quarter due to unfavorable comps and overall revenue came in as expected, up 1% on a reported basis and flat at constant currency. Growth in research publishing and academic was offset by moderate declines in research solutions and professional. Reflecting our commitment to operating discipline, we delivered strong margin expansion and profit growth even with revenue softness. Adjusted operating income, adjusted EPS, and adjusted EBITDA were all of double digits or 22%, 19%, and 12% respectively. Our adjusted operating margin improved by 280 basis points and adjusted EBITDA margin by 250 basis points. Adjusted EPS growth was driven by our operating performance and the lower share count as we remain in the market acquiring shares. This was partially offset by a higher adjusted effective tax rate. Let me turn to our segment performance, starting with research. Research was up 1% with a 40 basis point improvement in EBITDA margin. Research publishing performance was impacted by $9 million of AI revenue in the prior year period. Absent AI revenues, research publishing was up over 4% driven by record submissions, solid growth in our recurring revenue models, and over double-digit growth in author-funded open access. As Matt noted, journal licensing renewals are around 82% complete and signs look good. As a reminder, about a third of our renewals come up each year and customer retention remains above 99%. Our solid renewals combined with our continued submissions and output growth give us good visibility and confidence heading into fiscal 27. Research solutions declined 3% due to lower corporate spending on recruiting and lower database revenue, offsetting AI revenue. Year-to-date, research revenue and adjusted EBITDA were up 4% and 6% respectively, with EBITDA margin improving 50 basis points. Moving over to learning, revenue was down 2% in the quarter, with a 5% decline in professional, offsetting 1% growth in academic. Professional was impacted by corporate and consumer spending headwinds, notably the previously noted Amazon inventory management adjustments, although they are now beginning to stabilize as expected. We're strategically calibrating our editorial focus toward higher value franchises where we see stronger demand and better margins. academic rose 1% driven by higher rights and licensing revenue and digital book sales we saw good momentum in our advanced content business which includes scientific and technical books for research libraries we increased our title signings notably around veterinary science and health and recently announced a publishing partnership with the international society of automation wiley will assume control of isa's backlist of approximately 70 titles and collaborate on publishing ISA's pipeline of automation topics. Year-to-date, learning revenue is down 7%, with adjusted EBITDA down 8%. Segment EBITDA margin declined 50 basis points to 34.8%. Now, on to our financial position in cash generation, which continue to strengthen. All year-over-year metrics are favorable, with our leverage down to 1.7 from 2.0, CapEx down by 11%, operating cash flow up 51 million, and free cash flow up 57 million. We're tracking very well to our free cash flow outlook of approximately 200 million. As Matt noted, one of our four value drivers is continuing our multi-year margin expansion. Over the past three years, we've improved our margin profile by 500 basis points, and we're not done. The focus right now is technology transformation. we're creating an AI-first, data-enabled tech organization, optimizing our geographic footprint, rationalizing our application portfolio, and outsourcing support for enterprise technology. We recently announced a five-year managed services partnership with Fertuza, an important first step in accelerating this transformation. Fertuza is a leading product and platform engineering services company based in Massachusetts with delivery centers in India and Sri Lanka. It enjoys top-tier global rankings in consulting and IT services and deep relationships with major Fortune 100 and 500 clients. The partnership is expected to lead to material operational efficiencies and cost savings, help us modernize how we manage enterprise technology, and allow our teams to focus on product innovation that benefits our customers and stakeholders. It will also free up capital for high-return AI solutions for our customers and partners. As part of this partnership, and our own consolidation plans, Vertuza has assumed ownership of Wiley's Sri Lanka technology operation. Overall, we continue to make good progress, with corporate expenses on an adjusted EBITDA basis down 21% in the quarter and 12% year-to-date. We reduced total corporate costs before allocations by $17 million year-to-date, with tech transformation responsible for approximately 85% of those savings. Our fourth and final value driver is to optimize our portfolio and drive disciplined capital allocation we continue to deploy capital strategically to expand our journal portfolio and content advantage we're investing to grow presence and share in our fastest growing research markets notably china and india china's been a great success story with noteworthy growth in submissions and output renewals and corporate sales india remains a huge and still emerging growth market a year ago we executed on india's one nation one subscription initiative expanding access to over 6,000 Indian institutions and supporting 18 million researchers and students. Demonstrating the increasing demand we're seeing in this important market, Wiley India submissions are up 43% year-to-date. Matt talked about our capital light model and partnership ecosystem approach to AI, which positions us well for stronger profitability, high cash flow generation, high returns on invested capital, and nimbleness in scaling. Regarding our portfolio, we continue to evaluate and manage specific businesses and products for profitability and strategic fit. We divested a small business in research solutions earlier this year and will continue to be very active on this front. Regarding acquisitions, we're in a very strong position to continue to pursue high-impact journals and research publishing businesses where we see strategic value, synergies, and highly attractive returns. Last quarter, we acquired the high-impact journal Nanophotonics, strengthening our physics portfolio and putting us at the forefront of the fast-growing optics field. And we will continue to accelerate our organic growth strategy of developing proprietary high-value research content and data. Finally, I want to highlight our share repurchases, approaching record levels with 70 million returned year-to-date and a further target of 30 million for Q4. That would put us around 3 million shares repurchased for the year. On top of this, our current dividend yield is approximately 4.5%, supported by a healthy payout ratio. Turning to our outlook for fiscal 26, we're raising our adjusted EBITDA margin and adjusted EPS guidance to the high end of the range, and we remain confident on all other metrics. Revenue growth is expected to be in the low single digits. Research remains strong, expected to finish at the top end of the market, while learning has been challenged this year by the difficult macro and channel conditions. Adjusted EBITDA margin is now expected to finish at the high end of our 25.5% to 26.5% range, up from 24% last year. Adjusted EPS is also expected to be at the high end of our 390 to 435 range, up from 364 last year. Finally, we reaffirm free cash flow of approximately $200 million, driven by EBITDA growth, lower interest payments, and favorable working capital. CapEx is expected to be comparable to last year's total of $77 million. With that, I'll pass the call back to Matt.
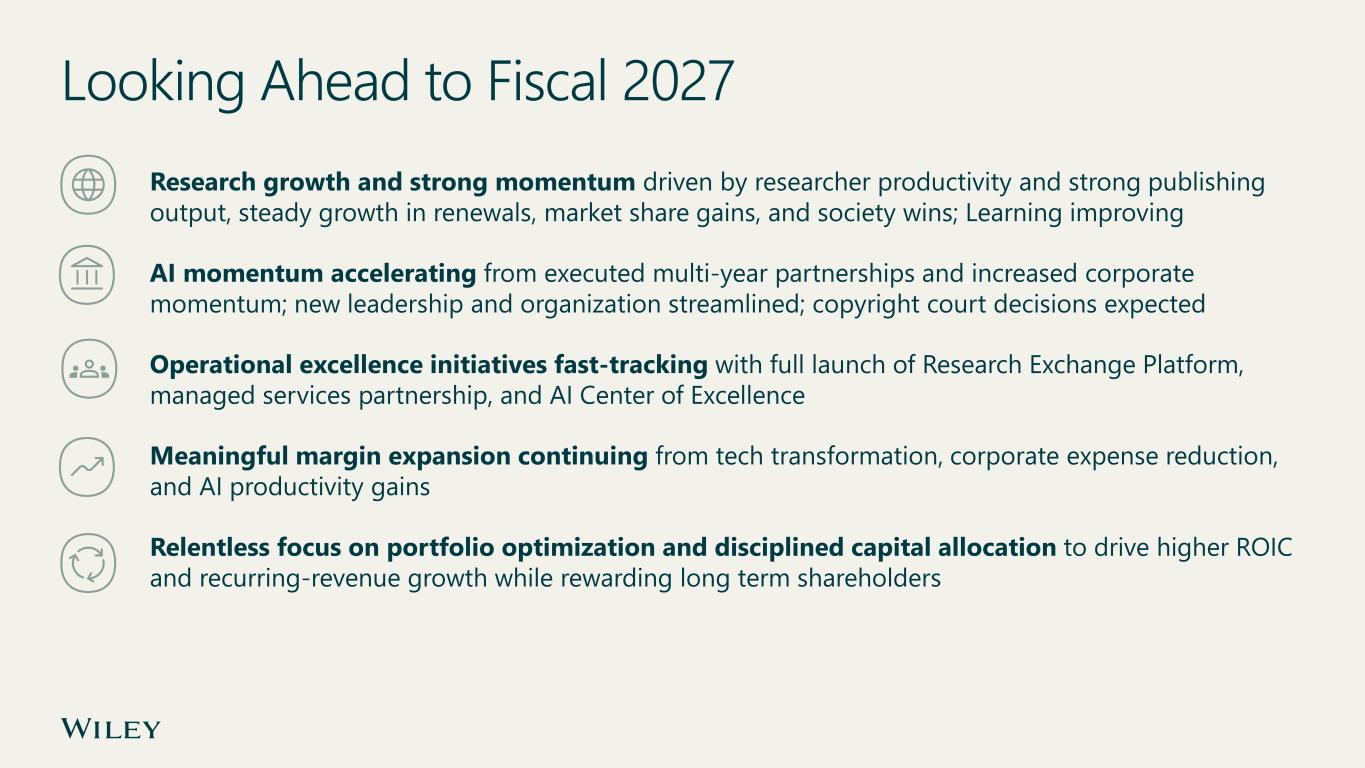
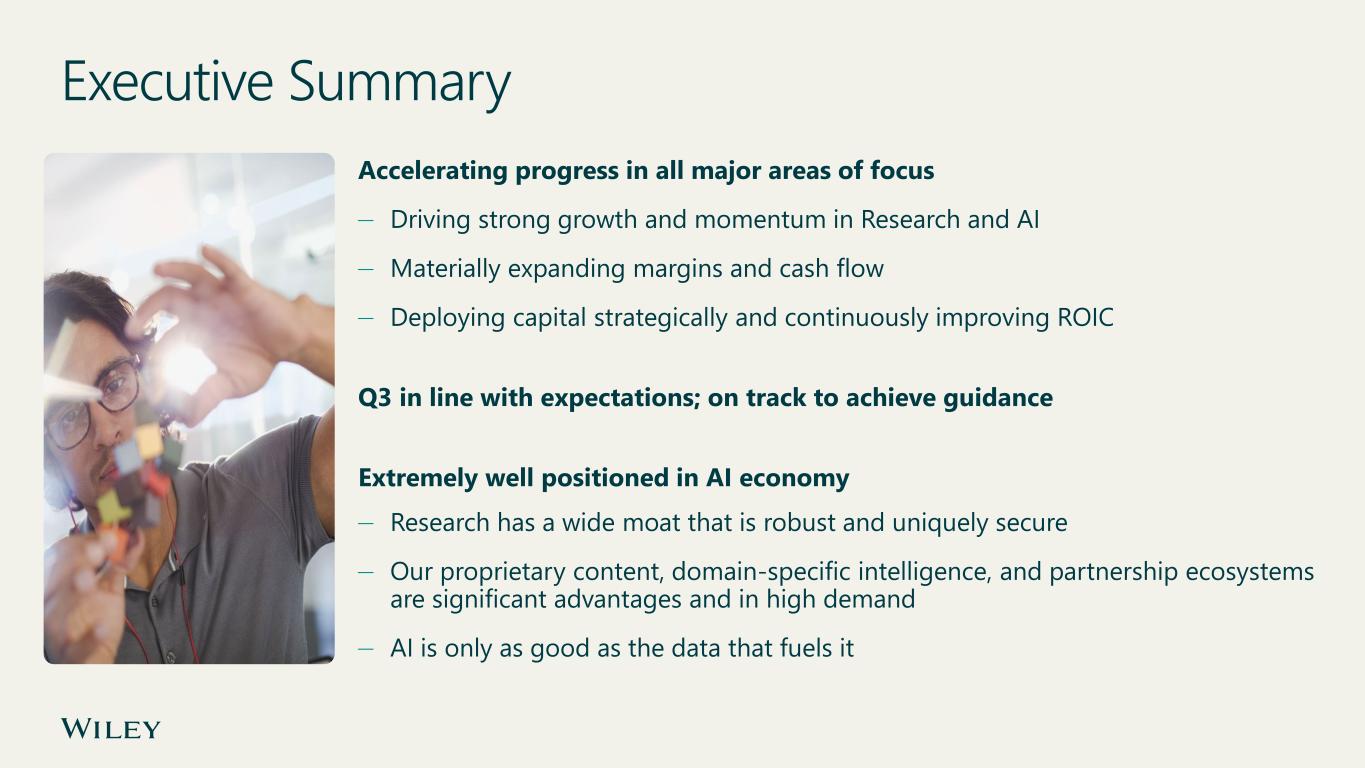
As I wrap up, I want to say a few words about fiscal 27. We'll provide formal guidance in June, of course, but I want to give you a sense of what we're seeing. We expect research growth and strong momentum to continue, driven by robust publishing output, steady growth and renewals, market share gains, and society wins. We see learning improving to a steady state as we focus on franchise authors, digital growth, and inclusive access, and will continue to tackle our cost base. A.I. Momentum is expected to further accelerate from our executed multi-year partnerships and increased corporate uptake, and we expect another big year in A.I. revenue. We will start to see the benefits of streamlined business development and product innovation under Armahand. Finally, we anticipate copyright court decisions to start to materialize. We've talked about the Anthropic Copyright Settlement, the largest in U.S. history, and that is still in the claims process. We expect to know our share of that by the summer. Important to note, there are approximately 70 copyright lawsuits currently underway in the U.S. involving AI. Our operational excellence initiatives are fast-tracking. With full launch of our research exchange platform, the kickoff of our new managed services partnership, and the momentum of our AI center of excellence. We expect to drive meaningful margin expansion again from tech transformation, corporate expense reduction, and AI productivity gains. And we remain focused on portfolio optimization and disciplined capital allocation to drive higher ROIC and recurring revenue growth, scale up in research publishing, and reward our long-term shareholders. Let me quickly review some key takeaways before opening the floor to questions. We're accelerating our progress on all major areas of focus, driving meaningful growth and momentum in research and AI, expanding margins and cash flow, deploying capital strategically, and improving ROIC. Q3 was in line with our expectations, and we're on track to achieve our full-year outlook at the high end for margin and EPS. And finally, Wiley remains extremely well positioned for the ai economy our core publishing business is robust and uniquely secure our proprietary content domain specific intelligence and partnership ecosystem are in continuously high demand ai is only as good as the data that fuels it this is where wiley comes in Thank you to our 5,000 colleagues around the world for all you do to transform knowledge into the breakthroughs that matter, and to our investors for joining us in seeing the long-term value creation potential of our business. I'll open the floor to questions.
Operator
At this time, I would like to remind everyone, in order to ask a question, press star, then the number one on your telephone keypad. We'll pause for just a moment to compile the Q&A roster. Your first question comes from the line of Daniel Moore with CJS Securities. Your line is open.
Thanks, Matt. A lot of detail there. Greatly appreciated. Let me start. I guess we'll start with AI. You just laid it out very well, but two years ago, sign your first kind of initial non-recurring deals. You know, since then, AI-related revenue doubled from $23 million to $40 million on our way to $45 million to $50 million. You know, what can you tell us about the momentum and direction of AI-related revenue and contributions that, you know, maybe you couldn't two years ago as we think about fiscal 26 as a platform for growth?
Yeah, let me start. Dan, thanks, by the way. And that's exactly what you're seeing. You're seeing the market evolve. And I'll turn it to Craig in a minute to get a little more specific. And then the emergence of the business models around recurring revenue. And so you see what we've done with IQVIA and Open Evidence, almost think of them as blueprints for what a much bigger market opportunity might look like. And, you know, I know you want specifics. You know, we can talk a little bit about these, but, you know, there's a lot more to come as these expand. So let me turn it over to Craig to add some more light on that.
We like to think of the AI opportunity in the market really moving in different kind of growth curves. As you know, we kind of a few years ago, as you mentioned, kind of really started learning and getting into the market and partnering. and we moved into the the training model the first growth curve if you will which was largely evidenced by non-recurring revenue but important for us to gain partnerships learn and start to develop where we were headed with our next curve and then that next curve being the one where we start to get into the recurring revenue models subscription models ways where we can really create true sustainable value over time and we've really started to see that materialize in the first growth curve. We've seen a little bit more legs to it than we initially imagined, and we are now starting to see the ramp up of the second growth curve. So this year we're slightly under 10% of our 45 to 50 million in terms of recurring revenue, and we expect that to triple next year, and we're going to continue to work to drive that even higher. So we're excited about the progress we're making.
It's still early days, and I would say we're moving as fast as our customers are moving um but um really trying to seize every opportunity as we go forward yeah i want to add two important points to help with the understanding one is that comment about we can move as fast as our customers are moving because you know i think everyone is learning how to bring ai into their core business processes so um a lot of the growth here is going to be based on the customer's learning on how to use AI to improve research productivity, shorten cycles, et cetera. We're there with them side by side. Second is, as I mentioned, we have a new leader for our AI and data services focus in Armahan, and he is now building out a growth plan. And, you know, I would expect as he completes that plan, we can provide more transparency into how we see this evolving.
Really helpful. Appreciate it. I was going to ask you about the moat, but I think we covered that in the first 10 or 15 minutes really well. On the margin side, you know, the obviously reduced corporate expense, I think $9 million this quarter, down 20% plus, on track for 26% plus EBITDA margins.
You know, two different questions, but one maybe elaborate on the the partnership with vertusa the implications around potential cost and savings as we move forward and what does that imply about the direction of ebitda margins and kind of fiscal 27 and beyond yeah thanks dan um we're very excited about the partnership with vertusa you know we we have a pre-existing relationship and we're really expanding that on a significant scale this relationship for us is a um you know roughly right it's a 150 million dollars over five years in terms of our contract size we expect it to generate both productivity as well as agility so we see it contributing towards you know our margin expansion objectives we also see it compelling uh propelling us into ai types of tools and ai first technology infrastructure that's going to really help us continue to find innovation and productivity through the years I would say from a margins perspective I won't get into the details about you know specifics on what it yields but I will say that tech transformation broadly has been a significant driver of our margin expansion this year and we expect that to continue going forward into the coming years as we layer on other types of initiatives as well that are going to really help us to continue to drive multi-year margin expansion.
Perfect. And just research publishing up 4%, adjusted article submissions, you know, continue to be really strong, up 26%. You know, I guess outside of China, you mentioned India, any other kind of fast-growing regions or pockets of strength. And, you know, given double-digit growth in submissions this quarter, double-digit growth and output, would we expect that 4% growth to trend even higher, or is that a good place to be from your perspective here from your term?
Jay, why don't you begin, and I may wrap up.
Yeah, sure. Hi, Dan. Thanks again for the questions. Yeah, we're seeing growth across a broad set of regions. The strongest momentum continues to come from the major global research markets. We saw good growth in China, as you mentioned, in India, as you mentioned, but in North America, too. Submission to article volume up there. European markets as well really rebounded strongly for us. Happy to see Japan growing again after a tough couple of years in that market. So at the same time, you know, we like what's happening in the Middle East, and we like what's happening uh it from a from a research and uh and investment perspective there uh governments and universities are investing more heavily in research output and in international collaborations um that taken together with the strong performance in the core markets gives us confidence about the trajectory of the business it's really important to state as we did a year ago that growth is not concentrated in any single geography it reflects the continued expansion as matt noted in the prepared remarks of the global research ecosystem and that's showing up across submission and publication volumes that are growing at a healthy pace so as we said you know top end of the of the market range for this year and with the investments we continue to make in top brands with the tailwind that AI is going to provide in the core for submissions and for researcher productivity, we feel confident as before in the trajectory of the business.
Yeah, that's a great summary. I think today what we're seeing is the resilience and durability of research on a global scale, the benefit of the global diversification that we have, as Jay pointed out. And also, our business is performing quite well, and I would expect it to continue performing at the top of the market.
That's great. Maybe one or two more, and I'll pass it along. But on the learning side, yeah, I think you talked about getting back to stability. If they sort of bifurcate the academic versus professional pieces of the business, um do we need the the you know the library on the professional side to feed either ai or is it you know synergistic it just that piece of the business stands out as a little bit you know kind of non-core when we think about the the real tilt to focus on growth and research and wondering your thoughts on that um you know we've talked about this in the past And it's, you know, these are great franchises, but not growth franchises, you know.
And so they're producing strong earnings and cash flow. And, you know, we're always mindful of capital allocation, as I talked about in my remarks.
So there aren't any sacred cows here. um so uh you know we'll be we'll be looking at this as we go forward as we do routinely dan perfect last one i know it's rhetorical um you know obviously really strong quarter outlook very healthy you know you're trending toward five bucks of cash of cash earnings per share the stocks a little over five times ebitda leverage is going to be close to a turn pretty soon you know doubled strong double digit free cash flow yield other than buying back stock and you know making the case that you are today uh very you know articulately is there anything
else we can do to keep trying to unlock shareholder value and i know that's a fair you know not not a fair question but um just throwing it out there and i appreciate all the color today no it's a it's a good question tough question craig do you want to start and then yeah yeah i think dan you we wake up every day thinking about this how it's very valued for wiley for our colleagues for our shareholders and for all our stakeholders you know we we think importantly about organic growth investments um you know with armahan coming on board with our focus on ai and data analytics we see a lot of potential opportunity to really create new value for customers and for within for wiley overall um you know we continue to think where we have existing core strengths you know the research business is one that continues to show strength and resolve growing at the top end of the market so when we think about investments we've made whether it's advanced brands or geo diversity we continue to think very broadly about organic growth opportunities where we have sustainable competitive advantage in our business um you know beyond that you know portfolio um in capital allocation is a way of life you know it's been part of what wiley's been focused on for several years and as we mentioned during earnings call we had in my comments that we had divested a small business earlier this year it's just evidence that we continue to look very strategically and thoughtfully about our business and where to kind of draw the resource and capital to the most effective places for for the business beyond that i think we are continuing to be very active on um you know thinking about how we return capital to shareholders we have a very healthy payout ratio we have doubled our share buybacks given the opportunity we've had with a strong cash flow and we continue to do that while investing in the business so we're not making any trade-offs here um i think the opportunities continue to be very robust in front of us and we're excited to help bring that forward as we tell more of our story sounds good again appreciate all the color thank you again if you would like to ask a question
Operator
press star then the number one on your telephone keypad at this time there are no further questions i will now turn the call back over to mr kistner for closing remarks yes thanks everyone um i want a thank you for your continued confidence in us.
You see we're building a solid foundation for the future while delivering strong current results, which was our commitment we made two and a half years ago. And we're really looking forward to getting together in June in that regard and talking about how we close out the year. See you then. Thank you.
Operator
Ladies and gentlemen, that concludes today's call. Thank you all for joining. You may now disconnect.