Operator
Greetings. Welcome to Amaranth's second quarter 2026 earnings conference call. At this time, all participants are in listen-only mode. The question and answer session will follow the formal presentation. If anyone should require operator assistance during the conference, please press star zero on your telephone keypad. Please note that this conference is being recorded. At this time, I'll turn the conference over to Laura Rossi, Head of Investor Relations and Strategy. Thank you, Laura. You may now begin.
Thank you, Operator. Good morning, everyone, and thank you for joining us to review AMRA and Bancorp's second quarter 2026 results. On today's call are Carlos Ciafiliola, our President and CEO, and Charimar Calderon, our CFO. As we begin, please note that discussions on today's call contain forward-looking statements within the meaning of the Securities Exchange Act. In addition, we will also refer to non-GAAP financial measures. Please refer to the company's earnings release for a statement regarding forward-looking statements as well as for information and reconciliation of non-GAAP financial measures to GAAP measures. I will now turn it over to our CEO, Carlos Gafiliola.
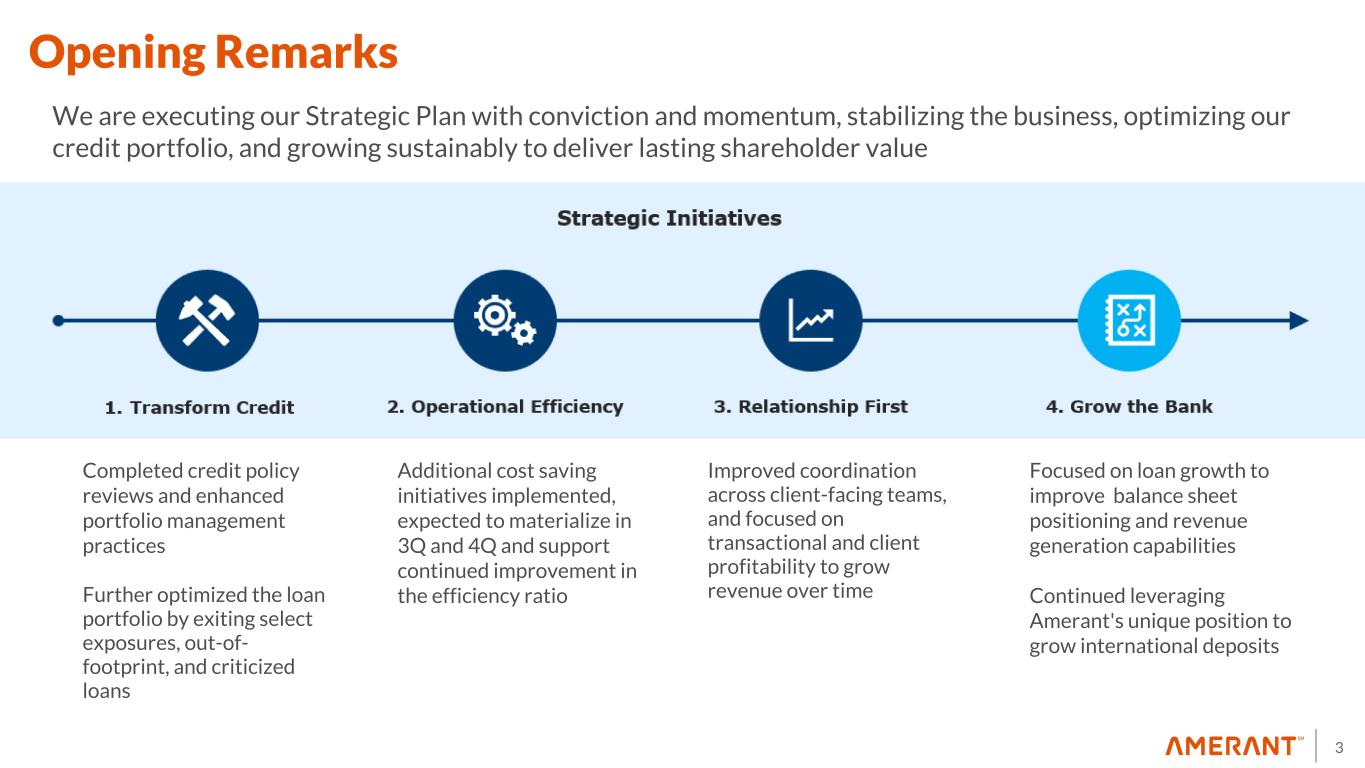
Carlos Gafiliola Thank you, Laura, and good morning, everyone. Thank you for joining us today to discuss Ameren's second quarter 2026 results. Before turning to our results, I would like to acknowledge the devastating impact of the the earthquakes that struck Venezuela this past month. Our thoughts and heartfelt condolences are with the families and communities impacted as they begin the difficult work of recovery and rebuilding. With that important context, let me turn to our second quarter results and more importantly, the progress we are making against the strategic priorities that are reshaping Ameren's progression. Our objective is clear, stabilize the business, strengthen the foundation, and positioning the company for discipline, sustainable growth, and improved shareholder value. I want to spend a few minutes providing additional clarity on the four strategic initiatives that are driving this work, the intention behind each, and the tangible progress we have made during the second quarter. First, transforming credit. As I shared in previous calls, this is our highest priority initiative, giving its connection to current and prospective asset quality, capital efficiency, and predictability of future earnings. Our objective here is to continue developing our credit capabilities to support profitable and sustainable growth through stronger risk selection practices. During the second quarter, we revised our credit policy and procedures, including approval authorities and key product programs, and completed the loan origination stage revamp. We also continue to optimize our portfolio by exiting select exposures, out-of-footprint loans, and criticized credits, which contributed to the decline in special mention and classified loans we reported during this quarter. Second, operational efficiency. This initiative is about simplifying how we operate. We are standardizing, streamlining, and digitizing end-to-end processes to remove structural costs, increase capacity, and deliver faster, more reliable client services at scale. To this end, we are happy to report that we have identified multiple use cases for AI that will enhance our productivity in the near future. During the second quarter, we identified additional cost savings initiatives that are expected to materialize in the fourth quarter and support continued improvement in the efficiency ratio. This gives us greater confidence in our path towards a more scalable operating model and reflects our commitment to structurally decreasing our expenses versus previous years. Third, Relationship First. This strategic initiative is designed to deepen existing client relationships through an integrated sales model that coordinates private and commercial banking with our advisory and treasury management capabilities to increase cross-sell, boost fee income, and improve overall client profitability. During the quarter, we advanced this work by strengthening CRM tracking and referral discipline, building, improving coordination across client-facing teams, and focusing execution on opportunities to grow revenue. Fourth, Grow the Bank. This initiative is about growing balance and revenues with sustainability within our core markets, at a pace consistent with our risk appetite and return objectives. In 2Q, we continue to prioritize long growth in Florida, our core market, and a more granular CNI production, as well as select residential mortgage growth. On the deposit side, momentum remains strong, with total deposits increasing over 400 million, primarily driven by international deposit growth. Having a source of low-cost funding becomes a great attribute within our competitive environment. This performance reflects the strength of our international franchise, the depth of our long-standing client relationships, and the clear advantage of our differentiated business model. We continue to see significant progress in our Latin American business, especially in where Ameren capitalized on its brand recognition, established client relationships, and the work we have done over many years to preserve relationships with local financial institutions, commercial and private banking clients. During the second quarter, that opportunity continued to materialize, with Venezuelan deposits increasing close to $500 million from the first quarter and contributing significantly to the total international deposit growth. These are operating deposits tied to essential industries, processed through established banking channels and supported by our existing compliance due diligence and relationship management framework. Our focus remains on relationship deposits that are low cost, operational in nature, and aligned with our risk appetite. As these balances grow, we will continue to manage concentration, compliance, and pricing discipline carefully while cross-selling our advisory and wealth management platforms. Taking together, these initiatives are beginning to show up in our results. During the quarter, net income increased, profitability improved, and we maintained strong capital levels while continuing to return capital to shareholders. We also made further progress on our credit with classified loans and special mentions declining meaningfully. These outcomes reinforce our confidence that our strategic initiatives are effective and that we are building a more efficient, relationship-driven, and profitable franchise. With that strategic context, I will turn it over to Shari to walk through the quarter's financial results in more detail.
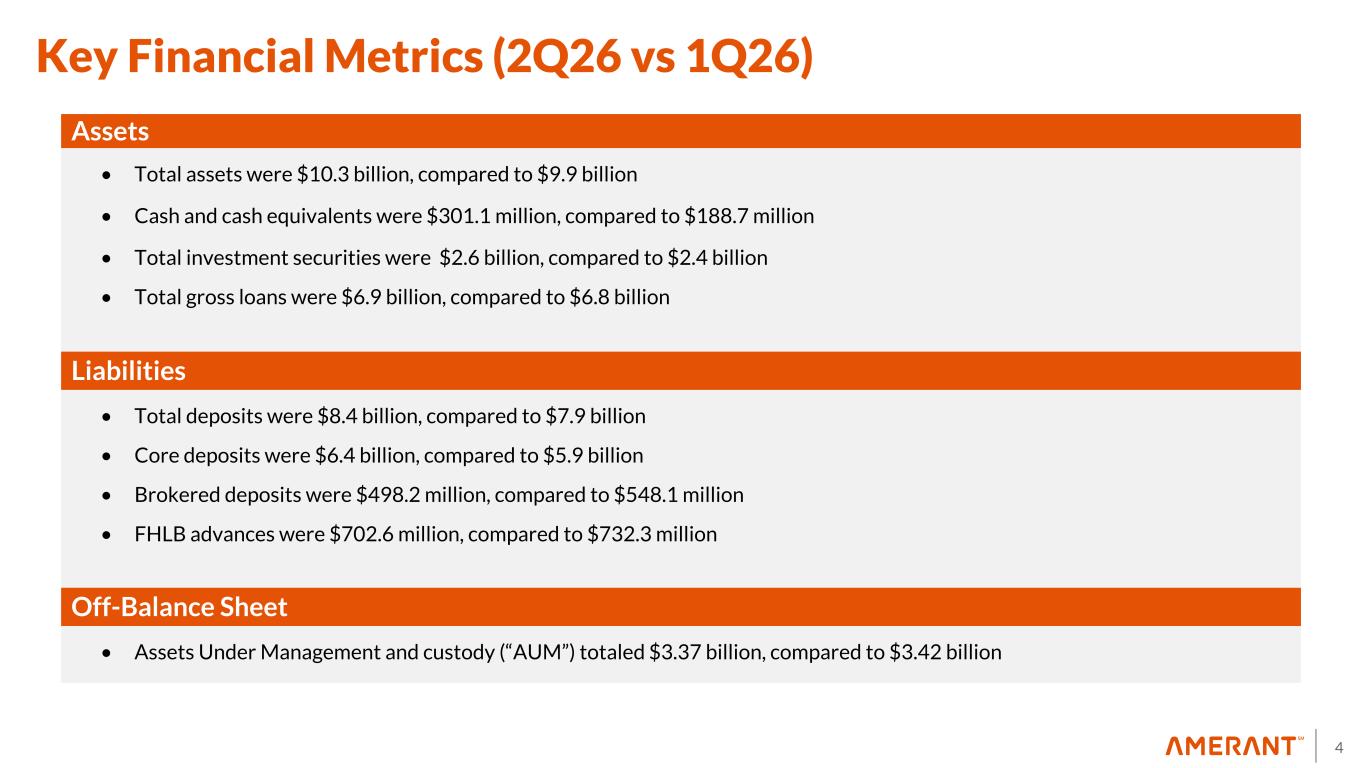
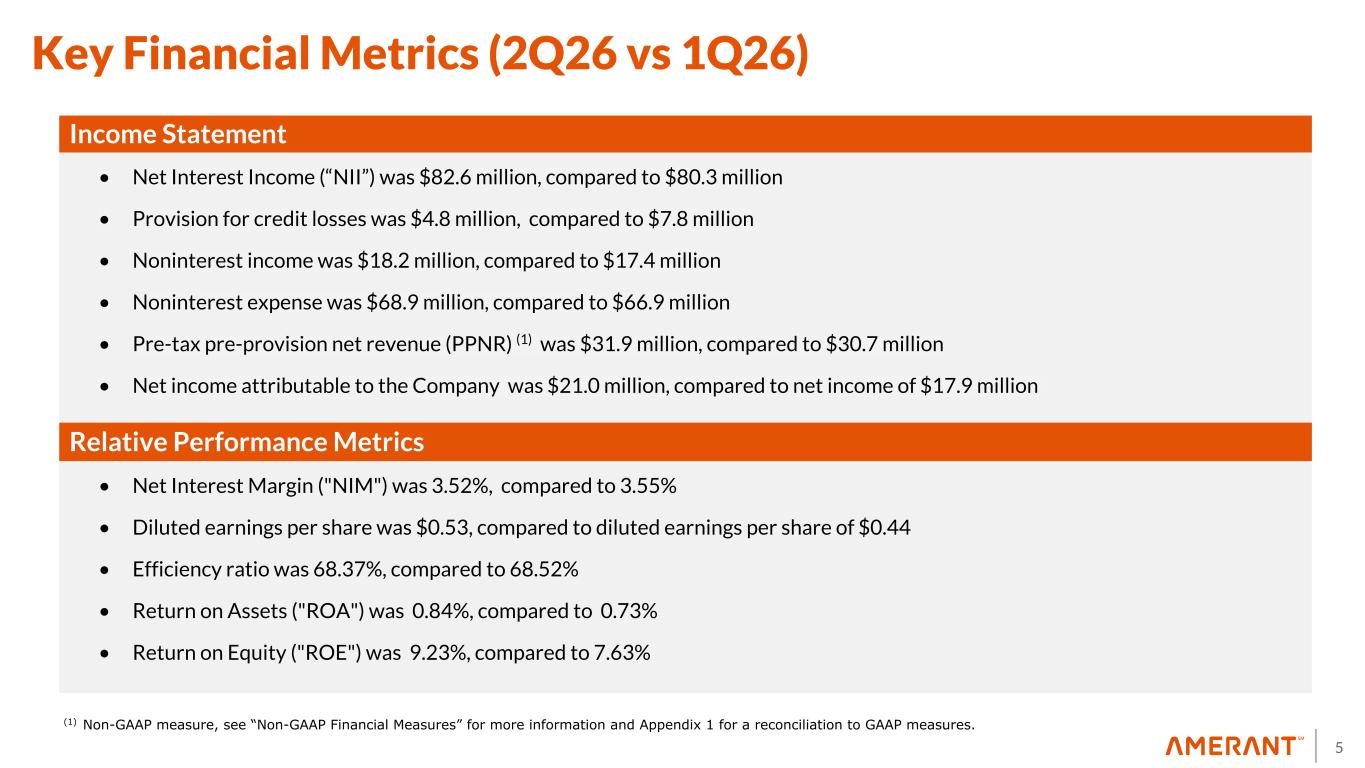
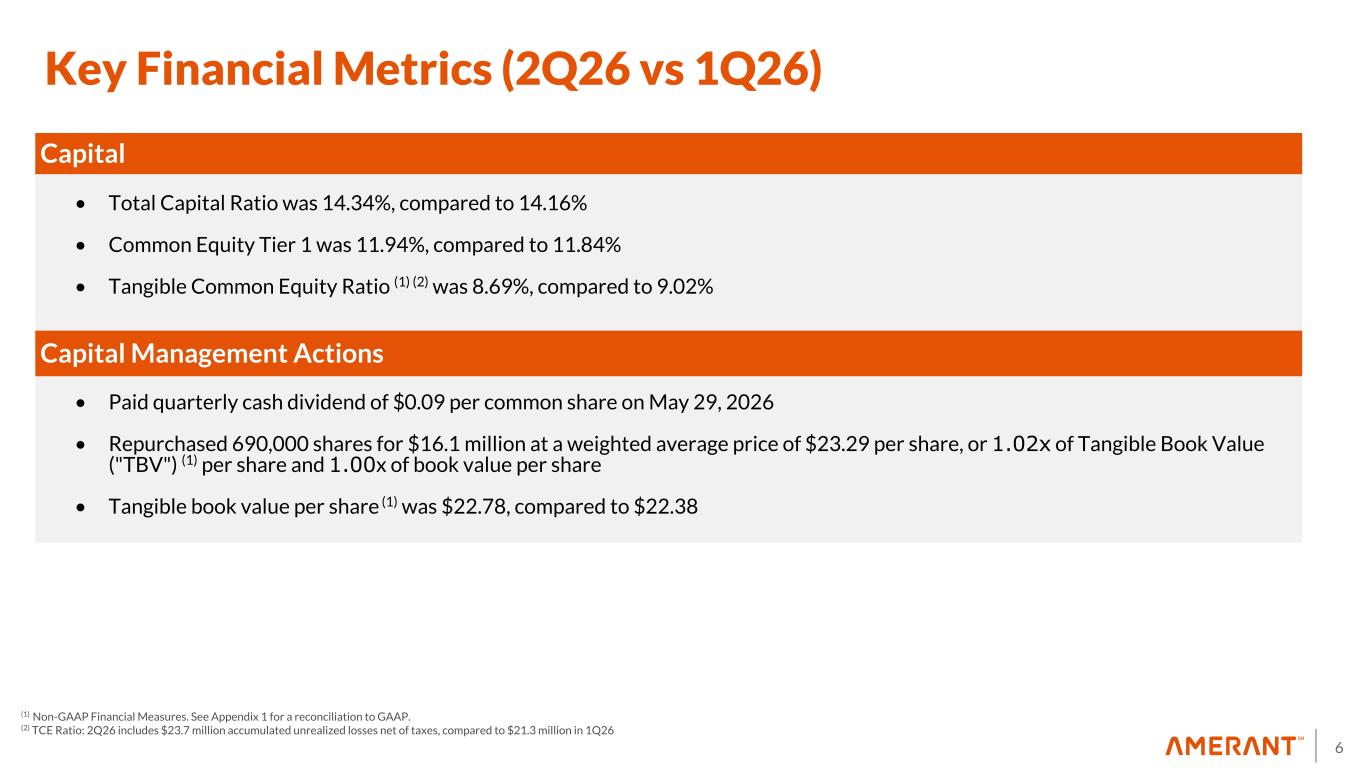
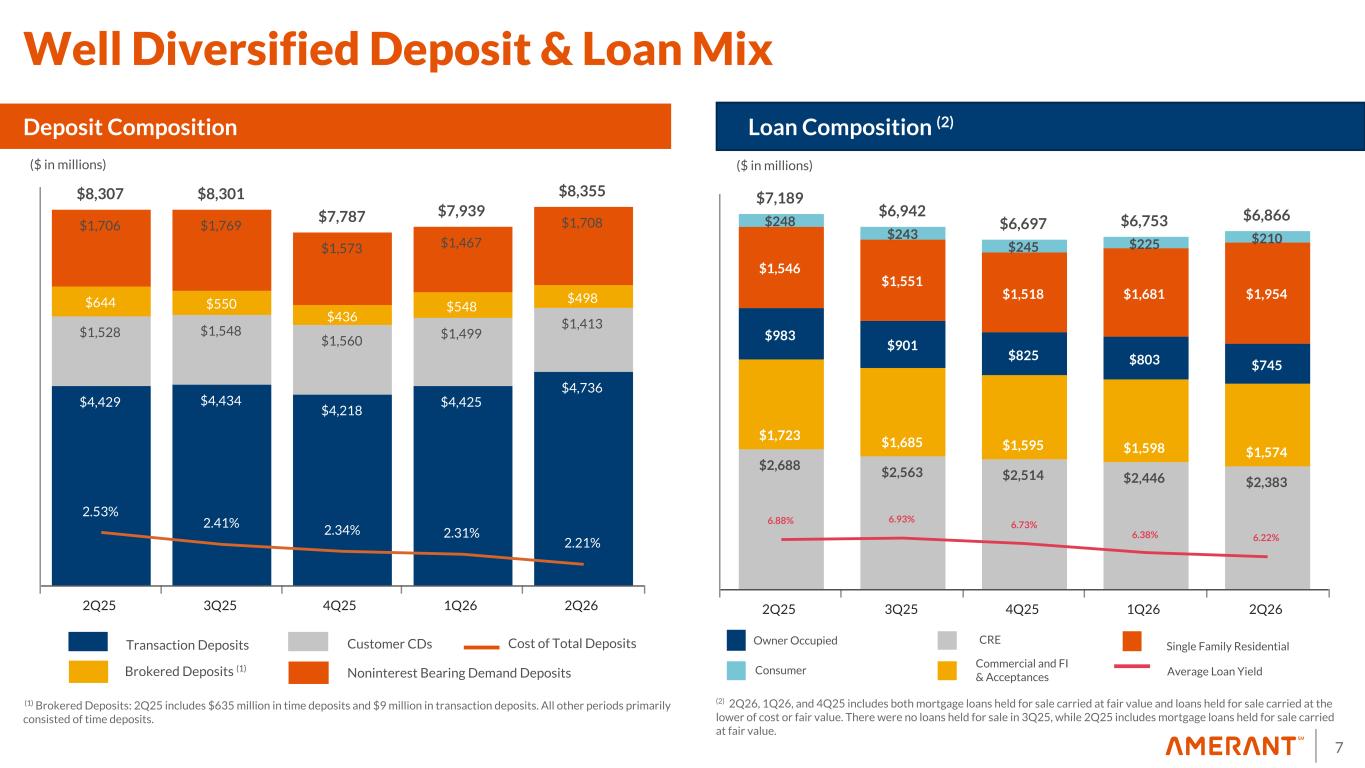
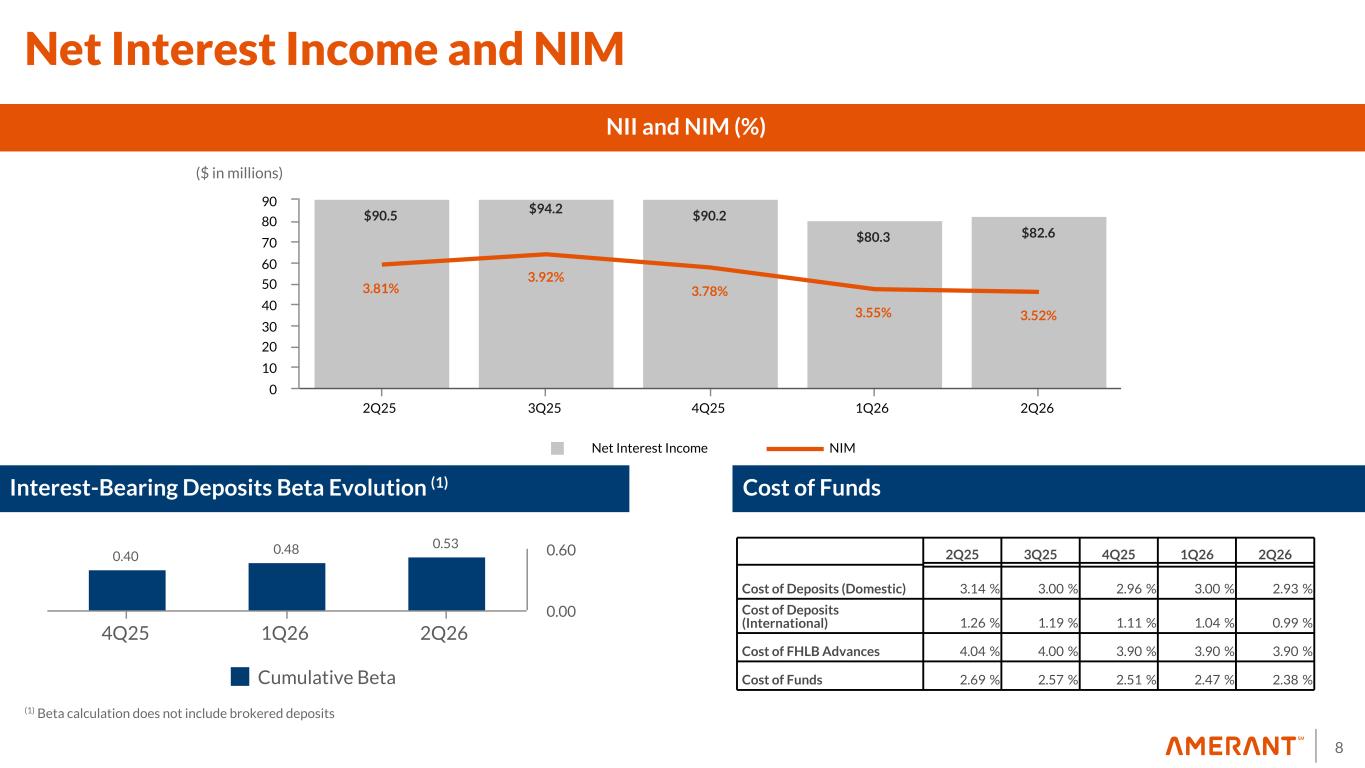
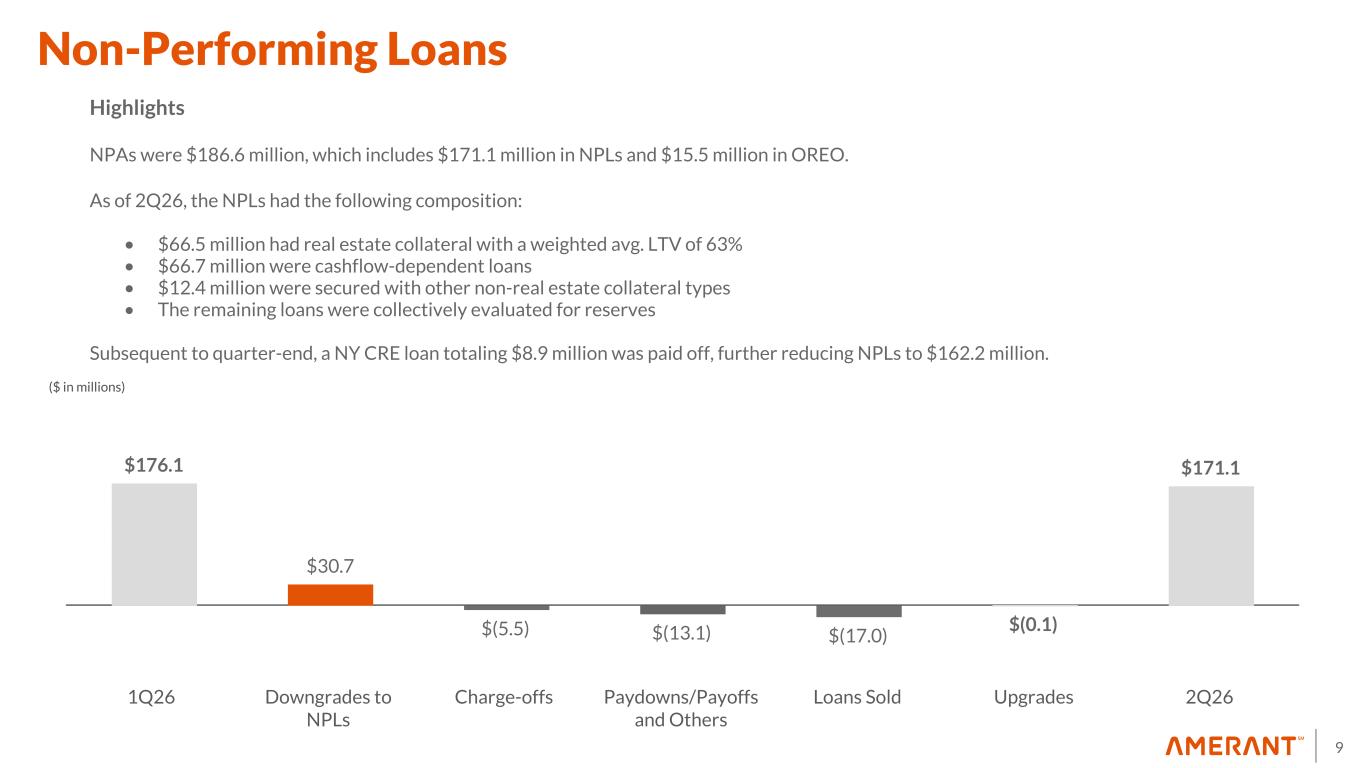
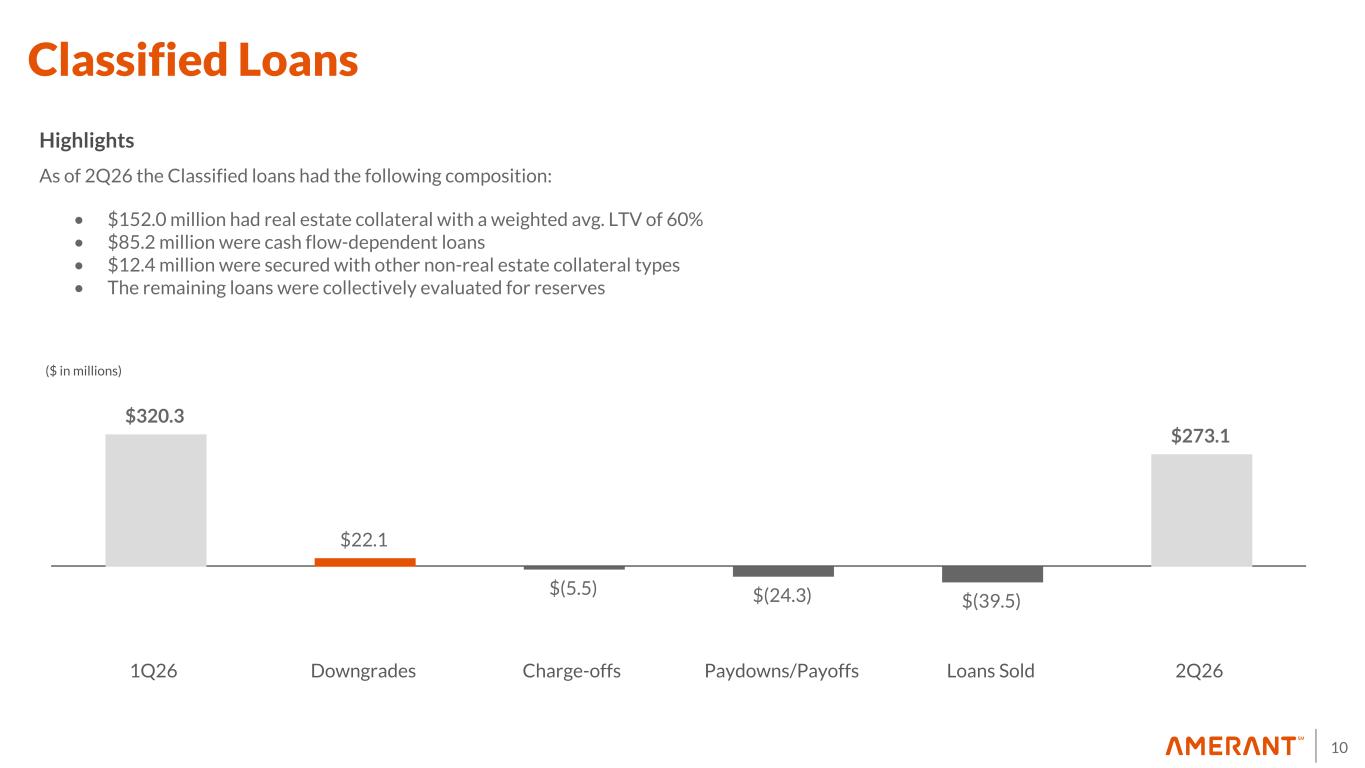
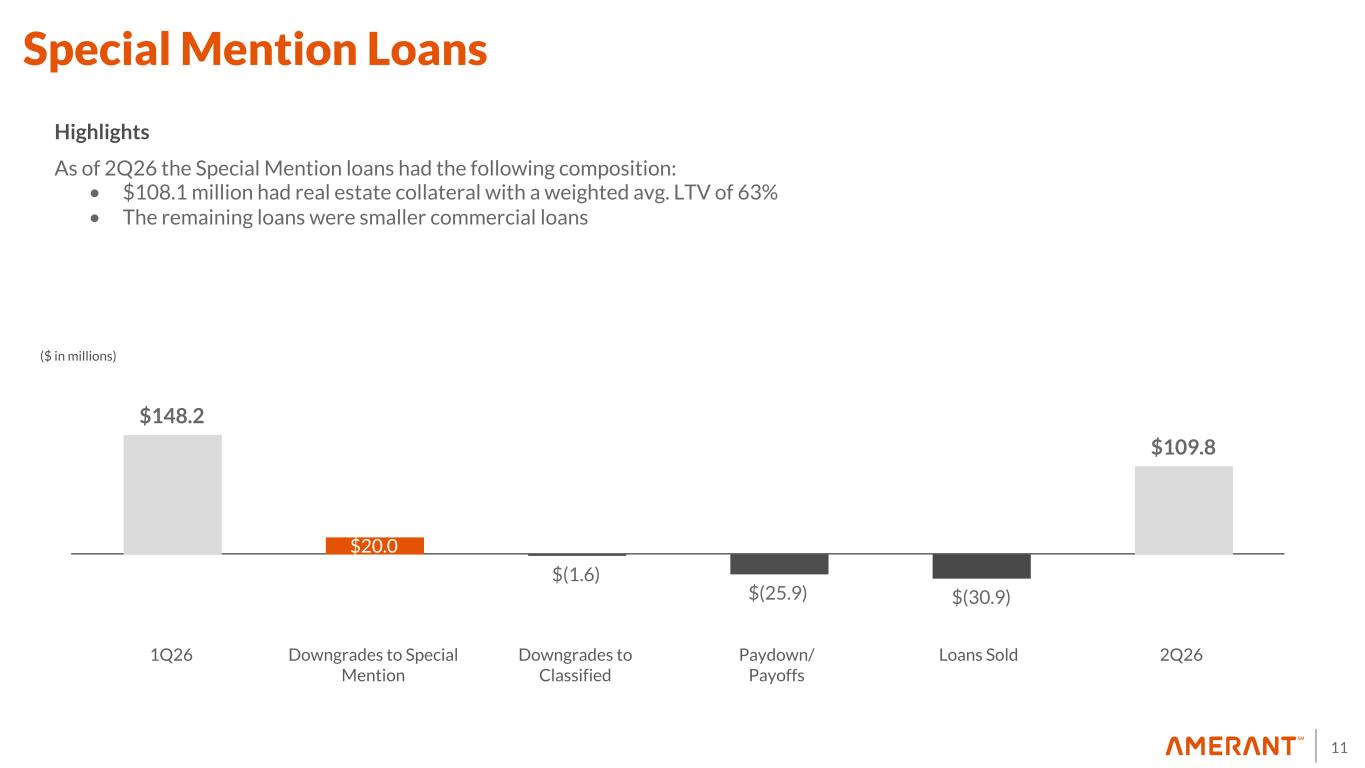
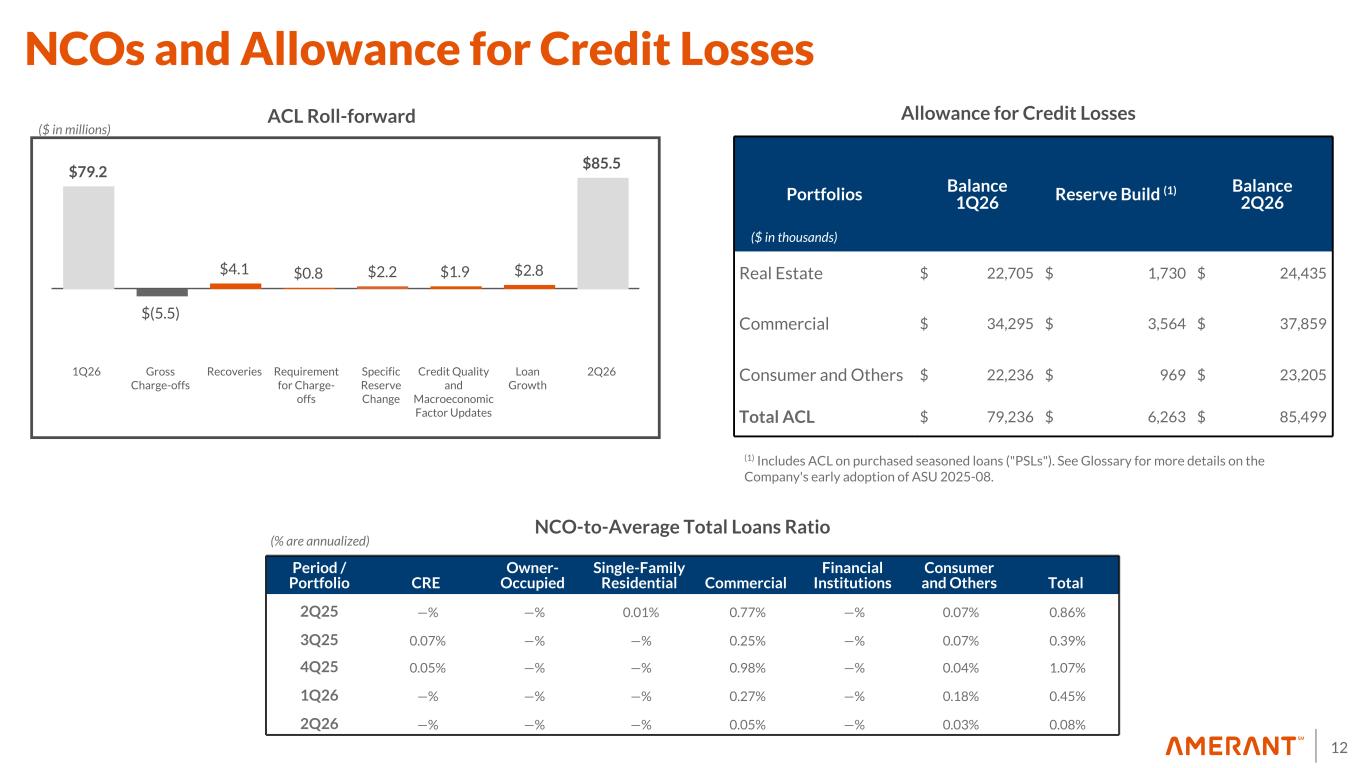
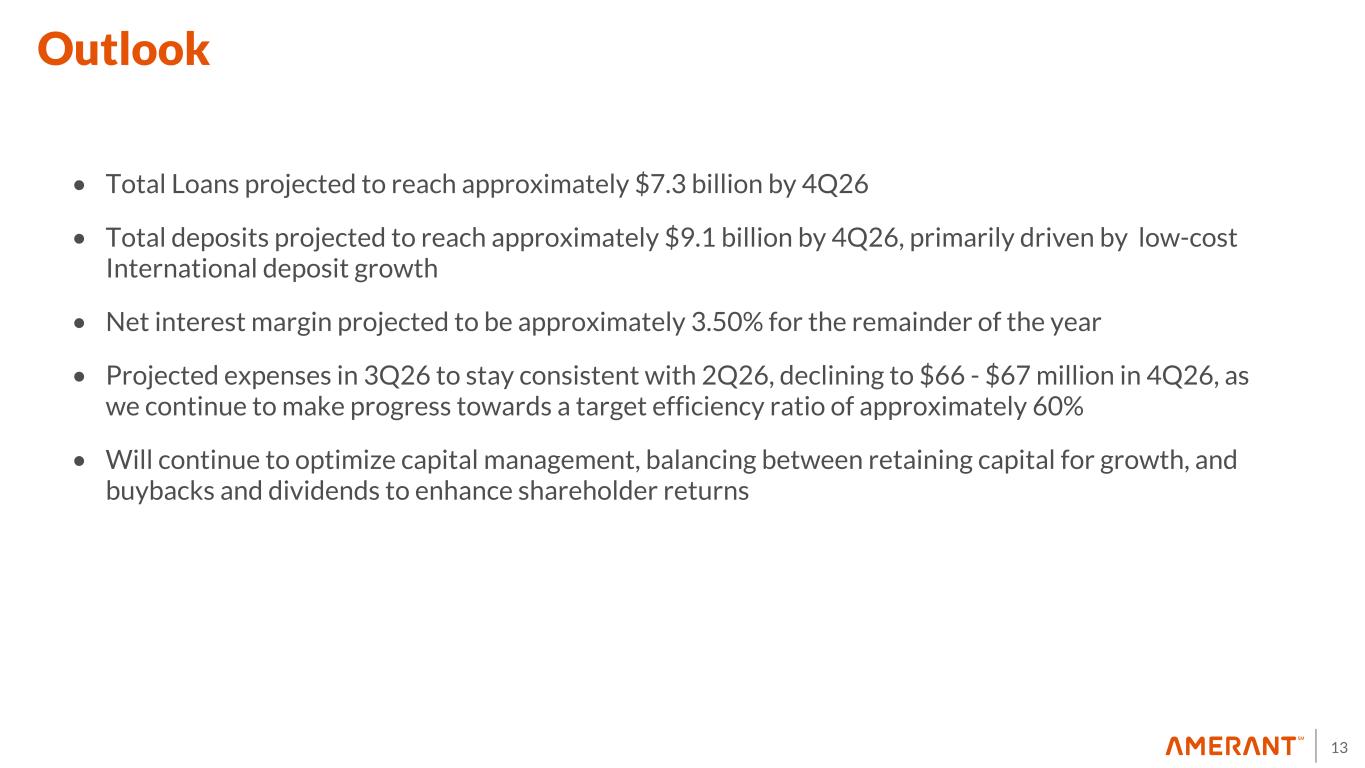
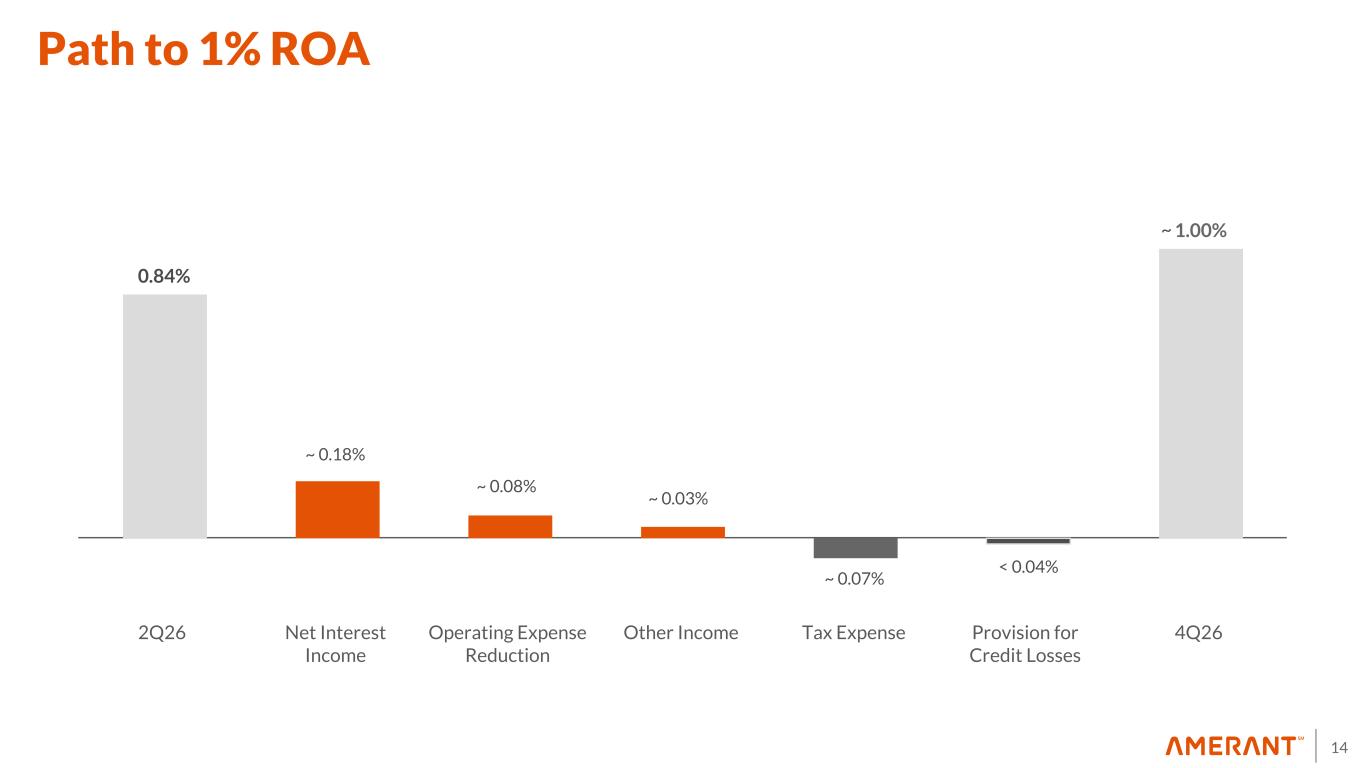
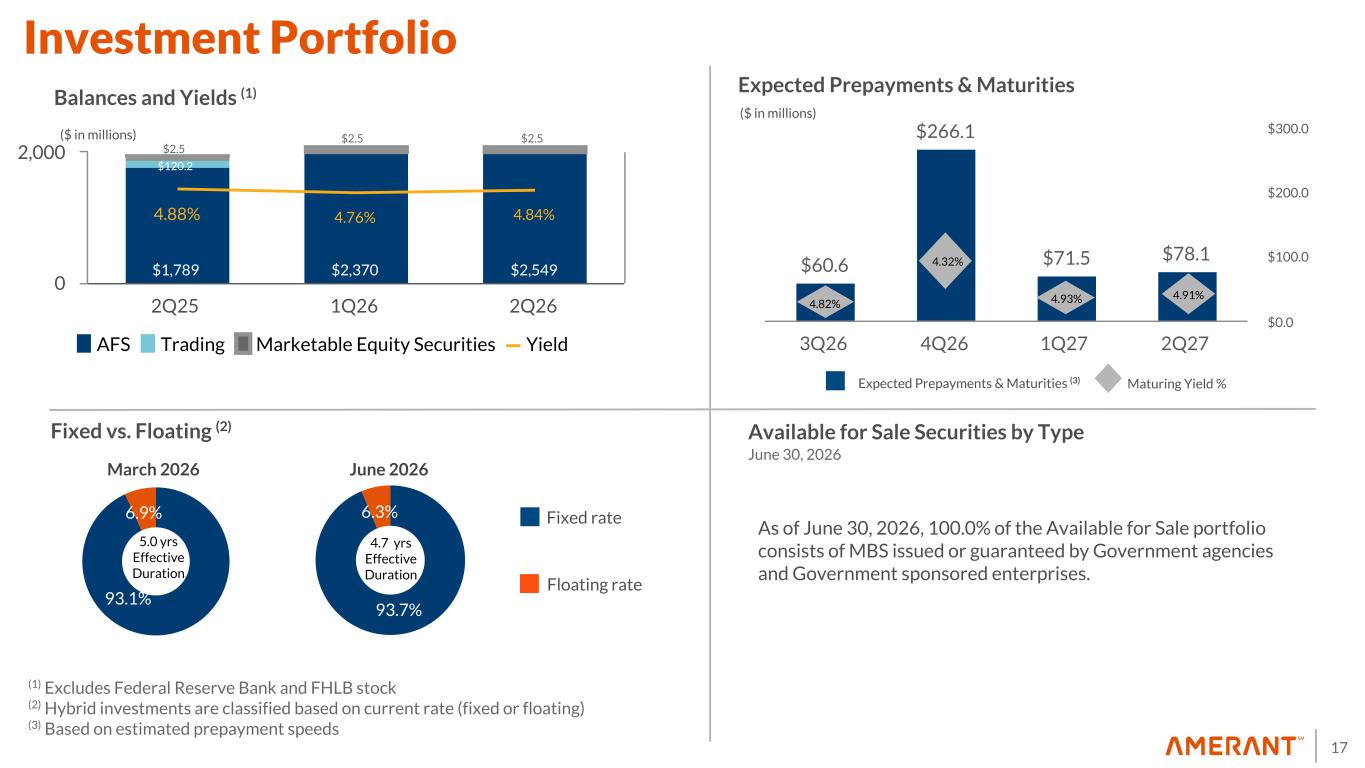
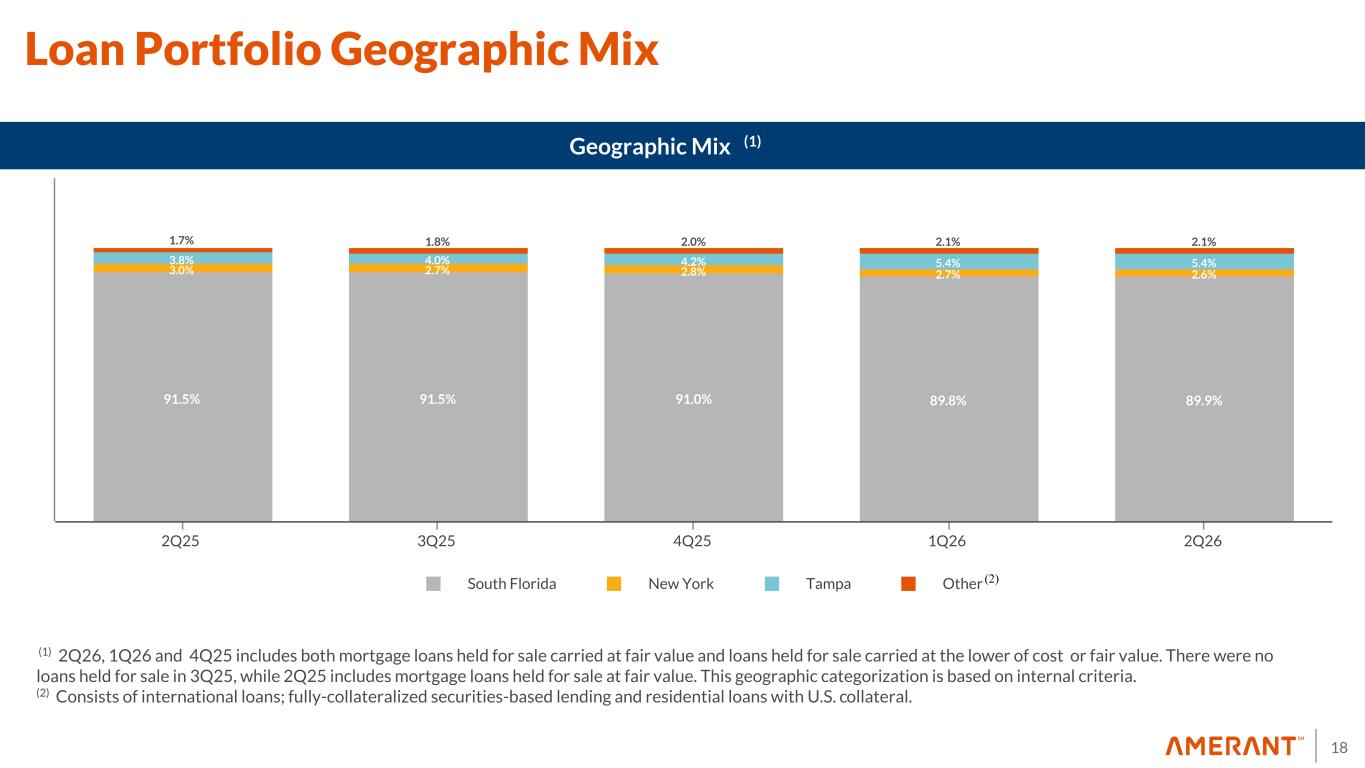
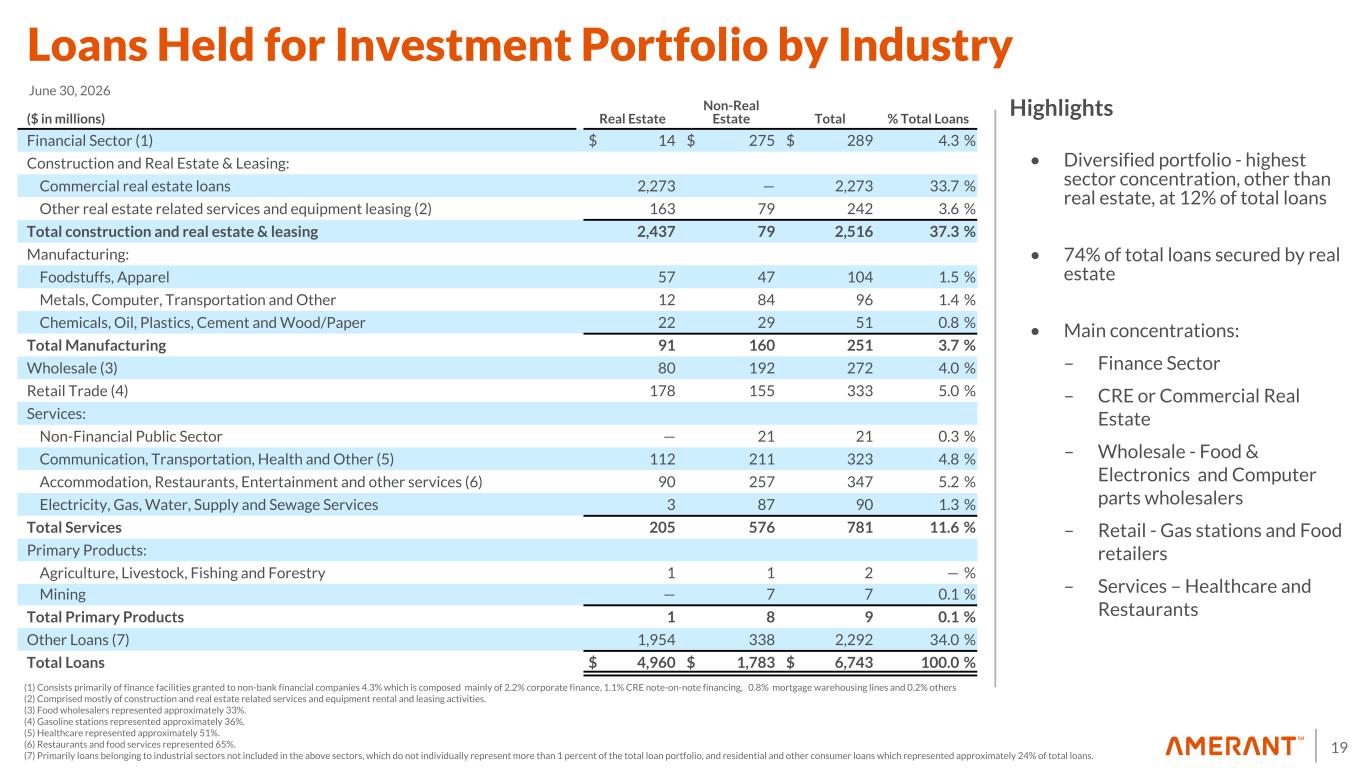
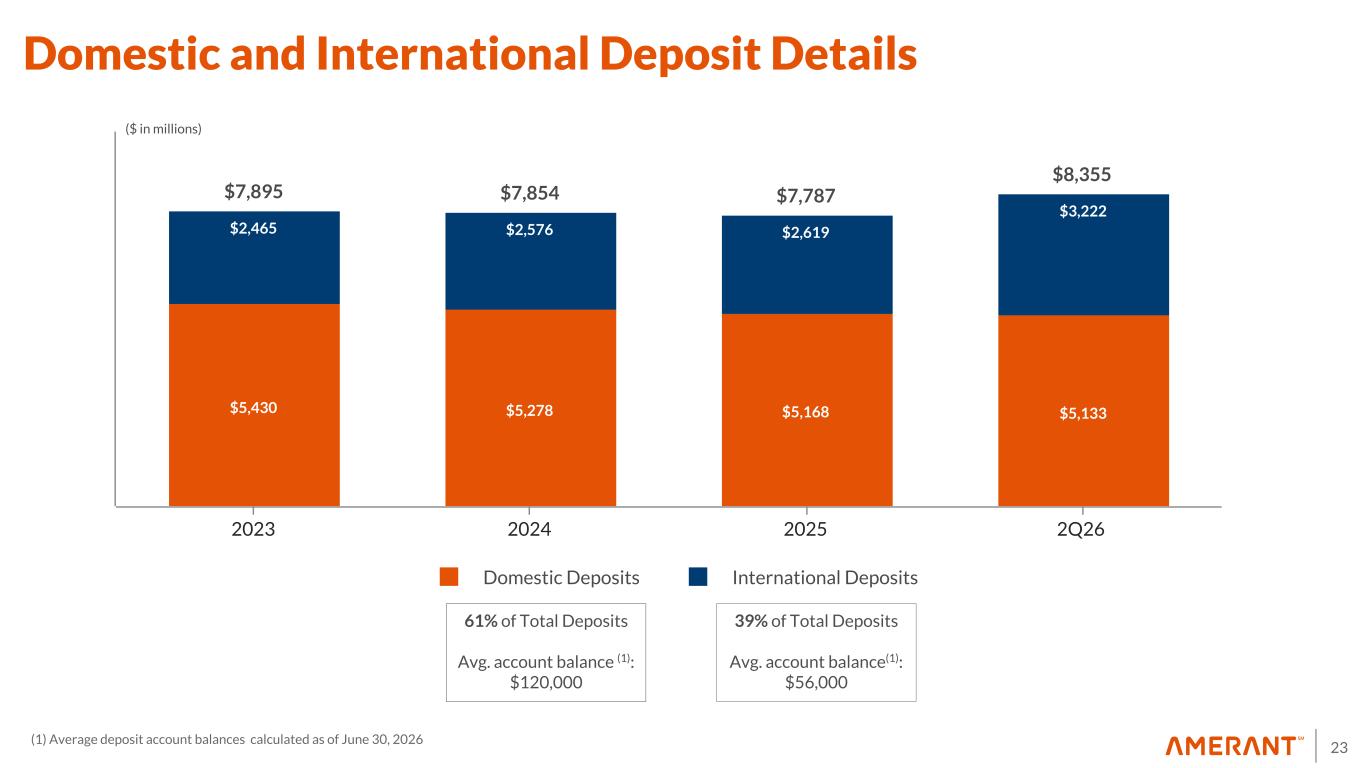
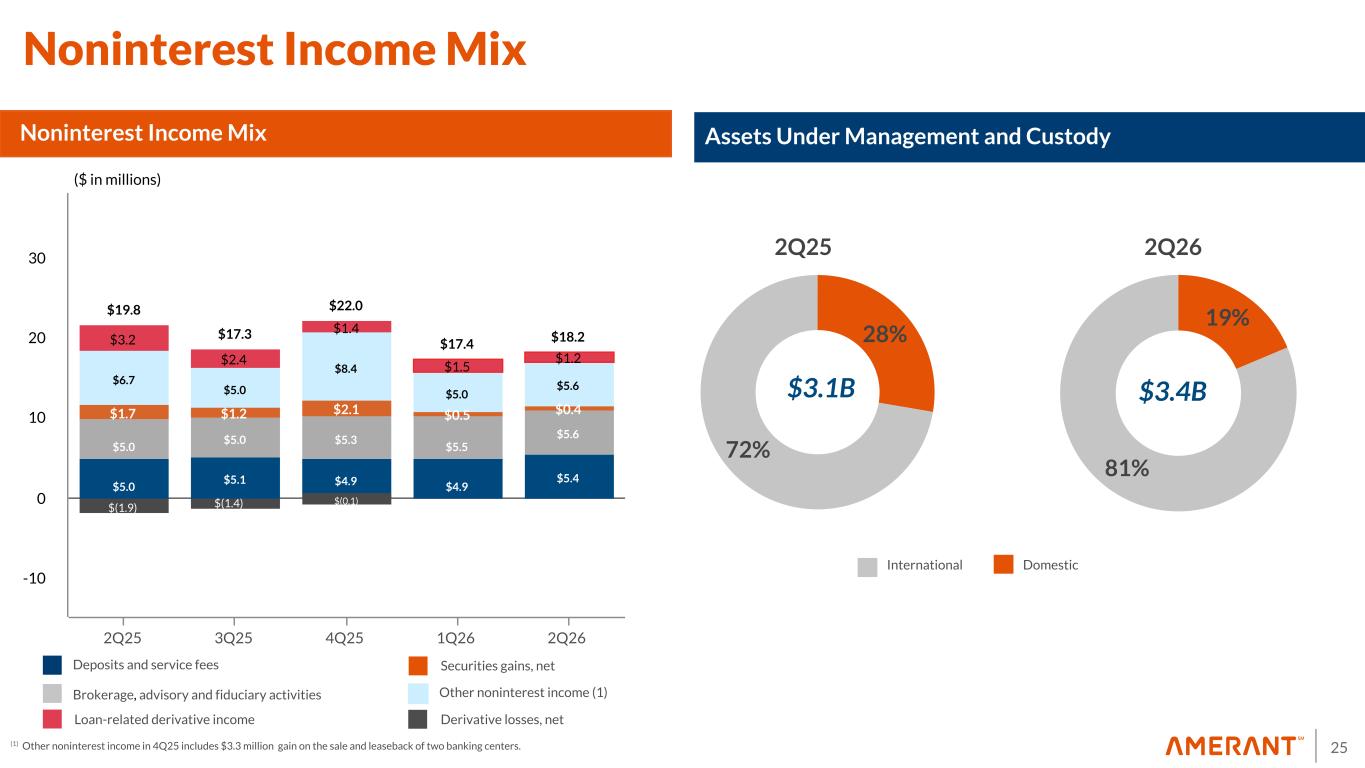
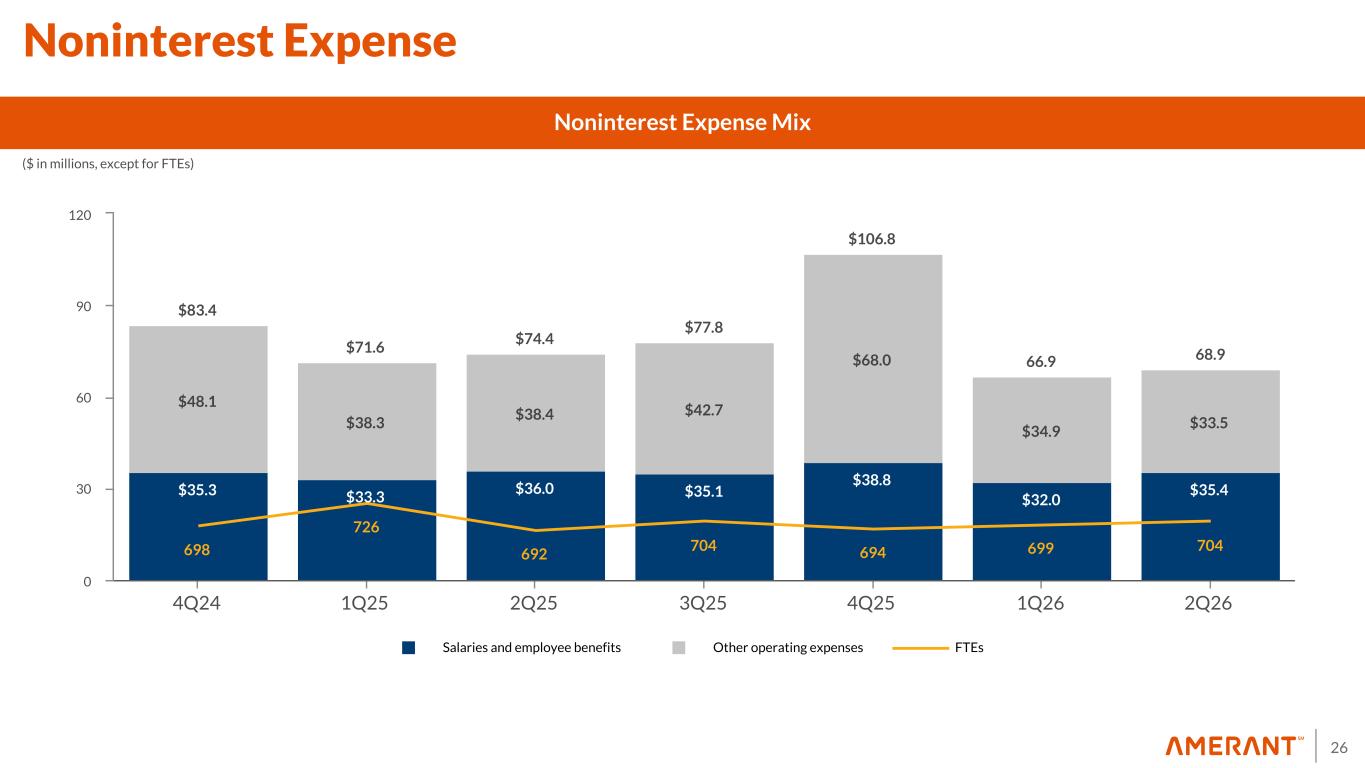
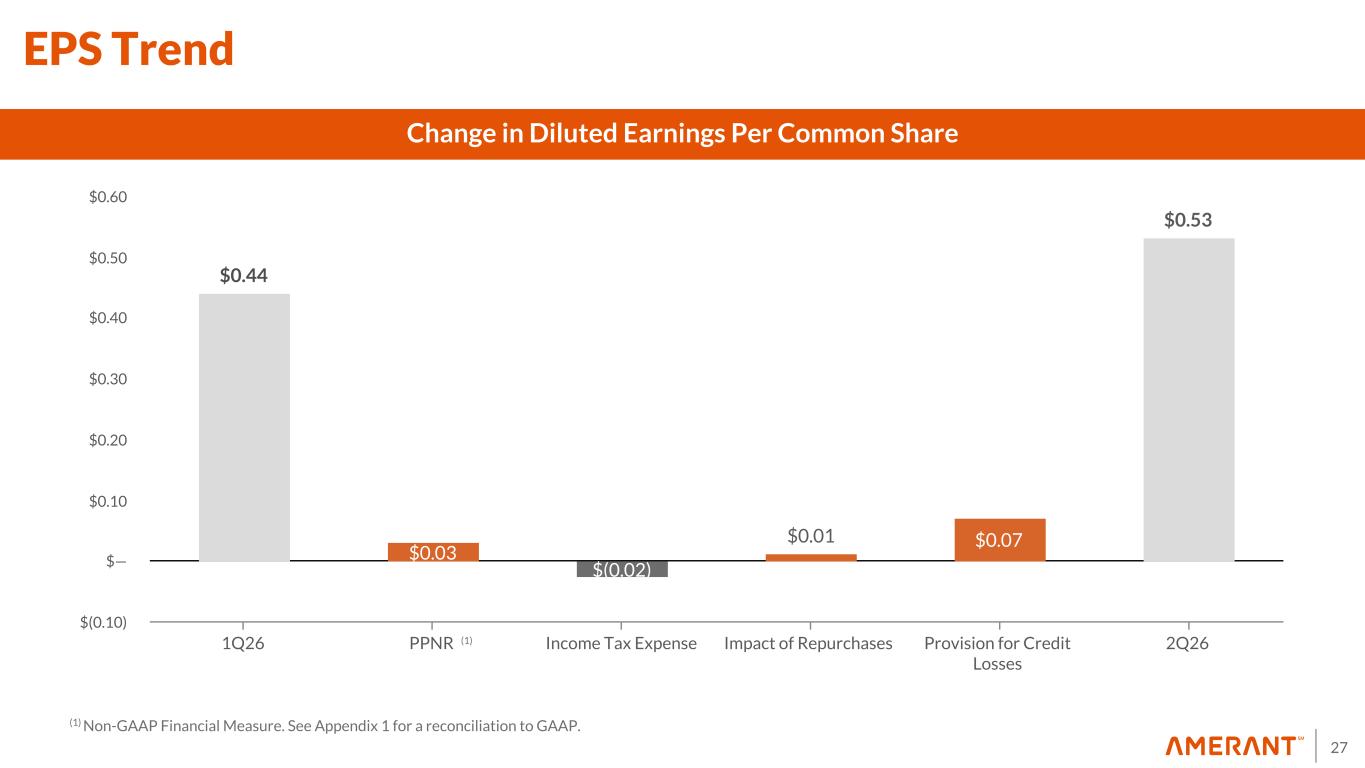
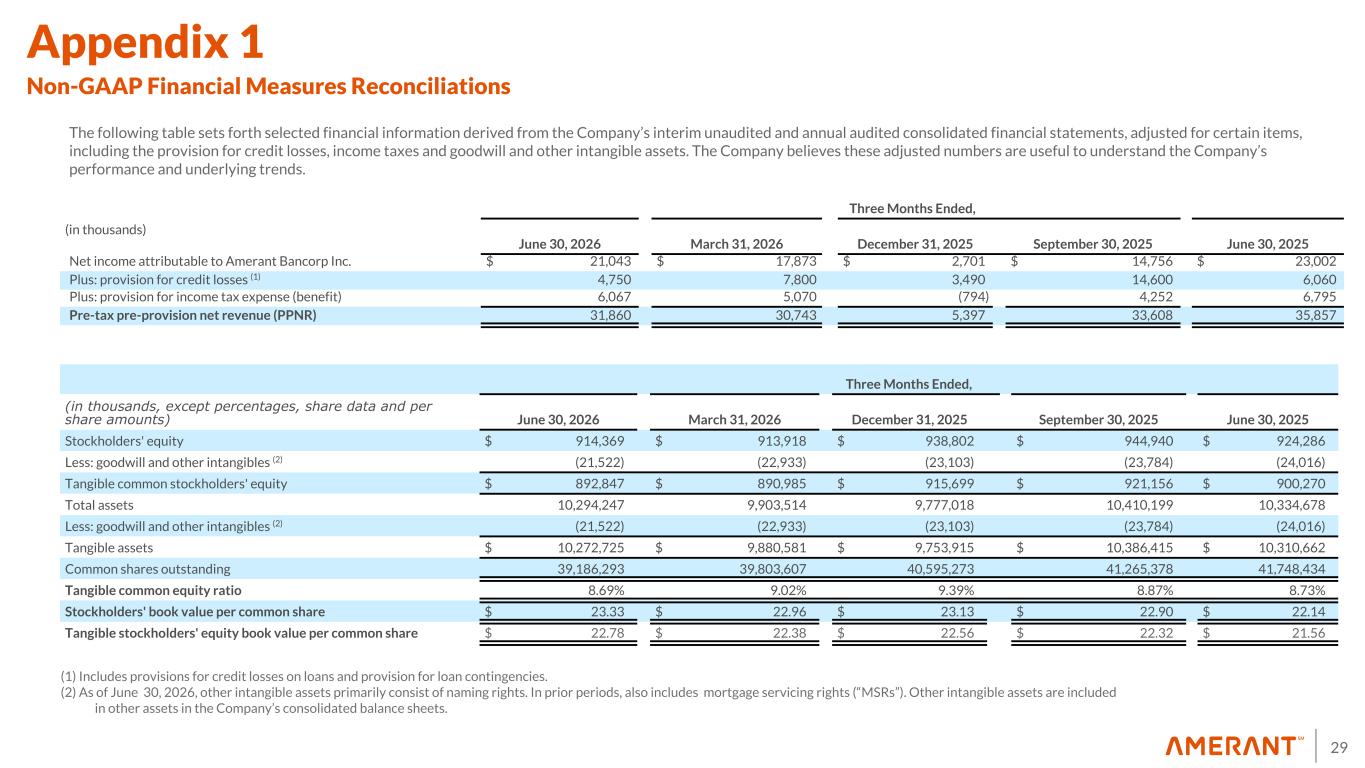
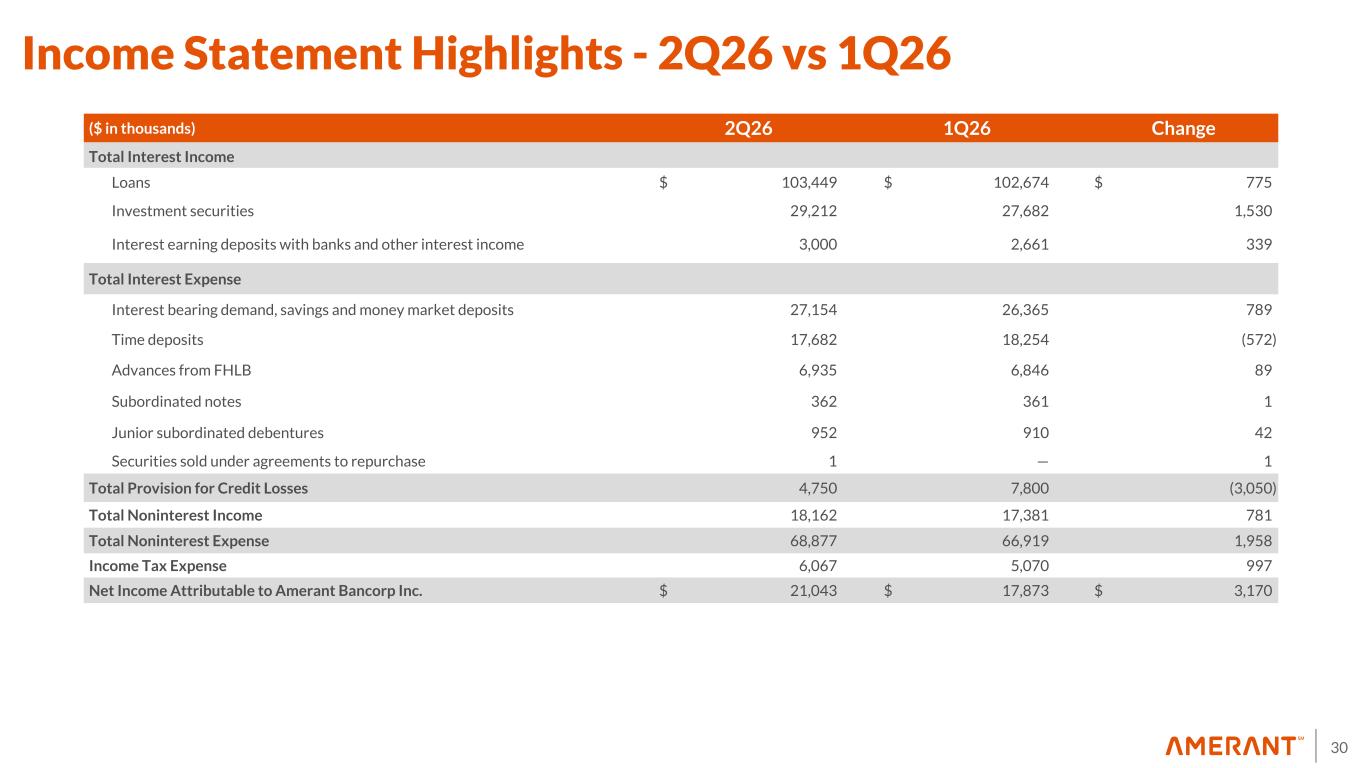
Thank you, Carlos, and good morning, everyone. Let's turn to slide four, where you will see your balance sheet highlights. Total assets were $10.3 billion as of the end of the second quarter, an increase from $9.9 billion as of the end of the first quarter. The increase was primarily driven by higher deposit balances. We reallocated our assets to fund net loan growth and debt securities available for sale. Cash and cash equivalents were $301 million, up by $112 million, compared to $189 million in the first quarter, reflecting higher interest earning deposit balances and overall balance sheet liquidity. Total investment securities were $2.6 billion, up by $178 million, compared to $2.4 billion in the previous quarter. We continue to grow the investment portfolio as part of our liquidity management, due to the growth of our international deposits. Total gross loans were $6.9 billion, up by $112 million, compared to $6.8 billion in the first quarter. Growth was driven primarily by production in C&I as well as residential mortgages, partially offset by elevated commercial loan prepayments, strategic loan sales, and continued exits aligned with our credit optimization strategy. On the deposit side, total deposits were $8.4 billion up by $416 million compared to $7.9 billion in the first quarter, primarily driven by strong growth in international deposits as Carlos mentioned. Our assets under management decreased $53 million to $3.4 billion in the second quarter. This decrease was primarily driven by the departure of a large trust relationship partially offset by increased market valuation. Importantly, this relationship did not represent a significant contribution to fee income as it was fixed rather than balance-based. We continue to view the wealth management business as an important opportunity to grow fee income over time, supported by our relationship-first model and the opportunity to deepen advisory relationships across both domestic and international clients. Let's turn to slide 5. Looking at the income statement, diluted earnings per share for the second quarter was 53 cents compared to 44 cents in the first quarter. Net interest income was 82.6 million, up 2.3 million from 80.3 million in the first quarter. The increase was primarily driven by higher average interest earning asset balances, including growth in the loan and investment securities portfolios partially offset by lower loan yields. Net interest margin was 3.52%, compared to 3.55% in the first quarter. The modest decline reflected lower loan yields, largely offset by a lower cost of funds and continued growth in lower cost international deposits. Provision for credit losses was 4.8 million, compared to 7.8 million in the first quarter, reflecting lower provision needs for specific reserves and higher recoveries, offset by need for loan portfolio growth and adjustments to account for macroeconomic conditions. Non-insured income was $18.2 million, up by approximately $800,000 from $17.4 million. Non-insured income this quarter includes an increase of approximately $500,000 in deposit and service fees and $200,000 in brokerage, advisory, and fiduciary fees. Additionally, this quarter, other non-insured income includes proceeds from life insurance benefits. Non-interest expense was $68.9 million, up by $2 million or 2.9% from $66.9 million in the first quarter. Non-interest expense this quarter includes an increase of $2.9 million in variable compensation, an increase of $1.8 million in less savings related to third-party vendor fees this quarter, and an increase of $1.3 million primarily related to the last portion of a sports partnership agreement that was terminated. The increase in non-interest expense was primarily offset by the absence of $1.7 million in investment impairment expense and other expenses that we had in the prior quarter. The absence of the impairment on investment carried at cost that we had in the first quarter as well as lower losses on loatel for sale. Pre-tax pre-provision net revenue was $31.9 million compared to $30.7 million in the first quarter, reflecting higher net interest income and non-interest income, partially offset by the increase in non-interest expense. You can also see that the ROA and ROE this quarter were 0.84% and 9.23% compared to 0.73% and 7.63% respectively in the prior quarter. Our efficiency ratio was 68.37% compared to 68.52% in the first quarter. These improvements were primarily driven by higher net income and continued operating disciplines. Turning now to slide 6 to discuss our capital metrics. Our CET1 remained strong at 11.94% compared to 11.84% last quarter, mainly driven by lower risk-weighted assets and higher net income during the quarter, while partially offset by $16 million in share repurchases and $3.6 million in shareholder dividends. We paid a cash dividend of $0.09 per share of common stock on May 29, 2026, and our Board of Directors just approved a quarterly dividend of $0.09 per share payable on August 28 of this year. During the second quarter, we repurchased 690,000 shares at a weighted average price of $23.29 per share, compared to tangible book value of $22.78 as of June 30, 2026. This represents a one-time tangible book value and book value. On slide 7, we show our well-diversified deposit mix along with the composition of our loan portfolio. Total deposits for the quarter were $8.4 billion, up $416 million, or 5.2%, compared to $7.9 billion in the previous quarter. This increase was primarily driven by significant growth in international deposits, particularly from Venezuela, while domestic deposits reflect the exit of a high-cost, large fund provider. In terms of deposit mix, broker deposits totaled $498 million, a decrease of $50 million, compared to $548 million in the first quarter. Core deposits increased by $553 million, or 9.4%, supported by strong growth in non-interest-bearing and lower-cost international deposits. Total Financial loans were $6.9 billion, up $112 million, or 1.7%, compared to $6.8 billion in the first quarter. The increase was driven by production in C&I as well as residential mortgages, partially offset by higher commercial prepayments and loan sales completed during the period. Of note, we use our international funding to support domestic loan growth, as we don't currently take credit risk outside of the U.S. Next, on slide 8, you can see the evolution of our net interest income. NII increased $2.3 million from the prior quarter to $82.6 million into Q. This increase was primarily driven by higher average interest earning asset balances as we redeployed our deposit growth as well as one additional day in the quarter. The increase was partially offset primarily by lower loan yields and higher average balances in interest-bearing deposit accounts. Net interest margin was 3.52% compared to 3.55% in the first quarter. Lower loan yields were largely offset by a lower cost of deposits, supported by disciplined deposit pricing and continued growth in lower cost international deposits, with a current cost right under 1%. As a result, cost of total deposits declined to 2.21% from 2.31% in the prior quarter and cost of funds declined to 2.38% from 2.47%. Now turning to asset quality as shown on slide 9, non-performing loans were down $5 million or 2.8% to $171 million or 1.7% of total assets. During 2Q26, downgrades to NPL were primarily driven by one large classified residential loan which was later sold during the quarter, two large commercial relationships and smaller commercial and residential loans. These downgrades were offset by payoffs and note sales as noted in the slide. Subsequent to quarter end, a $9 million New York CRE loan was paid off, bringing NPLs further down to $162 million, improving the NPL to total assets ratio. In the next slide, we have included similar information as it relates to the classified portfolio. During 2Q26, downgrades to classified loans were primarily driven by four relationships with commercial and owner-occupied loans. On this slide, you can also see the results of our efforts to reduce the loan balances in this bucket during the quarter, with loan payoffs totaling $24 million and loans sold totaling approximately $40 million during the period. Now moving into slide 11, we discussed special mention loans and their key characteristics including portfolio composition and collateral coverage. During 2Q26, downgrades to special mention were primarily driven by one CRE loan and one owner-occupied relationship, offset by the payoff of one large CRE loan and the sale of another CRE loan. Overall, second quarter results demonstrate continued progress in our credit optimization efforts. Non-performing loans, classified loans, and special mention loans all declined during the quarter, supported by discipline monitoring, timely downgrades were warranted, and active resolution through payoffs, paydowns, and loan sales. While we continue to proactively manage any new developments in our portfolio, the reductions this quarter reflect the impact of the actions we have been taking to strengthen the portfolio improve visibility, and reduce risk over time. Now moving on to slide 12. Here we show the drivers of the provision recorded this quarter and impact to the allowance for credit losses. The provision for credit losses was 4.8 million in the second quarter. The provision was driven by a 2.2 million net increase in specific reserve allocation, 0.8 million requirements for charge-offs, 0.9 million due to loan growth, and 1.9 million mainly attributable to changes in macroeconomic factors. This was offset by $1 million released in reserves for contingencies as lines were funded. During the second quarter of 2026, gross charge-offs totaled $5.5 million composed mainly of two commercial loans. The remaining charge-offs were related to indirect consumer loans and smaller commercial and consumer loans. These charge-offs were offset by $4 million in recoveries. We expect gross charge-offs to be in the range of 25 to 30 basis points. This could be offset by recoveries as our special assets team continues efforts toward resolution of previously charged off loans. Lastly, the allowance for credit losses ratio was up slightly to 1.27 percent from 1.21 percent in the first quarter, primarily due to increases in coverage of collectively evaluated loans. On slide 13, 2019, you can see our expectations for the remainder of 2026. We expect total loans to reach approximately $7.3 billion by the fourth quarter of 2026. Following the work completed in the first half of the year to strengthen our credit foundation, we are seeing increased momentum in the loan pipeline, including opportunities via credit programs in CNI and residential lending as we focus on building a more granular, higher quality portfolio. On the funding side, we expect total deposits to reach approximately $9.1 billion by the fourth quarter of 2026. This outlook is supported by continued momentum expected in low-cost international deposit growth and our efforts to deepen domestic relationships. We expect net interest margin to be approximately 3.50% for the remainder of the year, supported by disciplined balance sheet management and the benefit of continued growth in lower cost deposits. From an expense perspective, we are projecting 3Q expenses to be in line with 2Q, declining to a range of $66 to $67 million in 4Q26 as we continue to make progress toward a target efficiency ratio of approximately 60%. In terms of capital management, we continue to believe that buying back our stock represents and attractive use of capital, and we expect to continue using a portion of our cash to directly return capital to our shareholders through repurchases and dividends. Lastly, we would like to provide guidance as to the contributions to ROA and help you reconcile how we expect to reach 1% by year end. As you can see on slide 14, we expect the net interest income to be the largest contributor in line with the guidance I just provided regarding loan and low cost deposit Operating expenses and other income will also contribute to net income improvement, although to a lesser extent. We expect this contribution to be partially offset by tax expense and provision for credit losses due to reserves related to loan growth. And with that, I will pass it back to Carlos for additional comments and closing remarks.
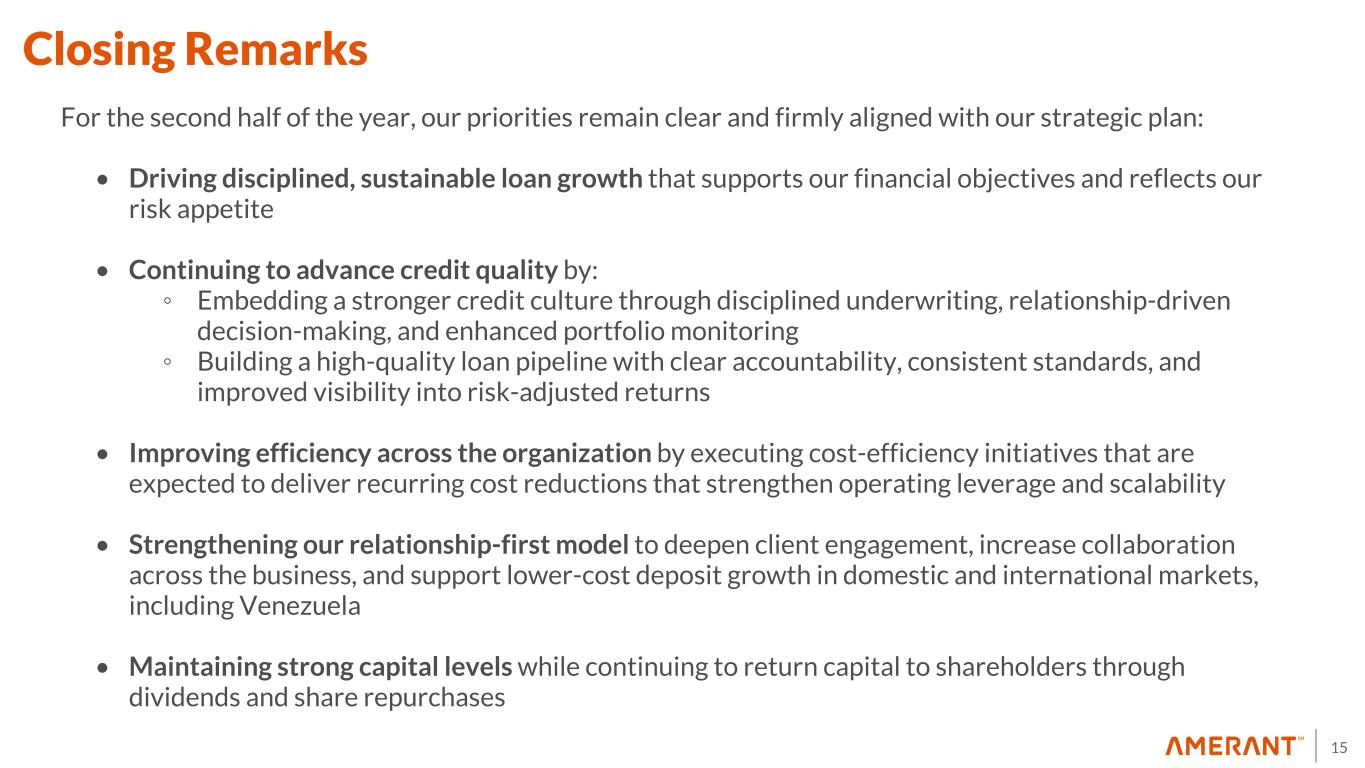
Thank you, Charlie. As we wrap up today's call, I want to reiterate that our priorities for the second half of the year remain clear and firmly aligned with our strategic plan. First, we will continue driving disciplined, sustainable, long road that supports our financial objectives and remain consistent with our risk appetite. That means growing with purpose, maintaining clear accountability, and ensuring that our risk selection practices meet our standards for quality, granularity, and risk-adjusted Second, we will continue advancing credit quality by embedding a stronger credit culture across the organization. This includes discipline underwriting, enhanced portfolio monitoring, and a high-quality loan pipeline. Third, we remain focused on improving efficiency across the organization. We are executing cost-efficiency initiatives that are expected to create sustainable, recurrent savings while supporting a more scalable operating model in alignment with our efficiency goals. We're also reassessing our product offering and fee income services to continue to boost non-interest income. And fourth, we will continue strengthening our Relationship First model to deepen client engagement, increase collaboration across the business, and support lower cost deposit growth in both domestic and international markets. At the same time, we remain committed to maintaining strong capital levels while continuing to return capital to shareholders through dividends and share repurchases. We have a durable franchise, a clear strategic vision, and a disciplined execution plan.
Operator
While there is more work ahead, we are encouraged by our progress and confident in our ability to deliver sustainable value for our shareholders over time with that shari and i will take questions operator please open the line for q a thank you we'll now be conducting a question and answer session if you'd like to ask a question at this time please press star one on your telephone keypad and the confirmation tone indicate your lines in the question queue you may press star two if you like to remove your question from the queue for participants using speaker equipment It may be necessary to pick up your handset before pressing the star keys. One moment, please, for our first question. Thank you. And our first question comes from the line of Woody Litt with KBW. Please proceed with your questions.
I wanted to start on the deposit growth. I mean, it was really encouraging. And I think the guide where you all point to by year end, you know, that's it's about 800 million above where the streets forecasting was just curious how much of that incremental deposit growth will be used for funding remix and what that what that means for the total asset size that you're expecting by year end.
So, no, good question, and thank you for that one. I believe one of the critical points that we have been using that source of funding that we have been getting is precisely to let run off high-cost deposits that we carry in balance sheet. I believe the recomposition has been extremely valuable. We have let go high-percentage cost of funds from the depository base. Most of this new deposit is coming our way, so we are very encouraged by the recomposition that we'll have in the cap.
Yes, and to complement that, Carlos, we do expect to use a significant portion being redeployed into high-quality assets and boarded into our balance sheet, but we're also going to take the opportunity to pay off maturing wholesale funds and also any excess liquidity due to the low cost of these funds, any excess liquidity, even if placed in yielding cash accounts, we still see that we can get a contribution to NIMS.
And everything would be, I guess, redeployed within our new credit policy and credit standards that are...
Yeah, so you're over $10 billion assets as of the second quarter. Do you expect to be over the $10 billion in asset threshold by year-end, 26?
Yeah, yeah, we do expect to, yeah.
And then, so it sounds like on that deposit guide, you know, most of that's expected to be low cost, if not non-interest bearing, which would be a huge positive and would make me think that, you know, you had a 352 name in the second quarter. It feels like there could be upside based on that non-interest bearing growth, But I guess maybe some of the moving pieces on how the margin stays flat from here would be helpful.
Yeah, so one of the items that we telegraphed during the previous earnings calls at this point, as you know, we are operating at the same time. When you get to see our software, the competitors that we get, even though we're getting yield, will definitely make us feel less.
Got it. And then maybe just last for me, you know, non-interest-baring growth was really impressive. The international side drove a majority of that, and, you know, especially Venezuela. Could you just talk about the momentum you're seeing in the country and how it's impacting deposits? And are most of the deposits coming from the country, are they commercial deposits, retail deposits, and are they related to any specific industry?
As you know, the advantage of armor and...
Got it. Well, thanks for taking my questions, and congrats on the strong quarter.
Operator
Thank you. The next question is from the line of Russell Gunther with Stevens. Please receive your questions.
Hey, good morning, guys. Good morning. I wanted to follow up on the loan growth and spread discussion. It would be helpful to get some specifics around just where and how you tighten that credit box. You mentioned the revised credit policy and procedures this quarter. So just any update into changes in loan size targets or asset classes that no longer fit the revised profile. And then you mentioned, I think, you were getting plus 200 BIFs to SOFR. Kind of where does that stand today on the type of commercial growth that now fits your credit box?
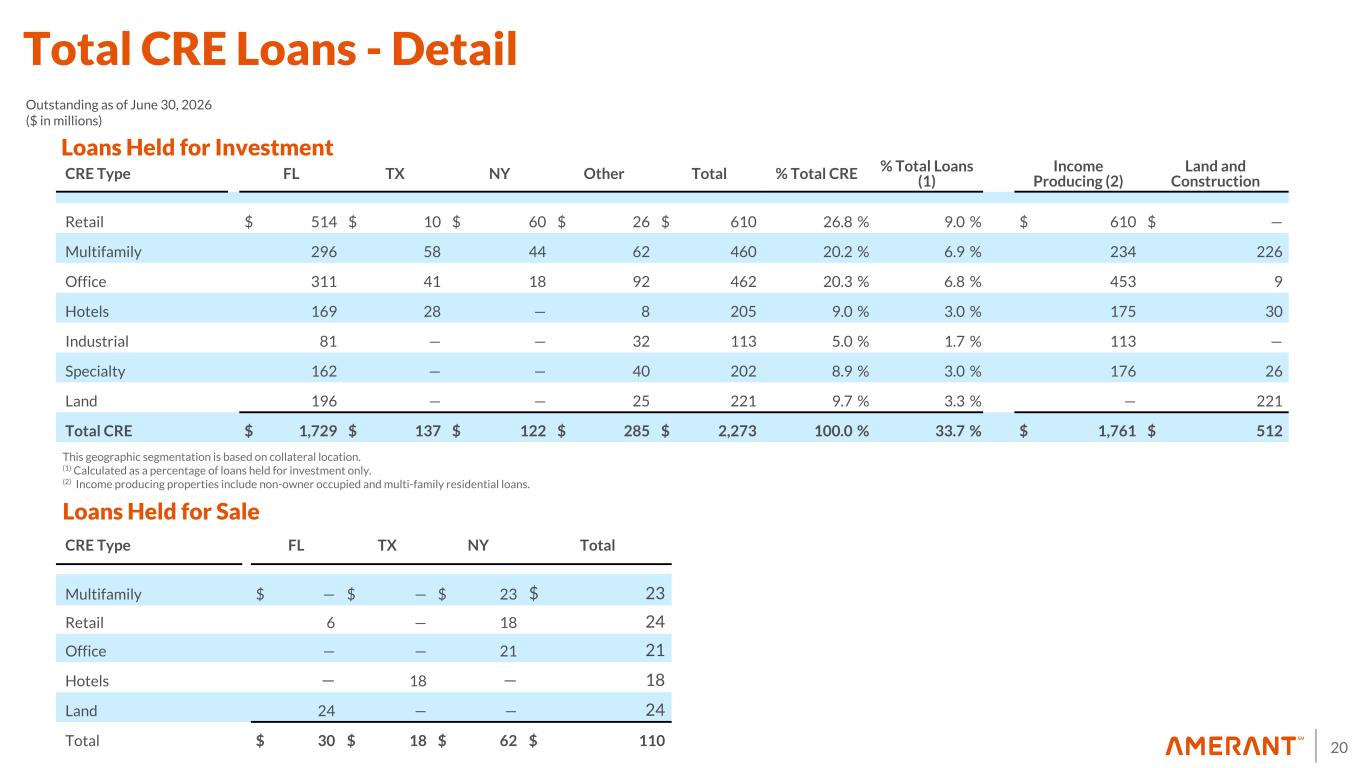
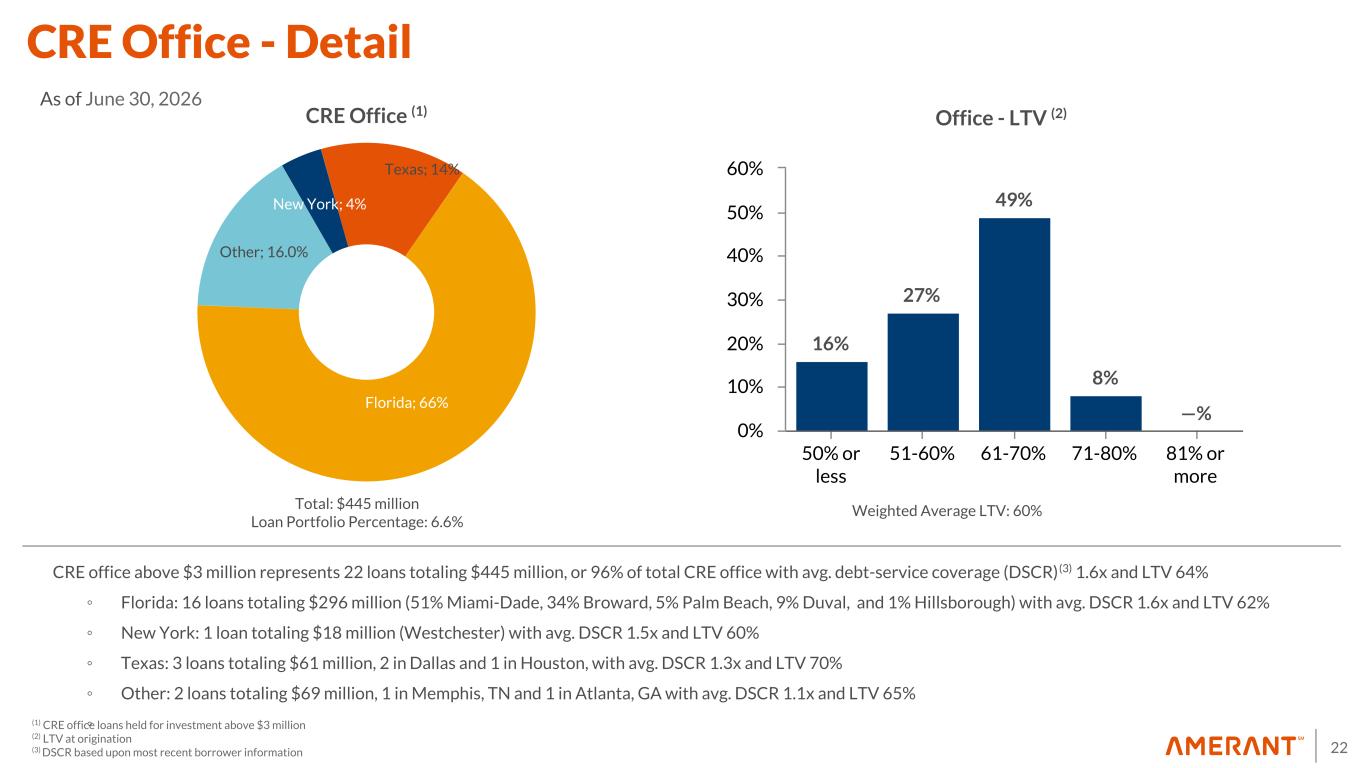
Right. Thank you for the question. So, typically, what we're projecting for the rest of the year, most of the growth will come from the CNI space. We still believe that the CRE space, even though we have a strong, we're still going through recomposition of that portfolio. So some of the classifieds that we still have and some of the NBOs that we still have are in the CRE portfolio. We do expect them to roll down. So all the efforts on CRE, even very positive. When it comes to the new sweet spot, we're close to KIPA where we have been working a lot. So we are doing just the $30 or $35 million.
To a lesser extent, some on the RECI portfolio. And on the CRE side, as Carlos was saying, we're going to be very selective as to which segments within CRE we would be working with. But as Carlos was mentioning, we have some offsets happening to that production related to the strategic exits and credit optimization. So expectation overall would be C&I space.
Got it. Thank you both. And then within your margin guide, are you assuming anything out of the Fed, you know, from a rate hike perspective? And, you know, if so, how is that contemplated in the guide?
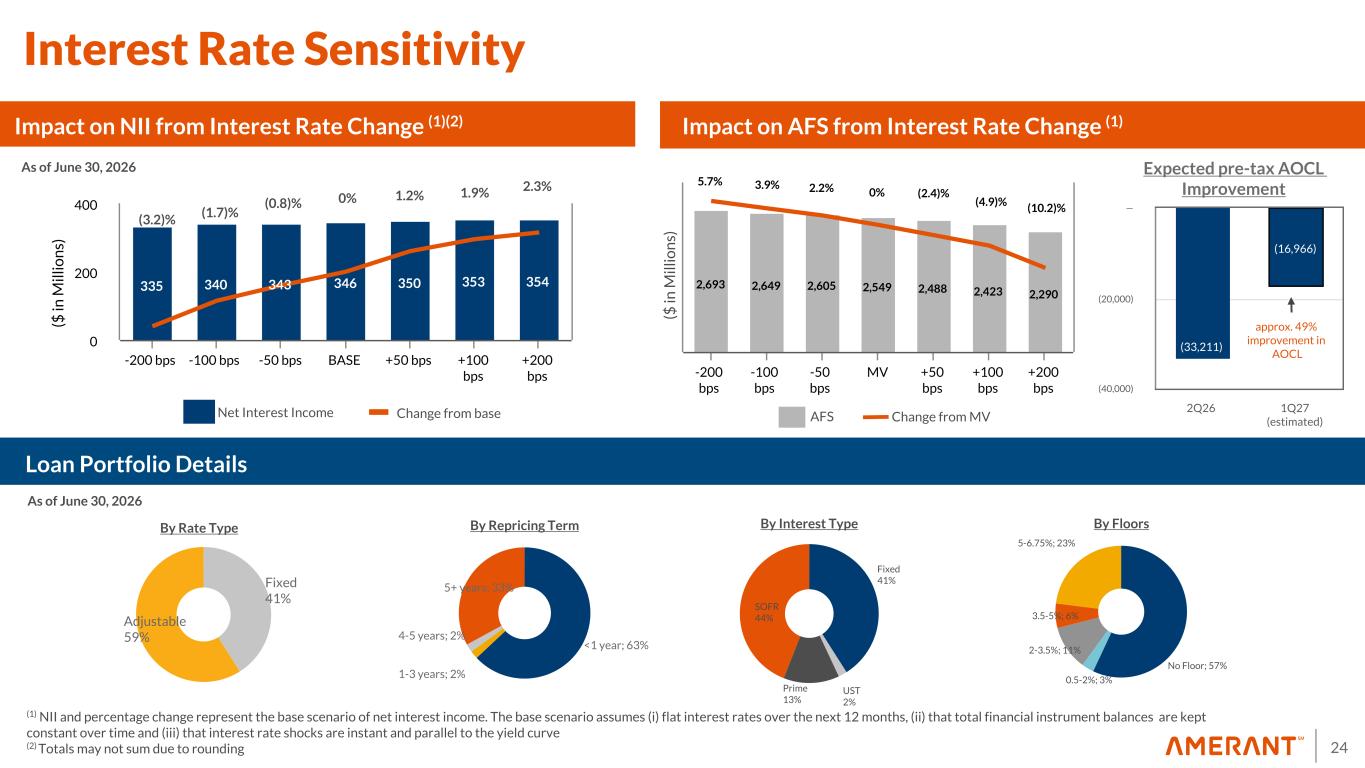
Yeah, no rate hikes, no drops either that would cause anything significant, at least through December of this year. Projections are based on the loan pipeline and production that we have and that we're estimating and also the low-cost funding inflows that we're expecting through the end of the year.
Okay, thank you. And then last one for me on the expenses. Appreciate the update and lower exit run rates for this year. You mentioned crossing $10 billion in assets. I wonder if the cost associated with that and non-interest expense is contemplated in the guide, or might some of that spill into 27? And as we think about Amaranth moving into next year with whatever franchise investment you may be considering, what type of growth rate or normalized growth rate expectation should we contemplate for expenses next year?
So, no, great question. So I believe most of the investments that were related to crossing the $10 billion were already factoring into our run rate. As you probably remember last year, there were a couple of instances that we crossed. So we are already utilizing, it's already the $10 billion. So we don't anticipate incremental expenses to be ready for that. The Irving Amendment, if we anticipate it as a second, that wouldn't be significant.
Yeah, and to complement that, so several periods ago, we completed a readiness assessment of crossing the $10 billion threshold from both a compliance and a risk management standpoint. So the expenses or the investments that typically you see for an organization that's crossing the $10 billion thresholds are embedded into the figures that we are providing from a guidance standpoint. And going into 2027, as Carlos was saying, yes, we expect some slight investments associated to technology, but at the same time, we have built the offsets to be able to maintain the run rate at the levels where we see them in Q4.
Okay. Excellent. Thank you both for taking my questions.
Operator
Our next question comes from the line of Cole Martin with Raymond James. Pleasure to see you with your questions.
Operator
Hey, good morning. Thank you for taking my questions. Just on the 1% ROA target, I was hoping you could talk a bit more about your NIN and NII expectations, both going into 4Q26 and also 2027.
Yeah, Shari will take that.
So as we think about the NII, a portion of this is related to scale, right? We have invested and spent efforts into making sure we optimize our expense structure. And now we see the benefits out of that. We're focusing now on the NII side from a revenue perspective and what scale can provide. So having access and having inflows from low-cost deposits and being able to redeploy them into high-quality assets provide the necessary contribution to NII to get to that 1% ROA. And the inflows as they relate to the deposit accounts are expected to continue in upcoming periods.
So it's something that will allow us to continue to improve both the efficiency ratio and the I guess one of the critical points for the ROA is the incremental low-cost deposits that we're expecting from, you know, that we have been having a big part of keep up with the financial margin.
Operator
Okay, great. And then also just on capital, I was hoping you could talk a bit more about how you're going to balance uh loan growth versus future repurchases moving forward and i guess also the implications of accelerating deposit growth with that thank you yeah great great question so our cd1 uh close to 12 for for quarter we run straight so we will continue to use our buyback million
dollars left and and we still believe that there is a big opportunity with the way that we're traded shareholders. And obviously, after doing all our capital sufficiency analysis, we believe that there is still opportunity for Amaranth to be opportunistic and return value to shareholders.
Operator
Great. Thank you.
Operator
Thank you. At this time, I'll turn the floor back to management for closing comments.
Thank you so much for connecting to today's call.
Operator
Thank you. Ladies and gentlemen, thank you for your participation. This does conclude today's teleconference. Let me disconnect your lines at this time and have a wonderful day. Thank you.