Operator
Good morning and welcome to Siena's Fiscal Fourth Quarter and Year End 2025 Financial Results Conference Call. All participants will be in listen-only mode. Should you need assistance, please signal a conference specialist by pressing star then zero on your telephone keypad. After today's presentation, there will be an opportunity to ask questions. To ask a question, you may press star then one on your telephone keypad. To withdraw your question, please press star then two. Please note, this event is being recorded. I would now like to turn the conference over to Greg Lamp, Vice President of Investor Relations. Please go ahead. Thank you, Drew.
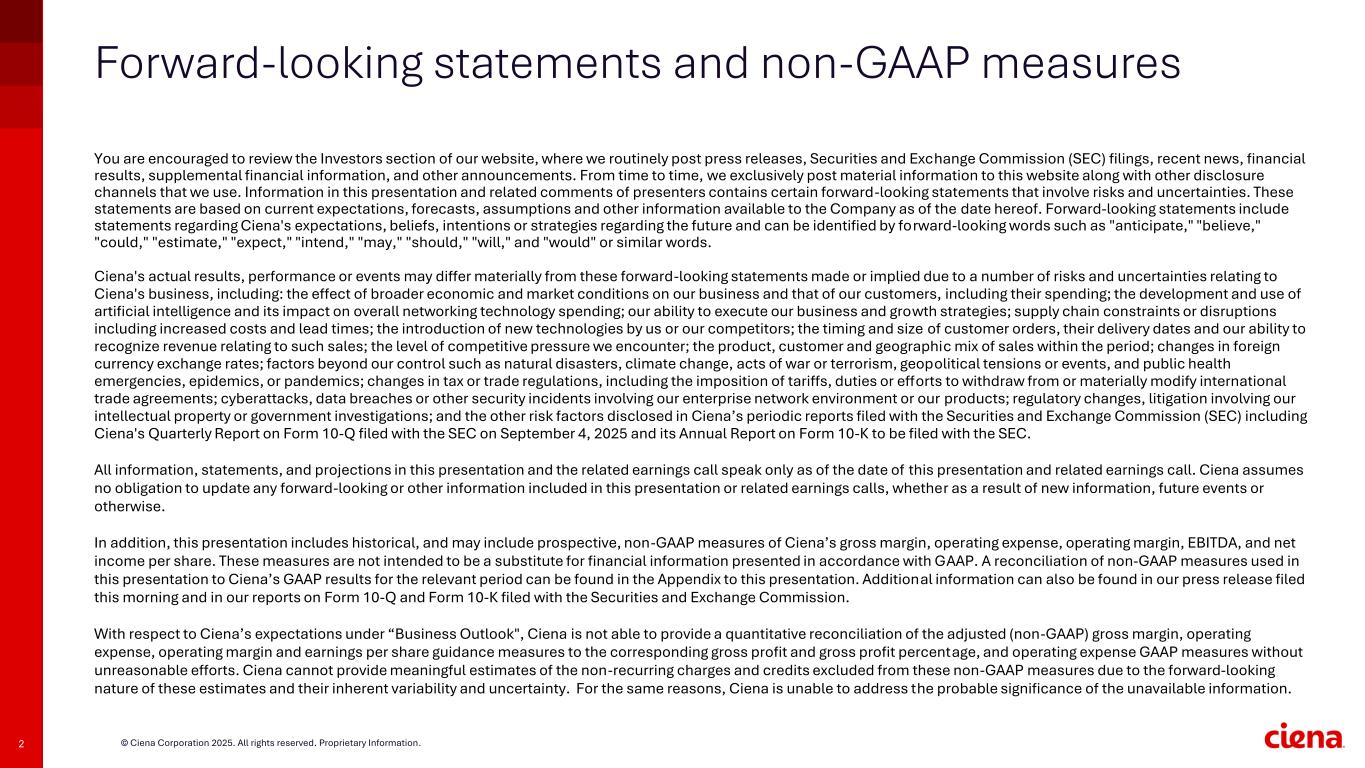
Good morning, and welcome to Siena's 2025 Fiscal Fourth Quarter and Year-End Results Conference On the call today is Gary Smith, President and CEO, and Mark Graff, CFO. Scott McFeely, Executive Advisor, is also with us for Q&A. In addition to this call and the press release, we have posted to the investor section of our website an accompanying investor presentation that reflects this discussion, as well as certain highlighted items for the fiscal quarter and year end. Our comments today speak to our recent performance, our view on current market dynamics and drivers of our business, as well as the discussion of our financial outlook. Today's discussion includes certain adjusted or non-GAAP measures of Cienda's results of operations, a reconciliation of these non-GAAP measures to our GAAP results is included in today's press release. Before turning the call over to Gary, I'll remind you that during this call, we'll be making certain forward-looking statements. Such statements, including our quarterly and annual guidance, commentary on market dynamics, and discussion of our opportunities and strategy, are based on current expectations, forecasts, and assumptions regarding the company and its markets, which include risks and uncertainties that could cause actual results to differ materially from the statements discussed today. Assumptions relating to our outlook, whether mentioned on this call or included in the investor presentation that we posted earlier today, are an important part of such forward-looking statements, and we encourage you to consider them. Our forward-looking statements should also be viewed in the context of the risk factors detailed in our most recent 10Q, and in our upcoming 10K filing. Susanna assumes no obligation to update the information discussed in this conference call, whether as a result of new information, future events, or otherwise. As always, we'll allow for as much Q&A as possible today, though I ask that you limit yourselves to one question when follow-up. With that, I'll turn the call over to Gary.
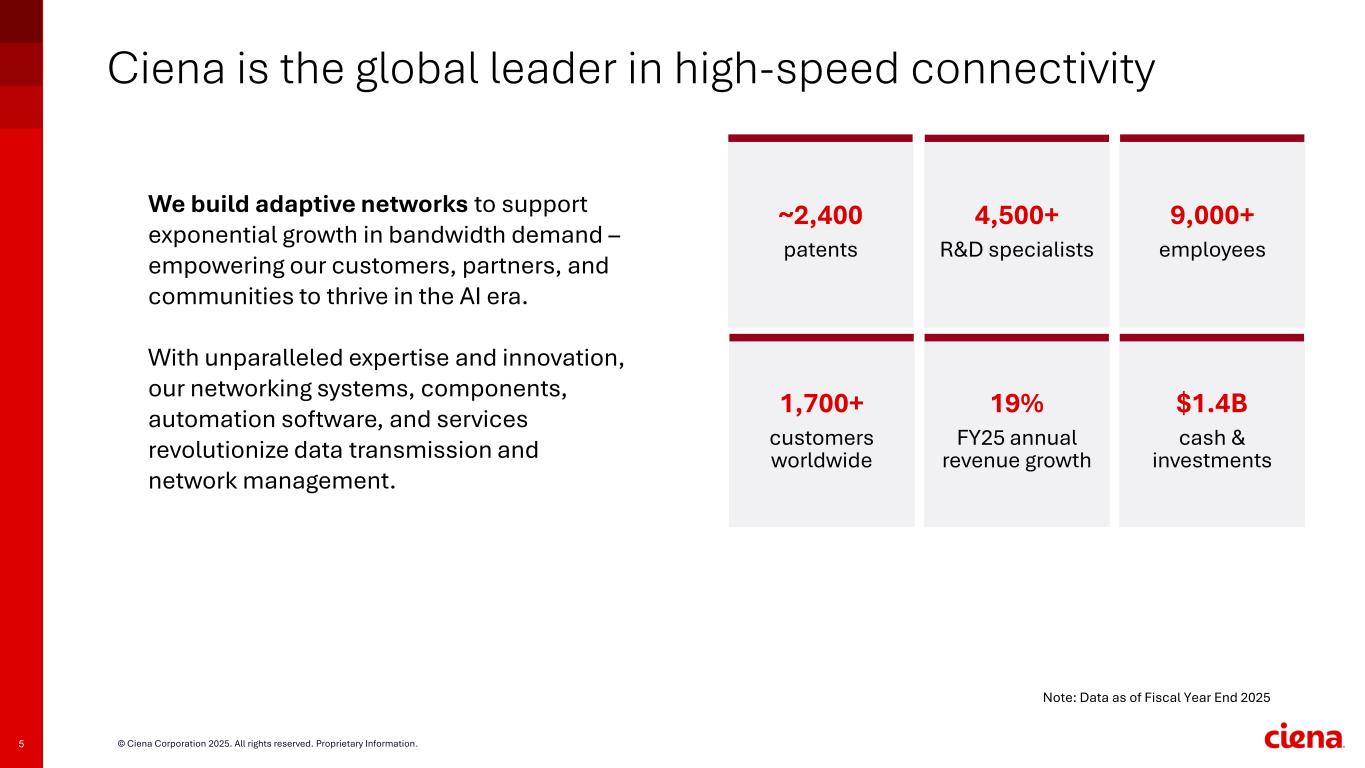
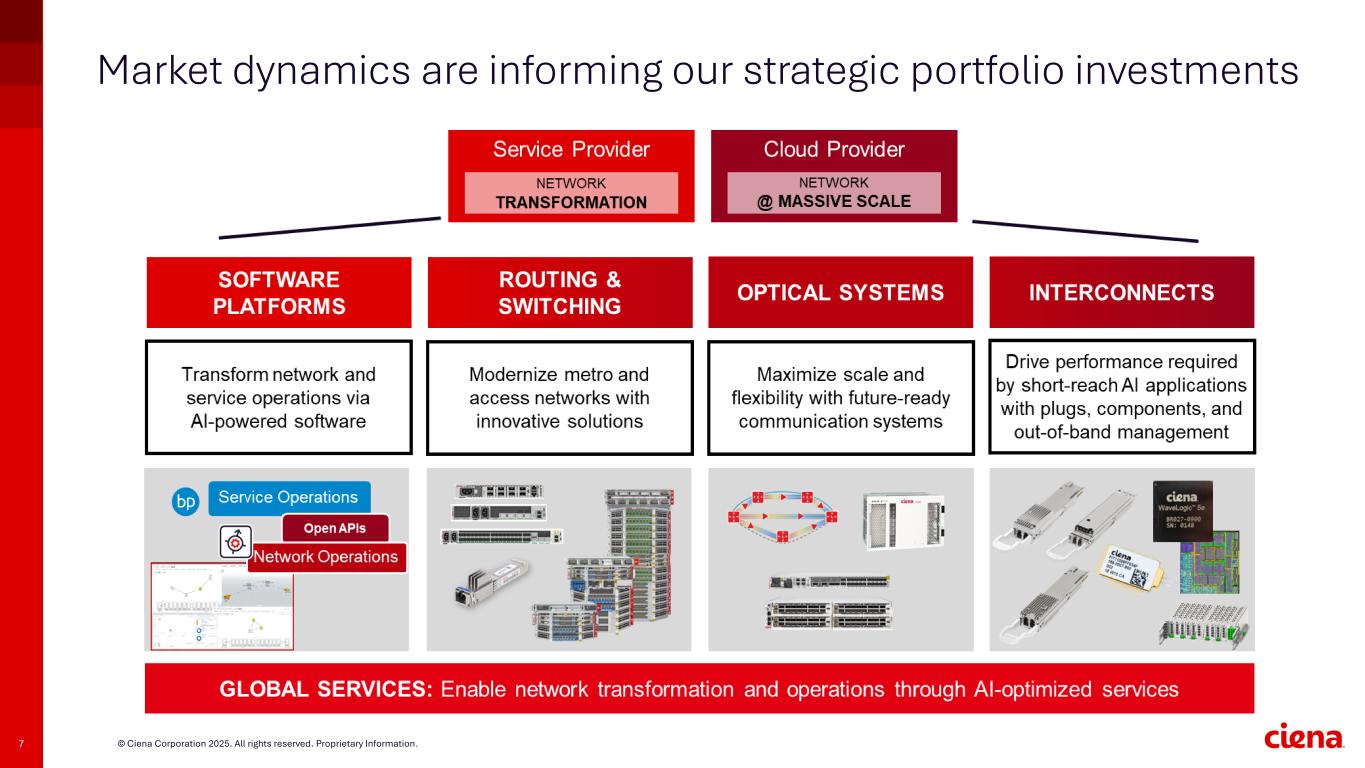
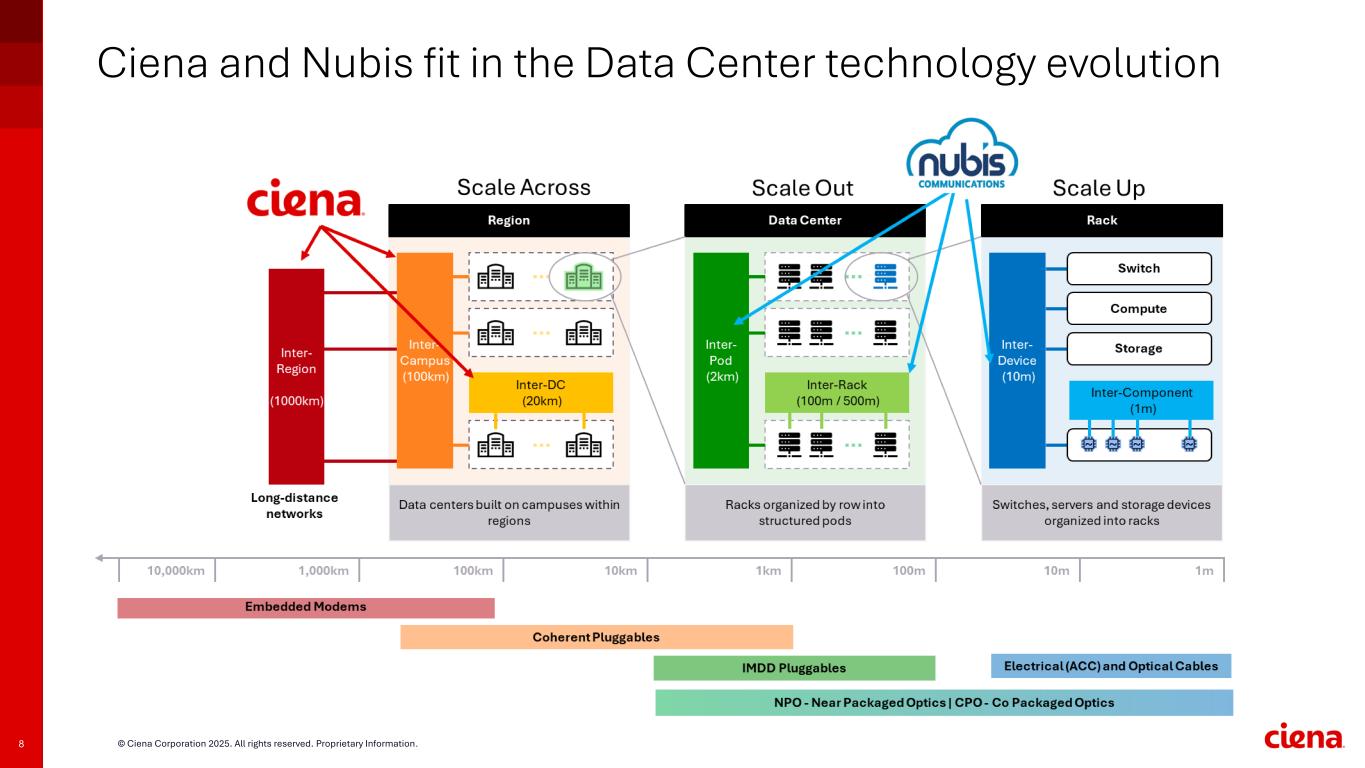
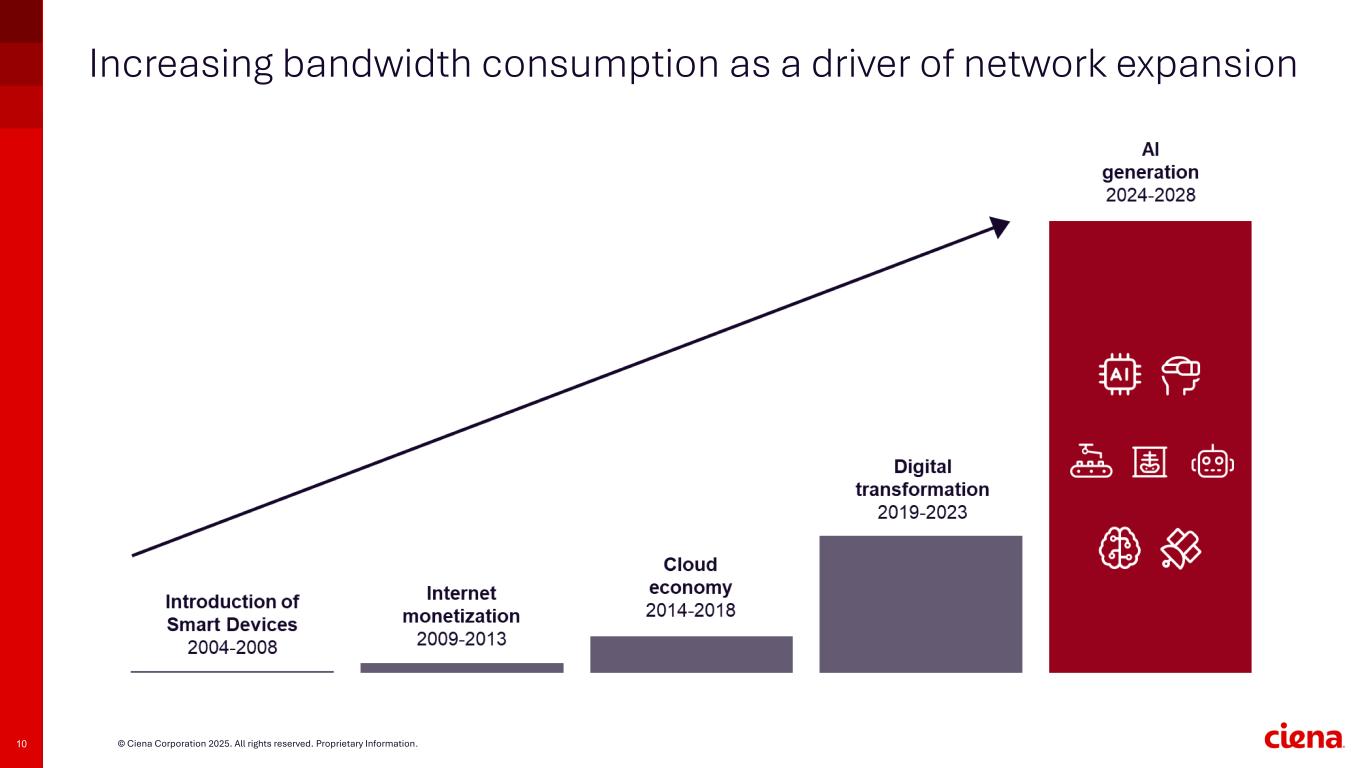
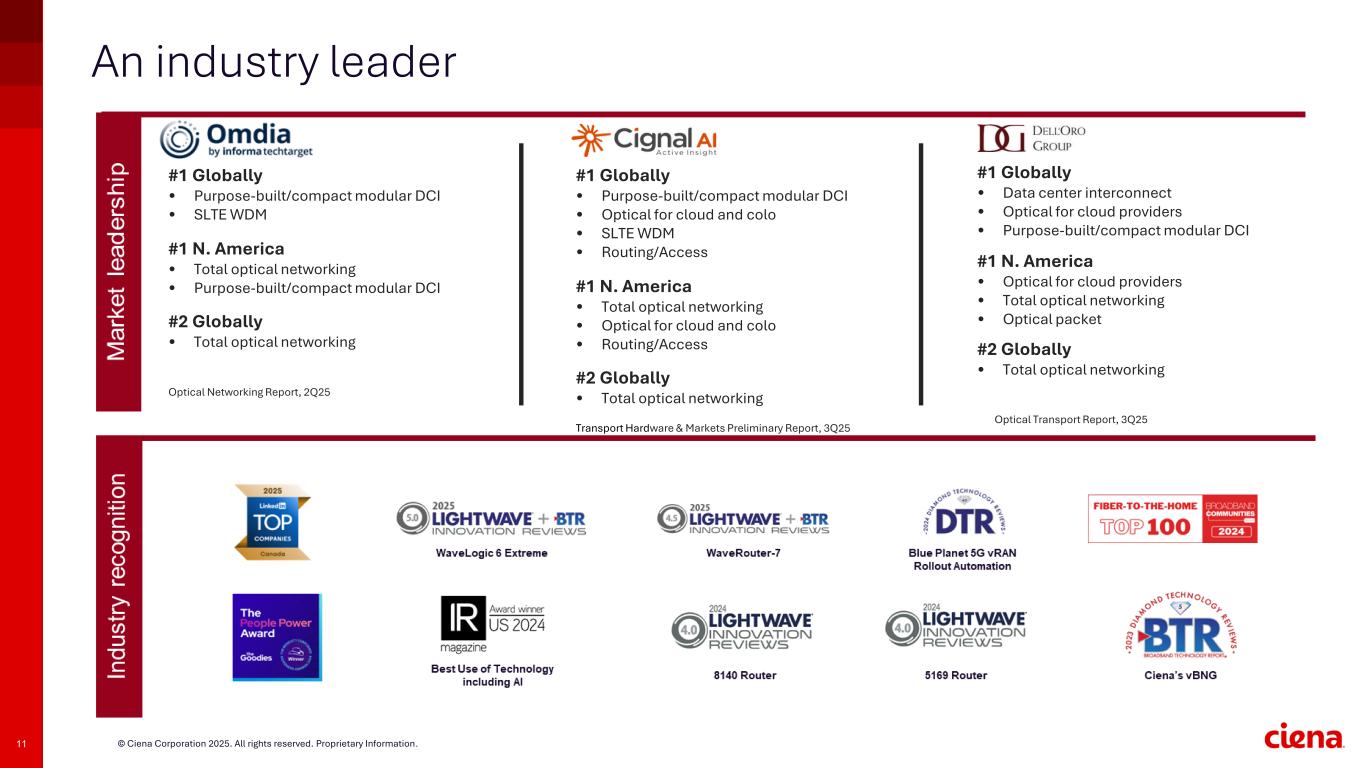
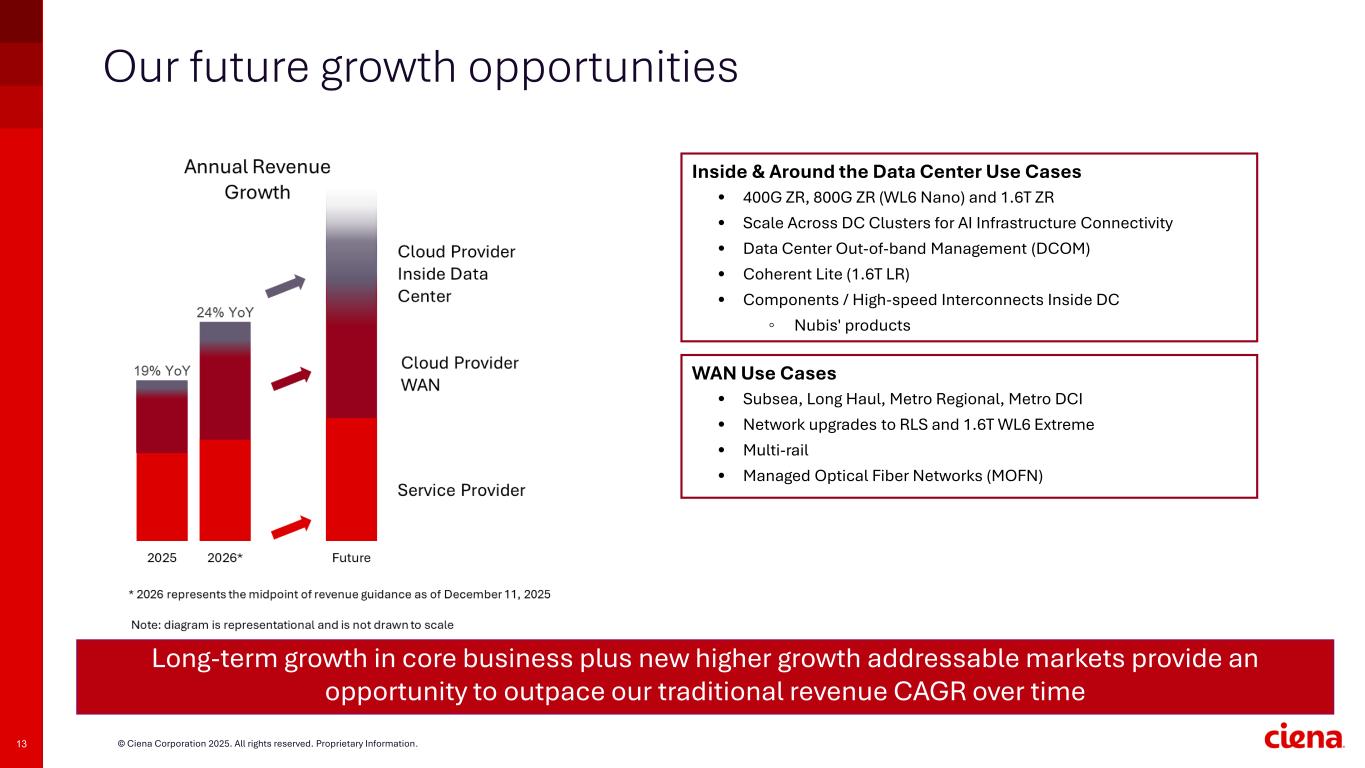
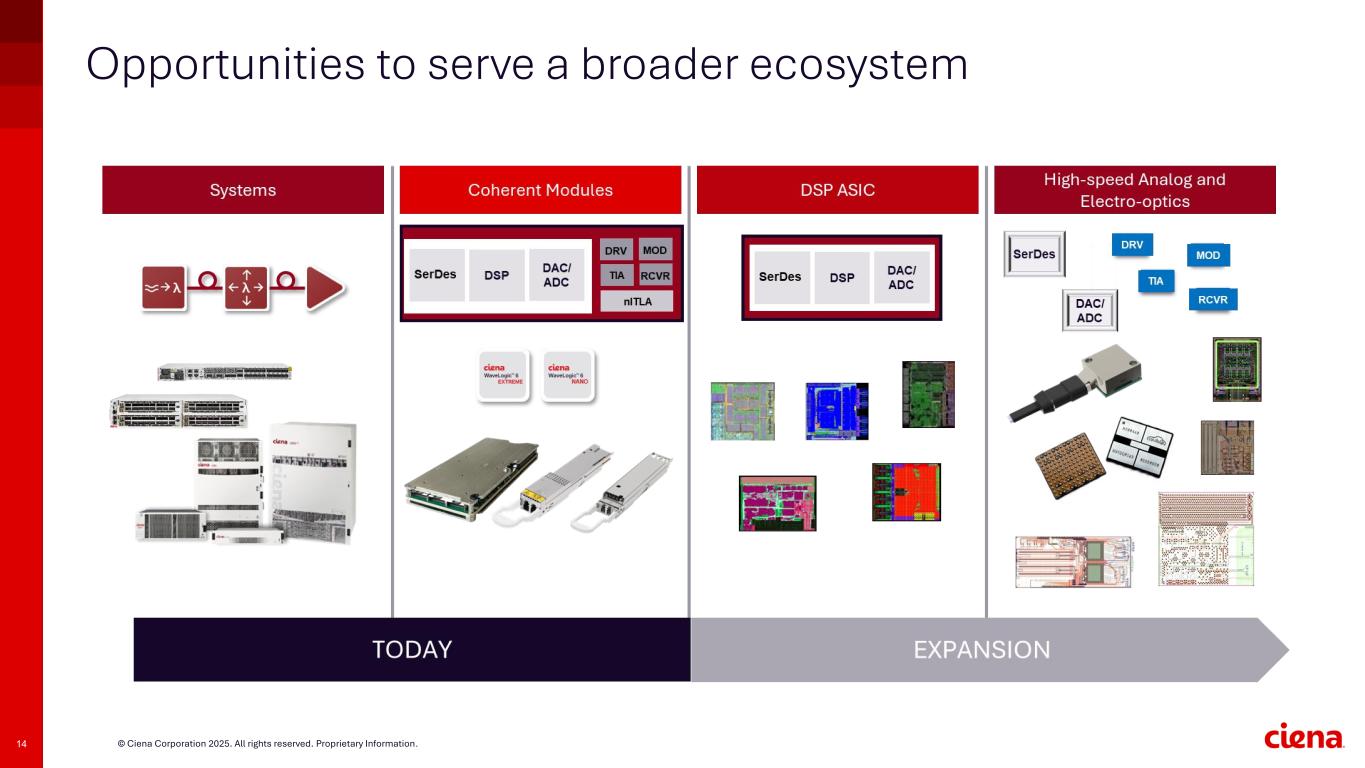
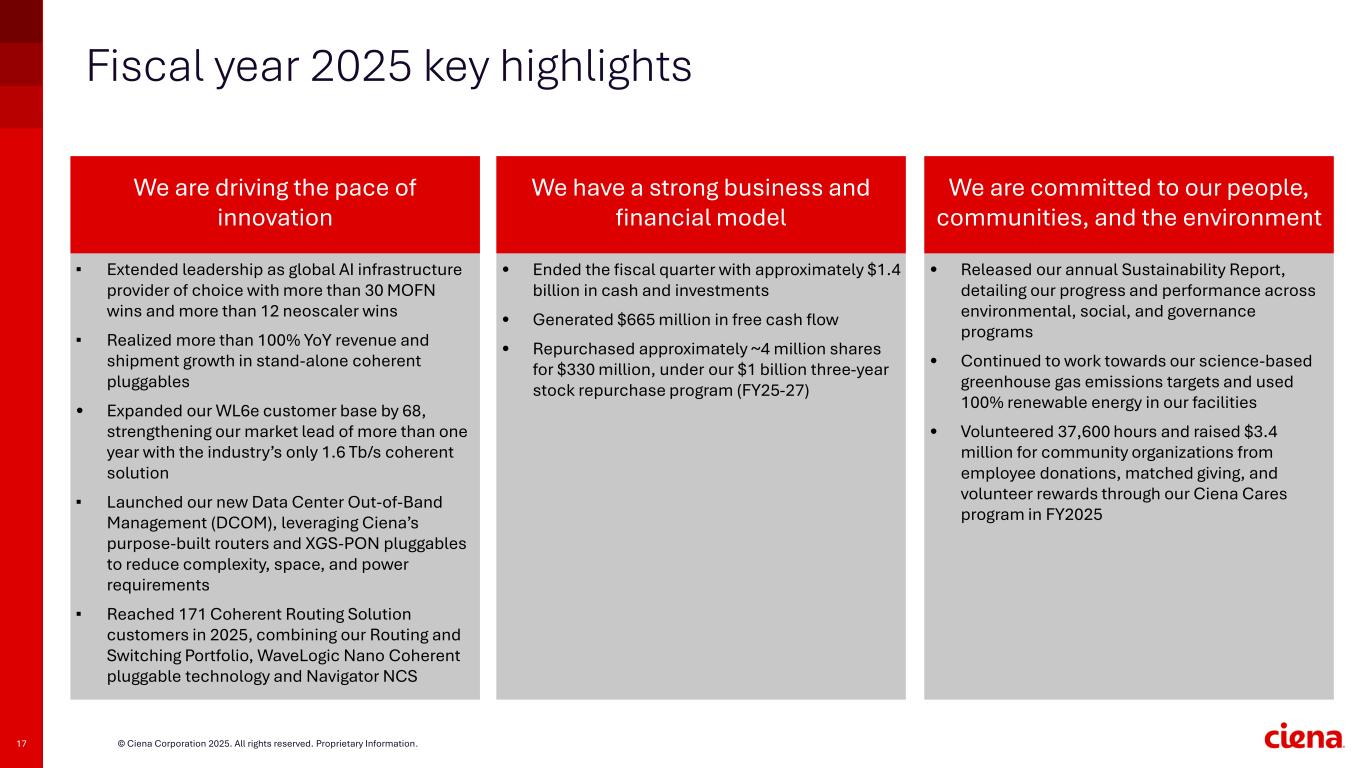
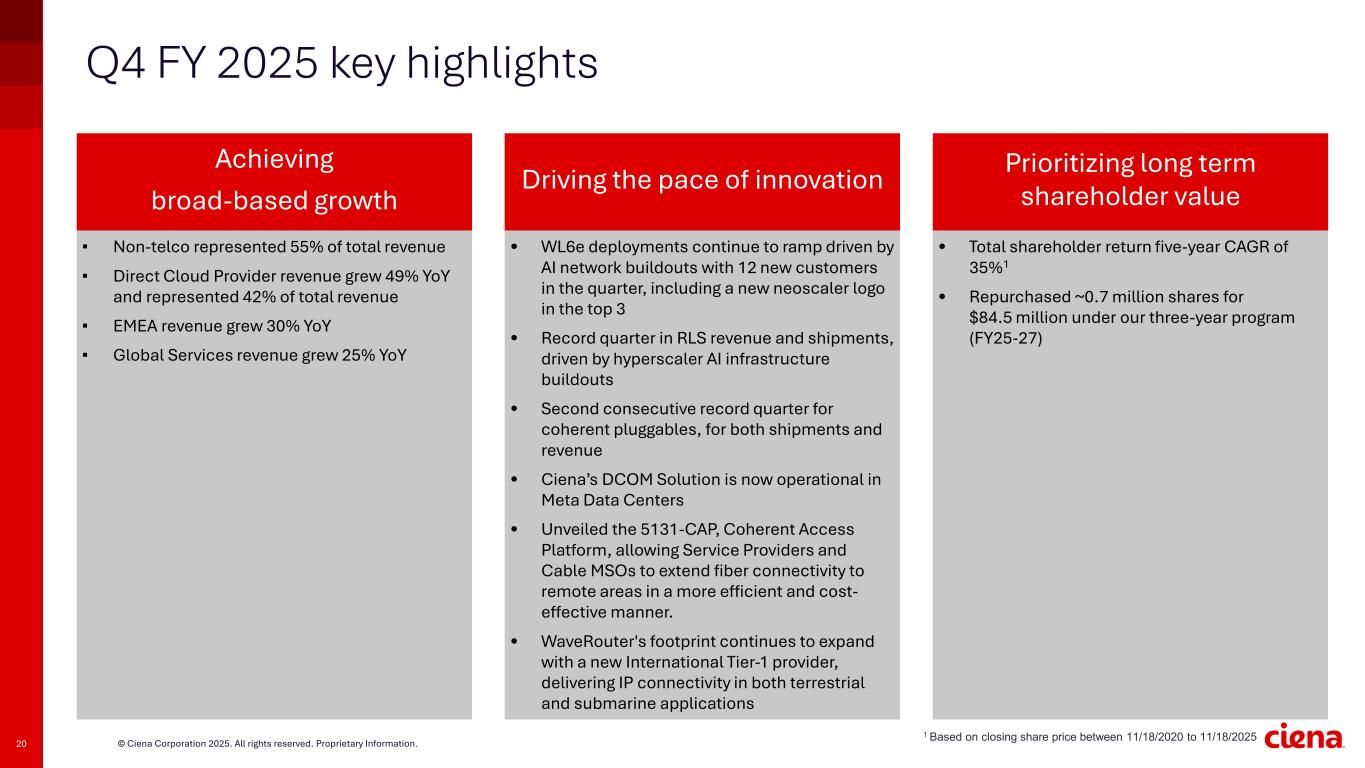
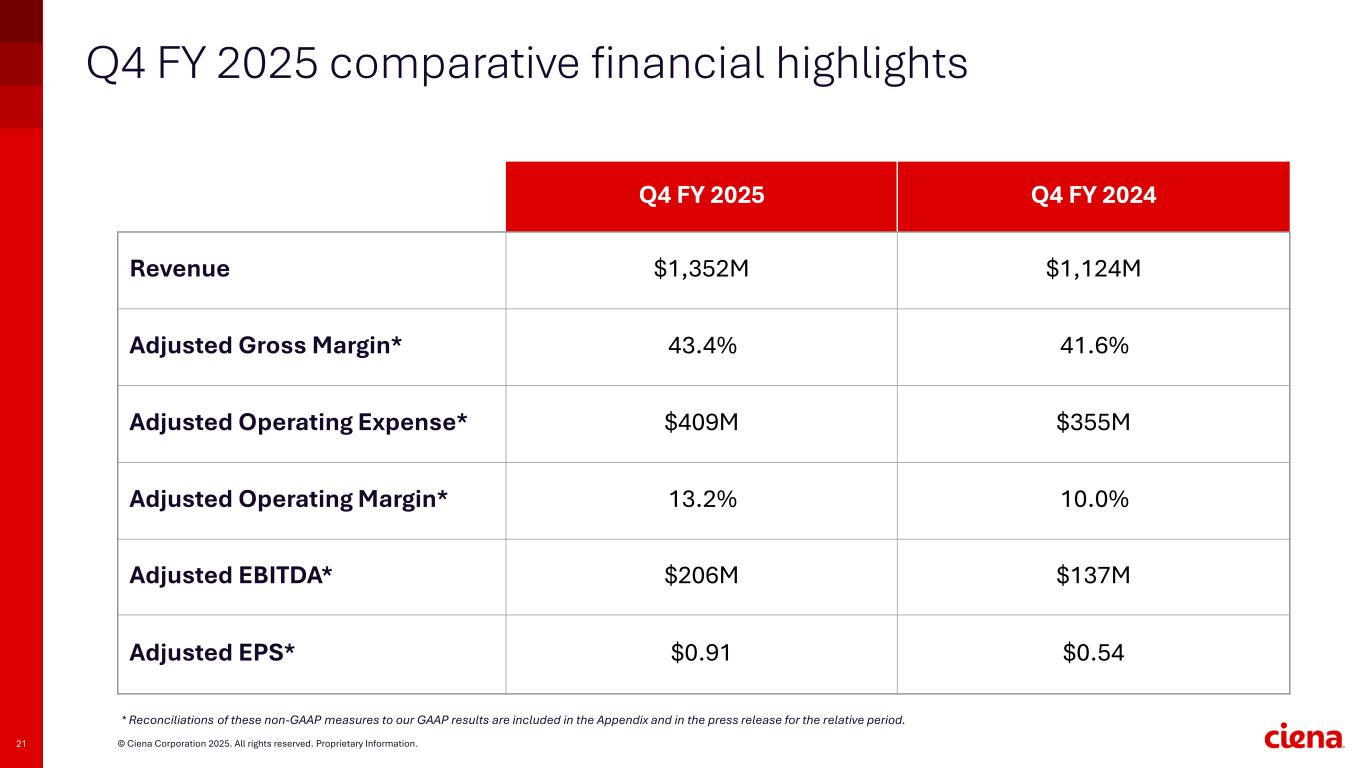
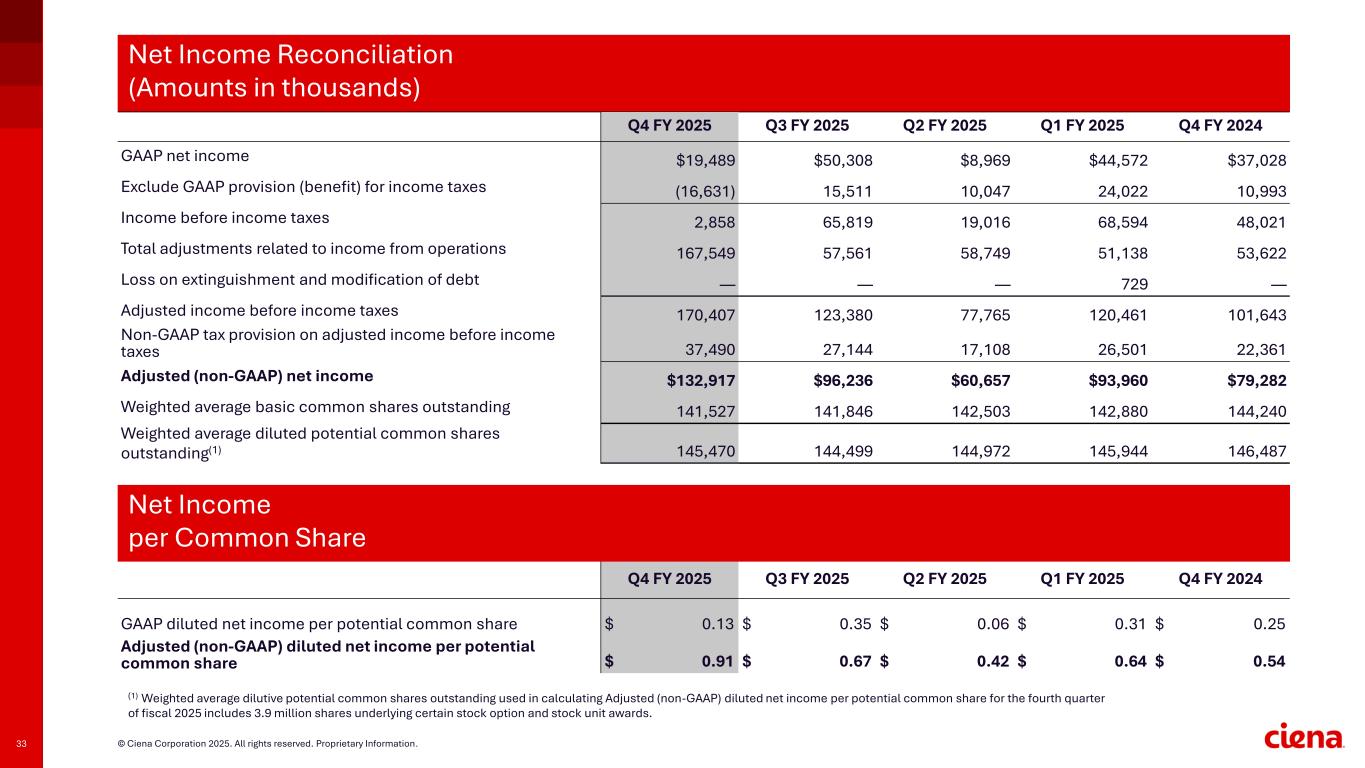
Thanks, Greg, and good morning, everyone. To today, we reported record fiscal fourth quarter and full year revenue of $1.35 billion and $4.77 billion, respectively. These records are a direct result of our sustained, purposeful investment and focus on leading high-speed connectivity technologies, together with disciplined execution and deep collaboration with our customers. Combined, these advantages have positioned and will continue to position Siena to deliver value in the AI ecosystem, serving both cloud and service provider customers for many years to come. And our progress in driving value from our operating model is also reflected in Q4 earnings per share of $0.91, up 69% year-over-year, and full-year EPS of $2.64, up 45% from fiscal 2024. Lastly, we generated record orders for the year of $7.8 billion, which resulted in our entering this year again with record backlog. These strong results really underscore our overall market leadership position, as well as the ramping broad-based demand across our business. And to this point, I'd like to provide some insights into what we believe to be robust and durable demand over the next several years. Firstly, we continue to see accelerating demand from our cloud customer providers. And that includes the large hyperscalers and the emerging neoscaler segment that we talked with you about last quarter. In fact, cloud providers today are as focused on scaling their network as they are on their access to power. Orders from cloud providers are very strong and ramping across our portfolio, and they constitute a substantial portion of our growing backlog. It's important to note that this accelerating demand is being driven by several dynamics. And as counterintuitive as it may seem, the cloud providers have largely actually under-invested in their networks to date, particularly relative to other areas of AI infrastructure. The major hyperscalers who are seeing rapid traffic growth not only have the capital to invest, but also have real, sustainable business models that are currently constrained by the need to dramatically scale their global networks. These cloud providers cannot and do not intend to strand their significant investments in AI-related data center infrastructure. And I would stress that that traffic needs to leave the data center to be monetized and operationalized. And we are their strategic technology partner for those network requirements. Secondly, demand from our service provider customers continues to grow steadily as they too reinvest in their transport infrastructure after years of digesting accumulated inventory and also having focused on other areas of their networks, most notably and specifically 5G. In addition, service providers' businesses are also being fueled by AI through the enterprise cloud demand and specifically cloud providers' need for managed optical fiber networks, or MOFIN. And as a proof point here, we have recently won and are working to deploy a large MOFIN project in India with two service providers for a major hyperscaler. Additionally, in the quarter, we have secured multiple major MOFIN wins in other regions, including several in new and emerging geographies for our business. And as a result of these dynamics, service provider orders were up nearly 70% for the year. And in fact, our top three service providers' revenue from 24 to 25 grew 16%. Due to the increasing momentum across both cloud and service providers, as Siena's optical market share has continued to grow and extend our overall leadership, adding two points year to date, and we expect further gains clearly in 2026. In order to address this accelerating demand, we are committed to increasing investments and working with our supply chain partners to scale the business. With product delivery lead times extending in the face of this unprecedented demand, we are proactively expanding our capacity to ensure our ability to timely meet our customers' demands. Indeed, this has already yielded results for fiscal 25, as we delivered double our initial revenue growth expectations for the year. Mark will discuss how we are stepping up investments to support demand and the expanding opportunities we expect over the coming years. You know, the simple truth is that AI continues to drive network expansion across all our customer segments, and the scale of investment currently underway is massive and accelerating faster than anything we, or indeed the industry, have seen to date. And I would also mention that unlike the COVID-inspired supply-demand imbalance, we are seeing this demand be installed and leveraged for real near-term revenue opportunities at our customers, as evidenced by accelerated implementation services that increased in revenue by 34% in fiscal 2025. With that, I'd like to take a moment to share our sort of broader perspectives on the AI opportunity as it relates to high-speed connectivity. As bandwidth continues to grow inside the data center, and as this traffic flows out of the data center, AI inference models are moving closer to the network edge. And for the reasons that I mentioned earlier, we will continue to expand our existing leadership and addressable market in high-speed connectivity in the WAN. In addition to the wide area network, we're also seeing a significant addressable market opportunity in and around the data center. It is, I think, well understood that cloud providers are investing heavily in data centers to deliver on the current and future promises of AI. Many third parties are estimating capital spending of more than $7 trillion through the end of the decade in all AI-related infrastructure. And this is obviously necessitating the need for both training and inference workloads at massive scale. As a result of the massive growth in AI workloads, and to address growing power and space constraints, Cloud providers are planning and building distributed AI data center training clusters, or AI factories, which require multiple clusters to act as one. In fact, along with those power and space constraints, the ability of the cloud providers, and specifically the major hyperscalers, to scale their global networks is becoming the critical long pole in the tent for them to operationalize AI for both training and inference purposes. Within these data center environments, there are three key connectivity requirements. To scale up within a data center rack, to scale out between racks in a data center, and finally to scale across between geographically distributed data centers which must operate at the highest levels of performance with super high capacity and the lowest latency possible. With our innovation and time-to-market leadership in high-speed connectivity solutions, our position could not be better to fulfill this critical demand. This growing AI-driven opportunity for Ciena is what we refer to as in and around the data center. In fact, our in and around the data center opportunities grew threefold from 24 to 25 and are a major contributor to our 26 expected growth rate. we have proactively invested in our portfolio to intersect this growing market segment and with a few notable examples. First is our InterConnects portfolio, comprising both our power and space-saving ZR and ZR Plus pluggables and our optical components. We expect InterConnects to play a meaningful role in scale-up, scale-out, and in fact scale-across workloads. In fiscal year 25, we surpassed our target of more than doubling FY24 pluggable revenue, reaching revenue of more than $168 million. In the quarter, our WaveLogic 6 Nano 800 gig pluggables has shipped for initial revenue. And since the end of the quarter, we have shipped 800 ZR plugs to three additional cloud providers for testing and certification. And with regard to components, we address the cloud provider's preferred disaggregated consumption model with our high-speed coherent and other industry-leading wave logic technologies, including our DSP, SIRTEES, and other high-speed analog and electro-optical components. In addition, our components business now includes the electrical and optical interconnect solutions from our acquisition of Nubis Communications. The Nubis technologies and expertise will help us address the scale-up and scale-out opportunities inside the data center. We're excited to have the Nubis team as part of Ciena and are on track to GA the first products in fiscal 26. And as we previously noted, as technology advances and data rates increase, the components portion of our Interconnects portfolio primarily represents revenue opportunities beyond fiscal 26. In addition to our InterConnects portfolio, as market needs continue to evolve, driven by AI, we're seeing new architectural applications arise in and around the data center. With two recent cloud provider use cases, I think, of particular note. First use case is the scale across architecture, linking geographically dispersed AI training clusters using our market-leading RLS photonic line system, waveservers, and interconnects portfolio. This is an opportunity we discussed over the past couple of quarters, where a large hyperscale is linking to two regional data centers to build an AI backbone. I'm pleased to report that this hyperscaler is now extending this architecture to more locations. Additionally, I am pleased to announce that two more major hyperscalers have chosen our optical solutions for their scale-across training applications as well. The second use case is out-of-band network management. Sienna's unique DCOM solution leverages our XGS PAN and other routing and switching products and was initially designed with Meta to meet hyperscale requirements. Today, I'm pleased to announce that our DCOM business with Meta has expanded as they plan to deploy in multiple new data centers. Also, we're engaged in advanced technical discussions with additional hyperscalers to deploy this DCOM solution in their data centers. I'd like to briefly acknowledge here that the scale across and DCOM wins are just the most recent AI-related use cases to materialize for us in recent months. They are great examples of how we co-create and productize with market-leading solutions to address critical customer scaling requirements. And we fully anticipate continuing to develop additional innovative solutions with our customers as they monetize AI across the various architectures. Before I turn it over to Mark, I really want to reiterate that as we leave Q4 and indeed the entirety of 2025, we have absolute conviction that the positive market dynamics and our technology leadership provides us with increasing confidence that the durability of demand and our business and financial trajectory are very strong. I'll now hand it over to Mark for a closer look at our Q4 and fiscal 25 performance and outlook.
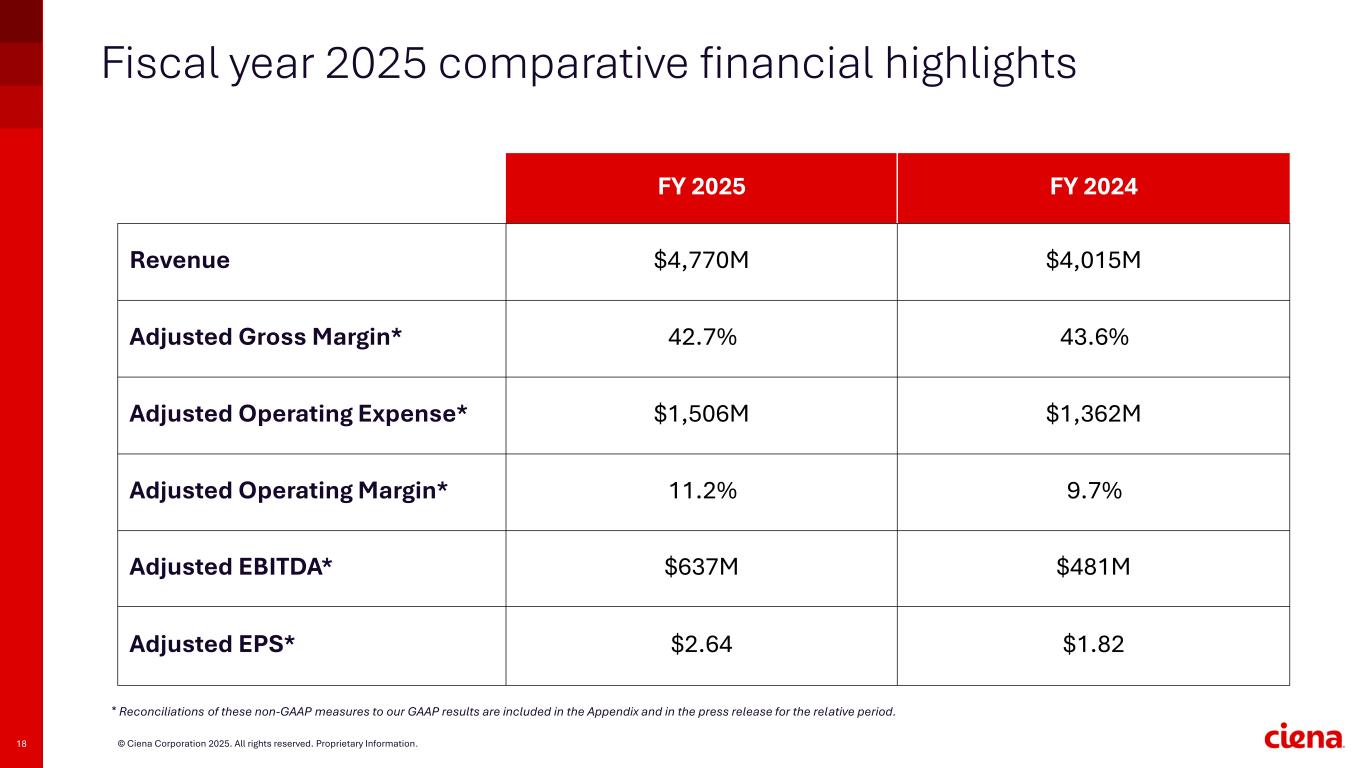
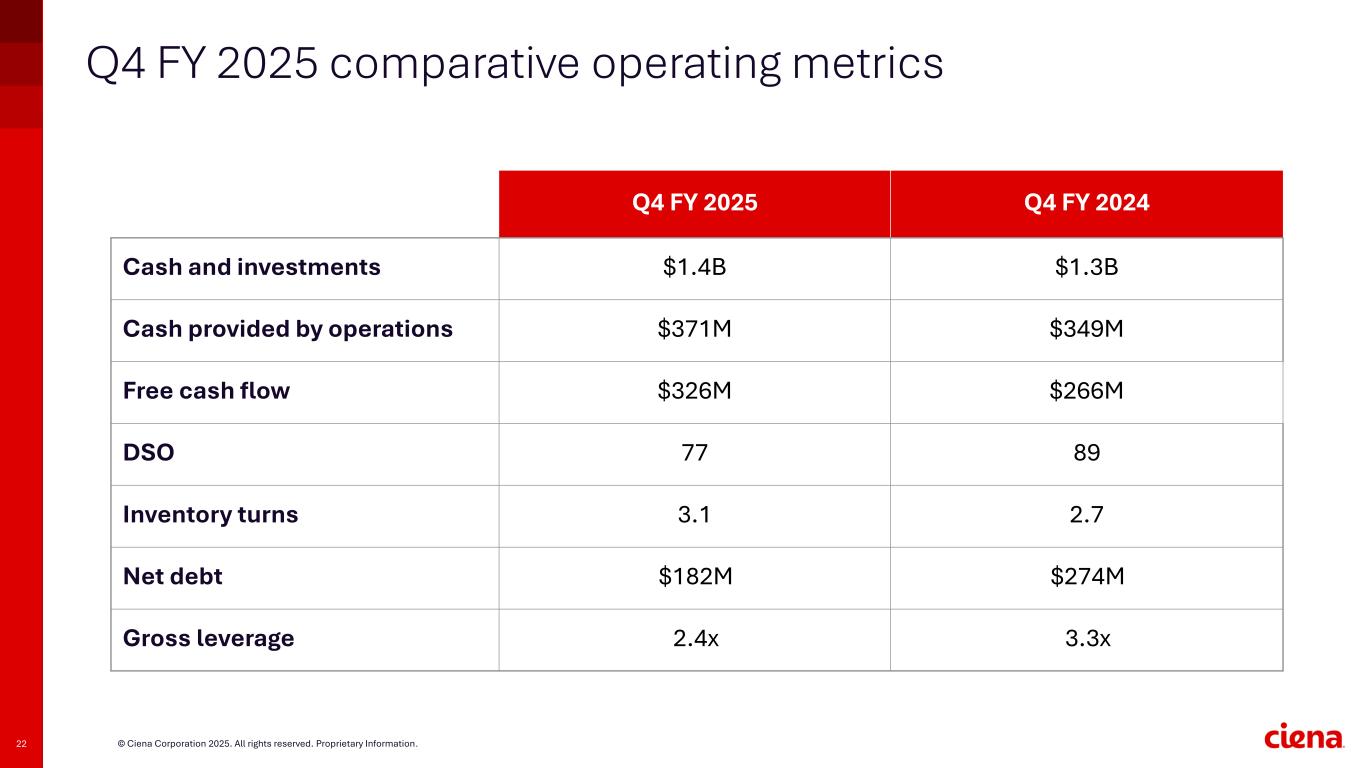
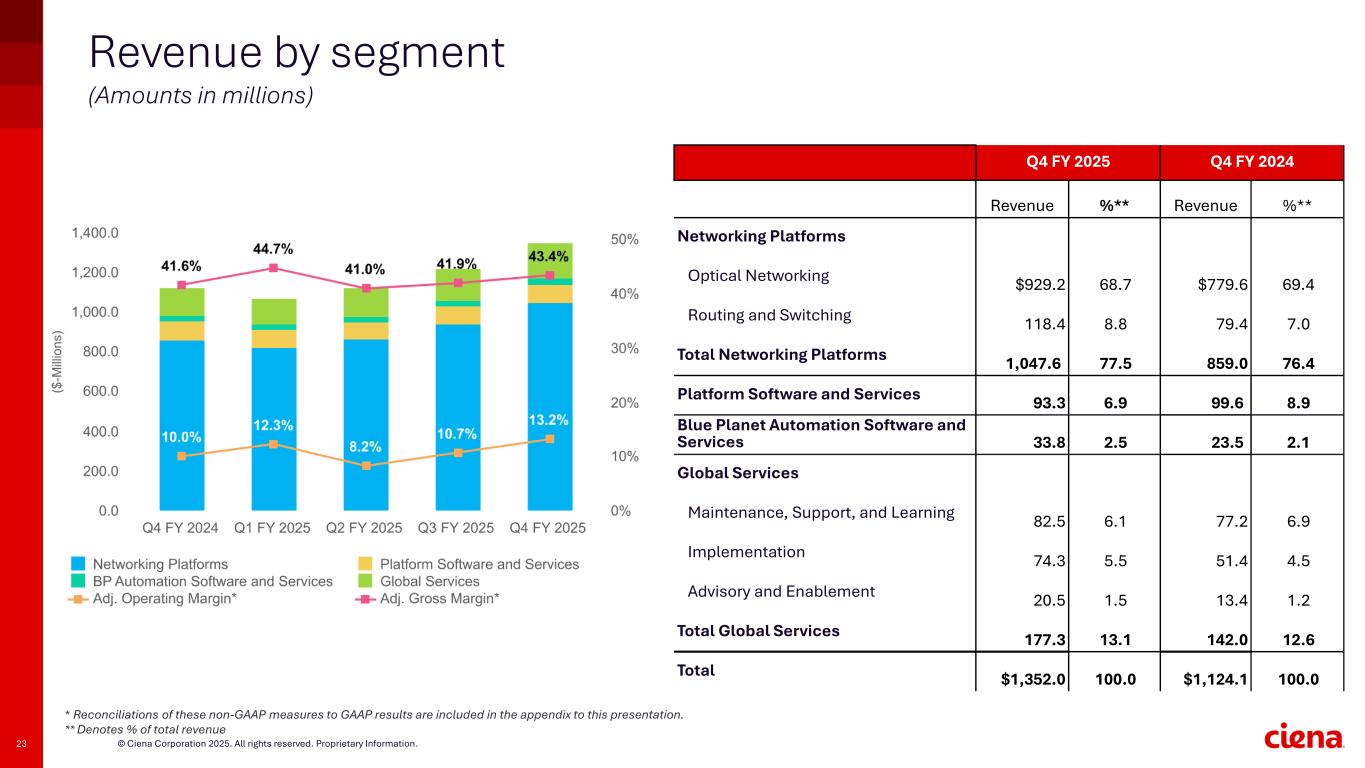
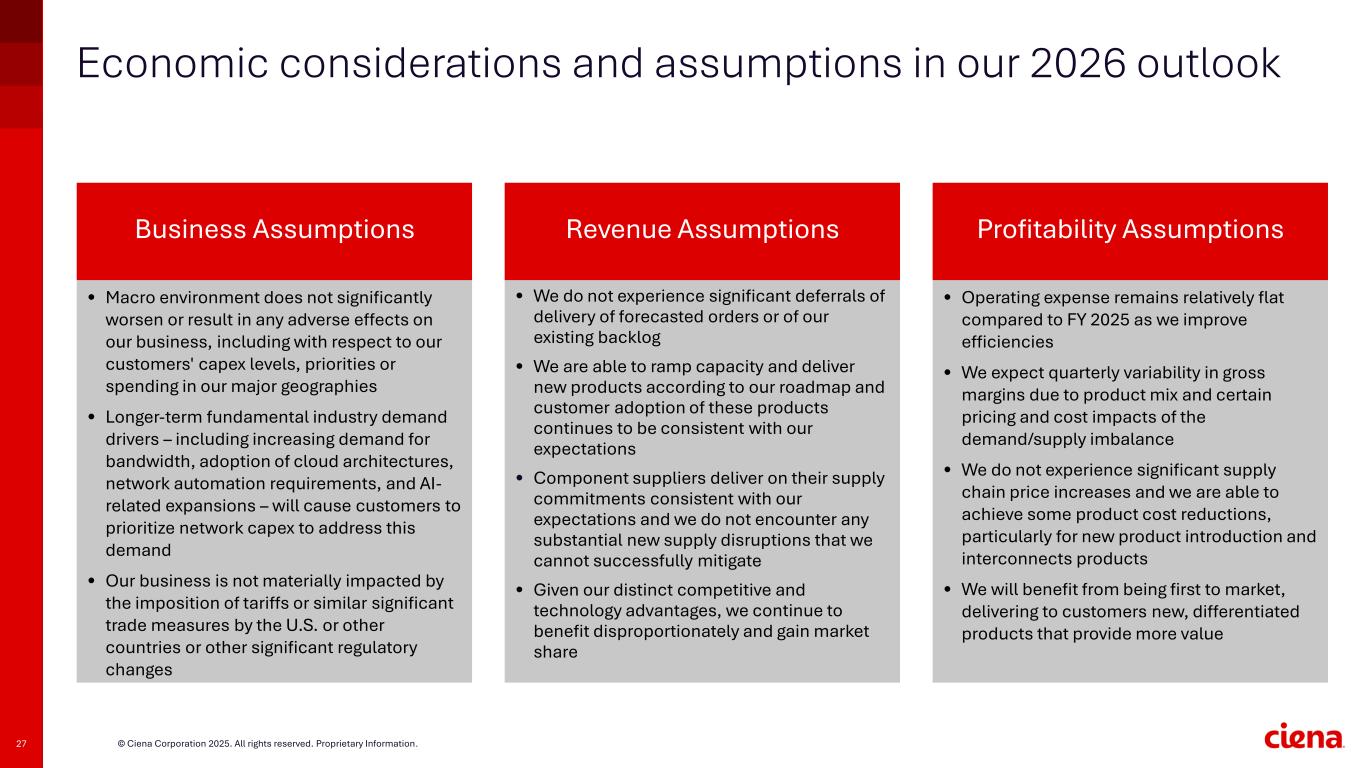
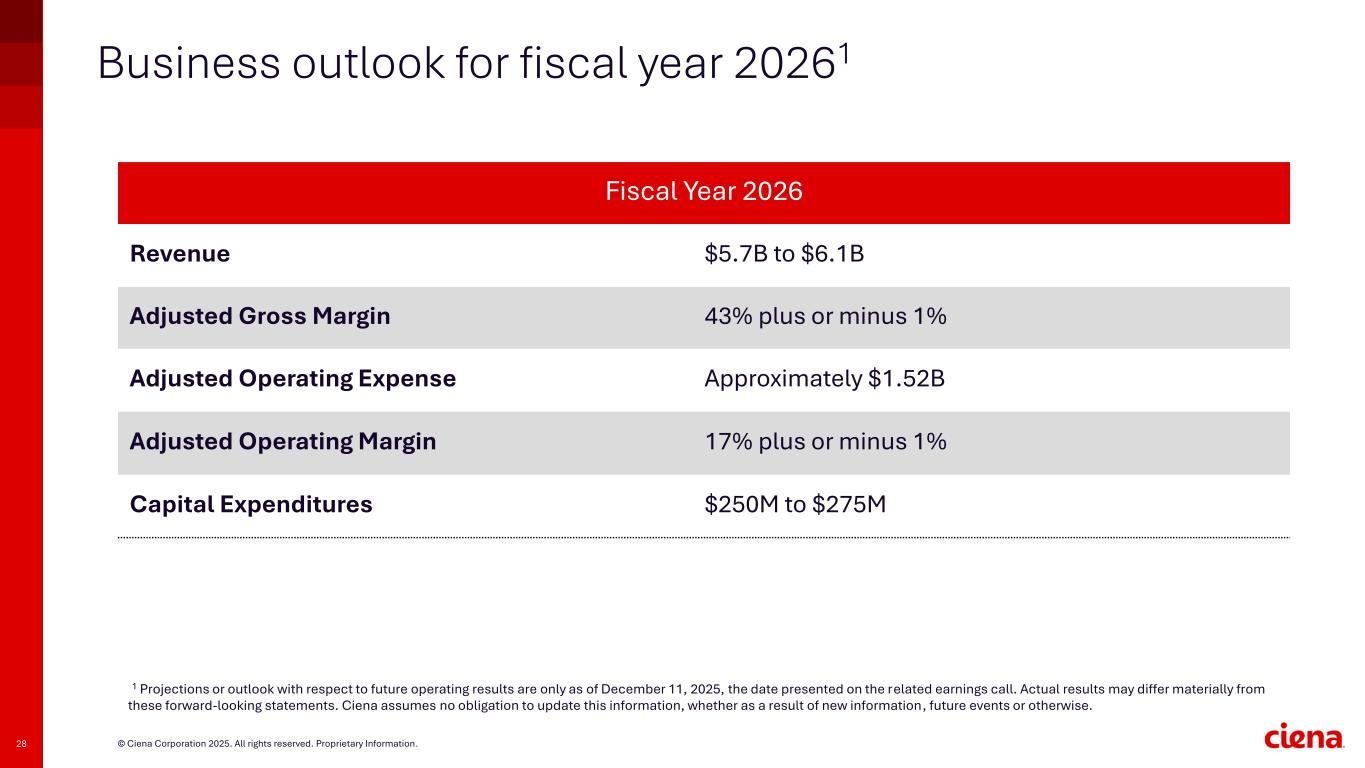
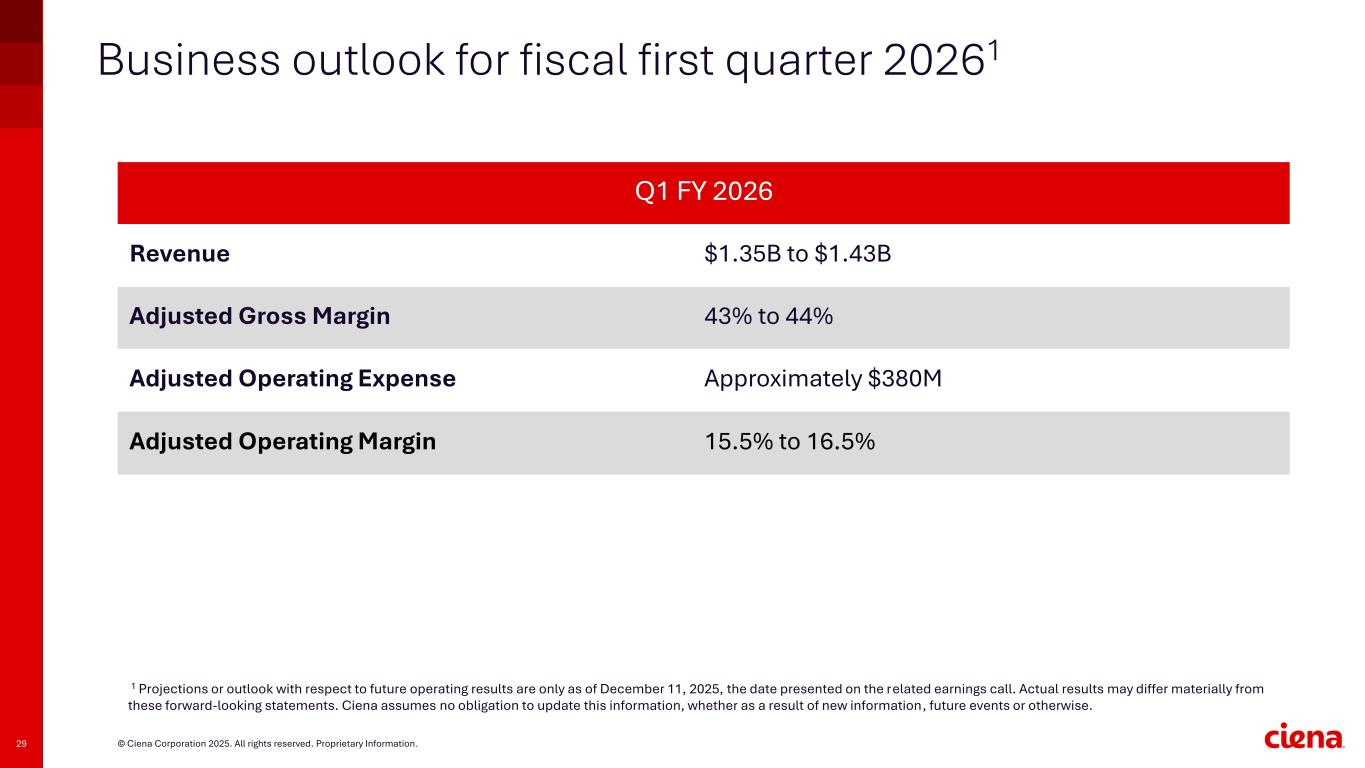
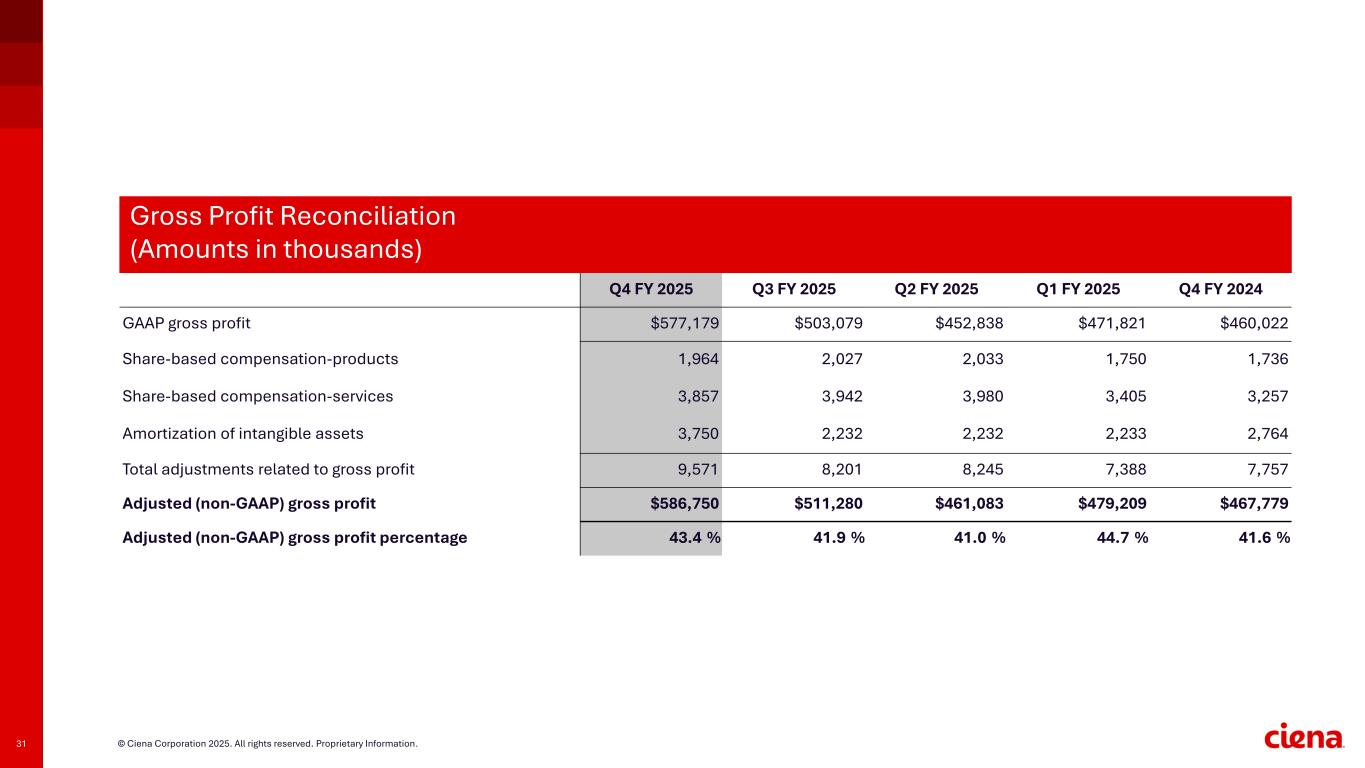
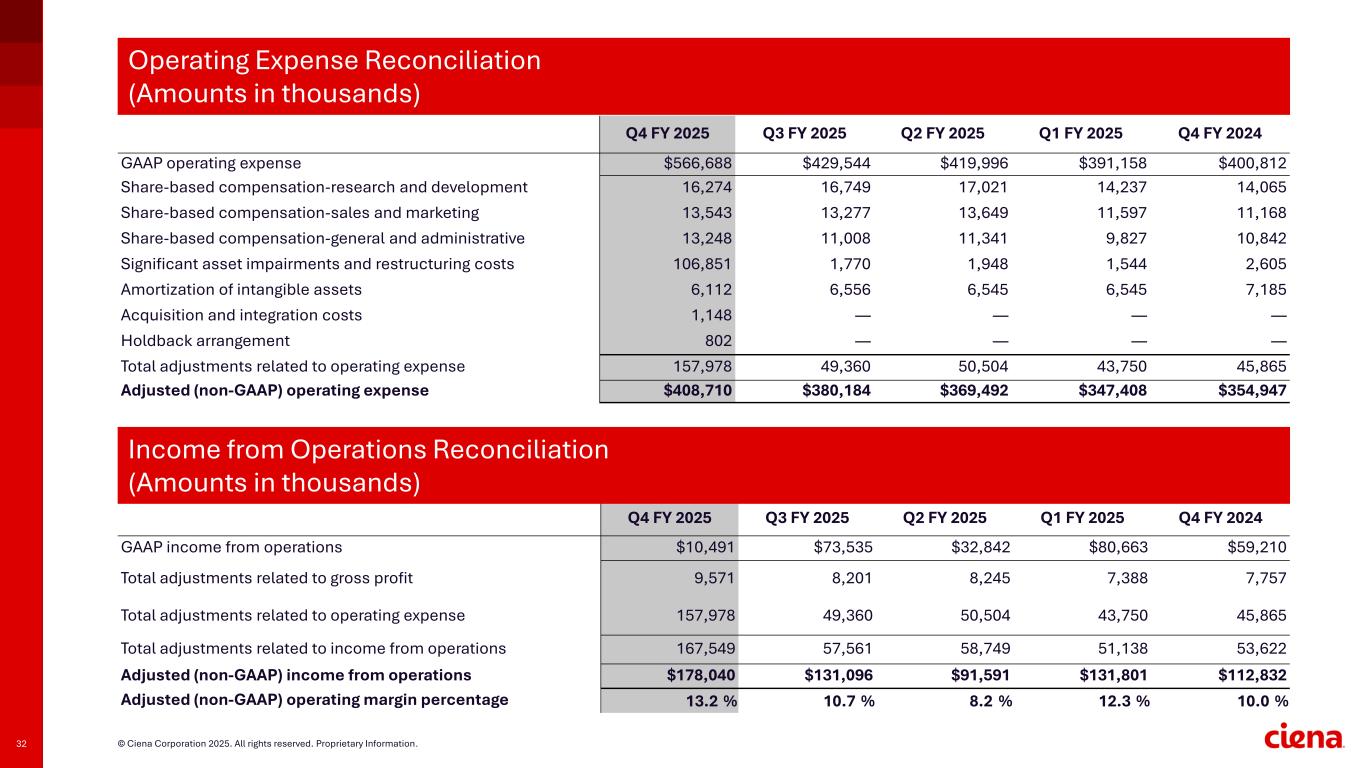
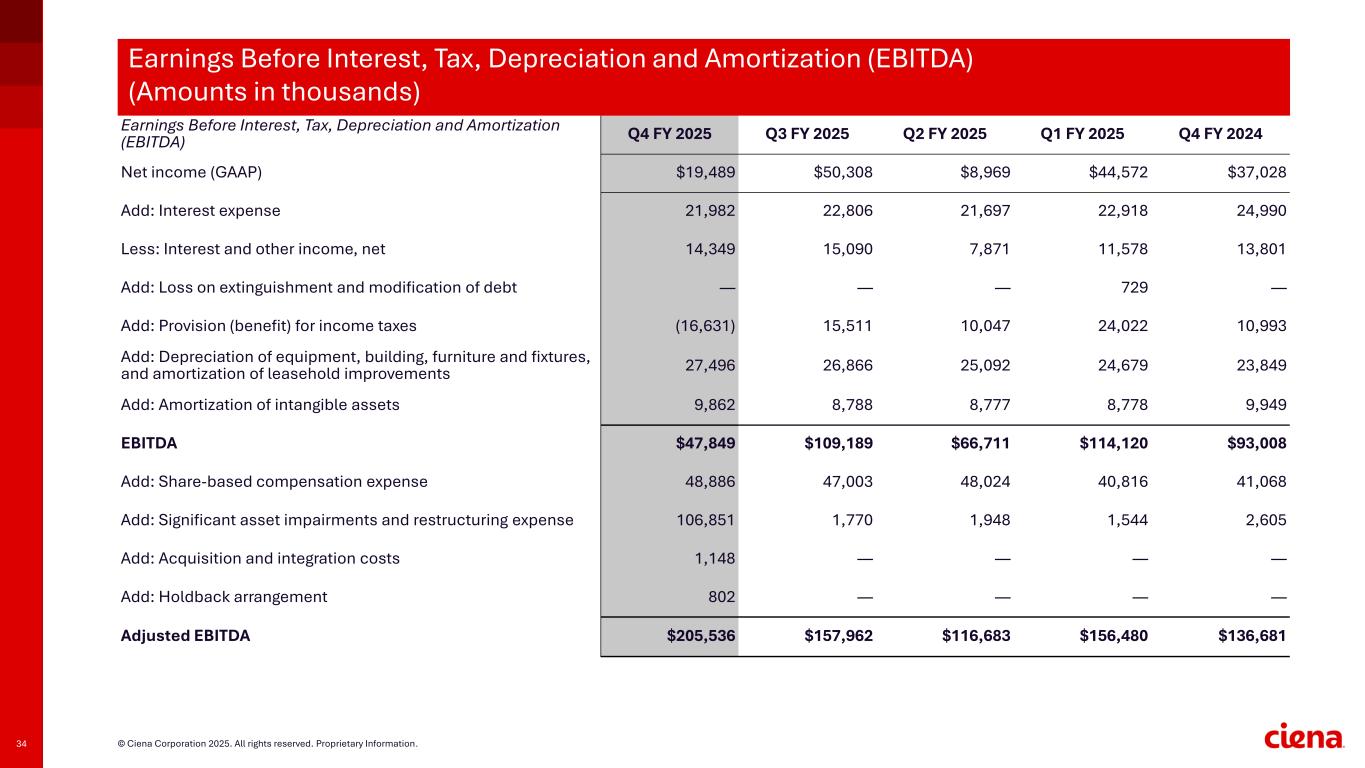
Thank you, Gary. and thank you to everyone for joining the call this morning. Before I review the specific results for Q4 and the full year, I'd like to provide an update on the priorities I outlined in the last earnings call, specifically gross margin performance, working capital management, and capital allocation. First, gross margin performance. You've seen that our Q4 gross margin sequentially improved and exceeded the amount of our guide by 90 basis points. This was largely due to higher revenue and software mix. We have had constructive discussions with our customers to improve fair value exchange, with those improvements appearing in late 26, given the large backlog entering the year. Additionally, we are navigating through particular headwinds from ramping NPI products and rising input costs as supply becomes further constrained due to fast-growing demand. All told, I expect year-over-year gross margin improvements, with second-half margins being higher than first-half margins. Second, working capital management. We have improved our cash conversion cycle by 34 days sequentially, largely on faster collections and improved inventory days. In fact, our inventory turns improved by four-tenths of a turn. We left the year with $1.4 billion in cash after generating $371 million in cash from operations in Q4 and free cash flow of $326 million. With respect to capital allocation, we completed the first year of our most recent $1 billion stock repurchase authorization, authorization, repurchasing approximately $330 million for the year at an average price of $83.34. We invested $140 million in capital expenditures in the business, focused on developing the next generation of leading products and enabling capacity to nearly double our 2025 growth We also completed the cash purchase of Nubis, supplementing our Interconnects portfolio, to service the in portion of in and around the data center opportunity. We have also reallocated resources that will allow the company to meet the growth challenges ahead with new business processes and technology rationalization. Finally, let me turn to operating leverage. We will hold to our commitment of flat OpEx in 2026 while investing in new opportunities for our InterConnect portfolio. Now, let me turn to the specifics of our Q4 and full-year performance. As Gary noted, Q4 revenue reached $1.35 billion, up 20% year-over-year, and $70 million above the midpoint of our guide. For the year, annual revenue was up 19% to $4.77 billion, a new record. Q4 was strong across all lines of business. Specifically, our optical business was up 19% year-over-year, driven by strength in RLS, which was up 72% year-over-year. Our routing and switching business grew 49% year-over-year, with the 3,000 and 5,000 series product revenue doubling on a combined basis, with the DCOM opportunity driving much of this growth. Global services had a strong quarter, growing 25% year-over-year, driven largely by advisory and enablement and installation and implementation services, which grew 53% and 45% year-over-year, respectively. I'd also like to note that Blue Planet had a very successful year, achieving $34 million of revenue in the quarter, a record $115 million in fiscal 25, and achieving full-year profitability. We had three 10% revenue customers in Q4, including two global cloud providers and one Tier 1 North American service provider. We are exiting the year with about $5 billion of backlog, of which approximately $3.8 billion is hardware and software, with the remaining being services. This backlog supports a large share of our fiscal 26 revenue expectations, and we see indications of strong demand continuing into 27 and beyond, giving us exceptional visibility and confidence in our outlook and medium-term expectations. Adjusted gross margin in Q4 was 43.4%, 90 basis points above the midpoint of our guide, driven by higher revenue and software mix. For the year, adjusted gross margin was 42.7%. We continue to mitigate most of the impacts of tariffs as we currently constructed, and the net impact of tariffs are immaterial to our bottom line. We continue to monitor the situation and work closely with both our supply chain and customers as necessary. Q4 adjusted operating expense was approximately $409 million and $1.51 billion for the year. Excluding the higher incentive compensation, we achieved inline OPEX for the quarter and underspent slightly for the year, reflecting our ongoing disciplined approach and operational efficiency. This led to Q4 adjusted operating margin of 13.2%, up 250 basis points sequentially and 320 basis points year-over-year. Operating margin for the year reached 11.2%, 150 basis points from Fiscal 24. We achieved EPS of $0.91, up 69% year-over-year, with annual adjusted EPS of $2.64, up a healthy 45%. Finally, cash from operations with $371 million in the quarter. For the year, free cash flow reached $665 million after $140 million in capital expenditures. Now turning to guidance. Last quarter, our confidence and visibility due to AI-driven dynamics enabled us to atypically provide an early outlook for 2026. As we move into the new fiscal year, for all the reasons Gary and I have discussed, those dynamics in the customer demand environment not only remain robust, they have accelerated. As a result, today I'd like to update that guidance from September as our outlook has improved even from just a few months ago. We now expect revenue in fiscal 26 to be approximately $5.7 to $6.1 billion, or nearly 24% annual growth at the midpoint, versus the 17% growth rate discussed in September. We continue to expect gross margins for fiscal 26 to be in the range of 43%, plus or minus a point. And as I mentioned earlier, we continue to work to mitigate input cost pressures through supply rebalancing, designing costs out, and additional pricing actions over time. We expect the impact of these mitigation efforts will be realized in late fiscal 26. With these dynamics, we expect the margins to improve first half to second half as cost reductions and pricing actions take hold. We expect adjusted operating expenses in fiscal 26 to be flat at approximately $1.52 billion after accounting for the Nubis operating expenses post-acquisition. With respect to operating margin, we previously advised an acceleration of our longer-term goal of 15% to 16% operating margin from 27% into 2026. We now expect fiscal 26 operating margins to improve further to 17% plus or minus a point. Our cap is $250 and $275 million. This is higher than our typical capital intensity in order to invest in supporting expected robust demand in late 2026 and into 2027, as well as incremental costs for 3 nanometer mask sets. In fiscal 26, we expect to repurchase approximately $330 million in shares under our 2024 stock repurchase authorization plan. Finally, with respect to Q1 guidance, we expect to deliver revenue in the range of $1.35 to $1.43 billion, adjusted gross margin between 43% and 44%, and adjusted operating expenses of approximately $380 million yielding an operating margin of 15.5% to 16.5%. To conclude, Siena had a strong 2025 and we are looking to an even stronger 2026. We are thoughtfully allocating our owner's capital to deliver value both to our customers and for our owners. We are singularly focused on executing our strategy and winning in the market. And with that, let me turn it back to Gary.
Thank you, Mark. And let me reiterate those comments. You know, we had an incredibly strong quarter in fiscal 2025, which we believe is a seminal one for Siena and one that provides a remarkable springboard for continued growth. Our momentum continues to build. Our balance sheet has never been stronger. And industry dynamics have never been more positive for Siena. We are executing well and have high confidence we will continue to do so. We remain very focused on our strategy and continue to deliver the world's best high-speed connectivity. That really underpins today's AI-driven environment. With that, we'll now take questions from the cell-side analysts. Thank you.
Operator
We will now begin the question and answer session. To ask a question, you may press star, then 1 on your telephone keypad. If you're using a speakerphone, please pick up your handset before pressing the keys. If at any time your question has been addressed and you would like to withdraw your question, please press star, then 2. Again, please limit yourself to one question and one follow-up. At this time, we will pause momentarily to assemble our roster. The first question comes from Ruben Roy with Stiefel. Please go ahead.
Thank you, and congratulations, Gary and Mark. Just great to see the progress here. So the first question, Mark, when we think about the guidance and the raise, Gary talked about some of the new use cases and more hyperscalers looking at either scale across or also discussions around DCOM with other hyperscalers. How much of that is in the new guidance versus just continued, you know, sort of growth across, you know, the existing relationships that you have? And then the second question for Gary is just thinking about the new scale across opportunities, Gary. You gave us some metrics around the first wins in terms of either revenue or bandwidth and bandwidth measured in petabits. Are the discussions that you're having in the wins with the new hyperscalers similar? or, you know, if you could maybe give us a little more detail on those, that would be great.
Yeah, hi, Ruben. This is Mark. Thanks for joining. In terms of how much of the new opportunities that Gary talked about are in the guide, they are all in the guide. You know, if you think about the in and around data center, which many of the wins that Gary talked about include, you know, We're seeing nearly a tripling of the percent of revenue from what we saw in 2025 of low single digits to, you know, to the percent of revenue that we have in 2026's guide of low double digits. And so, you know, I think we've captured a lot of that. Obviously, we're continuing to work to satisfy all that demand, but you've seen it's all included in there, short answer.
Ruben, to the second question around, you know, the sort of models around the across piece, you know, first of all, I'd say, you know, they're obviously all of these hyperscalers are not sort of homogeneous around their business models and therefore their, you know, their network requirements reflect that. So they are different, notwithstanding they all need to train. So what we're seeing with the initial hyperscaler is obviously just expanding the amount of sites, and that will happen, you know, over multiple years. You know, we've had two other hyperscalers now adopt our architecture, so we've got three out of the four hyperscalers have selected us for their scale across training models. In terms of, you know, quantifying how much they are, They're clearly hundreds of millions each, but they are different in terms of their scale at this stage. But really, we're just beginning to see the traffic come out of the data center for training around these regional backbones or clusters. We're just beginning to see that. And I don't think there's going to be a cookie-style sort of quantification of the traffic at this point.
Yep, makes sense. Thanks, Gary.
Operator
The next question comes from Simon Leopold with Raymond James. Please go ahead.
Great. Thanks for taking the question. Yeah, I wanted to maybe expand a bit on the scale across Outlook in particular. So you've gotten these two additionals that's certainly earlier than we were expecting. I want to see if you can give us maybe a timeline of when you would expect those two other hyperscalers to really kick into the numbers, how imminent that is. And then maybe you could talk about sort of a longer-term cadence of scale across activity because I think when you first disclosed it, you talked about the initial customer perhaps having opportunities of, you know, eight or nine kind of projects. So now that we see additional hyperscalers entering the fray, how would you look at it more broadly over the multi-year number of projects? That's question number one. Question number two is hopefully the easiest one you'll get today, but if you could just break up the 10% disclosures you said to cloud and an operator, if you can give us the detail that will ultimately be in your SEC filings. But if we could break that down, I'd appreciate it.
Simon, let me take the first part of that. You know, in summary, I would expect us to take revenue for all three of these hyperscalers in 26, or begin to take revenue in 26. I think the large part of this, you know, is going to be scaling up in 27 and through 28. These are enormous amounts of scale and commitments around massive amounts of fiber between these data centers, which takes time from an infrastructure point of view. I believe we'll take revenue on all three during the course of this year. I really see the ramp on this as we get to 27 and through 28. This is going to be the backbone for these training models. I would also say at this stage, it is all U.S.-centric around the training models as well.
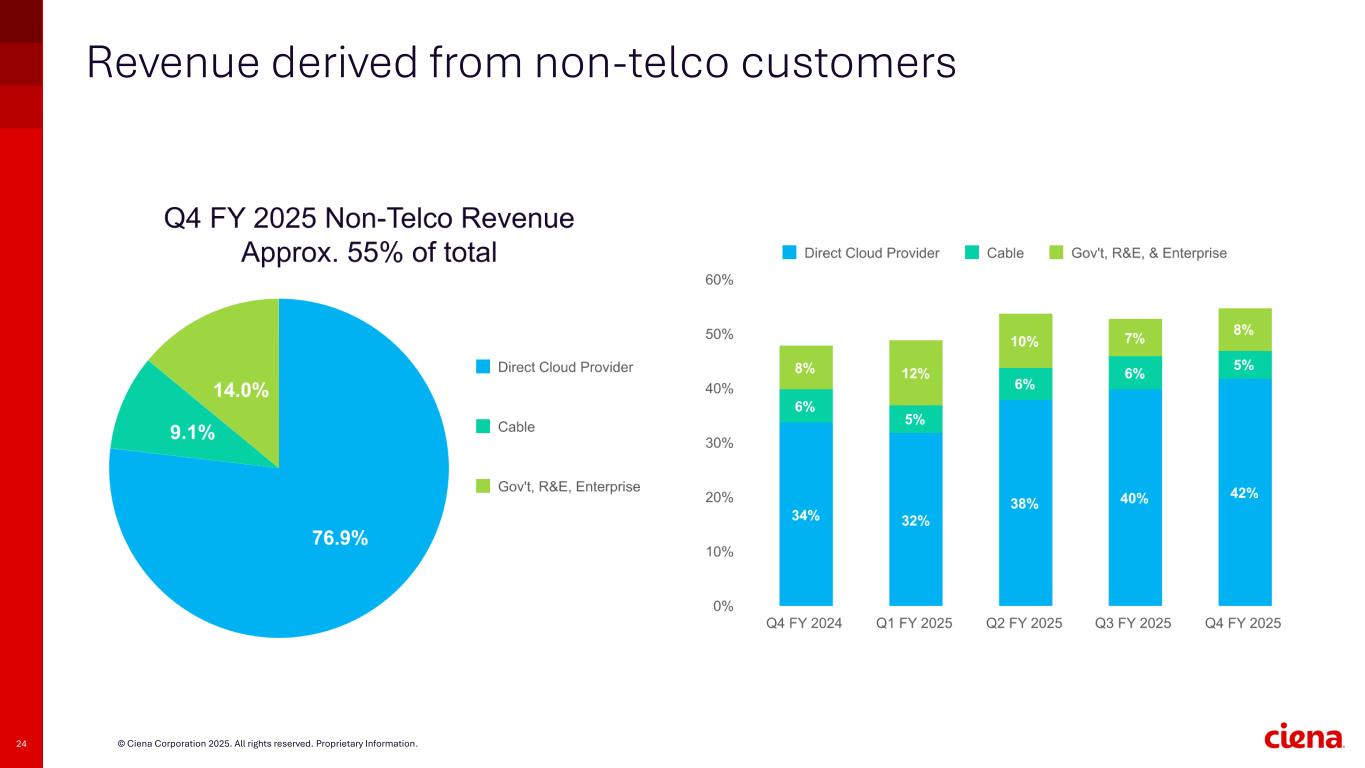
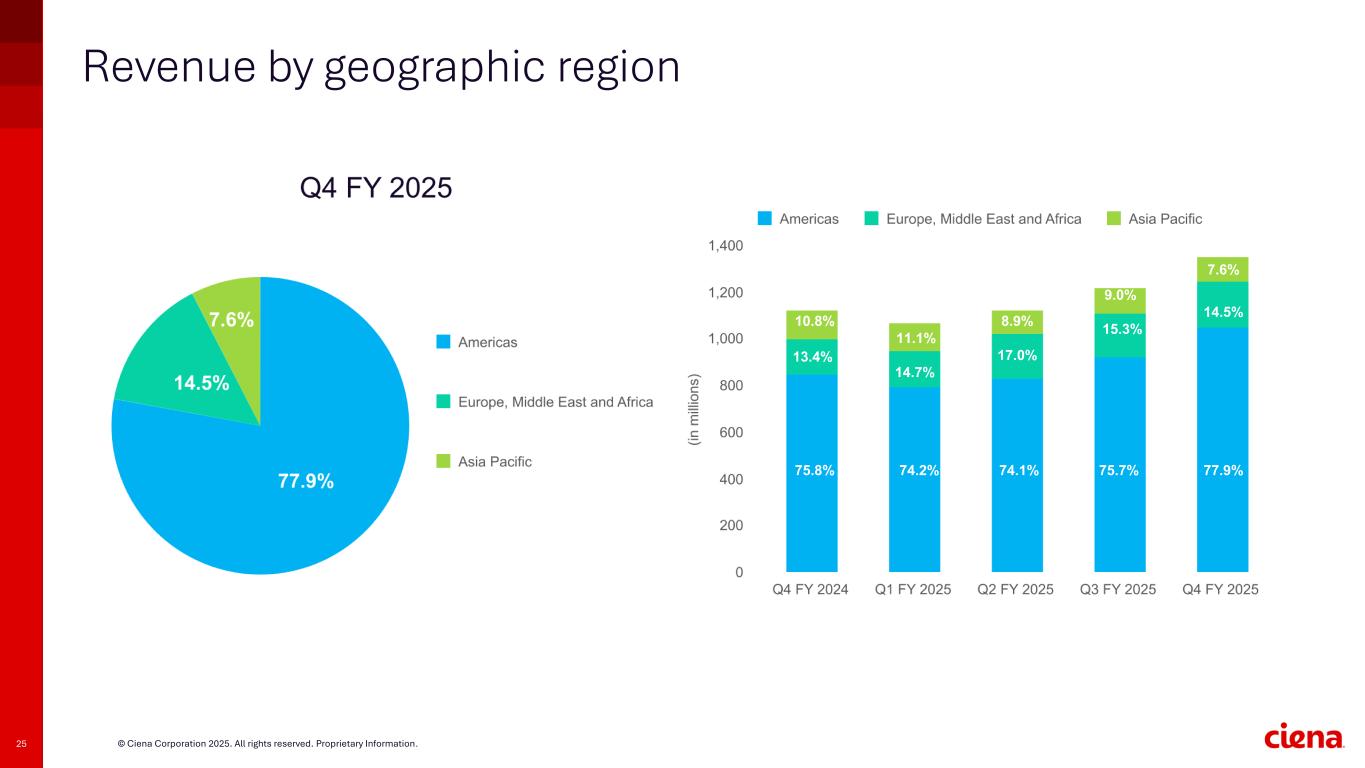
Yeah, so Simon, let me hit your second question. The three plus 10% customers that we had in Q4, one was AT&T. You'll see that in the cave. The other two were not being specific on who they were. but collectively for Q4, those three covered just under 44% of Q4's revenue. And then for the full year, it was one cloud provider and one service provider that collectively, and it was AT&T as the service provider, collectively for the year, they covered about 28% of our revenue.
Yeah, can you give us that split, so what each one was within that 44% in the quarter?
Yeah, I'll have to get back to you, Simon. I don't have that specific in front of me. Thank you.
Operator
The next question comes from Atif Malik with Citi. Please go ahead.
Hi, thank you for taking my questions, and great job by the team. First one for Gary. Gary, on Nubis, in September you talked about in the second half of 26 and early 27 adoption adoption for CPO, NPO-type products. Are you seeing an acceleration over there?
I would say that, yeah, we're engaged with multiple opportunities with them. Obviously, we're waiting for first GA product, but we have a lot of market engagement, you know, even prior to our acquisition with them. I would say, you know, what we've seen since, you know, and this is early days, we only did the acquisition last quarter, But, you know, I think we've seen sort of accelerated interest now that, you know, they're part of, you know, a broader company. Scott, do you want to?
Just to remind you, there's sort of at a high level two product families within this portfolio. One is a linear retimer that is very effective in terms of extending the life of active copper cable. and we see that as an opportunity that we'll start in 26. The optical part of the portfolio, the second part of the portfolio, we see more as a 27 and beyond opportunity. But as Gary said, we're getting great feedback from customers on a bunch of different dimensions. First of all, the sort of open ecosystem approach to CPO. Secondly, just the caliber of the team. And then I'd say more an internal reaction. And we, you know, one of the big things, one of the big filters as we looked at this company was, did we think they were a good cultural fit? And I'd say 90 days in, we're absolutely thrilled with that.
Great. And as my follow-up, Mark, a nice debut on gross margins and keeping OPEX discipline. You have talked about advantages from bringing lasers in-house. Wondering what else is driving sustainable outlook for operating margins of 17%.
Yeah, so there's a couple of things that I would say. You know, the first is one of the big things that we're working on in the first half of the year is ramping our 800-gig pluggables. And so as we ramp that, you know, you basically get yield economics, which will lower the unit costs over time. And we expect that, you know, as we go through Q2, Q3, Q4, we'll see significantly lower costs than we're seeing at the beginning of the year. So that would be the first aspect that I would say. The second aspect is, you know, the conversations that we've had with a lot of our customers have yielded, you know, good results. And so once we get through the backlog that we're entering the year with, a lot of those new orders will start to see the benefits of those pricing discussions. And so we would exit, you know, the year at a higher exit rate than we feel that we'll see in the first half of the year. Thank you.
Operator
The next question comes from George Notter with Wolf Research. Please go ahead.
Thanks very much. It seems like there's just obviously tons and tons of demand here. Could you give us more on what you're doing on the supply side of things? Just curious, like, what do you see as the supply constraints in the business? Is it, you know, is it fabbing chips? Is it contract manufacturing? Like, anything you can tell us on, you know, what those bottlenecks are. what you're doing to open those up would be great. Thanks a lot.
Yeah. Hey, George, it's Mark. I'll start and then hand it over to Gary and Scott for more color. So a couple of things. You heard me talk about, you know, a pretty nice increase in our capex year on year. And within that, there's about a 50% increase in what we're doing to ensure that we can have more capacity to support what will really be end of year and into 2027 demand. But what we're seeing is really a constraint on the photonics parts, right? And I would say optical parts in general. And we've worked really closely with our key suppliers, and I know you know who those are, to make sure that we can secure supply. And the investments that we've made in 2025 actually yielded a doubling of the growth rate from what we expected a year ago, right? And so between that, the level of vertical integration that we've got in just what we control, as well as the investments that we're making in 2027, we're trying to support as much of that revenue as we possibly can through, you know, 26 and into 27.
Mark, I'd add to that in terms of the constraints you talked about in terms of the industry optical component subsegment, I feel like. An advantage that we have, there's a couple of advantages that we have, I think, relative to other peers. Number one is we have a very tight relationship with the cloud providers. We have the market share leadership there and a great set of relationships. So even though the demand outstripped what everybody expected, I think we had the earliest view of that in the industry, and therefore our conversations with those industry components probably started earlier than everybody else. So that gave us a benefit. The other thing is, as we've talked about in the past, and we're more vertically integrated than anybody else, so to some degree we do have a little bit more control of our own destiny. And part of the reason why in the last 90 days we've been able to take 2026 out is the activity that we did in 25 that allowed us to double our growth perspective in 25 is carrying over into 26. So we're getting more confident in our ability to deliver to that demand as well.
Got it. And then one last one. What are lead times right now? Any sense for kind of what blended or average lead times would look like for you guys?
This is Gary. It really varies by specific product areas. I mean, they're all generally, you know, in the optical infrastructure base, so sort of think scale across RLS, they have extended out, but it depends on the product grouping. You know, what we're working on within, as Mark and Scott said, you know, we're confident, you look at the midpoint of our guide, you know which is what 24% growth for this year so that's the work as Scott said we did we did kind of last year to increase capacity and component supply we're now working on towards the end of 26 and 27 and making sure that we're you know we're in a good position from that point of view so hopefully by the time we get to you know the end of the year we get to 27 you know lead times can come down a little. But, you know, we're seeing increase in demand, including order flows in Q1 being strong as well.
Thank you. Thanks, George.
Operator
The next question comes from Tal Liani with Bank of America. Please go ahead.
Hi. I have three questions. The first one is historical perspective. You guided before to 8% growth, and you increased it multiple times, and now you're guiding for 30% growth for next quarter. That's a massive change. So, you didn't have good visibility before for the growth, and the question I'm asking myself is, do you have now good visibility going forward? So, can you take us through the historical perspective, meaning what happened over the last four or five quarters that drove up the growth so much better than expectations. And you spoke a little bit about customer concentration, but what happened that enabled this kind of growth? Maybe I'll stop here, and then I'll ask my other questions after, because they're more on the margin side.
Hey, Tal, it's Mark. I'll start, and Gary can add in here. I think there's really a couple of dynamics that's going on. One is the close proximity that we have with, you know, our hyperscaler customers has really allowed us to get insight into what their demands are and how we plan for those demands. And they followed that demand up with pretty significant orders, right? So, I mean, you heard Gary talk about, you know, we achieved $7.8 billion of orders, you know, over 2025. as we look at what we're seeing in Q1, we're essentially sold out, right? If we had more supply, we'd be able to sell more. And so we've got really good visibility of what, you know, the next several quarters look like just because we've got those orders in place. And then, you know, the last thing I'll say before Gary can chime in is through 2025, I think our supply chain team has done quite a good job of squeezing every drop of blood from the stone that they can to drive that revenue. We invested in 2025. We're increasing that investment by about 50% through 2026. And we're seeing those annualization layers kind of help us drive higher revenue that, you know, for the year we expect a midpoint growth of 24%. I don't know, Gary, if you have...
I would say sort of zooming out from this is sort of big picture. I think, you know, everything Mark said there, you know, I think we've done a good job operationally of scaling it up quickly. I would say that, you know, what's behind that really with the cloud guys just in general is that I think early in the year there, you know, at the beginning of 25, as we began to get through it, was a realization that their networks needed to be scaled massively. And if you think about the sort of hierarchy of flow around long poles in the tent and focus areas, obviously there's been tremendous focus in the context of AI infrastructure around, you know, GPUs, TPUs, and getting access and scaling those up, power within in the data centers, et cetera, I think you began to then see, you know, oh, the network. And that coincided with, you know, the need for backbone networks to train across multiple data centers and the increase they were seeing in inference traffic. You know, obviously this is uncharted territory from a, you know, a forecasting of a network perspective. perspective but i think they're now coming up to speed very quickly that you know it's now about the network as the gating item and i think there was a real realization of that in the first part of of 25 and you're seeing that play through now so that's the sort of context that i would offer
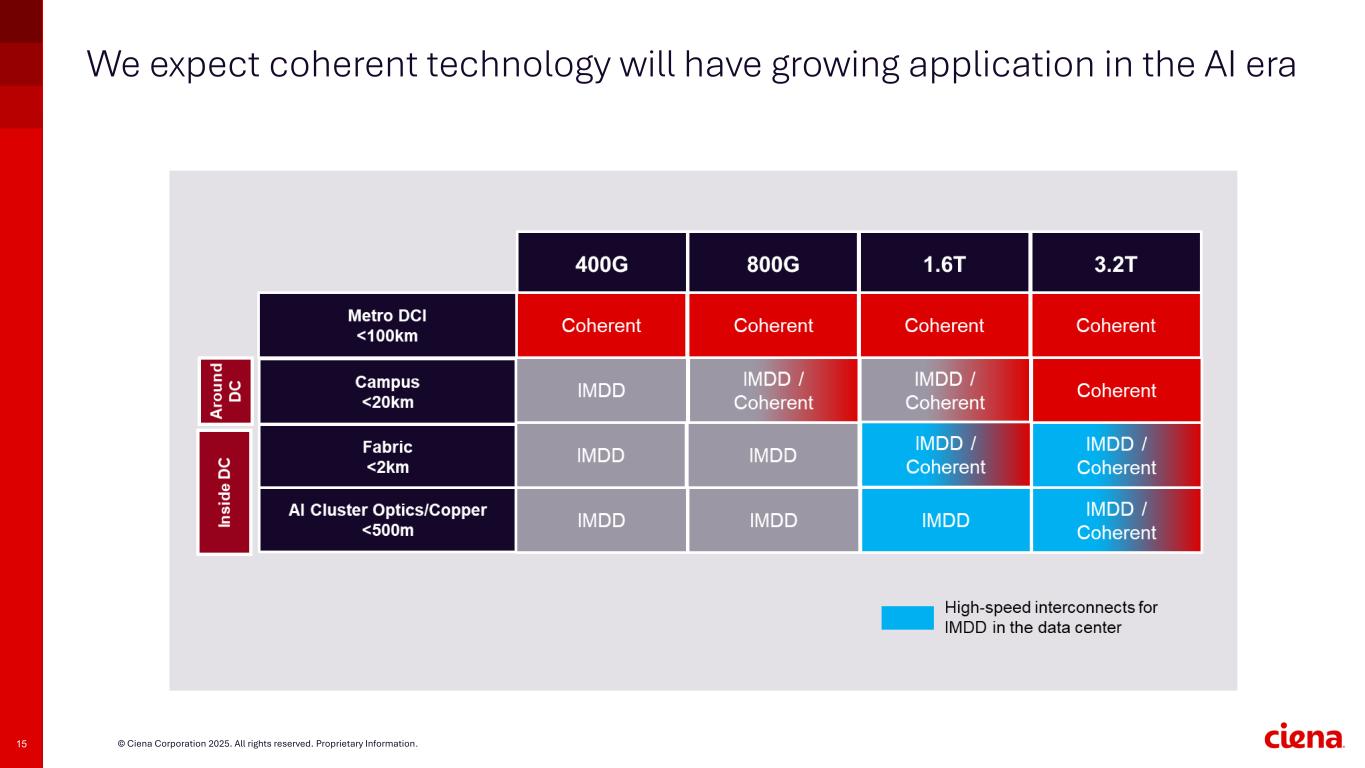
on that and tal within that if you go back you know a year or 18 months we we talked quite a bit about our belief system of optics and particularly coherent optics having a bigger and bigger role to play in the network inside and around the data center. And what we weren't sure of, though, and we were overt about this, what we weren't sure of is the timing of when you see that inflection point. What's happened in that period is with the scale across network is you're seeing that inflection point. So, you know, new use cases for current optical high-speed connectivity.
Got it. My second question is on margins. In previous cycles, your margins shot up all the way to even 49%, even over 50 if we go back a few years. And cycles always had a direct impact on gross margin. Like, you always had a cycle and margin as well. This time, because it's coming in pluggables, because it's coming in cloud, your margins are 43, you're guiding to 43, 43 and a half. And the question is, is there a chance that the margin will also have, a gross margin will also have a cycle with revenues, or what needs to happen for the gross margin to have a similar cycle to revenues?
Yeah, I think how I would respond, Tal, is there's a couple of headwinds that we're seeing, at least in the near term. And I've talked about the 800 gigs. So we're in an NPI phase of that product, so that's creating some headwinds that we expect to kind of normalize out through the end of the year. The other piece is I think the customers are starting to see the value in what we're providing, both in space savings and power savings, and we're getting some benefit from that relative to the value that we're delivering. So I think between those two things, we're seeing that. And my sense is that that's going to be more sustainable than the cyclicality that we've seen in the past, because we're really starting to talk about a foundation level of benefit that our customers are seeing. And, you know, as Gary said, they're realizing that they've under-invested in the network, both on the cloud provider side and the service providers are catching up as well. And so I think we're going to see steady improvement to what we've described previously as our aspiration to get back to the mid-40s, which at this point we kind of view as a waypoint, not the endgame. So I think we're on a steady track. you'll see sequential improvement. We'll exit the year better than we will perform in the first half of the year, but I'm pretty confident that we're going to see ongoing multi-year gross margin expansion.
Operator
Thanks, Carl. Thank you. The next question comes from Samik Chatterjee with J.P. Morgan. Please go ahead.
Thanks for taking my questions. Maybe for the first one, I had a question on scale across, and Gary, you mentioned the additional engagements with hyperscalers, are you seeing any engagements yet from the neoclouds on that front, or would you expect most of that neocloud demand for scale across to come through the hyperscalers itself? And can you help us think about margin implications for scale across relative to, like, there's a heavy mix of fine systems as well as capacity, so how should we think about margin implications of scale across ramping here relative to your corporate average? And I have a quick follow-up. Thank you. Yeah, I think
largely at this stage the training at scale across AI backbones is largely a purview of the large hyperscalers and I think the neoscalers, you know, there's a couple of them that are using the back, you know, they're on the back of that for want of a better description. So I think this is largely right now given the scale of it with the hyperscalers and you know, I don't see that you know, I think it's going to take a while for that to bleed through into into the neoscalers. In terms of the deployment there, you know, as Mark said, you know, it's going to be this combination of next generation line systems, you know, RLS, which is also, you know, fairly recent into market and also with the 800 gig plugs as well. So yes, in the early stages, that's a sort of headwind from a margin point of view, which is why we're kind of guiding as we are. But as that get, you know, as those platforms get more into volume, the yields improve, and we get through that MPI phrase on both of those, then we'd have better margins as we exit the year. And, of course, you've also got the benefits of just scale and volume as well.
And just for my follow-up, I mean, clearly, F526 is your guide is largely covered by the When you look at now sort of the long-term guide that you had provided of 8% to 11% growth, like what level of visibility are you getting from your customers about fiscal 27? Are they sort of giving you more detailed plans for the out year just so that you can plan out capacity? And does that sort of imply that your growth rate sort of stays above this 8% to 11% level in sort of the out year as well?
Yeah, hey, Samik, it's Mark. A couple of things. One is, you know, when we talked about the longer-term guides last quarter, we kind of took those off the table just because, you know, in the medium term, we're not very good at calling, you know, calling the growth rates on the upside, right? So that 8% to 11% I think is off the table. We're not really talking to 2027 at this point, but I would say overall, maybe qualitatively, we feel very strong going into 26. We think a lot of that momentum continues into 2027, And the proof point there is really the increase that we've seen in our CapEx for capacity, which is up 50% year on year.
You know, I think the other thing you could obviously extrapolate out, we're not sort of guiding into 27 right now. We're just starting 26. But, you know, clearly the dynamics have changed here. And that's why I said this is a sort of 25 was a seminal year for us in this regard. I mean, I think you're seeing multiple scale across wins that will run. They are, by their very nature, they're going to be multi-year. So that gives us confidence in 27 and 28. The other thing I would say is that's really all the context of, you know, our optical WAN-type business in and around the data center to it. We're making tremendous amounts of investments and progress on the other dimensions there, you know, sort of inside and around the data center, which are completely new markets for Siena. And the revenues to those are largely, you know, we're taking some now, we're making good progress, largely 27 and 28 plays, and specifically coherent inside the data center. You know, that's all additional revenue to us in addition to all the things we've talked about right now. So that gives us confidence in the multi-year dimension to this.
Go ahead. Great. Thank you. Thanks for taking my question.
Operator
The next question comes from Tim Long with Barclays. Please go ahead.
Thank you. Two questions for me as well. First, Gary, following on what you were just talking about, could you maybe talk a little bit about DSOM and DCOM and see if you can somewhat scale that for us? And, you know, good news that it's expanded with Meta and being tested at others. Could this be a type of technology that would really, you know, accelerate that move inside the data center as it gives you kind of a beachfront? And then second, on the telco side, I get the MoF and BART and 5G currently, but tends to be a little bit more cyclical than probably what you're going to see from hyperscalers. How do you look about sustainability of that business, you know, over the next few years on the telco-specific side.
Yeah, on the decom part of that, you know, obviously that was co-created specifically with Meta over a period of time. And I think what we're seeing with that is the expansion of the opportunity within their data center piece to that. It saves power and space for them, which is, you know, absolutely critical. and, you know, we've seen an expansion even in 26. And you're talking hundreds of millions of dollars of this. And as they refresh and build out new data centers, that's become part of their adopted architecture. So, you know, I think this, again, is going to be a multi-year opportunity within Meta. You know, and I also think about, you know, these large hyperscalers, really, when you think now about the diversity of portfolio that we're dealing with them, they're really markets in their own right, given their size and scale. We're also, as you said, engaged deeply with two to three other hyperscalers around this kind of architecture. And I would expect to see wins during the course of the year and adoptions for additional cloud players for DCOM. So, and it gives us, you know, a entree point into the data center together with Nubis, together with the scale across, because that is actually, even the scale across is actually installed inside the data center. So you put all those things together and we're definitely under the tent here. And that's before, you know, the Nubis, which will start to deliver product, you know, in 26, and before the opportunity with Coherent inside the data center. To your point on the telco piece, I think they've kind of been underinvested in transport, frankly, for the last five years, ever since COVID began. They didn't want to mess with their networks during COVID. Then you had the supply chain whiplash, and then you had this massive investment they all had to make in 5G, which largely has not yielded the financial returns that they'd anticipated. Now you're seeing, I think, a multi-year investment back into transport. They are largely under-invested in their networks, and I think whilst that's not at the rapid scale and growth rate of the clouds, I think it's nice, steady, you know, mid-digit kind of single-digit growth within the telco space, and I think that's quite sustainable. What is amplifying that, though, is the AI traffic for things like MoFan. And, you know, you saw last year hundreds of millions of dollars of our telco business was, in fact, MoFan, specifically for hyperscalers. And you saw it, you know, typically we'd seen it internationally. We're also seeing it now in North America ramp up as well. so you know you put those two things together and I think that gives us confidence around that telco which is half of our business currently you know having nice sustained growth rates albeit lower than the cloud players thank you very much
thank you we'll take one more question please
Operator
thank you sir and that question will come from Ryan Kuntz with Needham please go
Super. Thanks for the question. You know, Gary, maybe you can take a step back and regarding your great growth you're seeing here in the cloud segment, how has your approach over, say, the last 12 months, obviously a lot around scale across and RLS and sub-C player. Can you give us any kind of perspective there?
Yeah, I would say it's sort of, you know, we're laying more tracks at massive scale because that's, you know, than we would normally see. You're specifically seeing that with scale across, you know, because they're laying the tracks down first. So, you know, much higher proportion of line systems would be, you know, the initial take on that. Now that will then move to plugs. We're seeing, you know, obviously a very large ramp up in our 800 gig plugs, which we think will be, you know, largely adopted amongst most of the hyperscalers. And that is a different mix than we've, you know, than we've seen traditionally. And, you know, more intelligence on the line systems than also you've seen traditionally. Because given the massive scale that they're going to need to put in with multiple fibers across it, then, you know, you're going to need to increase the intelligence and the scalability of the line systems. I'll pull that with DCOM, which, you know, frankly, you know, was as fast, very quickly emerged as a portfolio offering. You know, that was not projected into the 26 plan, you know, when we did that in our three-year planning piece. So the mix has changed quite a lot around that architecture.
Really helpful. And just a quick follow-up, if I could. Just around, you know, growth limiters outside of your control as a river supply, permitting, labor, and, you know, really putting these lanes in the ground, you know, constraints.
You know, I think a large, you know, the relationship with the fiber providers, people at Corning, et cetera, is very tight amongst the cloud players. and the service provider, you know, particularly the wholesalers, people like Lumen, you know, who publicly talked about that. So I think, you know, there's a lot of commitment to scale capacity. So, you know, we're seeing that, you know, we are seeing that happen. The other thing I would say is it's a real opportunity for us because we have the largest optical support and services organization in the world. and we are increasingly engaged with the deployment of these. In fact, our largest service customer last year was a cloud provider for the first time and we're now providing multiple services across the hyperscalers and we see that as an area of tremendous growth to help, to your point, facilitate the delivery of this infrastructure.
Thanks, Ryan, and thanks everyone for joining us today. We look forward to catching up with folks today and over the next week or so. Happy Holidays and Happy New Year to all.
Operator
The conference has now concluded. Thank you for attending today's presentation. You may now disconnect.