Operator
Good day and welcome to Siena's Fiscal First Quarter 2026 Financial Results Conference Call. All participants will be in listen-only mode. Should you need assistance, please signal a conference specialist by pressing the star key followed by zero. After today's presentation, there will be an opportunity to ask questions. To ask a question, you may press star then one on a touch-tone phone. To withdraw your question, please press star and then two. Please note this event is being recorded. I would now like to turn the conference over to Greg Lance, Vice President of Investor Relations.
Good morning, and welcome to Siena's 2026 Fiscal First Quarter Conference Call. On the call today is Gary Smith, President and CEO, and Mark Graff, CFO. Scott McFeely, Executive Advisor, is also with us for Q&A. In addition to this call and the press release, we've posted to the Investor section of our website an accompanying investor presentation that reflects this discussion as well as certain highlighted items from the quarter. Our comments today speak to our recent performance, our view on current market dynamics and drivers of our business, as well as a discussion of our financial outlook. Today's discussion includes certain adjusted or non-GAAP measures of Siena's results of operations. A reconciliation of these non-GAAP measures to our GAAP results is included in today's press release. Before turning the call over to Gary, I'll remind you that during this call, we'll be making certain follow-up statements. Such statements, including our quarterly and annual guidance, commentary and market dynamics, and the discussion of our opportunities and strategy are based on current expectations, forecasts, and assumptions regarding the company and its markets, which include risks and uncertainties that could cause actual results to differ materially from the statements discussed today. Assumptions relating to our outlook, whether mentioned on this call or included in the investor presentation that we posted earlier today, are an important part of such forward-looking statements, and we encourage you to consider them. Our forward-looking statements should also be viewed in the context of the risk factors detailed in our most recent 10-K and our forthcoming 10-2. Siena assumes no obligation to update the information discussed in this conference call, whether as a result of new information, future events, or otherwise. As always, we'll allow for as much Q&A as possible today, though we ask that you limit yourselves to one question and one follow-up. With that, I'll turn the call over to Gary.
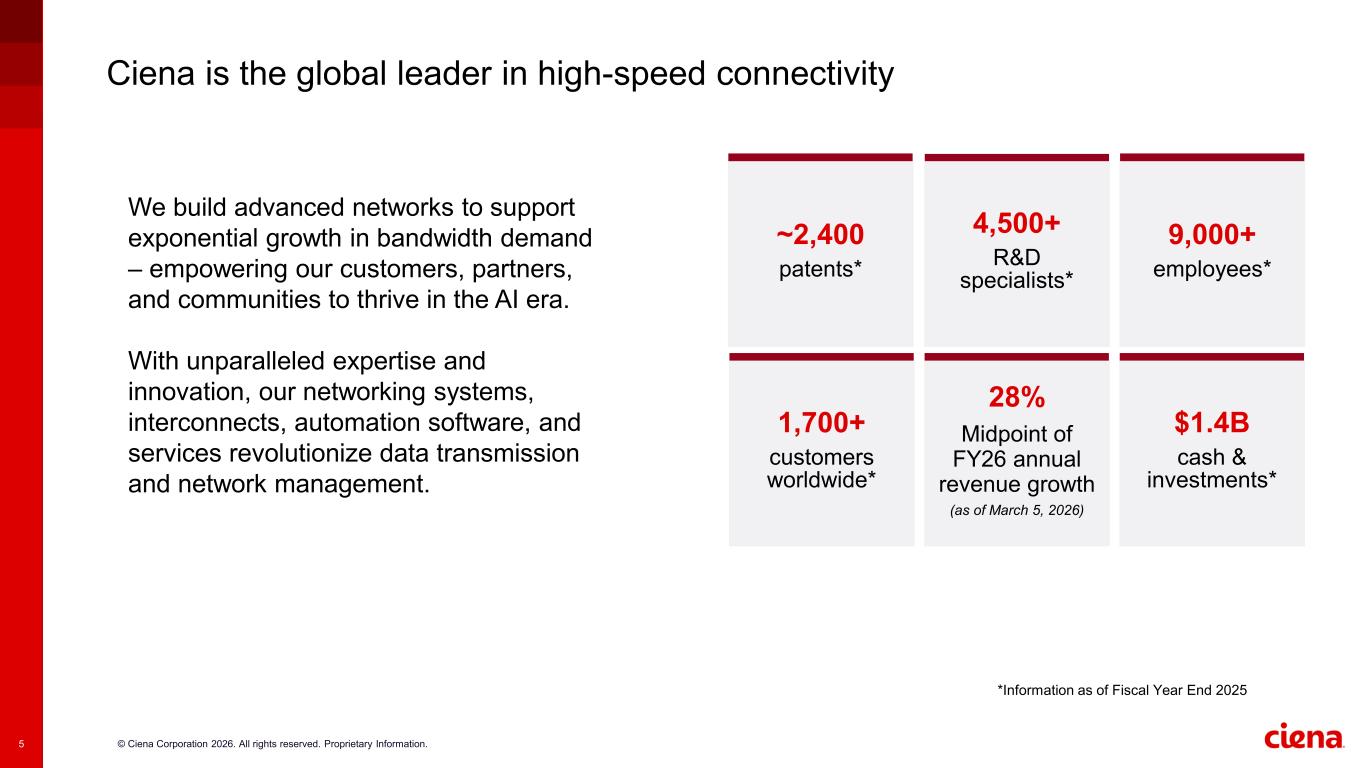
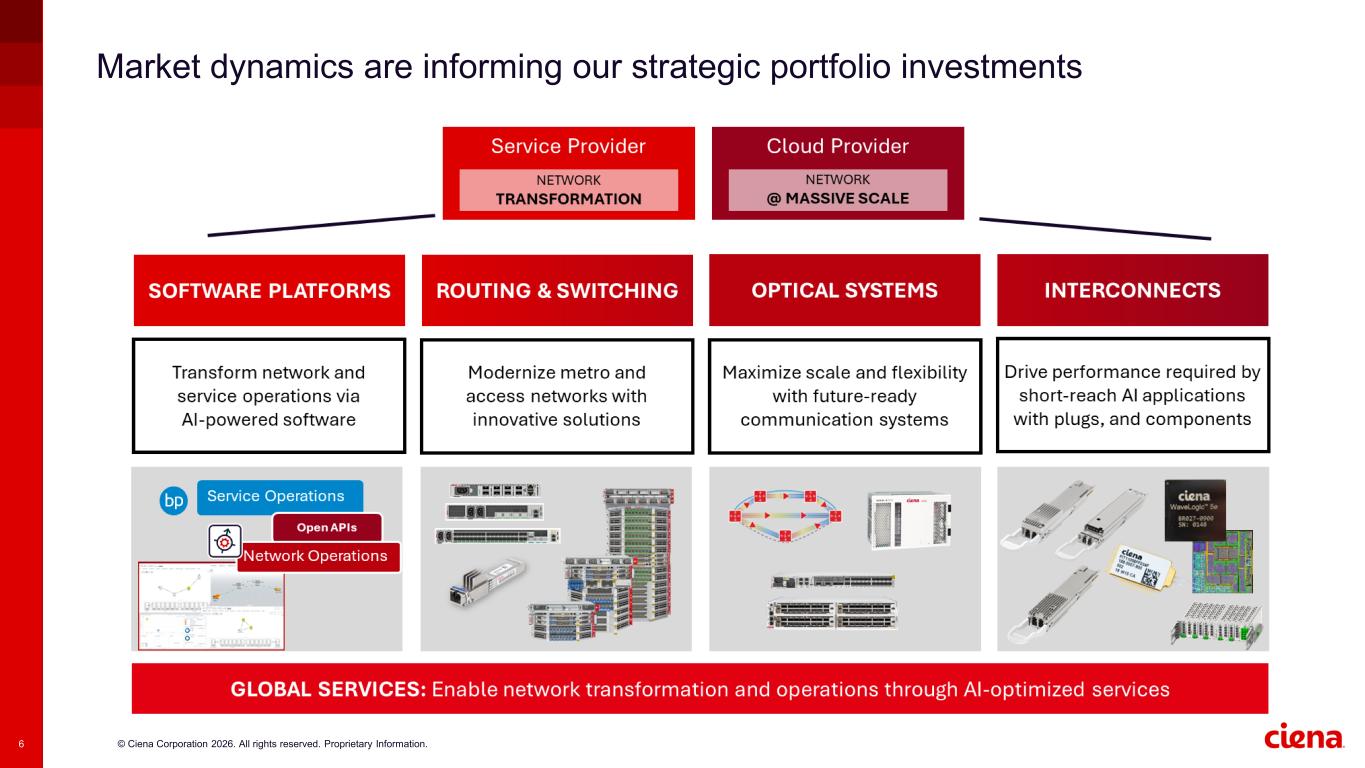
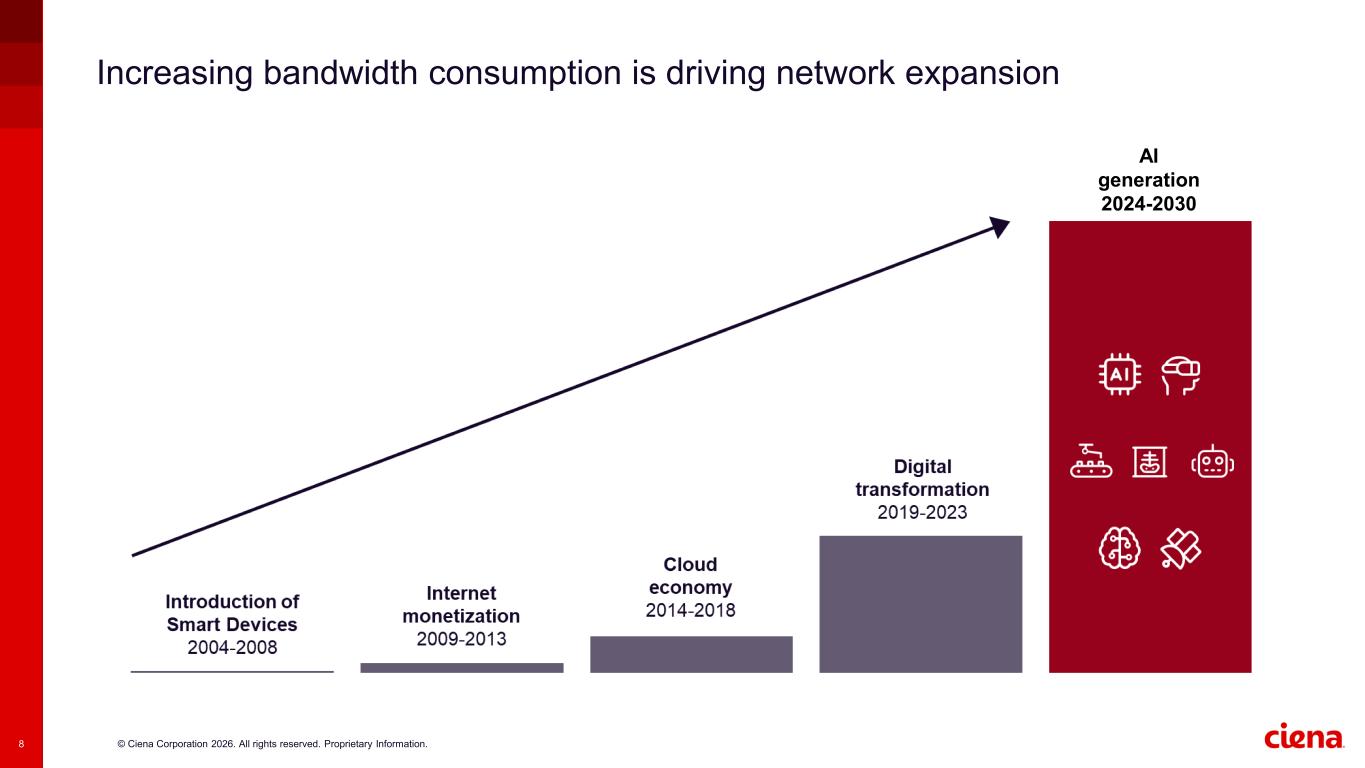
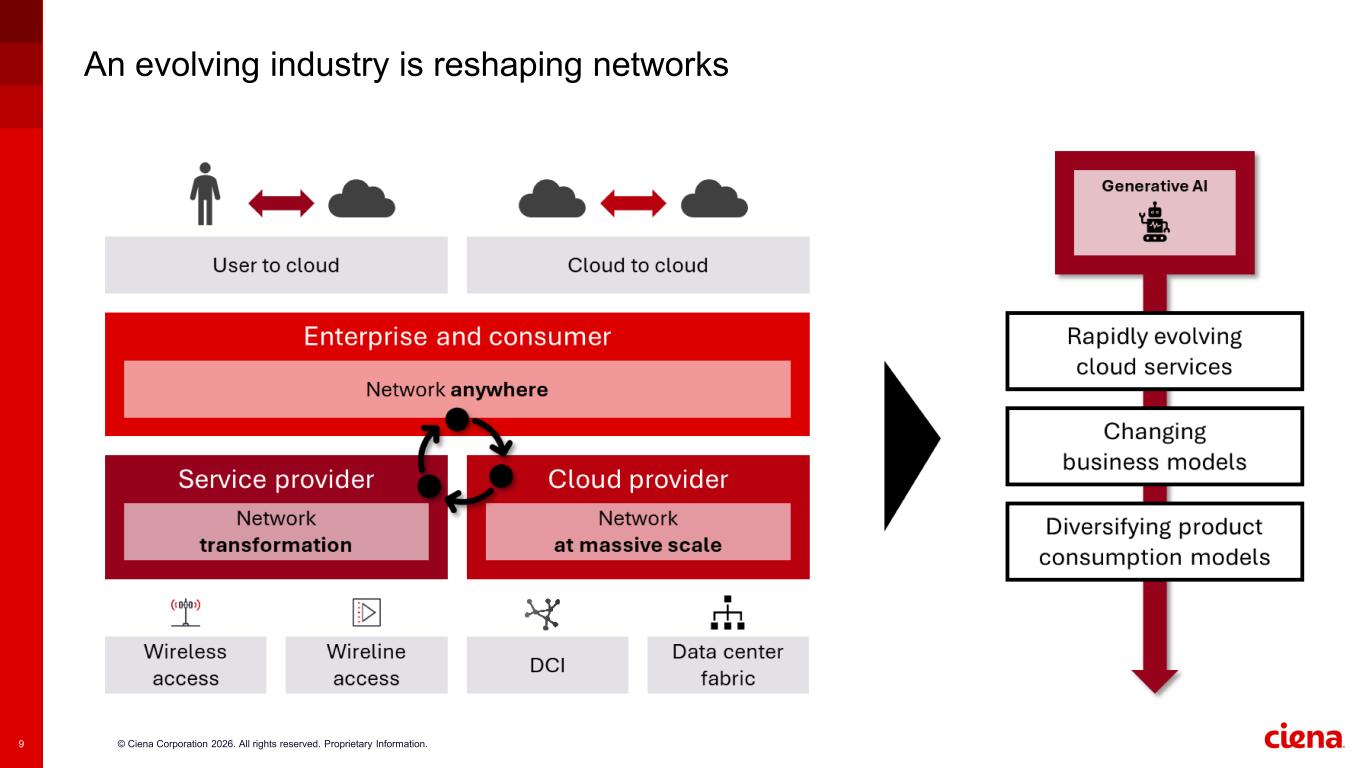
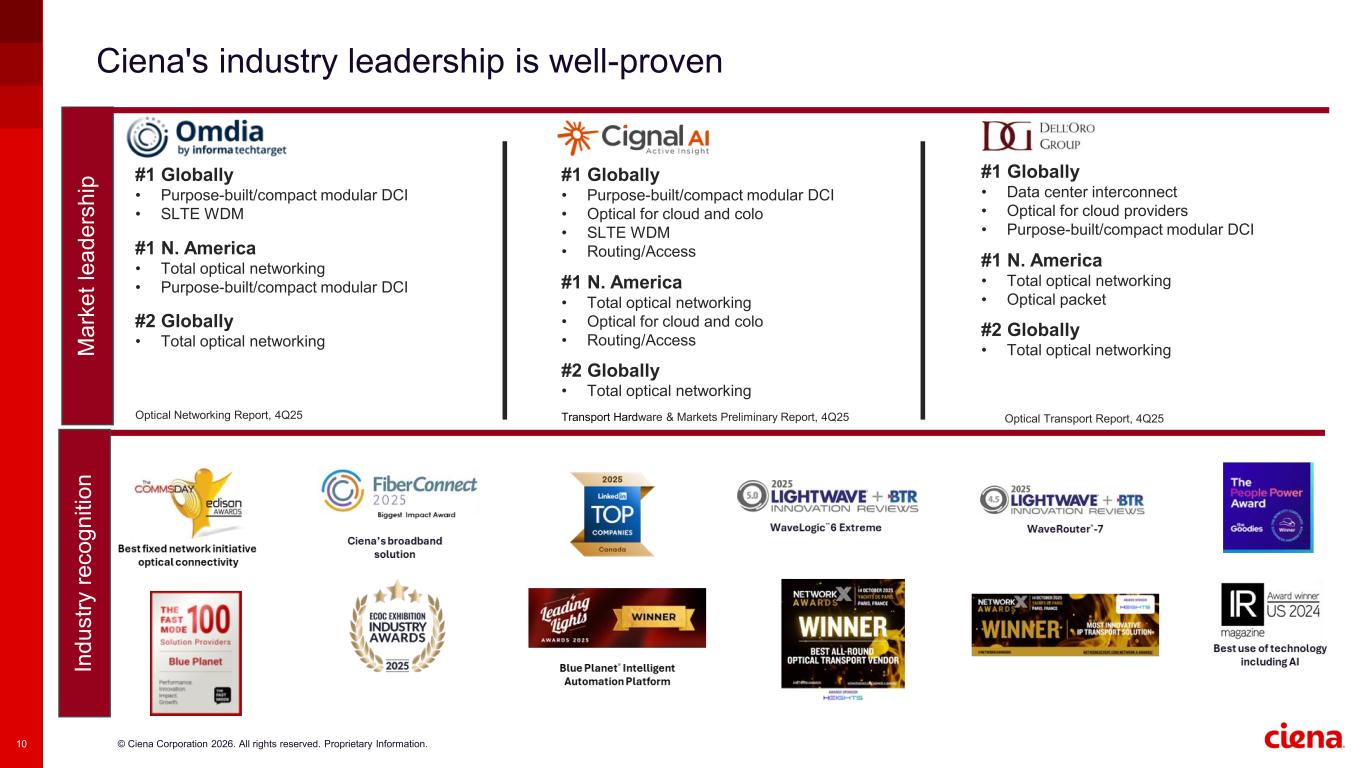
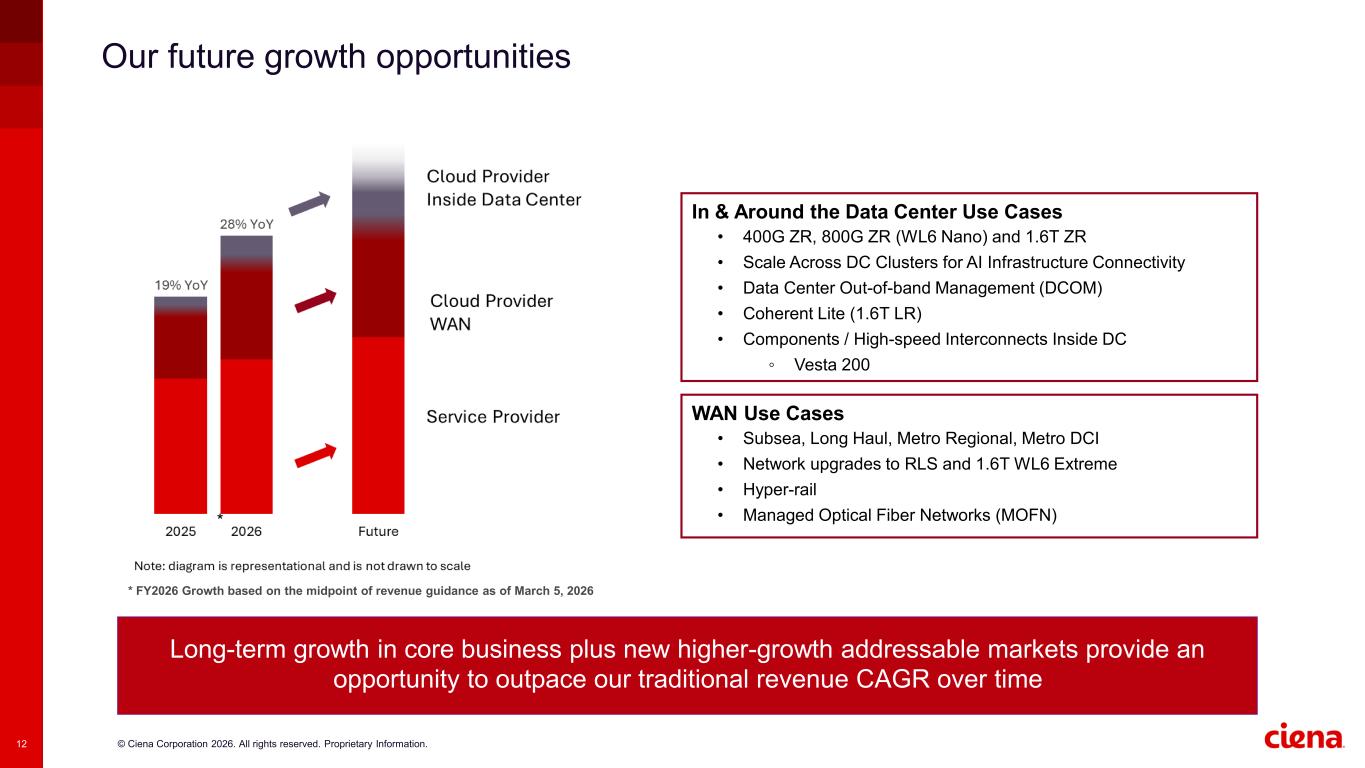
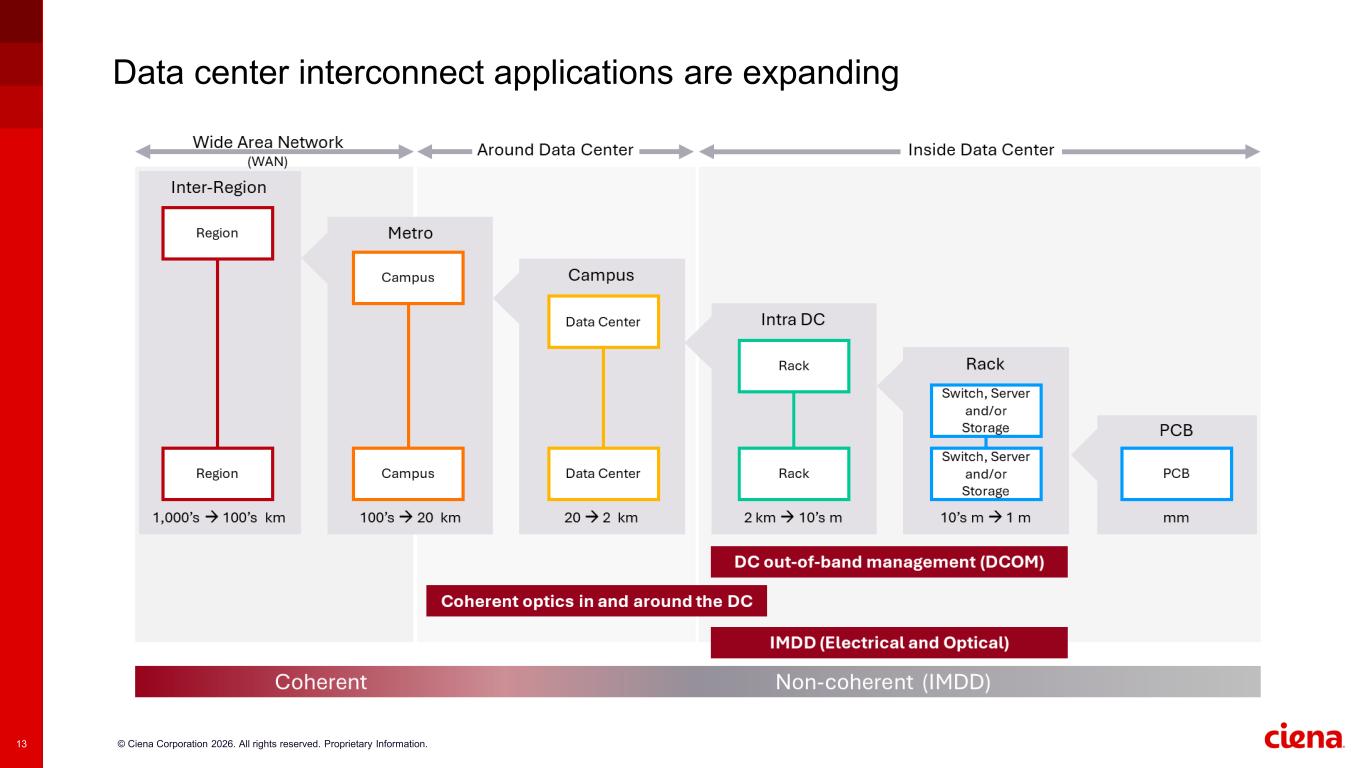
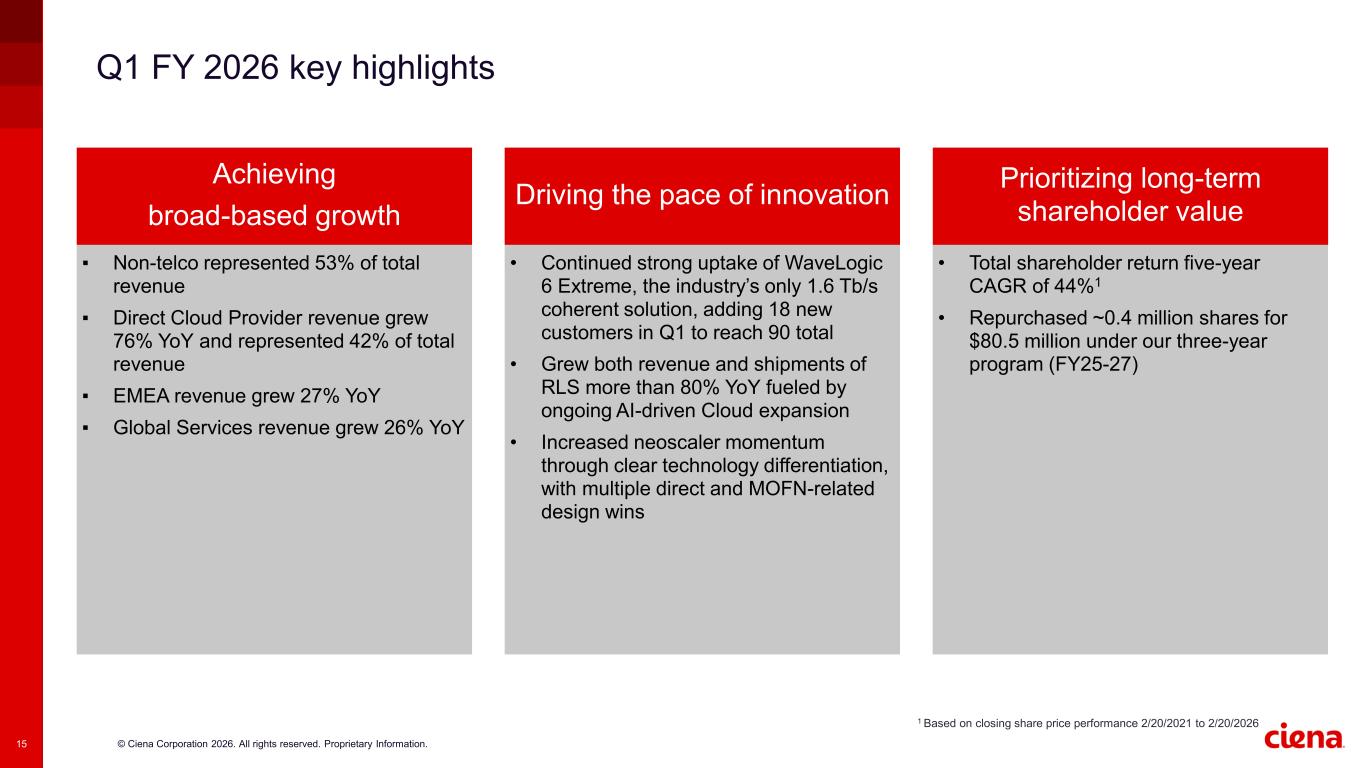
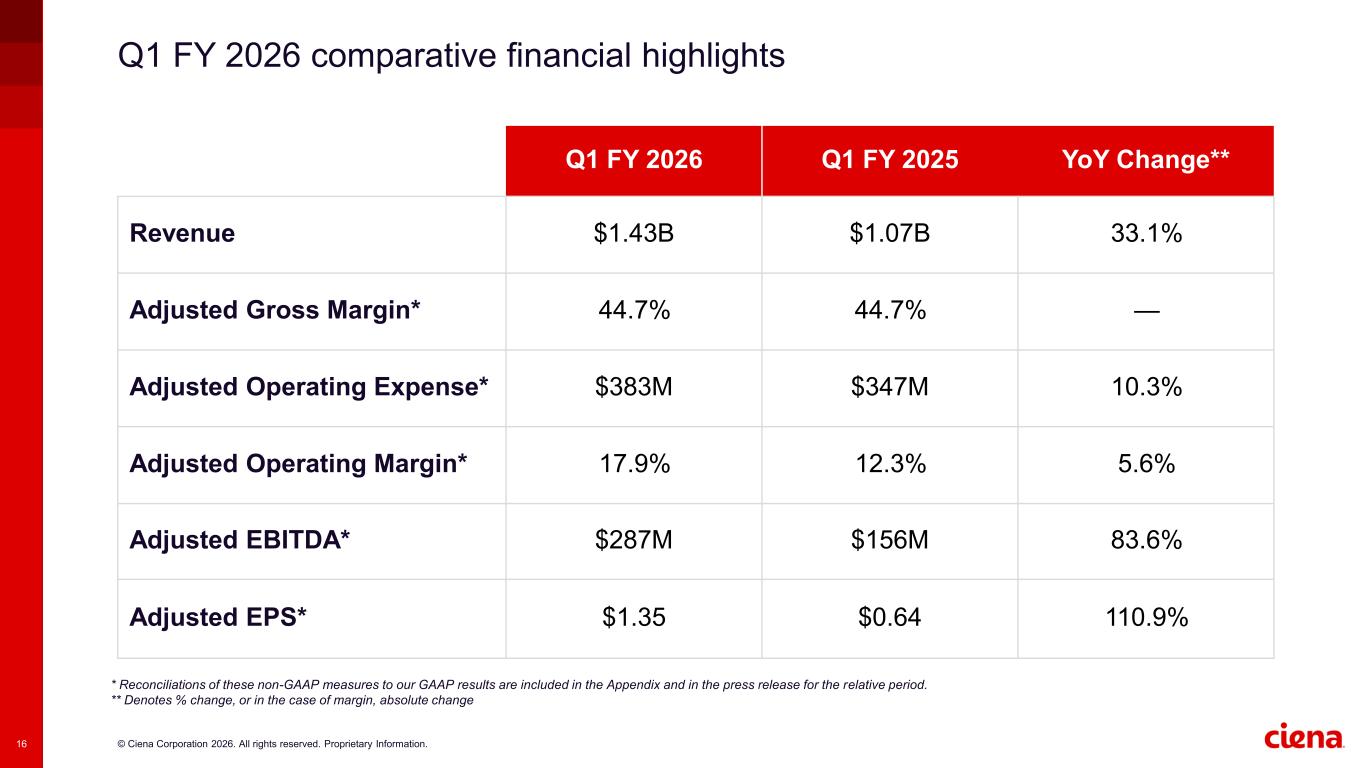
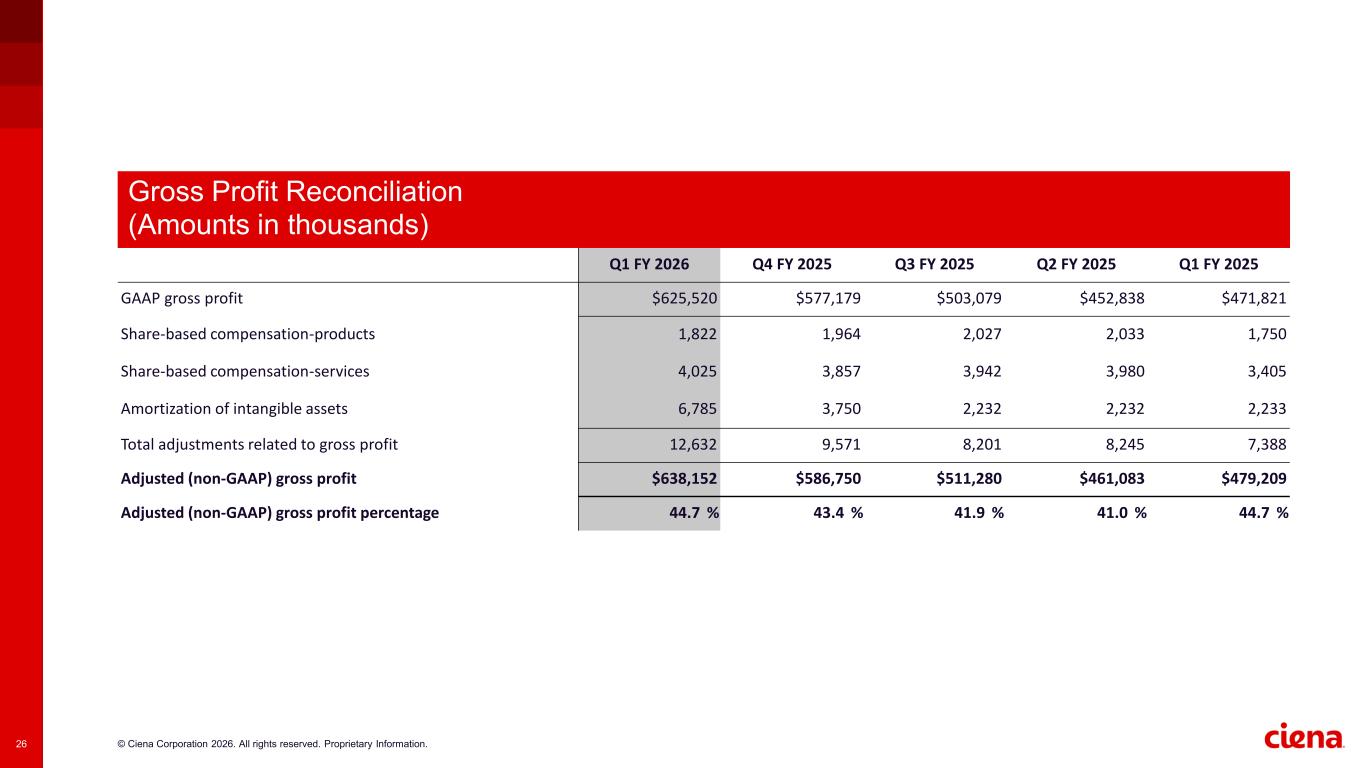
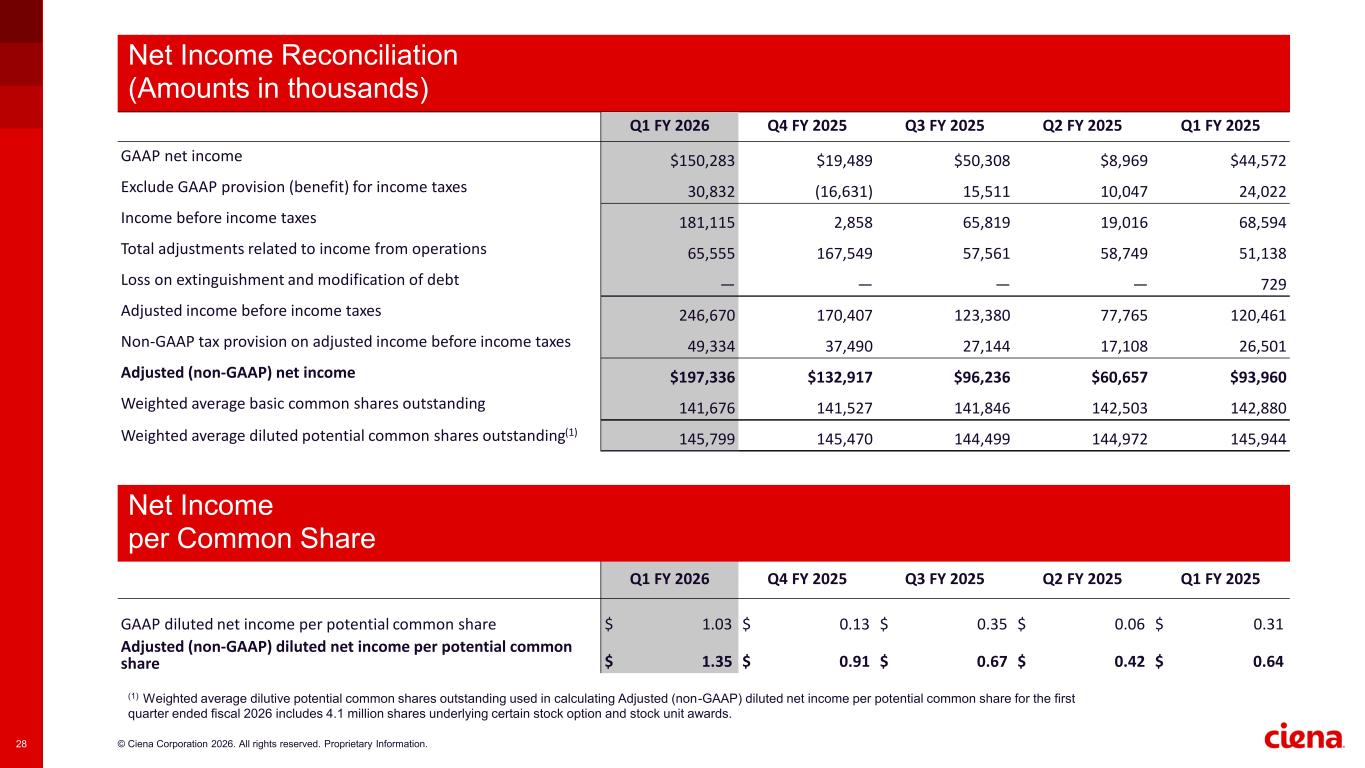
Thanks, Greg, and good morning, everyone. Today, we reported strong fiscal first quarter financial performance. We delivered revenue of $1.43 billion in the quarter, our highest ever, and at the top end of our guidance, reflecting strong execution across the business. Demand is incredibly strong, with exceptional order activity in the quarter. This, along with long-term planning conversations with customers, gives us confidence in the durability of demand and our ability to drive growth as we move through the year and into 2027 and beyond. Adjusted gross margin came in at 44.7%, which was ahead of expectations. And we continue to drive increased profitability, illustrated in part by our adjusted earnings per share of $1.35, which is more than double our EPS in Q1 of last year. These record results reflect Sienna's market leadership and reinforce our role as a critical provider of the high-speed optical systems and interconnects that enable AI workloads to scale and to be monetized. In fact, we are taking meaningful share of the increases in AI-driven connectivity spend as customers trust our technology leadership, deep collaboration, and proven execution. To this end, we believe 2025 will ultimately stand out as one of our strongest years of market share gains, and we believe it will be even stronger in 2026. With our recent inclusion in the S&P 500, we may have new listeners on the call, so allow me to begin with a brief summary of our business. At the highest level, Siena is the global leader in high-speed connectivity. We build solutions that move enormous amounts of data across cities, data center campuses, countries, and oceans, quickly, reliably, and at massive scale. Through industry-leading optical systems and interconnect solutions, along with automation software and services, we power the world's most advanced networks, helping service providers, cloud companies, hyperscalers, governments, and enterprises meet explosive connectivity demands, especially in an increasingly AI-driven world. Our foundational business has always been to address connectivity needs in the Wide Area Network, or WAN, spanning Subsea, Long Haul, Metro, and Data Center Interconnect, or DCI. We remain the undisputed global leader in this domain. Today, much of this business is driven by the continued adoption of cloud services across our global customer base and the network infrastructure required to support them. It is also increasingly fueled by the rise of large-scale AI data centers that need to be interconnected with DCI solutions linking data centers across campuses, regions, and continents. Additionally, service providers around the world have begun reinvesting in their optical transport infrastructure alongside autonomous networking capabilities, both to support surging AI-driven traffic growth across their networks and to improve operating efficiencies. And service providers and cloud provider customers are increasingly working together to deliver connectivity through managed optical fiber networks, or MOFIN, as they navigate regulatory requirements and capacity needs in the U.S. and in other new and emerging geographies around the world. By way of example, our orders in India were up 40% year over year, reflecting ongoing high demand specifically for MOFIN in that country. Together, we view these as structural, multi-year demand drivers that reinforce the critical need to serve WAN connectivity requirements, fueling both our growth and continued momentum. We expect revenue from the MOFIN application will continue to be an important contributor to overall service provider growth going forward, and we are uniquely well positioned to further strengthen our leadership in high-speed WAN connectivity for service providers, cloud providers, and the growing group of neo-scalers from whom we saw increased momentum in the quarter for both direct and MoFAN-related design wins. In parallel to this, we are focused on the significant expansion of our addressable market opportunities in and around the data center. It is now well understood that cloud providers are investing heavily data centers to deliver on both the current and future promises of AI. In just the last few weeks, we've seen announcements from the four largest global hyperscalers that outlined a step function increase in their 2026 CapEx to more than 600 billion in aggregate, driven by infrastructure needs related to AI training and inference workloads at massive scale. These build-outs involve several areas of opportunity for Siena, not only in the WAN, but increasingly in and around the data center, including Scale Across, Scale Out, Scale Up, and our unique data center out-of-band management solution, or DCOM. I'll start first to discuss the Scale Across, which is really an application supported in part by our InterConnects portfolio, which is emerging as AI data centers grow in size and begin to hit power and space limitations. To overcome these constraints, customers are distributing compute across multiple sites and using high-speed performance optical networks to interconnect them, effectively creating one single AI training environment that operates across distance. We believe that we are in the very early stages of this wave of opportunity, and we are already experiencing extraordinary demand, with three hyperscalers choosing to use our optical solutions for their training applications across distance, which we've talked to you about in recent quarters. And all three hyperscalers are significantly ramping, including additional orders for multiple additional clusters from the first hyperscaler we announced in Q3 2025. We are addressing this demand for scale across solutions with our RLS platform, the de facto industry line system standard for cloud providers, as well as our 800 ZR pluggable optics. To underscore this, we realized a second consecutive record quarter for RLS shipments and revenue. We expect to expand our role in scale across applications with the introduction of our new RLS HyperRail solution. HyperRail delivers an order of magnitude increase in fiber density within existing rack footprints, helping customers scale traffic while reducing, and in some cases avoiding, costs and complexity associated with adding substantial numbers of amplifier huts. The solution, developed in close collaboration with our hyperscaler and service provider customers, represents another inflection point for Sienna, and we expect to be first to market again. In fact, we will be demoing the first prototype of our hyperrail system at the OFC trade show in a few weeks' time. This solution we expect will begin standardization at the end of 26 and will ramp in 2027, allowing us to capture share and incremental value as these distributed AI training expands across regional clusters and moves to further distances. In addition to scale across, we see meaningful opportunities inside the data center, including the scale-out connectivity between racks and scale-up connectivity within racks. As we know, the physics of copper inside the data center is reaching its limits. While there will be a place for copper solutions with shorter distance scale-up interconnects, network architectures will include more optical co-packaged interconnects. And over time, as data rates and bandwidth requirements continue to increase, coherent optical connections will overtake IMDb1s for shorter reaches to address going capacity volumes inside the data center and as the world's leading high-speed connectivity company we are investing meaningfully to intersect these important use cases and we continue to demonstrate progress towards our in and around the data center growth objectives and our expanding InterConnect's portfolio, including ZR and ZR Plus pluggables and optical components, is well positioned to address the rising power and space constraints associated with those evolving scale-up and scale-out architectures. We've just reached an important milestone with our first product introduction following the Nubis acquisition last fall, which addresses scale-out and scale-up needs. Last week, we announced the Vesta 206.4T optical engine, which is the industry's first high-density, low-power, open ecosystem, pluggable CPO solution. Samples of the Vesta product will be available in calendar Q2, 2026, and we are actively discussing Vesta, as you'd expect, with our cloud provider customers and partners, and And we're excited to be showcasing it at OFC again in a few weeks' time. For scale-up opportunities inside the RAC, where XPUs are getting faster and driving heat and power concerns, we are advancing the Nitro-Linear Redriver technology, also from our Nubis acquisition. We believe this is a critical element to active copper cabling solutions, which extend the distance that signals can travel and reduce power by up to 80% versus AEC type solutions. We also expect samples of the Nitro redriver to be available in calendar Q2 2026. Finally our data center out-of-band management or DCOM solution continues to represent another significant opportunity inside the data center. Leveraging our XGSG PON and routing and switching platforms, DCOM was initially designed with Meta to meet hyperscale provisioning and configuration requirements. We continue to work with them and are engaged in technical discussions with two other major global hyperscalers. Let me summarize by emphasizing that demand in Q1 26 was unprecedented, reflected in very strong order intake and a meaningfully higher backlog. We executed well and demonstrated strong performance on both the top and bottom lines. This exceptional demand was broad based across service providers, hyperscalers and an expanding set of neoscalers. Opportunity continues to build in waves from our traditional and expanding WAN business to multiple applications in and around the data center. Furthermore, to monetize AI for both training and inference workloads, the latter of which represents another significant growth vector, still in its infancy, the foundational requirement is again high-speed connectivity. These dynamics, combined with our deep, collaborative customer relationships that improve our long-term visibility, plus our continued focus on execution, give us increased confidence for multi-years of strong growth and profitability ahead. With that, I'll turn over to Mark to cover our financial performance and guidance in more detail. Thank you, Mark.
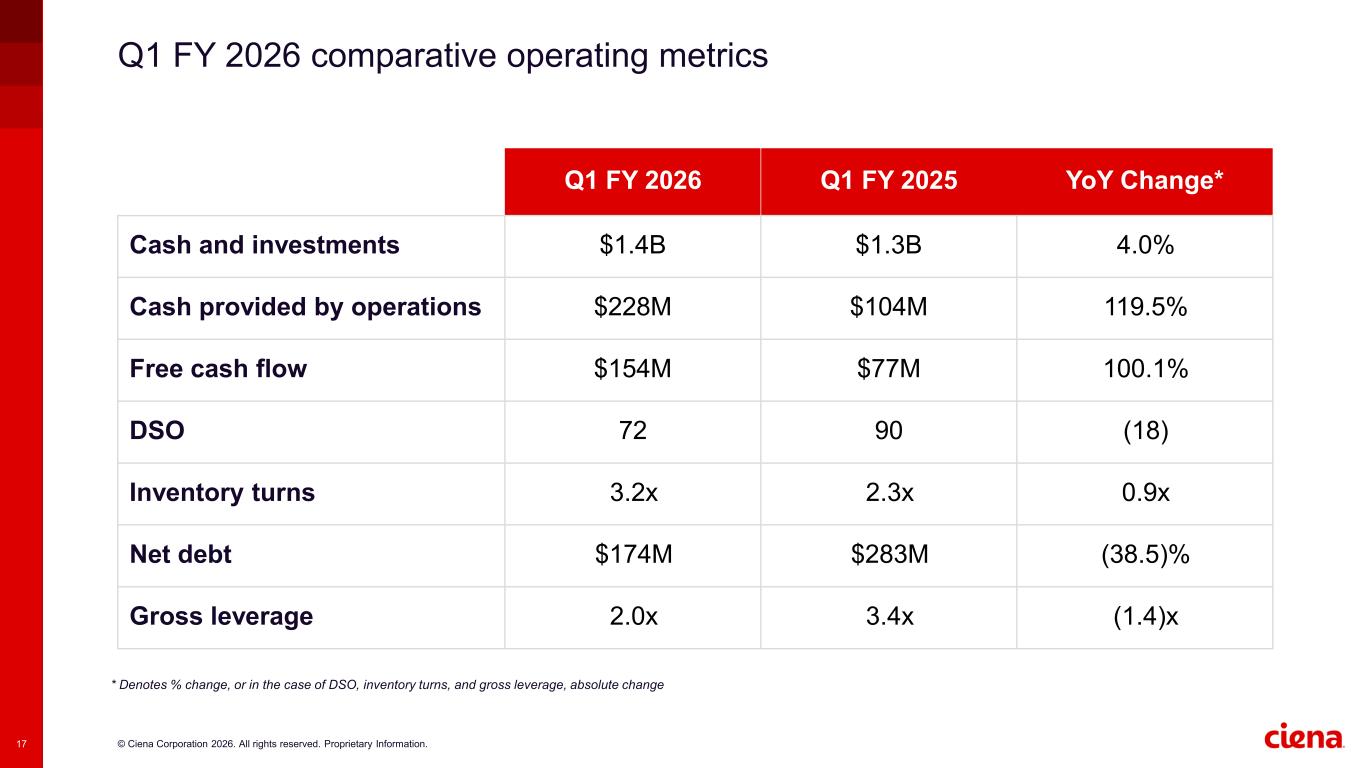
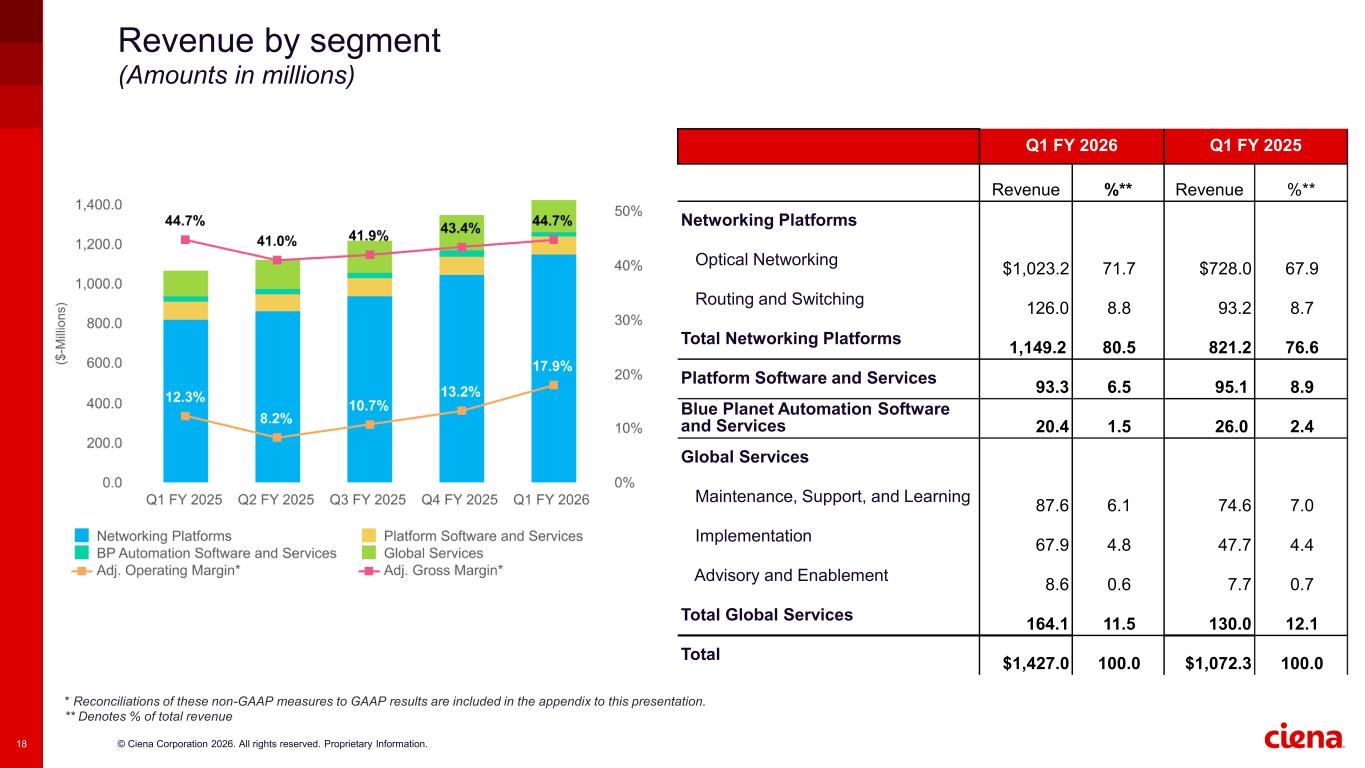
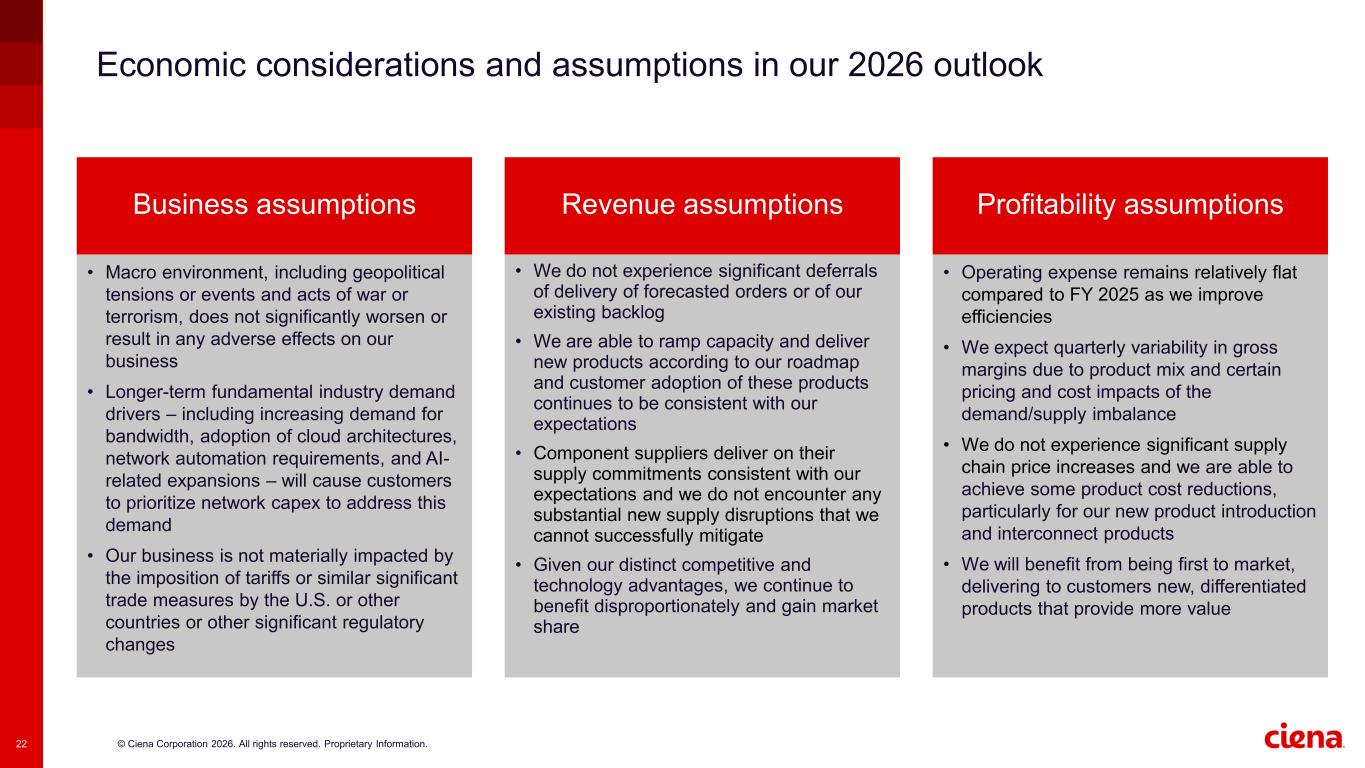
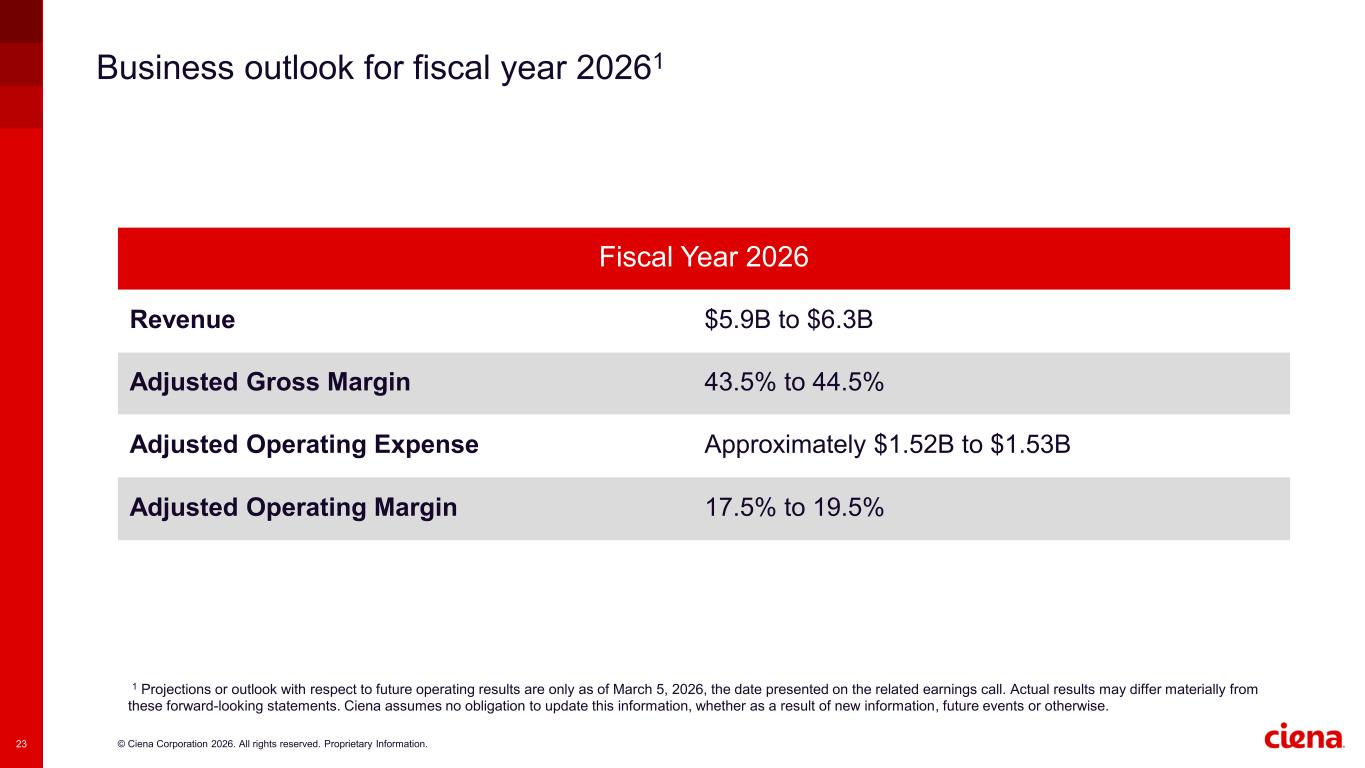
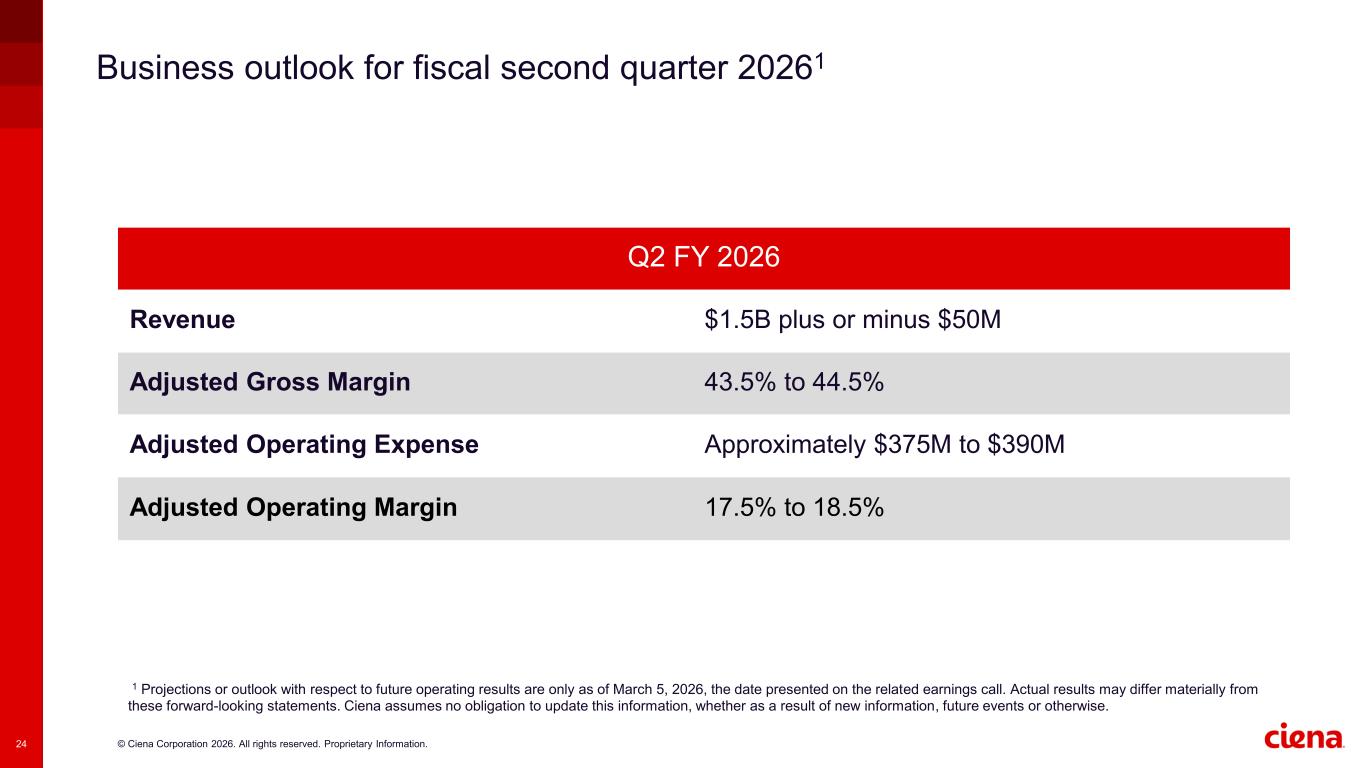
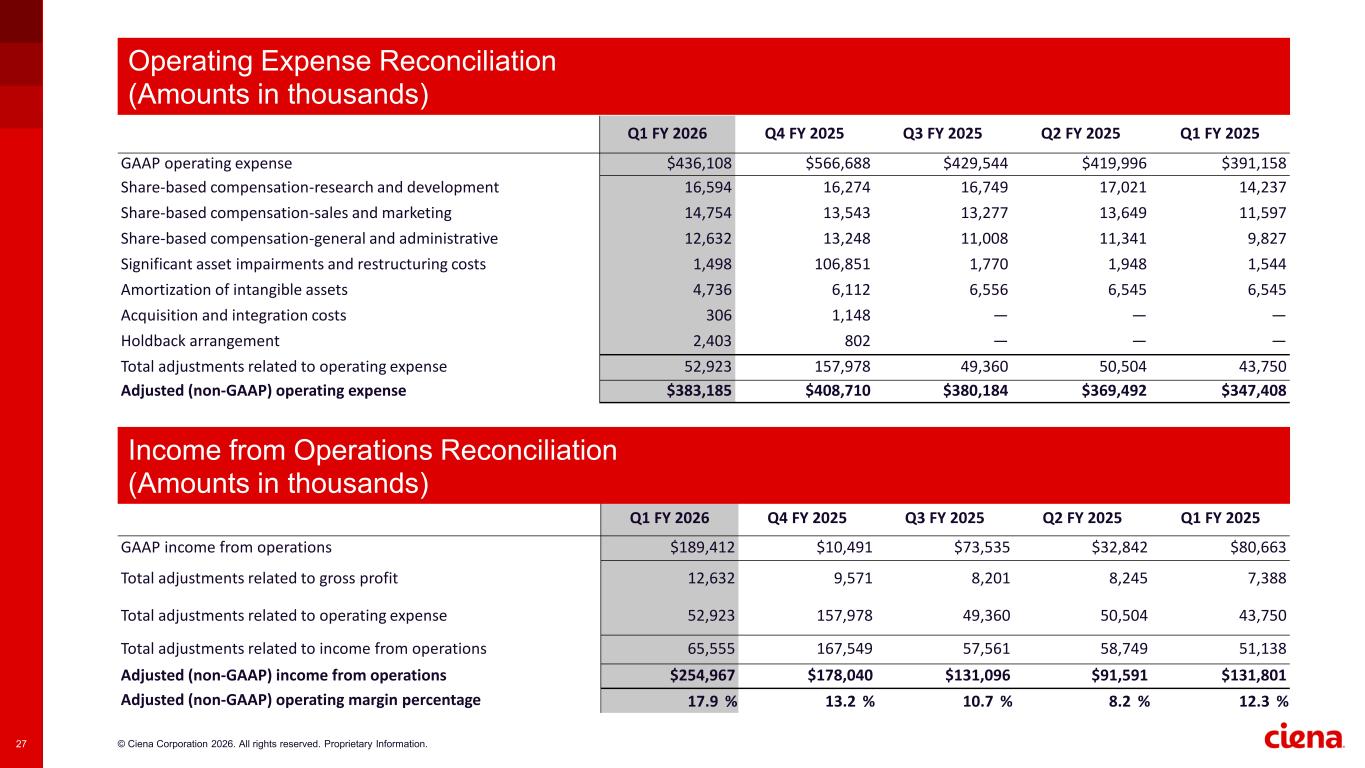
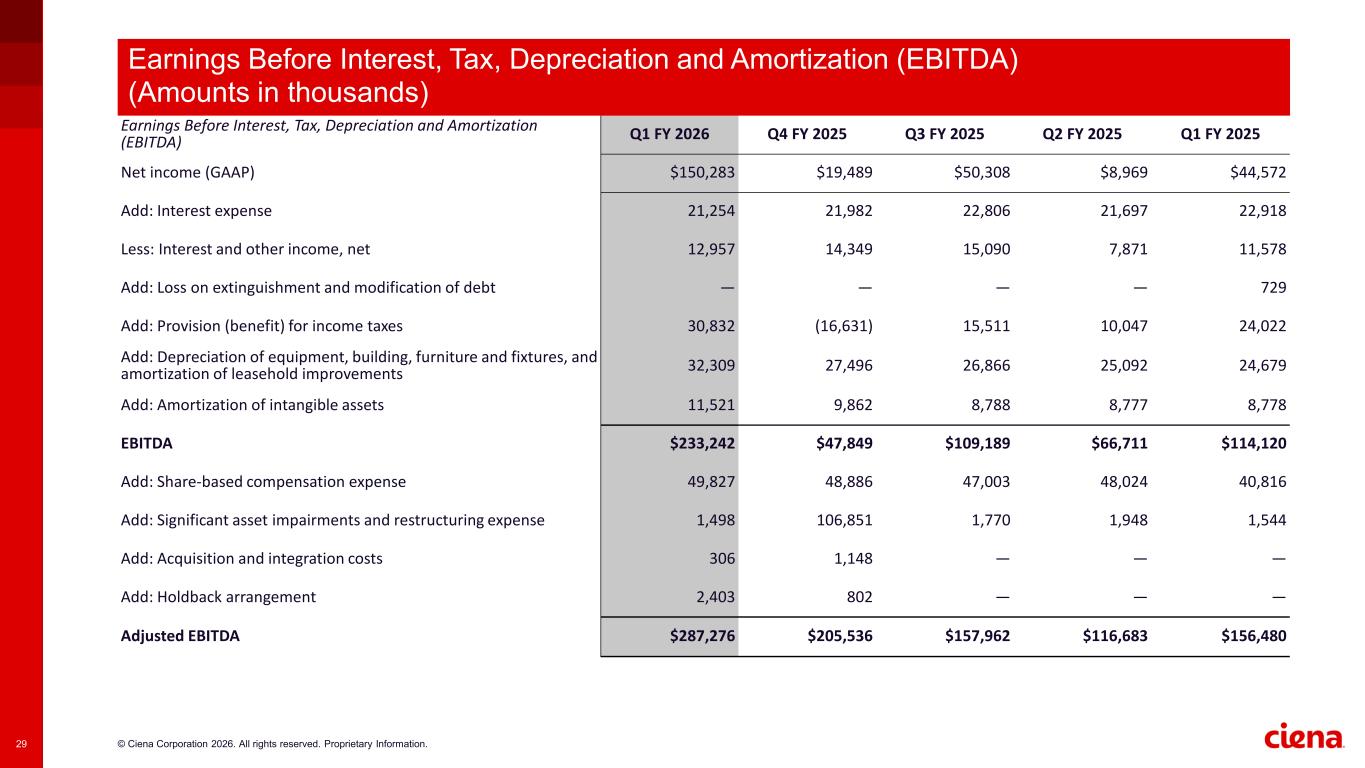
Thank you, Gary, and thanks, everybody, for joining the call this morning. As Gary noted, demand remains robust and has been, in fact, increasing. We are focusing our resources to not only strengthen our financial results, but also to secure near- and long-term supply and manufacturing capacity to deliver for both our customers and our owners. The results delivered in Q1 are a testament to the progress we are making and will continue to make. With that, I'd like to update progress against our financial priorities previously discussed. We continue to make progress to our next milestone of 45% gross margin, as witnessed by our 44% gross margin performance in Q1. Q1 results benefited from product mix, inclusive of contributions from incremental demand for capacity infills, the execution of cost reductions, and early progress on advancing the value exchange with our customers. Longer term, an improving price environment, new product inflections like HyperRail and focused cost optimization all provide opportunity to deliver improved gross margins. Our balance sheet continues to be a source of strength, with working capital improving, driven by cash from operations yielding $228 million in Q1, a decrease in cash conversions of three days, and inventory turns growing to 3.2 times. With respect to capital allocation, we're taking a balanced, disciplined approach, prioritizing R&D to advance our technology leadership in the fastest-growing segments of the market and to drive product velocity, all while holding OPEX levels approximately flat to 2025, delivering significant operating leverage. We are investing our CAPEX to expand capacity, scale output, and meet rapidly growing demand. In Q1, capital expenditures were $74 million, dollars, inclusive of the accelerated capacity investments. For context, this is approximately two to three times our average CapEx over the last 12 quarters. Let me take a moment to comment on the industry's supply and its impact on Siena. As you've heard from many others in the industry over the last few weeks, the supply landscape remains challenging. To be blunt, our revenue in the first quarter would have been higher, but for these constraints. Our close relationships with customers give us early visibility into their demand and our need to expand capacity to address it. We've been working with partners to scale by way of two key initiatives. First, we continue to partner with contract manufacturers with respect to their manufacturing capacity and output expansion, which is yielding strong results. Second, we are deeply engaged with component vendors, which is where more of the industry challenges exist, to secure and expand supply, including through responsible, long-term purchase commitments. As shown by our Q1 results, we are navigating the supply environment well and are investing to expand capacity. However, we expect demand will continue to outstrip supply, at least for the next several quarters. Continuing, turning to Q1, as Gary noted, revenue reached $1.43 billion, up 33% year over year, and a quarterly record for the company. Our optical revenue was up over 40% year over year, led by Wave Server and RLS product each of which were up over 80% from the year-ago period. We had three greater than 10% customers, including two global cloud providers and one Tier 1 North American service provider with strong MOFIN activity. Regarding backlog, as Gary discussed, our order intake has been incredibly strong over the past 90 days, leading to a new record by a significant margin. Given this extraordinary nature of the demand, we want to share with you that backlog has increased by approximately $2 billion this quarter to exit Q1 at approximately $7 billion. In fact, nearly all new orders we are taking now will be for fulfillment in fiscal 2027, providing ongoing confidence in our outlook. As a result, we expect backlog to continue to grow throughout the year. Rounding out Q1, adjusted operating expense met expectations leading to an adjusted operating margin of 17.9%, 190 basis points over the midpoint of our December guide. We achieved adjusted net income of $197 million in the quarter, which delivered an adjusted EPS of $1.35 more than double a year ago. We exited the quarter with a cash balance of $1.4 billion after purchasing approximately 400,000 shares for $81 million under the current Repurchase Authorization. Before I discuss our Q2 and updated 2026 outlook, I'd like to make a few comments on tariffs. As you know, on February 20th, the Supreme Court struck down the IEPA tariffs originally implemented in March 2025. As previously stated, these tariffs have been immaterial to our financial results. And while we have noted this ruling as a subsequent event in our forthcoming 10Q, it has not had any impact to our reported results. The administration has announced a new global replacement tariff under a separate legal authority with final rates still pending. Based on current information, we believe that these developments will have an immaterial effect on our business. Obviously, we are monitoring new developments and working closely with customers and suppliers to assess any future impacts. Now, with respect to our view for the remainder of the fiscal year and Q2, given the current dynamics, we are now expected to deliver revenue for fiscal 2026 between $5.9 and $6.3 billion, essentially raising our year-over-year growth rate from 24% to 28% at the midpoint of the range. We believe this range appropriately balances the strong market demand with ongoing industry supply conditions. Given our Q1 results and the expectations for Q2, we expect our 2026 gross margin to be between 43.5% and 44.5%, one point above our December guide, and 130 basis improvement above 2025. With the first half exceeding our expectations and the supply challenges we are actively managing, we now expect first half and second half gross margins to be roughly equivalent. And we now expect adjusted operating expenses of approximately 1.52 to 1.53 billion dollars, resulting in adjusted gross operating margin of 17 and a half to 19 and a half percent. This small difference in OPEX is really due to the stronger demand environment. In Q2 of 26, we expect to deliver revenue in the range of 1.5 billion plus or minus 50 million. Adjusted gross margins between 43.5% and 44.5%. An adjusted operating expense of approximately $375 million to $390 million will result in an adjusted operating margin of 17.5% to 18.5%. To conclude, we had a strong start to fiscal 2026. Demand for our technology is robust and durable. We see multiple waves of opportunity ahead from continued AI training to expanding inference workloads both domestically and internationally to new hyper rail solutions and faster interconnects inside the data center as higher speed requirements come online. We continue to offer market-leading innovative technology that uniquely enables AI both in the WAN and in and around the data center. And we continue to thoughtfully allocate shareholder capital to deliver value to both our customers and our owners. Given all these opportunities, we're confident our momentum will extend beyond 26. With that, we'll now take questions from the sell-side analysts.
Operator
We will now begin the question and answer session. To ask a question, you may press star, then 1 on your touchstone phone. If you are using a speakerphone, please pick up your handset before pressing the keys. If at any time your question has been addressed and you would like to withdraw your question, please press start and then two. Our first question comes from Amit Daryani with Evercore ISI. Please go ahead.
Yep, thanks for taking my question. I guess I have two from my side. You know, one of the things, just on the gross margin side, really impressive performance in the first half of the year despite some of the supply chain issues you folks are having, and I think mixed with slightly negative. Just spend some time on, like, what are the upside levers and gross margins that are helping you out, and are you seeing a shift in pricing at this point whatsoever? That would be really helpful to kind of understand. Sure.
Hey, Amy, it's Mark. You know, I agree. We had a very strong performance, and we're quite happy with the 44.7 that we printed this morning. And it's really driven by a couple of things, right? We saw customers requiring increased capacity both in hyperscalers and in service providers that increased their infill rates, and so we got quite a bit of tailwind from that. Secondly, I think the engineering team has done a wonderful job of engineering cost reductions into our products that's really kind of separate from the supply chain activities that you're seeing us increase revenue with. So between those two things, I think we're really seeing some good tailwinds. Moving forward, I think we've got a few more levers that we're going to start working through. You mentioned price increases. One of the things that we're trying to do is really balance the price increases with our share position in the market. And I think what you've seen is we've been able to increase our gross margin as well as increase our share. And so I think we're doing a really good job of balancing those two things. I think moving forward, you'll see even more aggressive cost reductions. And then the price increases that we talked about at the end of last year, those really haven't started to fully kick in until the second half of the year. So I think that creates additional tailwinds for us. So all in all, again, I think we're making really good progress towards that 45% waypoint, and you should see that throughout the year. Got it.
If I would just follow up, how do you see the pluggables market, especially with 800 gig ramping up through fiscal 26 and 27. And if you could just maybe compare and contrast a bit about your position in 400 versus 800, that would be helpful as you go into the next cycle. Thank you.
Yeah, I mean, Scott, so we've seen pluggable revenue increase sort of period over period. And we've talked in the past about our interconnect business. And we went from 2024 to 2025, that doubling sort of in the rearview mirror. and then we talked about it as a major portion of our inside and around the data center with our aspirations to triple that this year, and we're well on track for that. So we do see significant growth from a competitive perspective, as we've talked about in the past, through choices that we made to focus early introduction of the technology in the last generation more on our systems business and our plug-in business, because that was a bigger opportunity. We weren't necessarily first movers in that market, so that probably cost us some share and probably cost us actually, frankly, some margin dollars. That's not the case in the 800 gig. We're first to market there, and 800 gig's moving quite along. Now, I will say, though, and I want to make sure people understand this, is that we're talking about capacity ads across the portfolio. It's not just pluggables. Mark mentioned the growth that we're seeing on Waveserver. You know, if you want to be the strategic supplier to particularly the web scalers, they have networks that span campuses, metros, you know, national networks, submarine networks. You have to have all the things in toolkit. And we're seeing increases across all those components, system, business, and pluggables.
Operator
Thanks, Annette. And the next question comes from Simon Leopold with Raymond James. Please go ahead.
Yeah, thanks, guys. It's Jeff Koche in for Simon. So just a couple housekeeping items. Can you give RPO for the quarter and the percentage of the $7 billion backlog that's product? And then while you're doing that, maybe you could just give the percentage of sales that are ZR pluggables for the quarter. And then I guess my second follow-up would be what percentage of the telco revenue is now MOF and how did traditional telco grow? Thank you.
Yeah, there's quite a few questions in there, Jeff, so let me start. You know, if you think about the backlog, I think right now roughly 80% is, you know, products and software, and the rest, you know, I think about is services. Yeah, we're not going to really disclose the percent of pluggable revenue in the quarter. So, you know, as Scott said, you know, we expect that to triple year on year, and we're on track to deliver the 800 pluggable ramp that we talked about. Sorry, I lost track of all your questions. What else did you have?
So, RPO and then percentage of telco that's MOFIN.
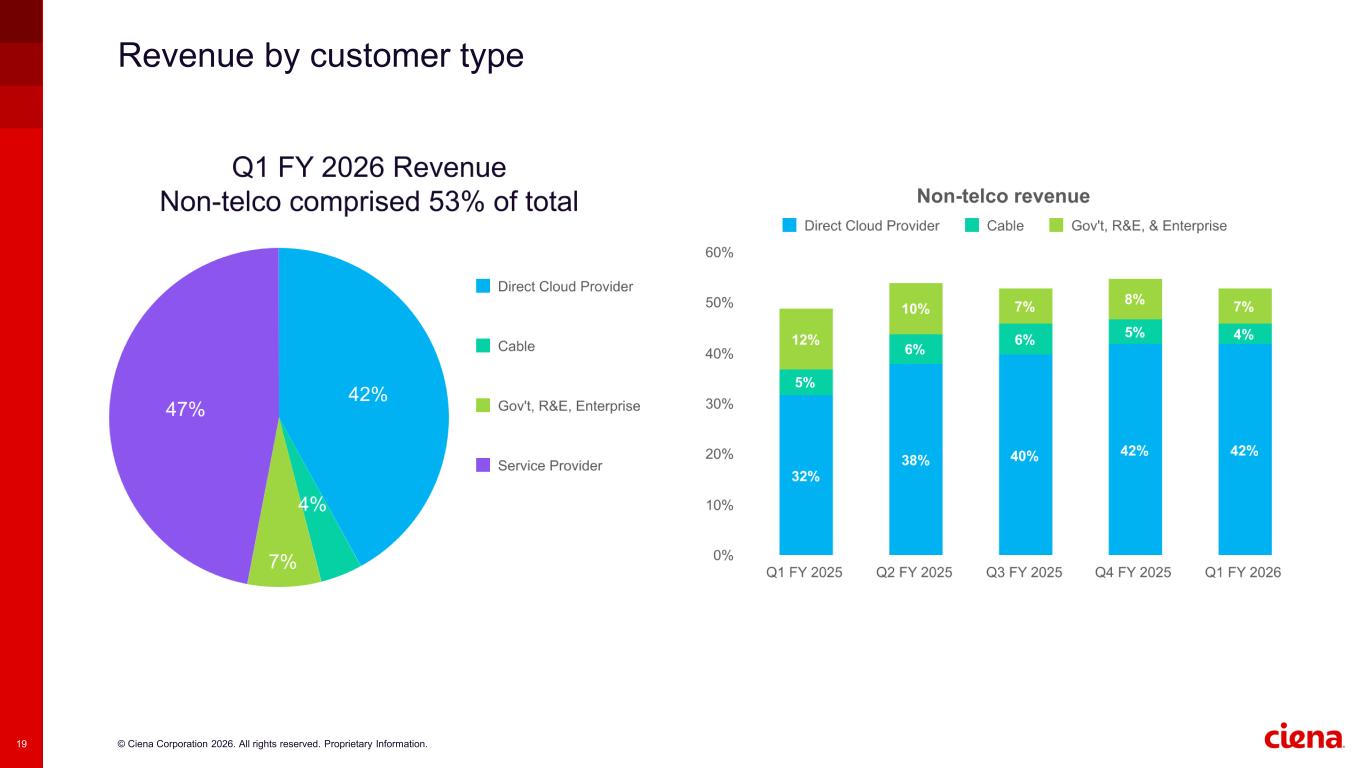
Why don't I take the percentage on the MOFIN thing for you? By the way, I would say the interconnect is somewhat of a proxy at this stage for pluggables to some extent. So, we clearly disclose all of that. I would say, you know, you're looking at about 10 to 15% of our service provider business being MOFIN. We have visibility to, you know, a fair amount of it, but not all of it. You know, we partner with them on, with service providers on identifying some of these particular build-outs, and we're seeing a good steady ramp in that. You know, you're seeing service provider growth, you know, I think in the first quarter, you know, it's like 22%. I think, you know, of that growth rate, MoFen is a big contributor to it. But I think overall it's going to be about 10% to 15% of our total service provider business.
And then RPO, you know, if you think about RPO as a percent of the orders that we took in in Q1, Jeff, you should be thinking, you know, roughly 60%.
Operator
Great. Thanks, guys. And the next question comes from Ruben Roy with Stiefel. Please go ahead.
Hey, guys. Just staying on for Ruben Roy. Anyway, I guess just sort of digging into and following up on the last set of questions around backlog, you know, you guys have gone from $5 billion last quarter to $7 this quarter. I think you just said 80% of the $7 billion is products and software. And so if I just apply that 80% to the $5, that's implying $1.6 billion in product and software growth, which is loose math and loose assumptions there. So then I'm thinking through, okay, last quarter you said Meta expanded their DCOM engagement, the RLS customer expanded, there were a couple more hyperscalers added on, and we're talking hundreds of millions per opportunity, as you've mentioned. So could you just help us bridge the gap and perhaps provide some color as to what the incremental here is relative to the expansions that were announced last quarter or the new hyperscalers that were announced?
Yeah, I would say that, you know, first of all, it's very broad demand that we're seeing. You know, it's very strong on service providers, submarine, MOFIN, and obviously hyperscalers. And I would also say hyperscalers in their various applications, because I think the point to note is we have very broad relationships with most of them now across multiple applications. Submarine cable, long haul, metro, in and around the data center, and with things like DCOM inside the data center as well. So basically, if you look at all of those from an order point of view, they were all up and to the right. And I think that's sort of systemic around the drive of the traffic outside the data center now. So you're seeing growth in cloud, general cloud. You're seeing inference. You're seeing this new market of training now emerge. As I said in my comments, we've now got three hyperscalers deploying us for training. And we're at the very early stages of that. So you put all of that together and that yields the incredible demand that we saw in Q1. And as Mark said, despite the fact that we're ramping our capacity for delivery as seen in our results, Demand is going to continue, we believe, to outstrip our ability to supply. And that's going to continue for, you know, we believe this year. And so we're going to end up with a larger backlog than we have right now as we turn the year, despite the fact that we're ramping our capacity, you know, strongly throughout the year and obviously through 27 and 28.
Yeah, and the one thing I just maybe want to clarify a little bit for you, that 80% is across the entire $7 billion of backlog, not just the $2 billion increment. So you can kind of look through where we ended Q4 to where we're ending Q1 and back into, I think, the information you need.
Yeah, I think I got you there. The $2 billion was simply coming from the incremental, as you're saying, but I assume the 80% was sustained through last quarter as well, which may not be the case is what I'm understanding. On the follow-up, maybe just touching on what Ahmed had asked at the start of the call around pricing. How much of pricing increases currently baked into backlog relative to volume?
Yeah, we're probably not going to give you that number specifically. As we disclosed in Q4, the pricing increases that we talked about were really on the new orders. And because we had such a big backlog at the time, most of that was going to be seen in the second half. So you should expect those price increases to show up in Q3 and Q4.
Operator
You bet. And the next question comes from Mehta Marshall with Morgan Stanley. Please go ahead.
Great. Thanks for taking the question and congrats on the quarter. Maybe just on impressive operating levers that you guys are getting out of the business and just where are you finding kind of those levers to keep OPEX flat as I assume bonus plans need to reset. There's obviously a lot of projects that you're working on with various hyperscalers. And then second, just for – did you mention whether there were any 10% customers within the quarter? Just a small minute. Thanks.
Yeah. Hey, Amita. So on OPEX, the first part of your question, you know, we were able to hold OPEX flat year-on-year really for three reasons. The first is, if you recall last year, each quarter it seemed we were increasing our OPEX guidance to take into account the increased performance that we were doing last year. We basically reset that and we were able to scoop that increment and reinvest that back into the business. So that's one. Two is, you'll recall, we announced a small rift somewhere between 4% and 5% of the population. We've been able to harvest those savings and reinvest into the business. And then you'll recall that we ceased further investment in our 25-gig pond activity. So those three things, we were able to scoop those up, reinvest them back into the business, and that met our needs year on year. And so nominally, that's how we got to that flat OpEx and the, you know, to be honest, quite impressive operating leverage. On the 10% customers, we had three. We had two hyperscalers and one Tier 1 North America service provider that, you know, is pretty exposed to Mofin.
Operator
And the next question comes from Carl Ackerman with BNP Paribas. Please go ahead.
Yes, thank you. Mark, I suppose both of them for you. Could you speak to the duration of this accelerated CapEx spending, which seems driven by enhanced visibility you now see extending over a multi-year period? And for my follow-up, you also spoke about more aggressive cost reductions to support margins. I'm curious if you could expand on that and whether that relates primarily to further outsourcing to the EMS partners or if there are other things we should consider. Thank you.
Yeah, so let me take those. And on the second one, maybe Scott can add some more color here. So on the duration of CapEx, you'll remember in our December call, we talked about we doubled our CapEx year on year. And within that doubling of CapEx, 50% of that, or we were increasing our productive CapEx by 50%, right? So really think about working with our contract manufacturers to expand their manufacturing capacity. Now, obviously, that's got some lead time, right? And so we're investing through the year, and we expect that increase in capacity to start showing up towards the end of the year. And the intent was really to set up a 2027 plan for us, right? And I'm not going to go into 2027 yet, but the intent is to invest in 26 and to realize the benefits in 2027. So that's one. Two, on the cost reductions, I wouldn't say that it's more outsourcing to EMS folks. I think our engineering and product teams are really looking at the cost components of the products and looking at different materials, different solutions, and trying to drive a lot of those costs out. I'd also remind you that we've got the most vertically integrated supply chain, and that drives a lot of both cost advantage for us, but I would say right now, more importantly, supply stability. And so between those two things, I think, as I said, we're starting to see the ability to increase revenue as well as bring in a little better cost profile. I don't know, Scott, if you've got something to add.
Yeah, I think on the cost reduction piece, I sort of think of it as three Libras. One is we're driving a lot more volume through the machine and we do have some fixed costs, so you get a tailwind there. That's the problem you want to get your mind around. On the engineering aspects or design aspects, that Mark talked about, think of it as a couple of things. Number one is where you don't change the function of a product, but you're going after the cost base of it. And that can be through more vertical integration. That could be through substituting parts for different parts. That could be opening up your supply chain to multiple other sources. And we're pushing on all of those levers, by the way. The other piece of the design stuff is as you go from generation to generation where you are changing the function of the product, You get back to those price-value conversations with the customers and sticking more dollars into our pocket as we do those transitions. And those are going on all the time to some degree. The third piece, and we've been talking a lot about it, it's not all on the lines that you said where we're depending more on the EMSs, but we are constantly looking at that supply chain design, the whole ecosystem design, and trying to optimize that to get costs out of it as well. So it's not the engineering design, but the supply chain design. And we're pushing on all those. And, you know, that's why you're seeing the results you're getting. The team's doing a good job executing on those, and there's more in the future.
Operator
Very clear. Thank you. And the next question comes from George Nauter with Wolf Research. Please go ahead.
Hi, guys. Thanks very much. I was curious about your comments about, you know, progress with the value exchange with customers. Like, obviously, you're raising pricing. I know it's going to come through later in the year as you eat down the backlog, but just stepping back and thinking about the space, you've got higher memory costs, you've got component suppliers that are being really aggressive on price, they're repricing their own backlogs. It just seems like it's an environment where you guys could be more aggressive on price and even perhaps reprice your own backlog. So I'm just curious, like, why not be more aggressive here, given the supply-demand dynamics and what's going on in the supply chain?
George, yeah, this is Gary. Yes, I mean, I think you, you know, we've talked a lot about the good things that we're doing, you know, to manage our margins and the rest of it, including, you know, the value we're balancing. But it is a balance to it all. And that's what we're trying to strike as we go through this. I mean, you're seeing it translate into improved financial performance in all dimensions. You know, market share gains, revenue, gross margin improvement, and operating leverage. We're seeing that. And it's a confluence of things. You know, Scott talked about some of the cost reduction stuff. And Mark talked about, you know, the value exchange. You know, all of those things are happening and are getting weaved into the business over time. As you know, we take a very long-term view of how we run the business. And I think we see this as a multi-year opportunity for us. And we'll strike a balance between those challenges of supply chain, you know, because you've got a lot of shortages going on right now as well, which we're navigating through pretty well. So, you know, it's the confluence of those things that result in the approach that we're taking. Mark, I don't know whether you've got any news.
No, I think Gary said it well. Pricing is a lever, George, but we're also looking at can we improve cash conversion? Can we get better terms and conditions? Can we get longer term purchasing commits with maybe some more non-cancelable, less risky terms as we satisfy this quite large backlog? We are not taking pricing off the table, so I just, you know, we should say that. We are seeing some cost increases coming from the supply chain, and we're in early days of having those conversations with customers, so I don't want to get too far into that. But I think we're trying to pull on all the levers. And, you know, overall, I'm pretty pleased with the progress we're making so far across the board.
Got it. Anything new competitively? obviously the competitive environment is I guess more benign than it has been in recent years. You've had some consolidation among competitors. Anything new in terms of their behavior on pricing or terms or just general competitiveness in the space? Thanks.
On the WAN business, I think you articulate the environment well there. We were fortunate because we've got such close relationships with the hyperscalers to get out of front, as Mark said, around the capacity and component supply to that, which is showing up in our growth rate. So, you know, we were able to stay out ahead of that. And we took market share in 25. And I think we'll take even more market share in 26. This is all really now about, you know, we're on our next generation of line systems, you know, with the hyperrail, we're on our next generation of modem technologies in their various forms. So, you know, our competitive position continues to improve there. Obviously, as you get in and around the data center, particularly inside of it, it's a different set of competitors. It's a different set of dynamics. What we bring to the table there is our leading high-speed, you know, connectivity technology and our systems knowledge, frankly. And translating that into the component purchase, we believe, is meaningful. And we've got a lot of the hyperscalers sort of leaning in with us on that. But it is a different ecosystem and environment. We've got new and different competitors there, some of which are very large. So we don't underestimate that. But we think we're coming from a position of strength and uniqueness around our optical technology. is, you know, you're really looking at the opticalization, if that's a word, of the data center as they move from, you know, the electrical stuff runs out of steam from a physics point And, you know, we're starting to pick off some of those applications where that's most pronounced. You know, DCOM, I think, is a decent example of that. We've got the, you know, the new technology that we announced in market from the Nubis acquisition. So, you know, that's going to be a different set of competitors for us.
Operator
And the next question comes from Tal Leone with Think of America. Please go ahead.
Tal, are you there? It might be on mute.
Operator
Tal? We'll move on to the next. Tim Long with Barclays. Please go ahead.
Hi. This is Alyssa Shreves on for Tim. I just had two quick ones. Were you seeing any dynamic in the quarter with the order growth? Was there any trend in customers trying to get ahead of pricing actions, or was it really just underlying demand kind of driving the growth there? And then I had a follow-up.
Pure underlying demand, you know, across the board, you know, not driven by sort of, you know, pricing thresholds or anything. There's so much demand for capacity out there across the board. Service providers have not invested in their optical infrastructure for about five years. They've been so preoccupied with 5G, et cetera, that there's an underinvestment in the optical infrastructure in the world, and you're seeing very strong growth from the service providers and MOFIN activity as well. And then you've got hyperscalers with the across training, clustering, new market for optical. That's really ramping pretty significantly. And then you've got the sort of, you know, inside the data center optical moves as well. So across the board, Elisa.
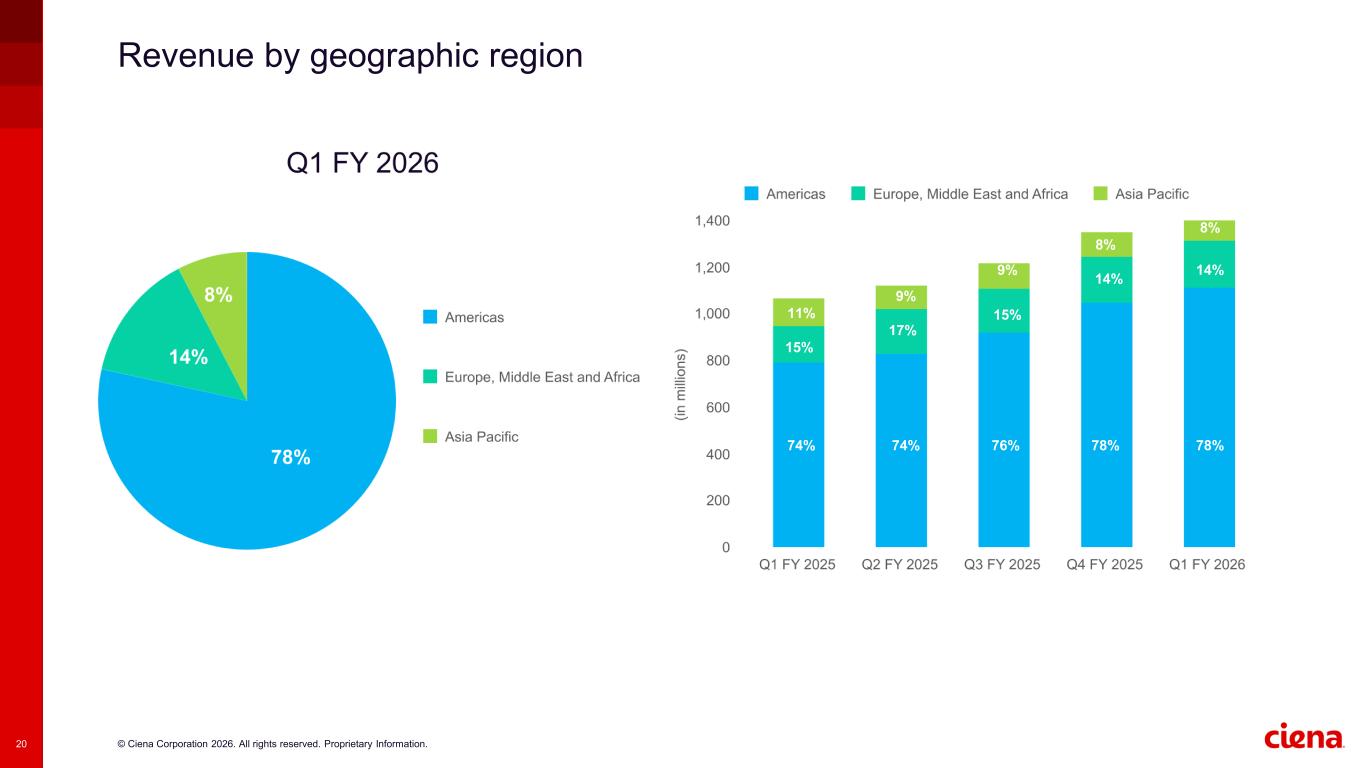
Okay, that's helpful. And then just a quick one on APAC. The orders for India and the quarter were really strong. Should we kind of expect the region to be driving APEC this year, just given kind of last year was more mediocre growth in the region and it was down the prior year? Should we kind of accept a step change now with India?
I think that India will probably be very, very strong and robust this year, largely driven by MOFIN. Obviously, it's the fastest growing Internet market in the world. All of the hyperscalers are leaning in and playing there. And because of the regulatory environment, et cetera, they have to really partner with local folks and service providers to provision their optical networks. So I think that's going to be very sustainable. We're seeing an uptick in the amount of projects there. I would say overall we're going to see good growth out of Asia-Pacific this year in a number of areas, I would also, you know, including Japan, I would say that that is largely driven by two things. One, my point earlier on about service providers have largely underinvested in optical in the last five years, so that's beginning to play a part in it. Second part of it is the increase in MOFIN activity in the whole Asia-Pacific area, and submarine cable being a part of that too.
Great. Thank you so much.
Operator
Thank you. And the next question comes from Tal Leone with Inc. of America. Please go ahead.
Hi, guys. This time you hear me?
I got so excited I broke my headset. Understandable. I like it. I have a question about the risk of early ordering or what we're seeing in every cycle is that when there are constraints, customers start ordering much much earlier and that creates big increases in backlog and then declines how can you manage it so i'm sure you probably don't know if there is or to what extent but is there any way you can manage early ordering uh through pricing the way cisco does it or any anyway any other way in order to mitigate the the phenomenon like so you don't have the what we've had like in 2022 or 2023 whenever we had the previous cycle yeah tal that's a that's a good
question i mean first of all i think having suffered through that you know we're suitably sensitized to it and we learned some lessons through that um one of which is visibility into things like installation and what are they actually doing and when with the equipment um i would say that you know the the dynamic here the service providers is good steady growth we We have good visibility into that and what they're doing with it. So I, you know, and they were the main folks that were, you know, having the challenges around the ordering piece. The hyperscalers, I think we have deep collaborative relationships with them. They're our biggest service customers as well. And you saw our installation services were up 42% in the quarter. That gives us, and we have unique visibility into what they're doing and deploying across the board there. So, you know, given the scale of this, this is deep and collaborative relationships with them around precisely what are they trying to do where. And so that gives us good confidence and visibility in the way we structure our agreements with them. You know, given these lead times and the rest of it, which they're mindful of, I think we have great assurance, another way of saying this, in the quality of our backlog.
Yeah, I think the only thing that I'd probably add, Tal, as, you know, when we talked about value exchange, part of that is, you know, making sure we've got the right terms and conditions in place so that we don't get stuck, you know, holding the bag. And I'm not, we've not really seen a lot of people pushing back on that.
Got it. Second question is, I mean, on margins. And the risk is that in times like that, the component pricing will keep going up. And you start to see it. It started with memory. We start to see it now with other companies or other types of components. What can you do going forward? What can you do in order to mitigate the future risk? I understand what you're doing now and how you're trying to mitigate the current risk. but are there any like forward pricing or forward purchase commitments, et cetera, you can take in order to mitigate the future increase in component pricing or what are you trying to do or how are you trying to address it?
Yeah, this is Mark Tal. Yeah, I think there's, again, we keep coming back to this word balance. I think we are, you know, really focused on ensuring that we've got the secure supply to satisfy the demand that we're looking at and we're locking in the pricing as we know it today with our component suppliers and the contract manufacturing folks. All that said, there's still future risk of them repricing their backlog, and we are having conversations both on our supplier side as well as on the customer side so that we're not getting squeezed in the middle. But again, it's the balance of pricing and supply on one side and pricing and share on the other. And I think given the results that you've seen and, you know, the basis of our raise, I'm feeling pretty comfortable that we're striking those right tones.
Operator
Great. Thank you.
Operator
And the next question comes from Atif Malik with Citi. Please go ahead.
Hi, it's Adrienne Colby for Octave. Thank you for taking the question. I wanted to ask another one about gross margin. With the 800 ZR pluggables ramping in the latter part of the year, and also with the pricing increases kicking in, why wouldn't we see gross margin expansion in the second half?
Yeah, I mean, you know, look, the guide that we gave was a good range based on what we see from the product mix and from the, you know, supply chain challenges that we're trying to work through. Again, that balance that I talked about before. You know, from our seat right now, we think that's a pretty responsible guide. As we make more progress, we'll give you guys updates.
Great. That's helpful. Thank you.
And then just as a follow-up, I was wondering if you could provide some more color on the momentum that you're seeing with new scalers, maybe just in the relative size of the opportunities uh if most of that's falling inside direct versus mofen yeah we're we're seeing you know obviously a uh an emerging ramp here around a bunch of the you know loosely called sort of neo scalars which encompasses a you know a fair range of different different players, you know, it's, I would say, largely right now Mofin orientated, you know, given the capital expenditures, time to market for them, et cetera. But what is clear from it all is that the network is now a real priority for them. And I think, you know, that plays through to the hyperscalers, too. You know, there's been such a maniacal focus and continues to be, obviously, on things like power, GPU accessibility, et cetera, et cetera. now it's really about the network. The traffic is beginning to come out of the network, both for inference and for training. And the neoscalers are obviously seeing that too. So they're leaning in on the network. Now we're also beginning to see some of them wish to have control of some of that network as well and do their own builds. We're cautious about that approachment, given the financial structure of some of those Neoscalers, not all of them, but we are seeing across the board of the Neoscalers leaning in on their whole network requirements. Largely, really, Adrian, currently going for MOFIN.
Thank you. We will take one other question today.
Operator
The next question comes from Ryan Kuntz with Needham & Company. Please go ahead.
Great, thanks. You've touched on scale across a bit. It seems like we're very early in this momentum around that area. Can you maybe expand on those projects, where we are in terms of a rough count, and how your visibility is improving there relative to backlog and specific scale across projects? Thank you.
Hi, Ryan. We shared that, I think it was in Q3, we announced the first large hyperscaler rollout. We've actually seen during the course of this quarter additional sites being added to that. Again, I would say all of these currently that we're seeing are in North America, which is, I think, to be expected. We've added two more hyperscalers to that. that are also, you know, rolling this out. I think we're in the very, very early stages of this. And in talking with them, though, you know, the plans are large and expansive, as you'd expect, for just the scale of what they're trying to do here is absolutely enormous. So, you know, we're at the very early innings of this whole training clustering. I would say that, you know, what we're also observing is their architecture. You know, all of these hyperscalers, we talk about them homogeneously, they aren't. They have very different business models. They have very different architectures, both inside the data center to some extent and certainly outside from a networking point of view. Their training varies as well. And so, you know, I think you've got lots of different variables in there in terms of distance, capacity, speed, et cetera. They all want low latency, and they all want super high speed. But you're seeing a lot of variables about how they are clustering this. And I think, you know, as again, I would say we're at the very early stages of this, Ryan.
Really helpful. Thanks, Zach, Gary. One last question on DCOM here. You know, great early move here. It seems like you've got a big lead in this opportunity to bring Pond to out of band. Do you feel like that space is defensible for you, and how do you sustain a competitive advantage there? Thank you.
I think, you know, there's a number of elements to that sustainability. I think it's deep collaboration, first off, and understanding in intimacy the application. And obviously, Meta were incredibly helpful in instigating that. But there is, you know, different use cases. is they are slightly different in the different hyperscalers, but I think the defendability of it is, you know, we're very vertically integrated into it. We own the sort of core technology, and it's the software that we're putting on that as well. We're kind of uniquely positioned about that. So we think it's the combination of all of those elements, the collaboration, the vertical integration, the uniqueness and high speed of it, and then all of our software integration capability, and also, by the way, installation. which we're also doing. It's the confluence of those things. We think it's quite defendable.
Operator
This concludes our question and answer session. The conference is now concluded.
Thank you for attending today's presentation. You may now disconnect.