Operator
Good morning, everyone, and welcome to Encompass Health's second quarter 2025 earnings conference call. At this time, I would like to inform all participants that their lines will be in a listen-only mode. After the speaker's remarks, there will be a question and answer session. If you would like to ask a question during this time, please press star 1 on your telephone keypad. You will be limited to one question and one follow-up question. Today's conference call is being recorded. If you have any objections, you may disconnect at this time. I will now turn the call over to Mark Miller, Encompass Health's Chief Investment Relations Officer.
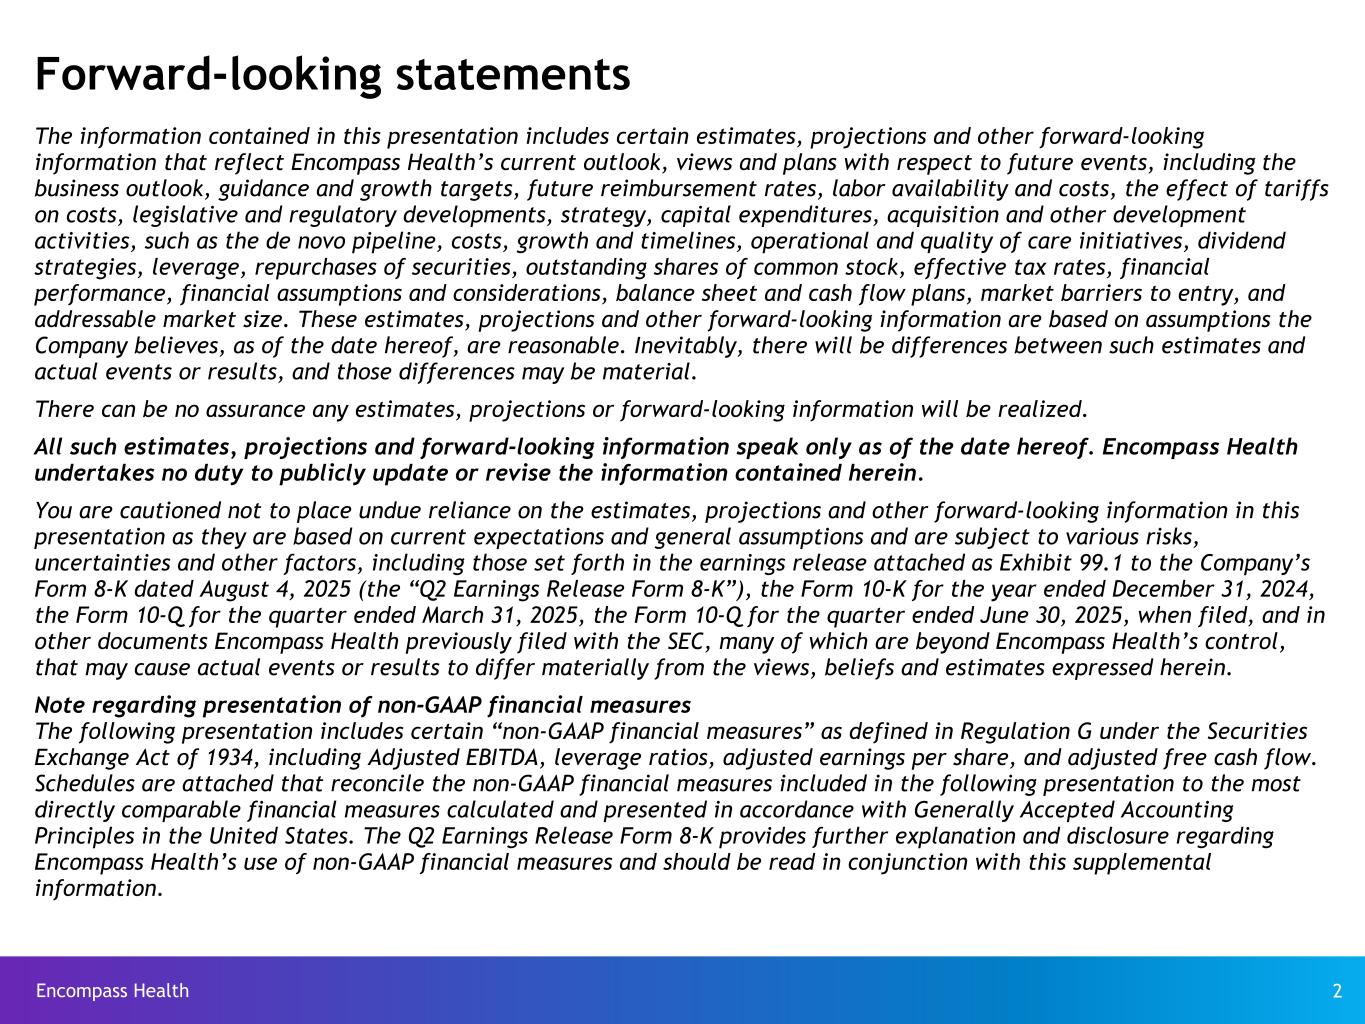
Thank you, Operator, and good morning everyone. Thank you for joining Encompass Health's second quarter 2025 earnings call. Before we begin, if you do not already have a copy, the second quarter earnings release, supplemental information, and related form 8K filed with the SEC are available on our website at encompasshealth.com. On page two of the supplemental information, you will find the safe harbor statements, which are also set forth in greater detail on the last page of the earnings release. During the call, we will make forward-looking statements, such as guidance and growth projections, which are subject to risks and uncertainties, many of which are beyond our control. Certain risks and uncertainties, like those relating to regulatory developments as well as volume, bad debt, and cost trends that could cause actual results to differ materially from our projections, estimates, and expectations are discussed in the company's SEC filings, including the earnings release and related Form 8K. The Form 10-K for the year ended December 31st, 2024. The Form 10-Q for the quarter ended March 31st, 2025. And the Form 10-Q for the quarter ended June 30th, 2025 when filed. We encourage you to read them. Your caution not to place undue reliance on the estimates, projections, guidance, and other forward-looking information presented, listed, which are based on current estimates of future events and speak only as of today. We do not undertake a duty to update these forward-looking statements. Our supplemental information and discussion on this call will include certain non-GAAP financial measures. For such measures, reconciliation to the most directly comparable GAAP measure is available at the end of the supplemental information, at the end of the earnings release, and as part of the form 8K filed yesterday with the SEC, all of which are available on our website. I would like to remind everyone that we will adhere to the one question and one follow-up question rule to allow everyone to submit a question. If you have additional questions, please feel free to put yourself back in the queue. With that, I'll turn the call over to President and Chief Executive Officer Mark Tarr.
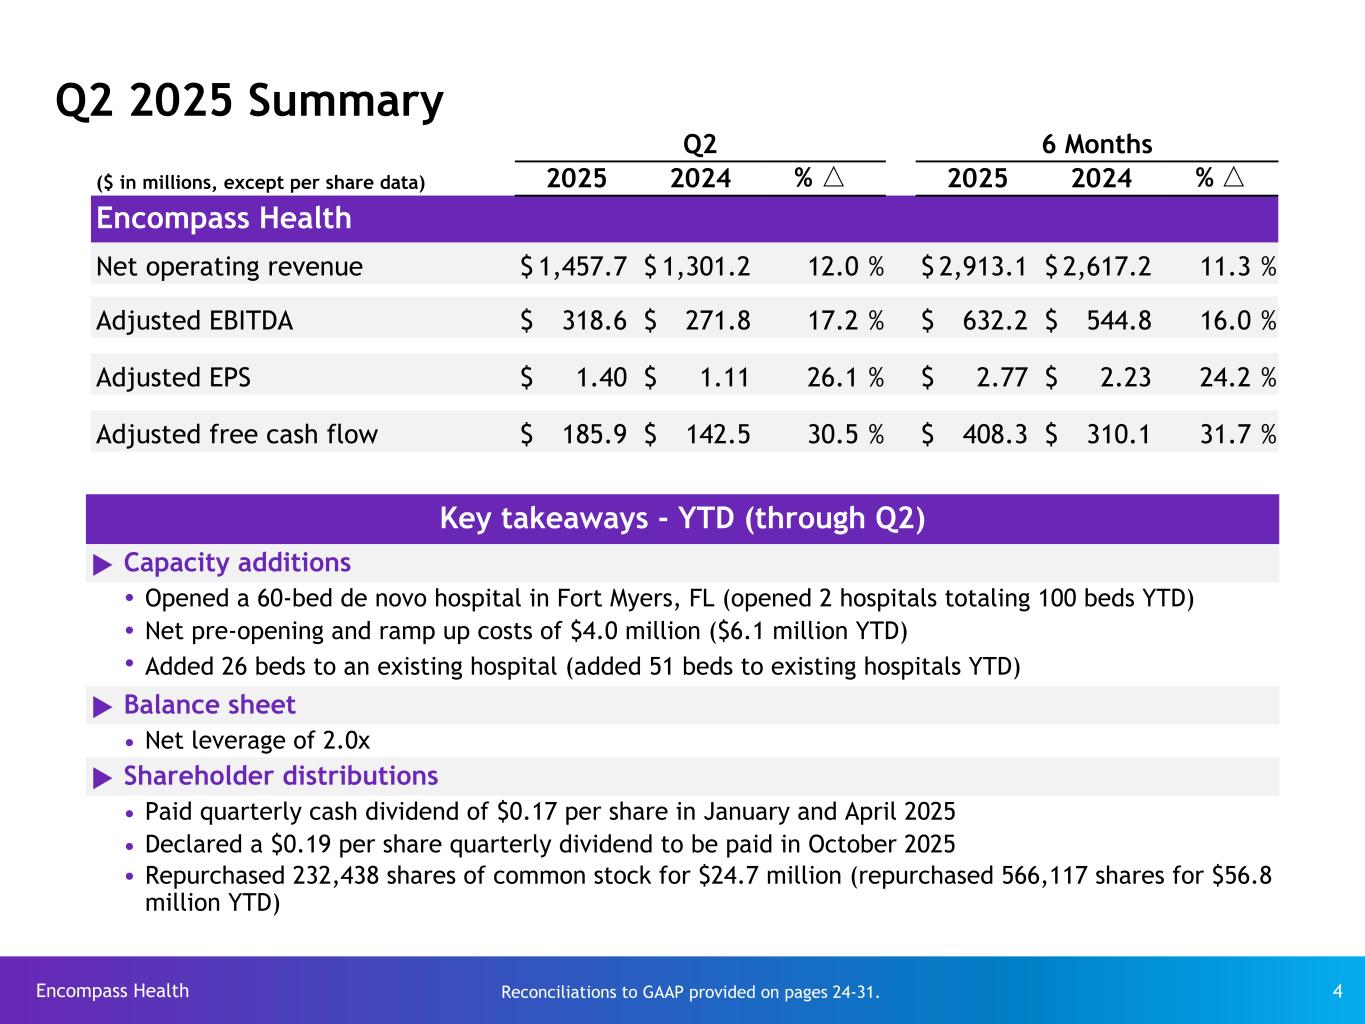
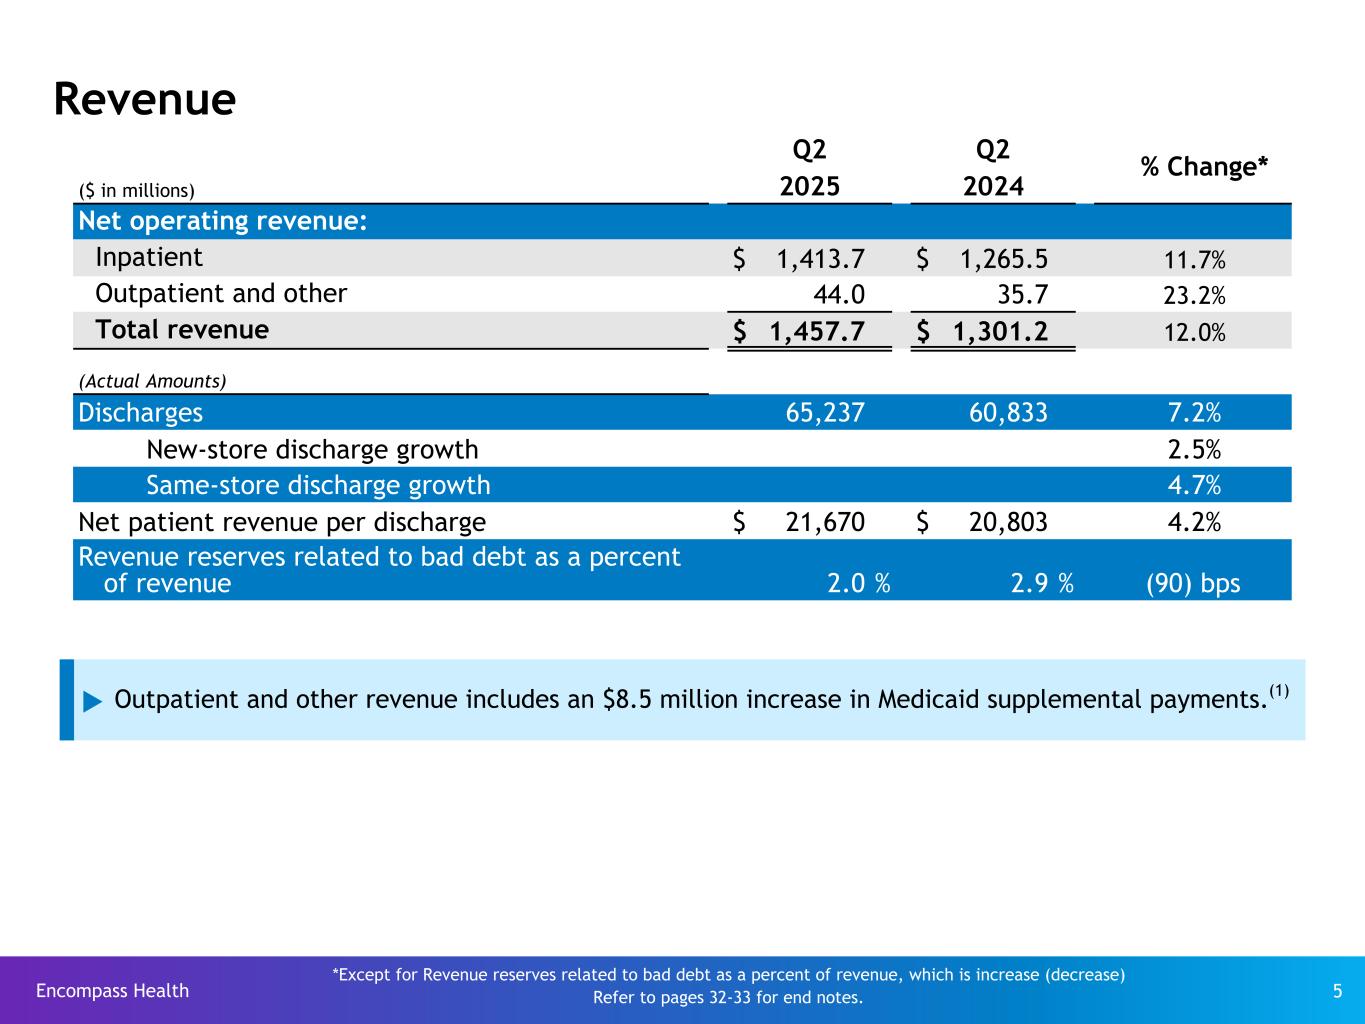
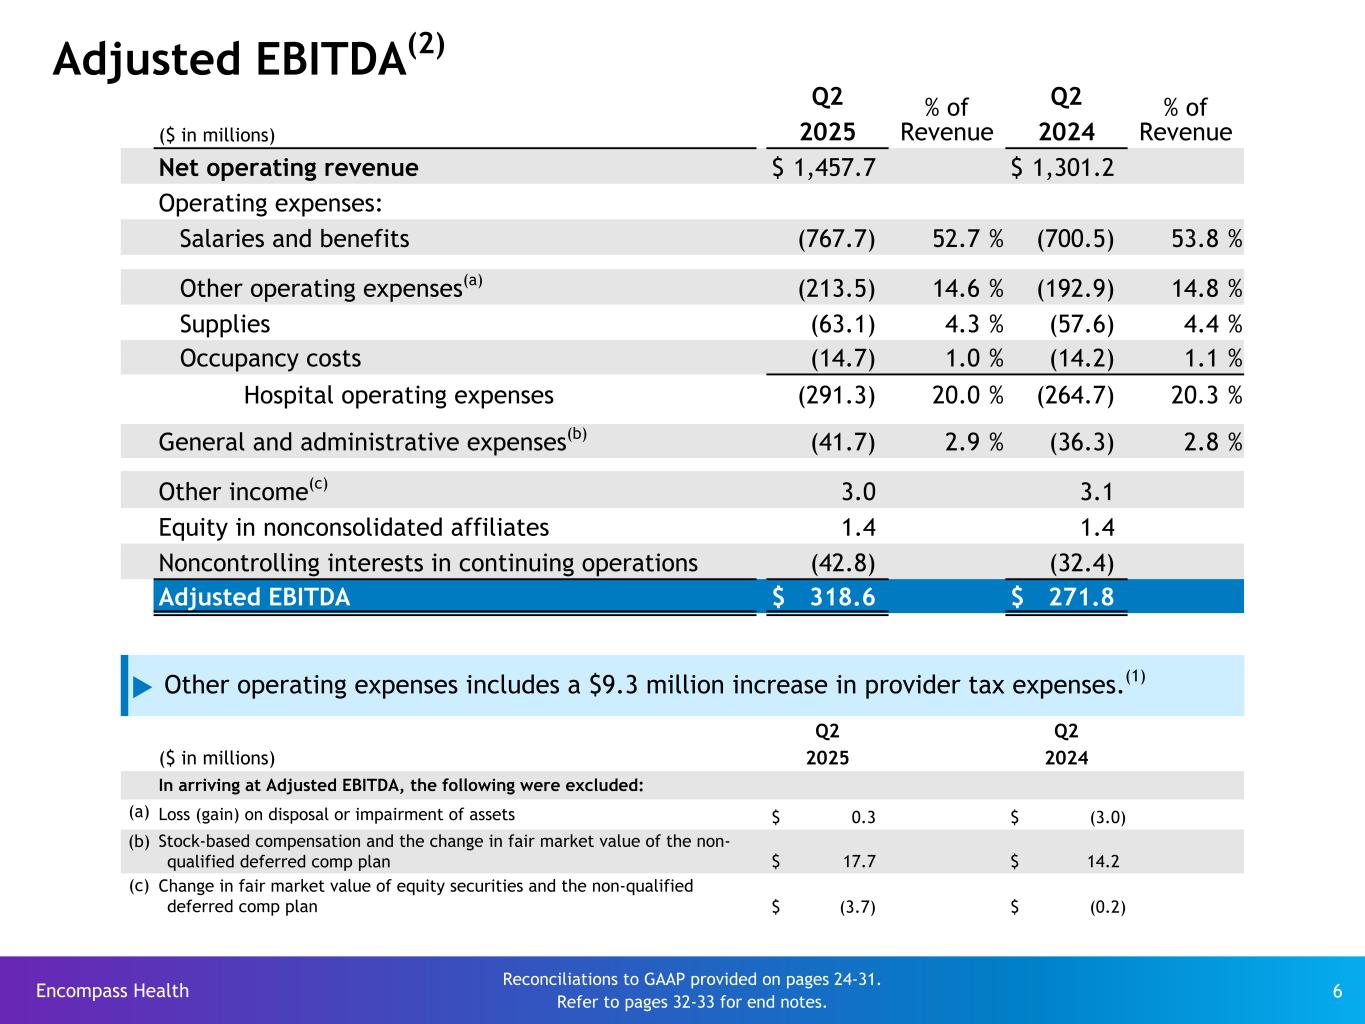
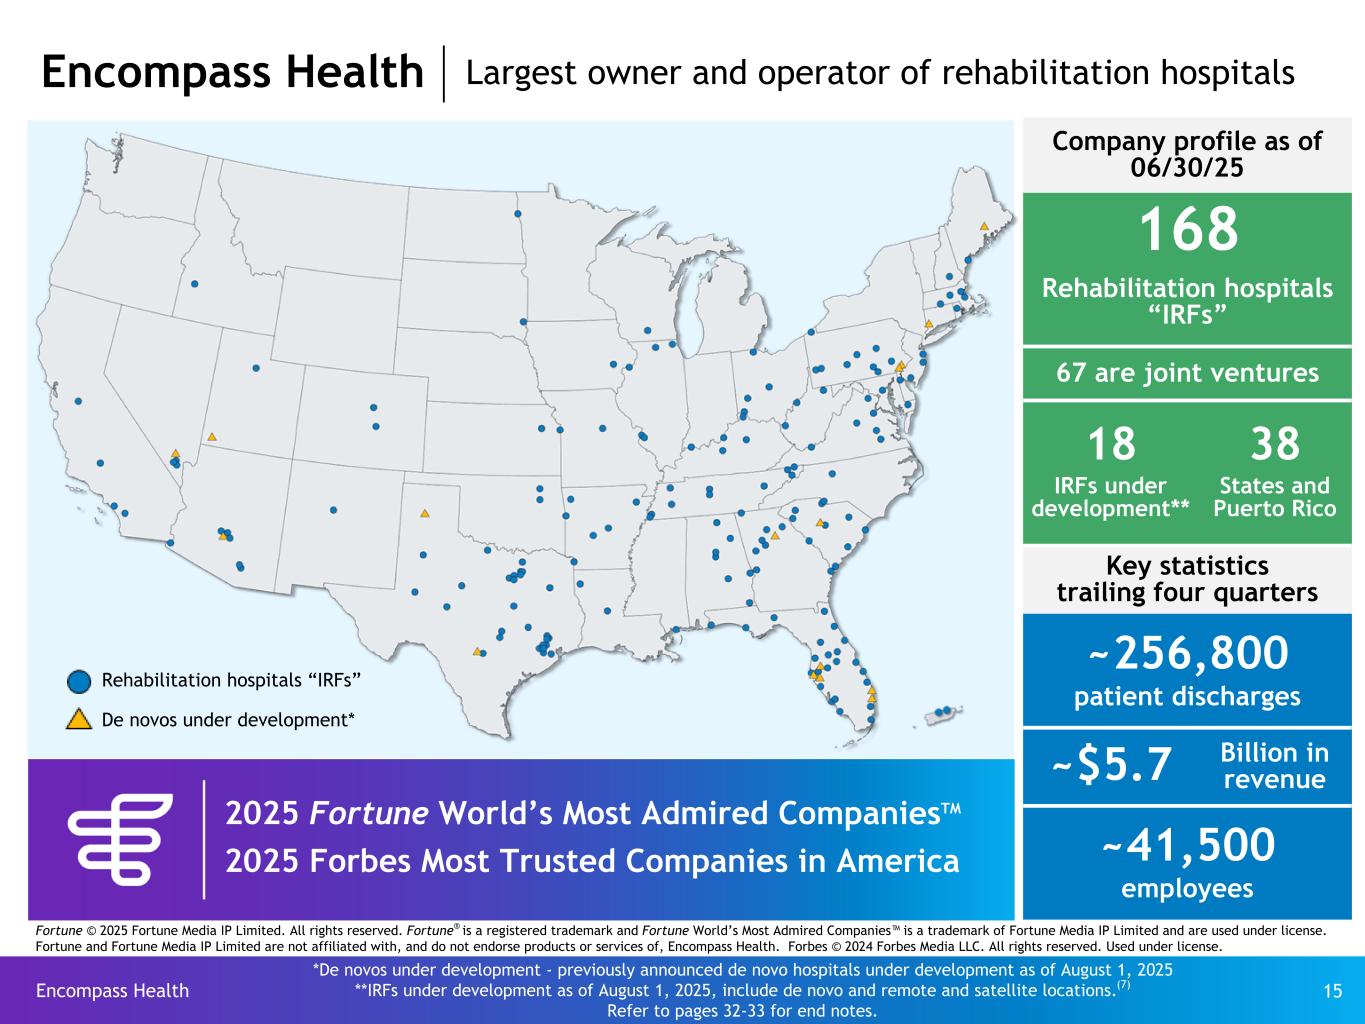
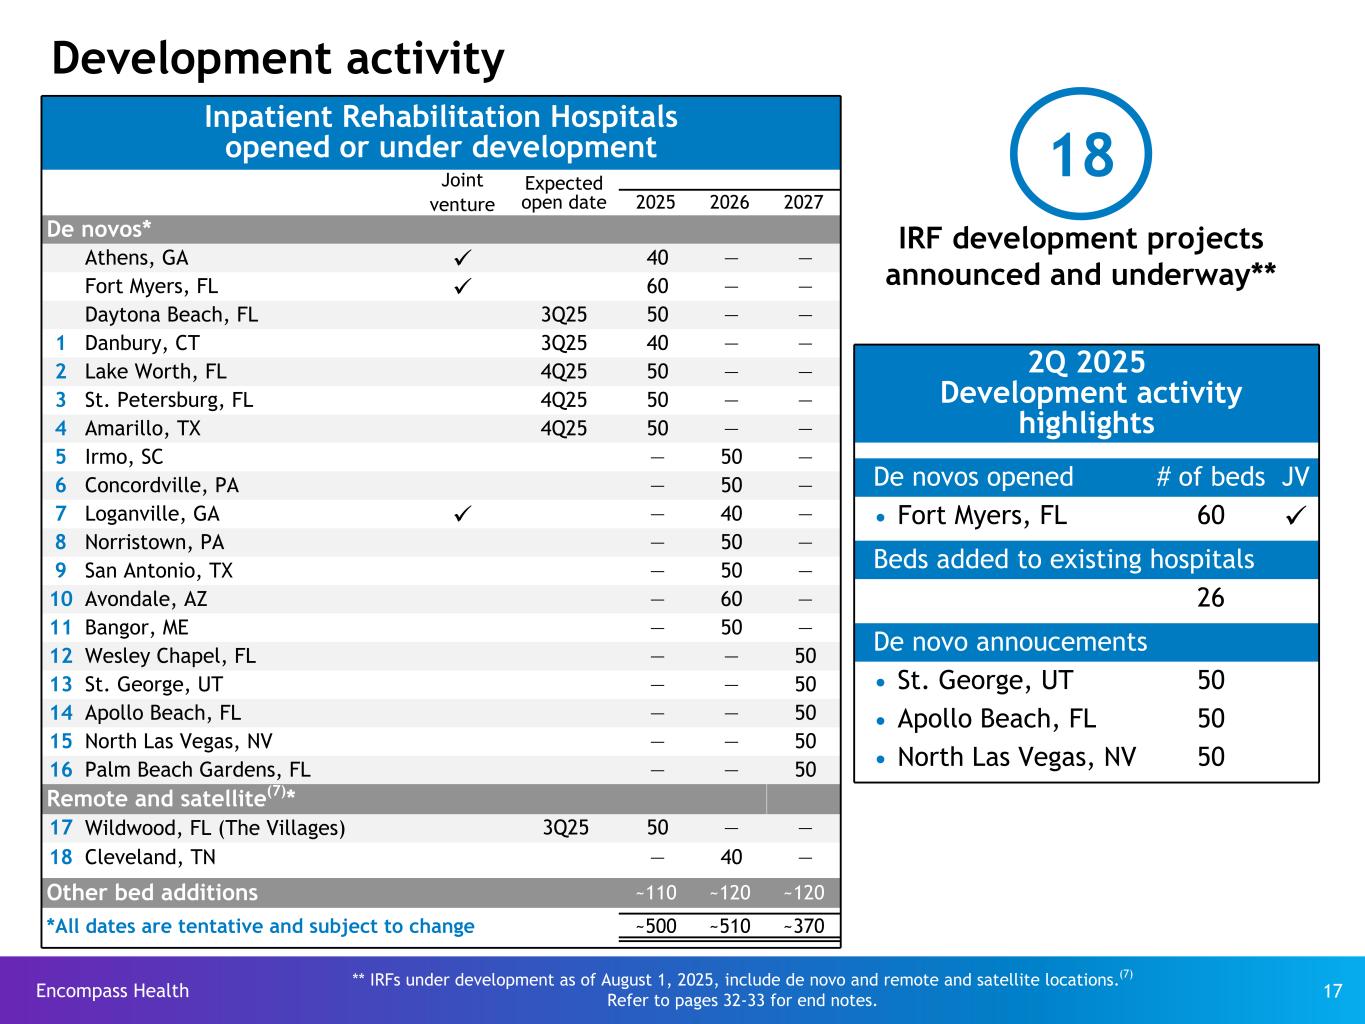
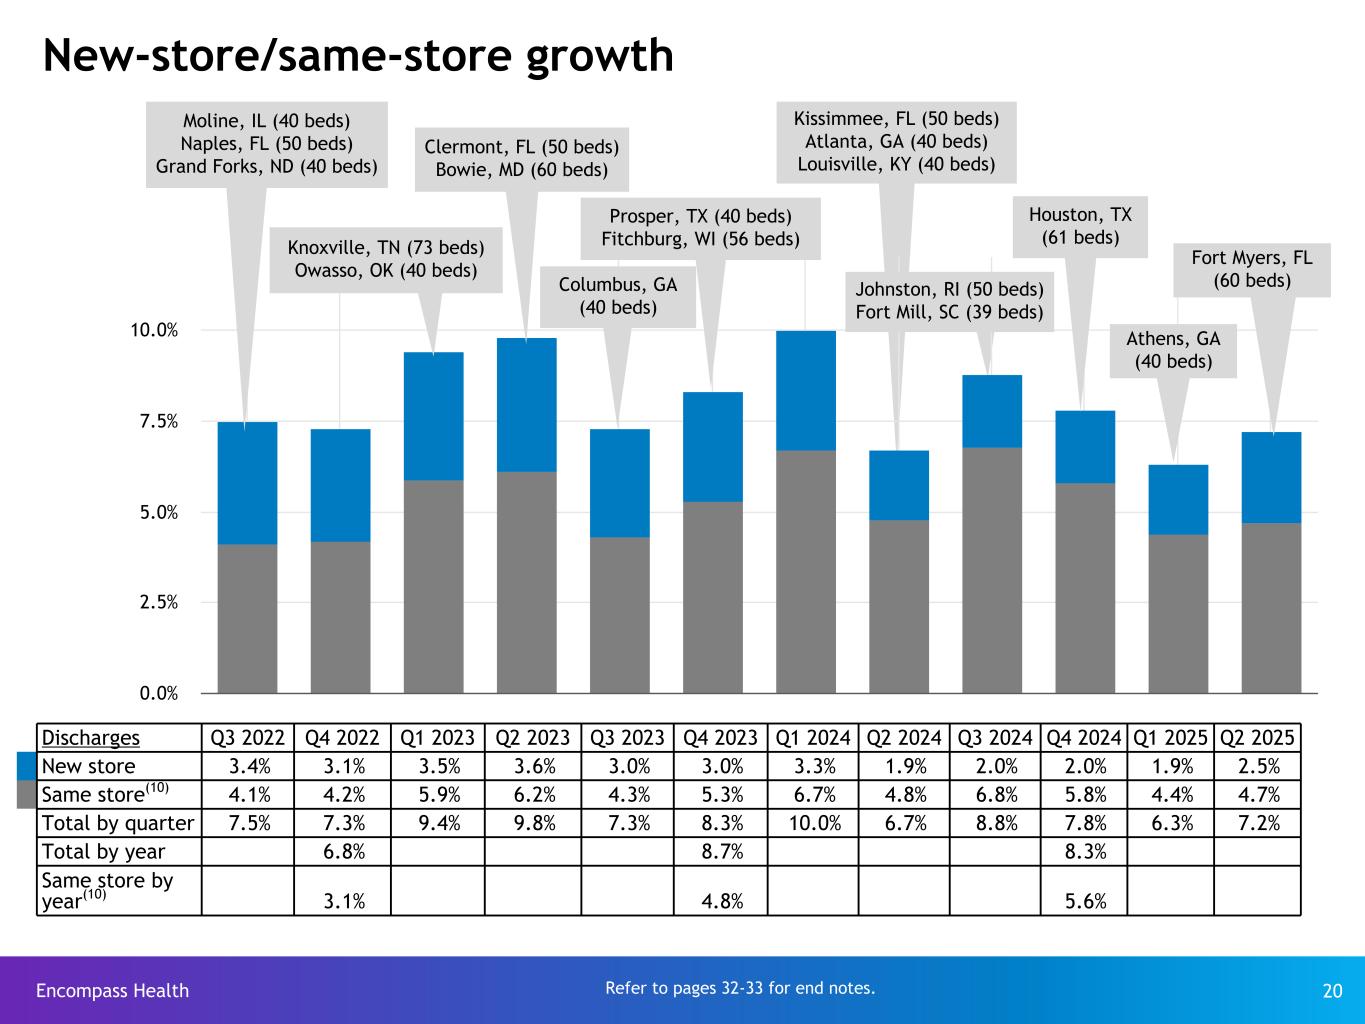
Mark, thank you, and good morning, everyone. Our discharge growth in the second quarter facilitated an increase of 12% in revenue and 17.2% in adjusted EBITDA. Total discharges for Q2 increased 7.2%, including 4.7% in same store. Our discharge growth was, again, broad-based across geographies, payers, and patient types. Our focus remains on successfully treating patients with complex medical conditions. Neurological conditions and stroke, for which we have extensive clinical expertise, grew 12% and 6.7% respectively in the quarter. Our dedicated and highly competent clinical teams continue to deliver outstanding patient outcomes. Our Q2 discharge to community rate was 84.8%, our discharge to acute rate was 8.5%, and our discharge to sniff rate was 5.8%. Our performance on each of these quality metrics is favorable compared to the industry average. In Q2, we opened a new 60-bed hospital in Fort Myers, Florida. We also added 26 beds to an existing hospital. In July, we opened a new 50-bed hospital in Daytona Beach, Florida, and added 20 beds to an existing hospital. Over the balance of the year, we plan to open five additional hospitals. Four de novos with a total of 190 beds and a 50-bed freestanding satellite hospital. and add another 30 to 50 beds to existing hospitals. Due in large part to our Q2 results, we are again increasing our 2025 guidance. The demand for inpatient rehabilitation services remains considerably underserved and continues to grow as the U.S. population ages. The Medicare beneficiary population is the fastest-growing segment of the U.S. population. It is estimated that by 2030, one in five Americans, more than 70 million people, will be aged 65 or older. The 65 or older population has been growing consistently at a kegger of approximately 3%. The average age of a Medicare beneficiary patient is 77 years old, and the age 75-plus population is growing at approximately 4%. Yet the supply of licensed IRF beds in the U.S. has increased only nominally. As a result, the demand for treatment of complex medical conditions, such as stroke, necessitating IRF care intensity is significantly underserved. We treat more patients with IRF-appropriate conditions than any other provider. This allows us to develop and refine best-in-class clinical protocols, which are then extrapolated across our hospitals via our continuous best practice initiatives. The identification, development, and implementation of these clinical protocols is enhanced by our state-of-the-art information systems, including our IRF-specific electronic medical record. In addition to our strong performance on discharge community rate, we outperform industry averages on many quality, patient safety, and patient satisfaction measures, including patient's mobility at discharge, their ability to care for themselves at discharge, medication management, pressure ulcers or pressure injuries that are new or worsened, and patient net promoter score. Referring hospitals know they can reliably send complex patients to our hospitals for post-acute services. Our attractiveness as a partner to acute care hospitals is further evidenced by the fact that 67 of our 169 hospitals are operated as joint ventures. On August 1st, 2025, CMS released the 2026 IRF Final Rule. This included a net market basket update of 2.6%, which we estimate would result in approximately 2.7% increase in net revenue per discharge for our Medicare patients beginning October 1st, 2025, based on our current patient meds. With that, I'll turn it over to Doug.
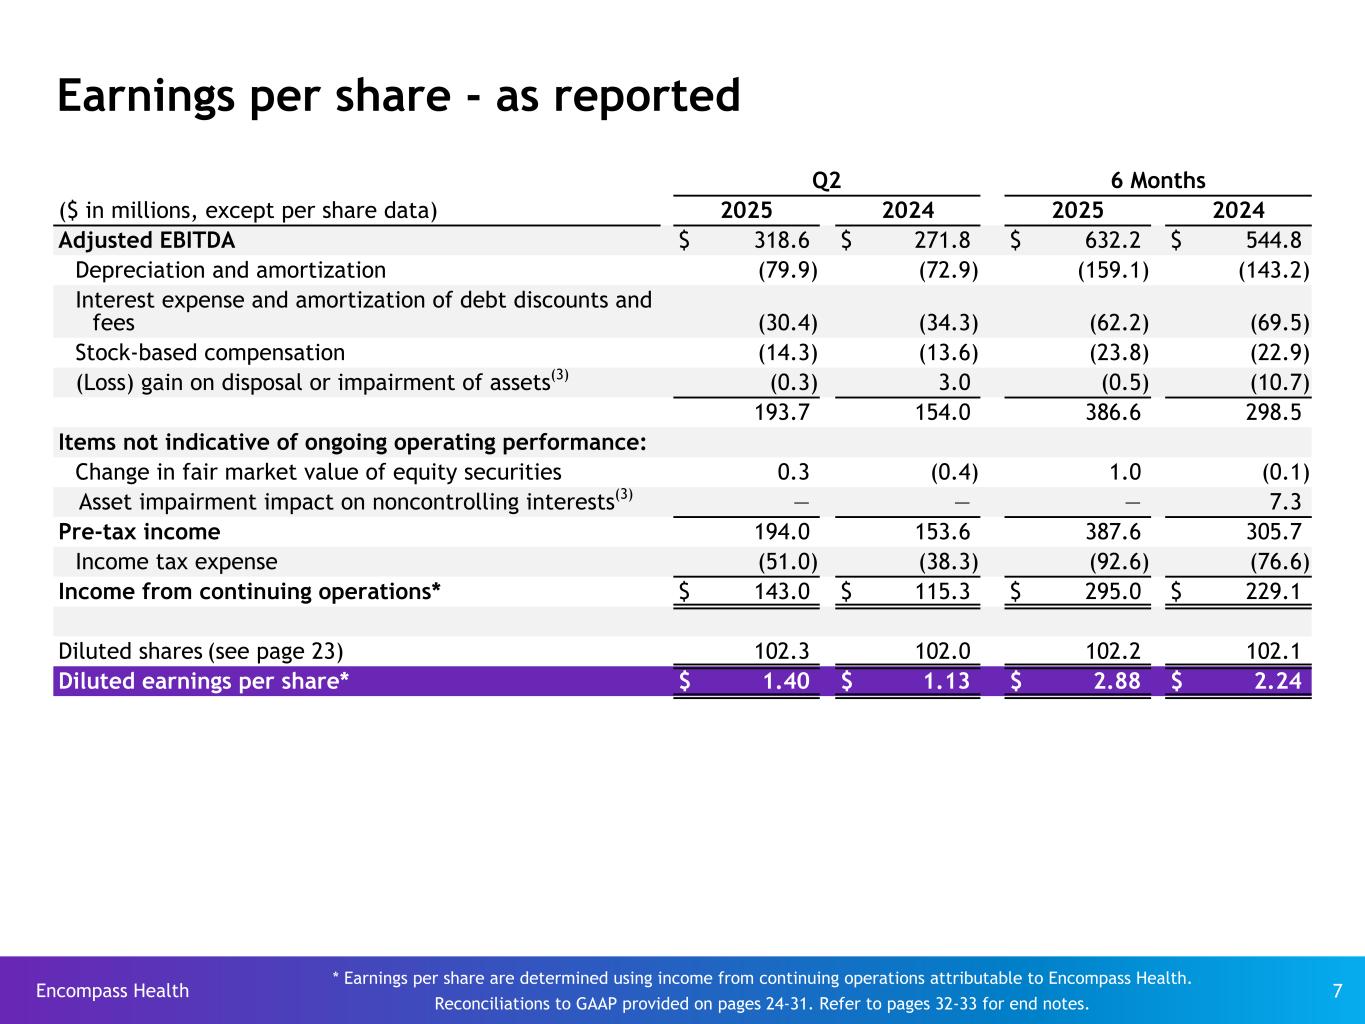
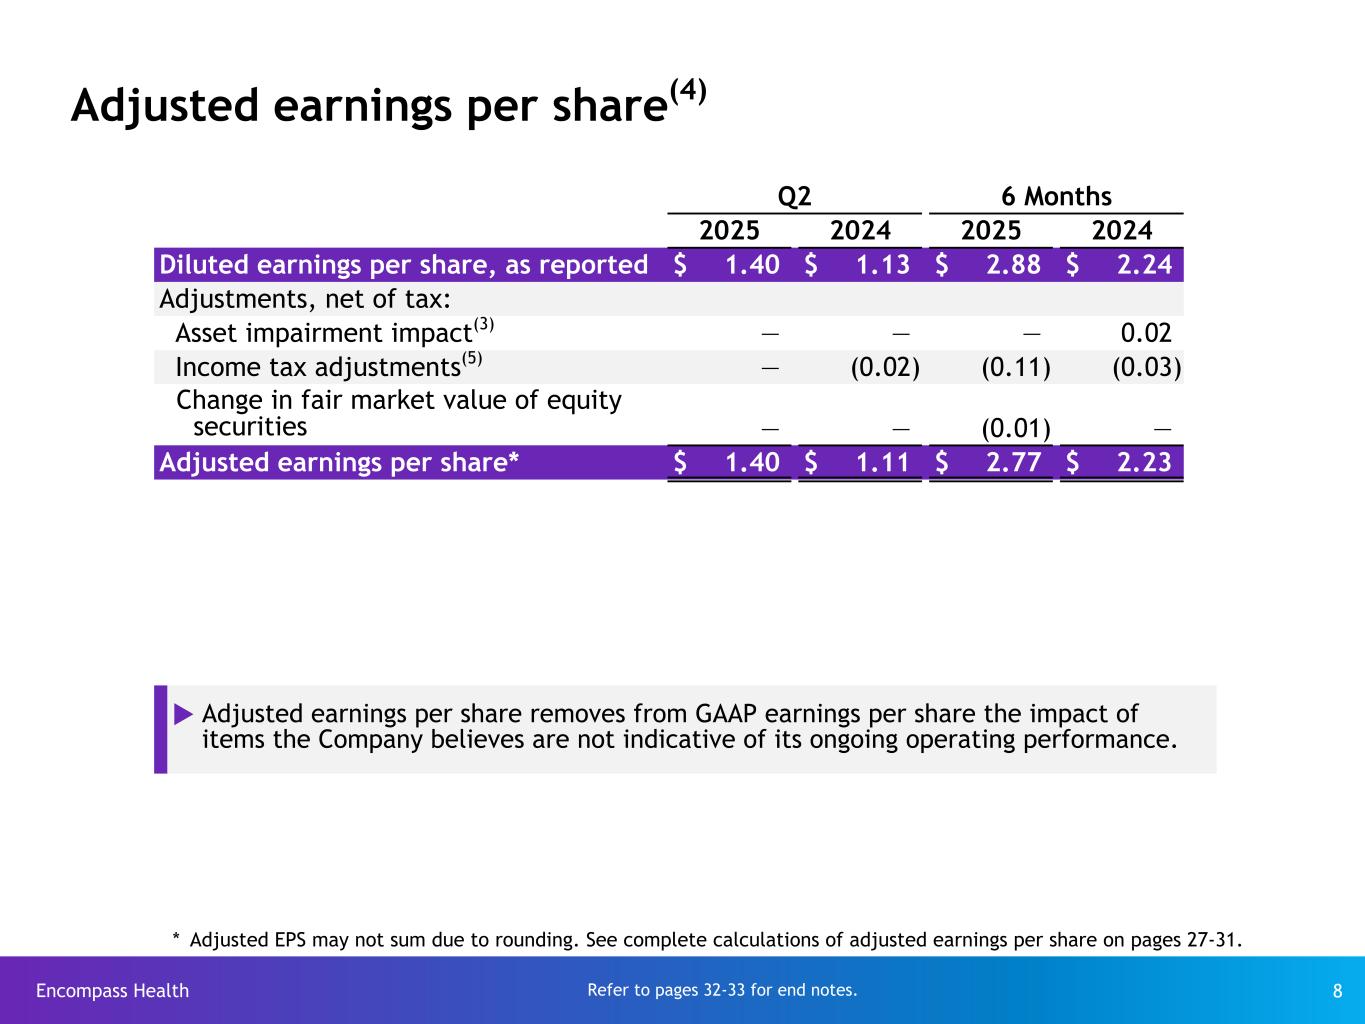
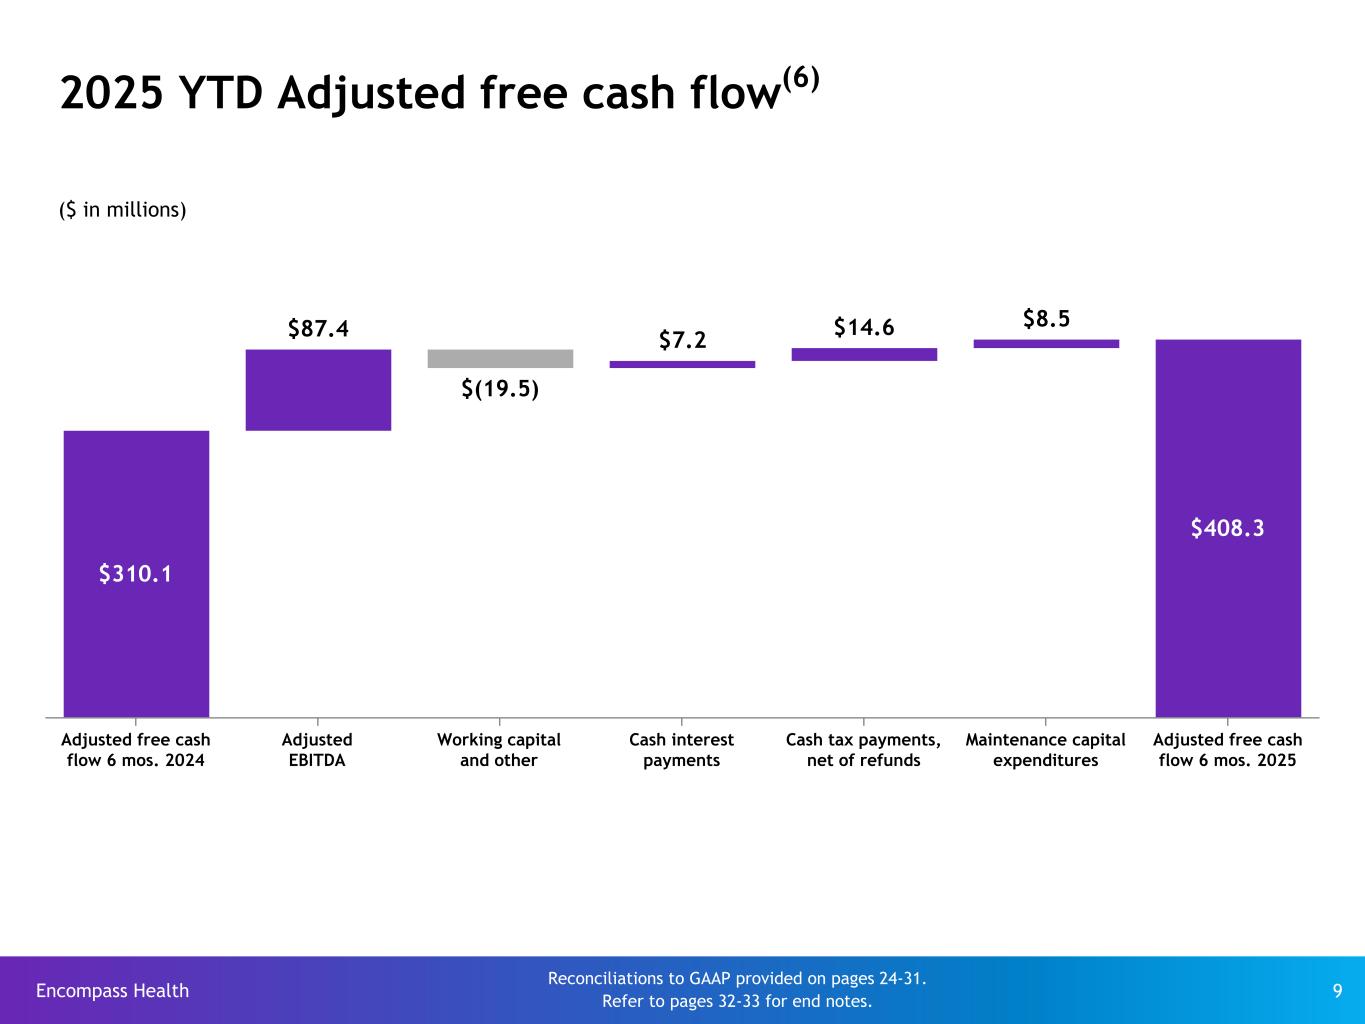
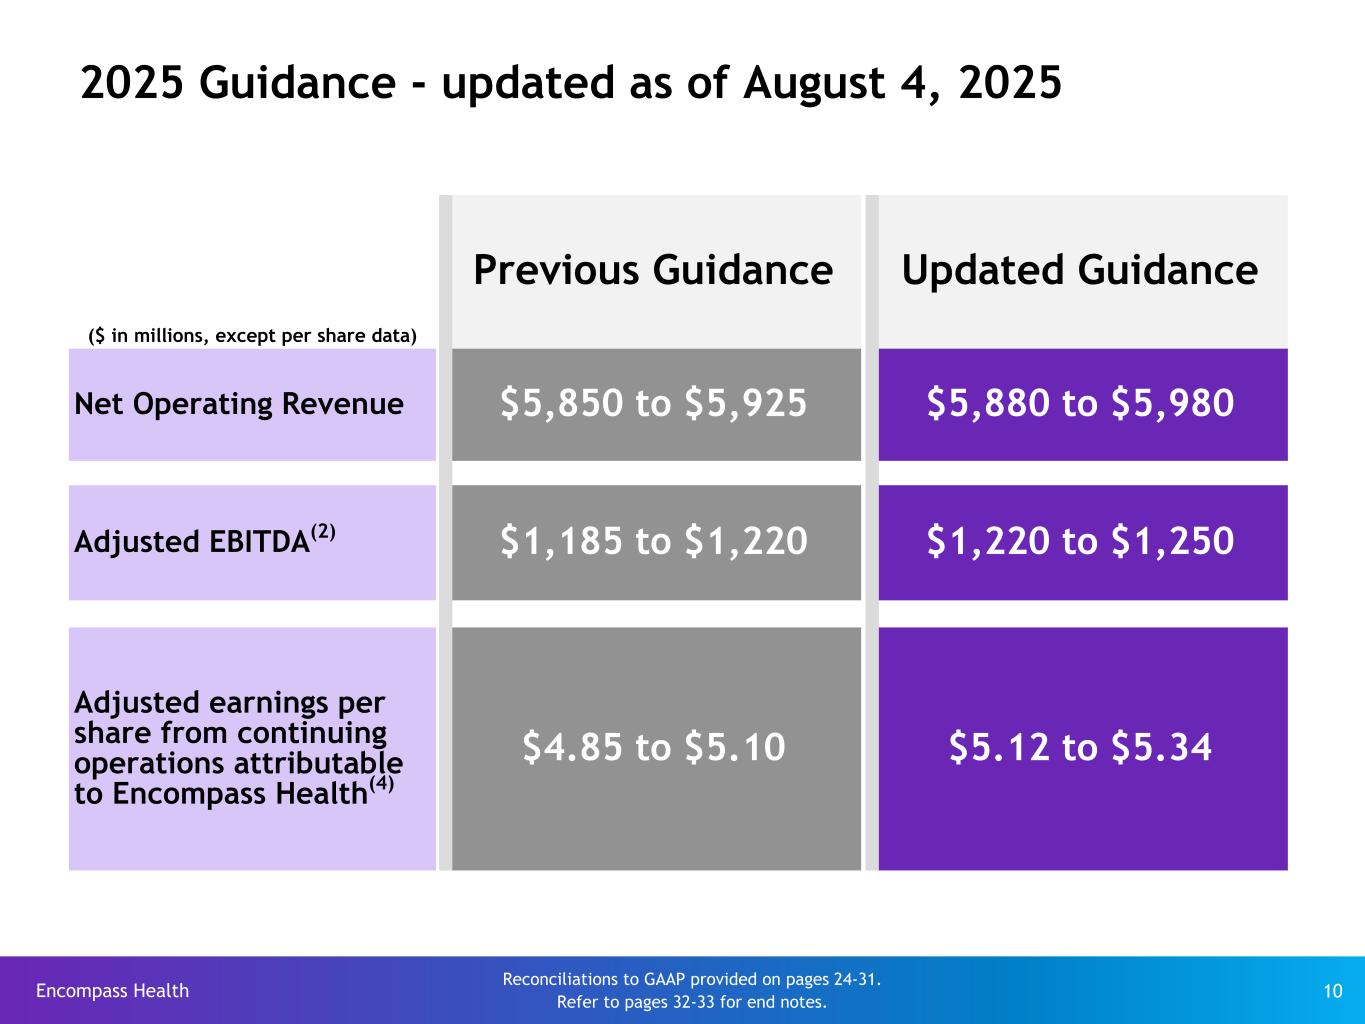
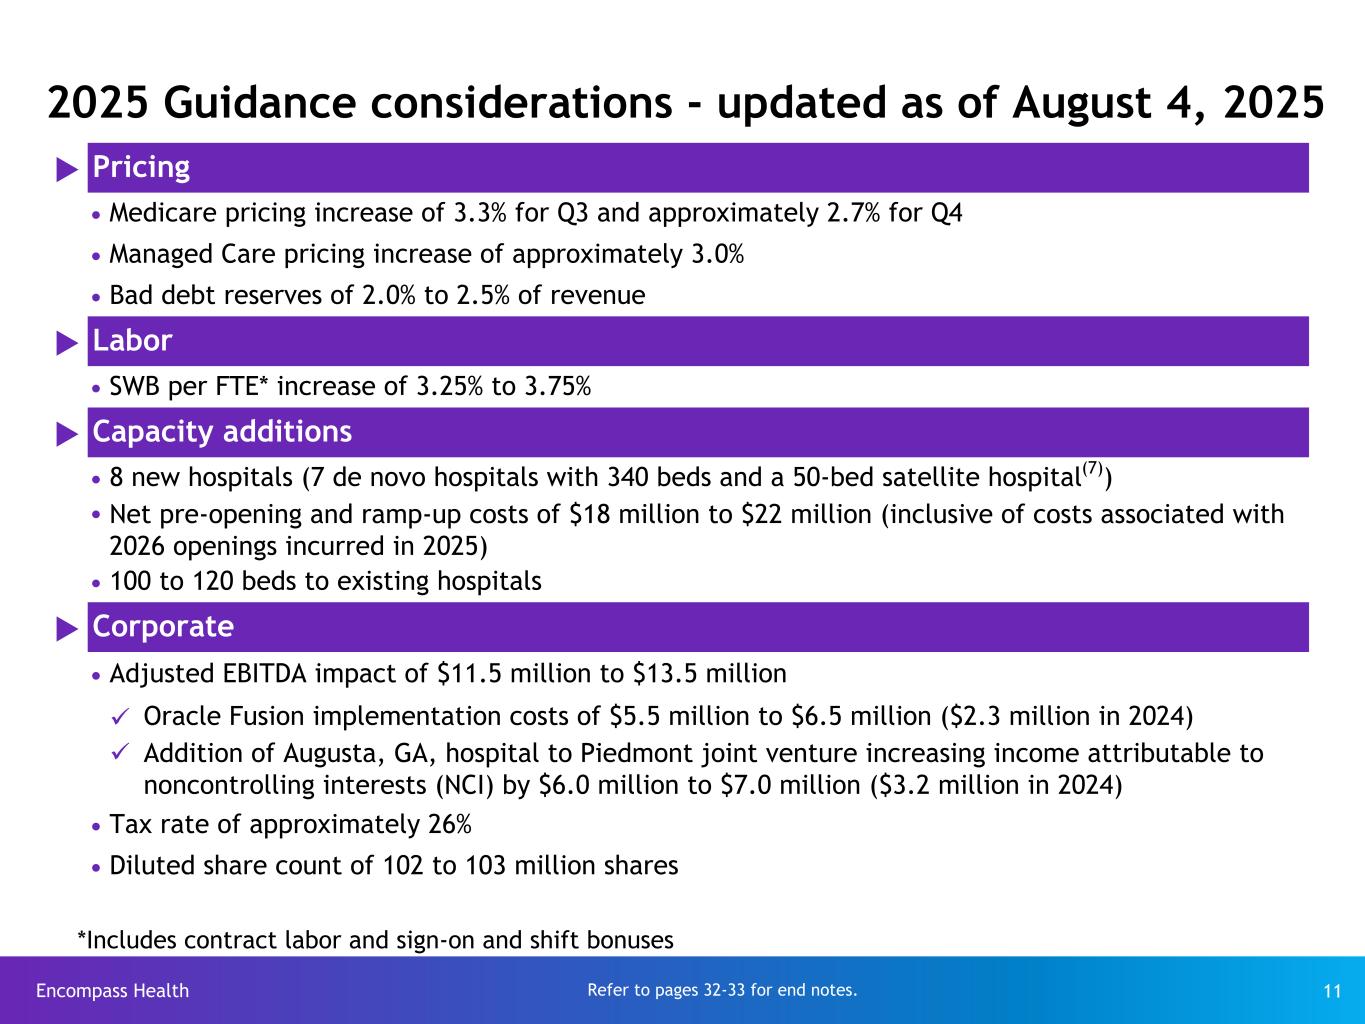
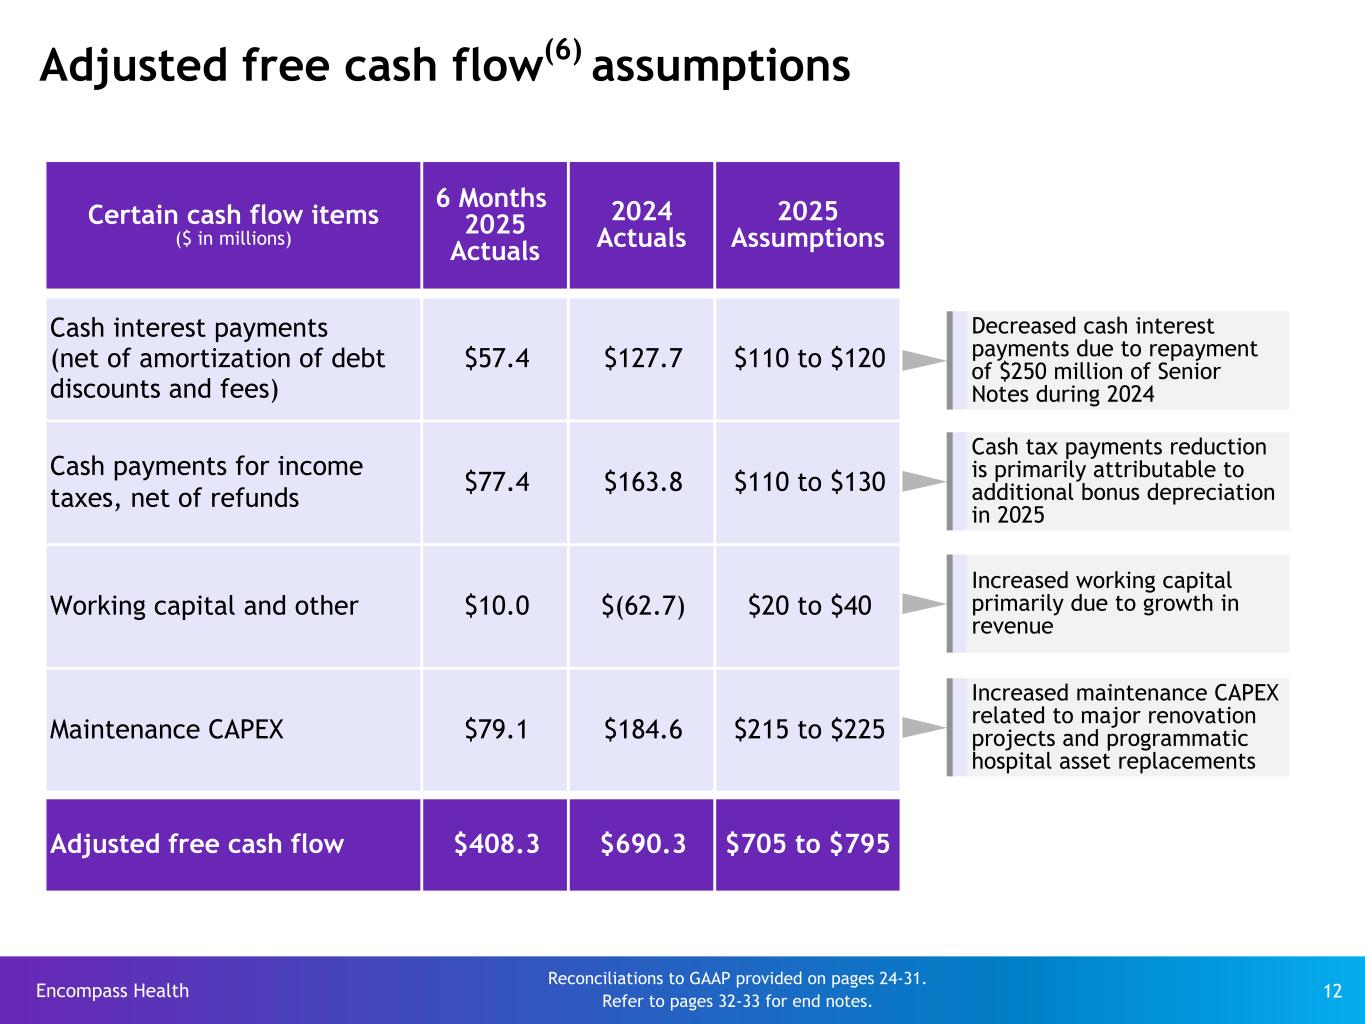
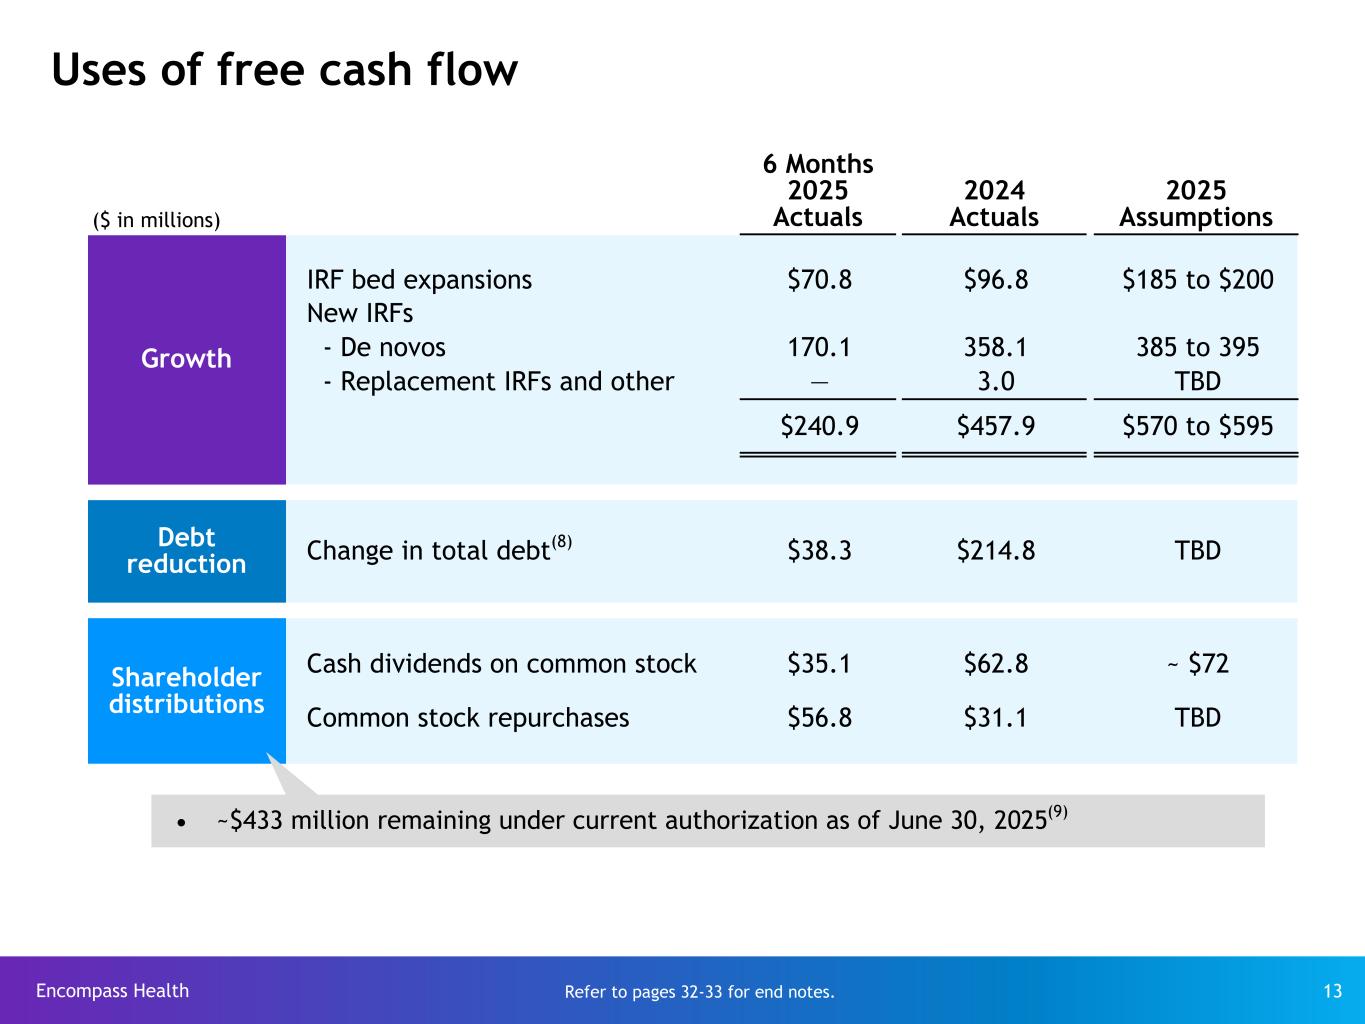
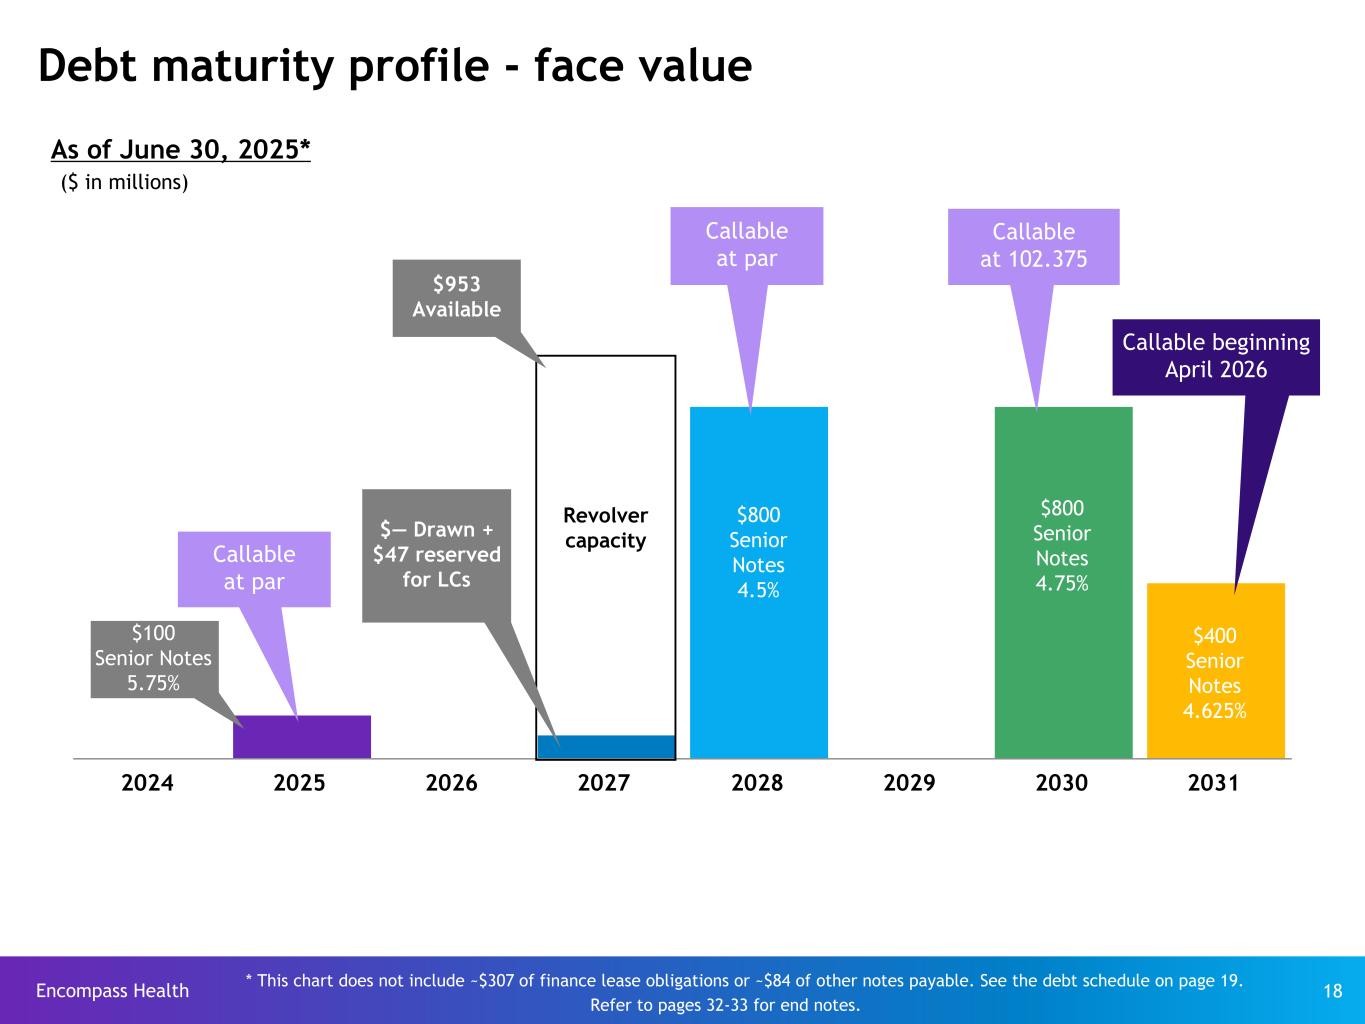
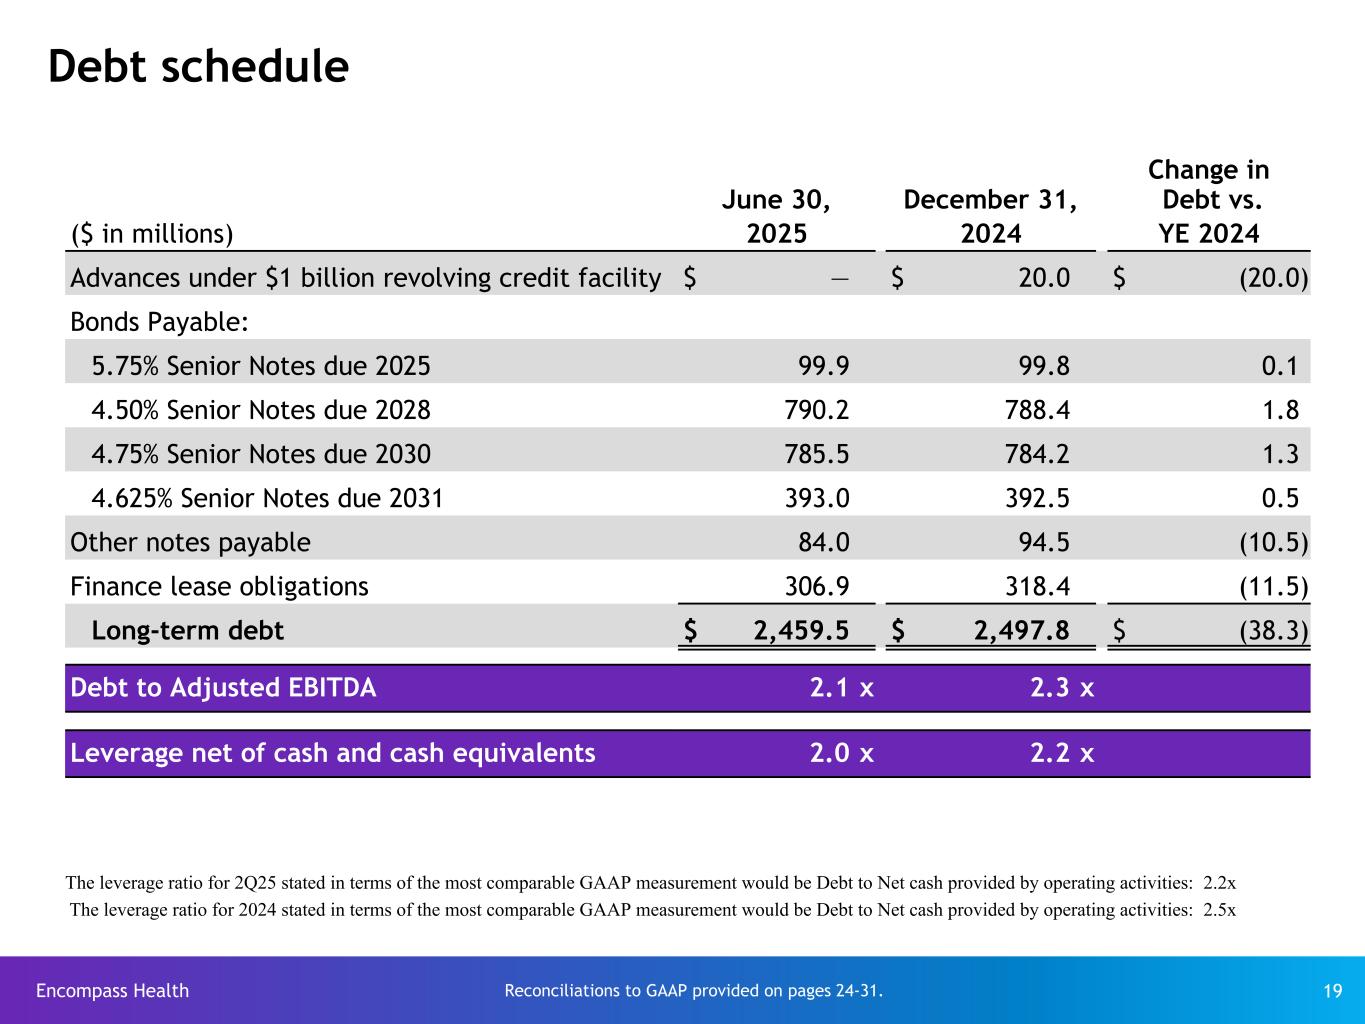
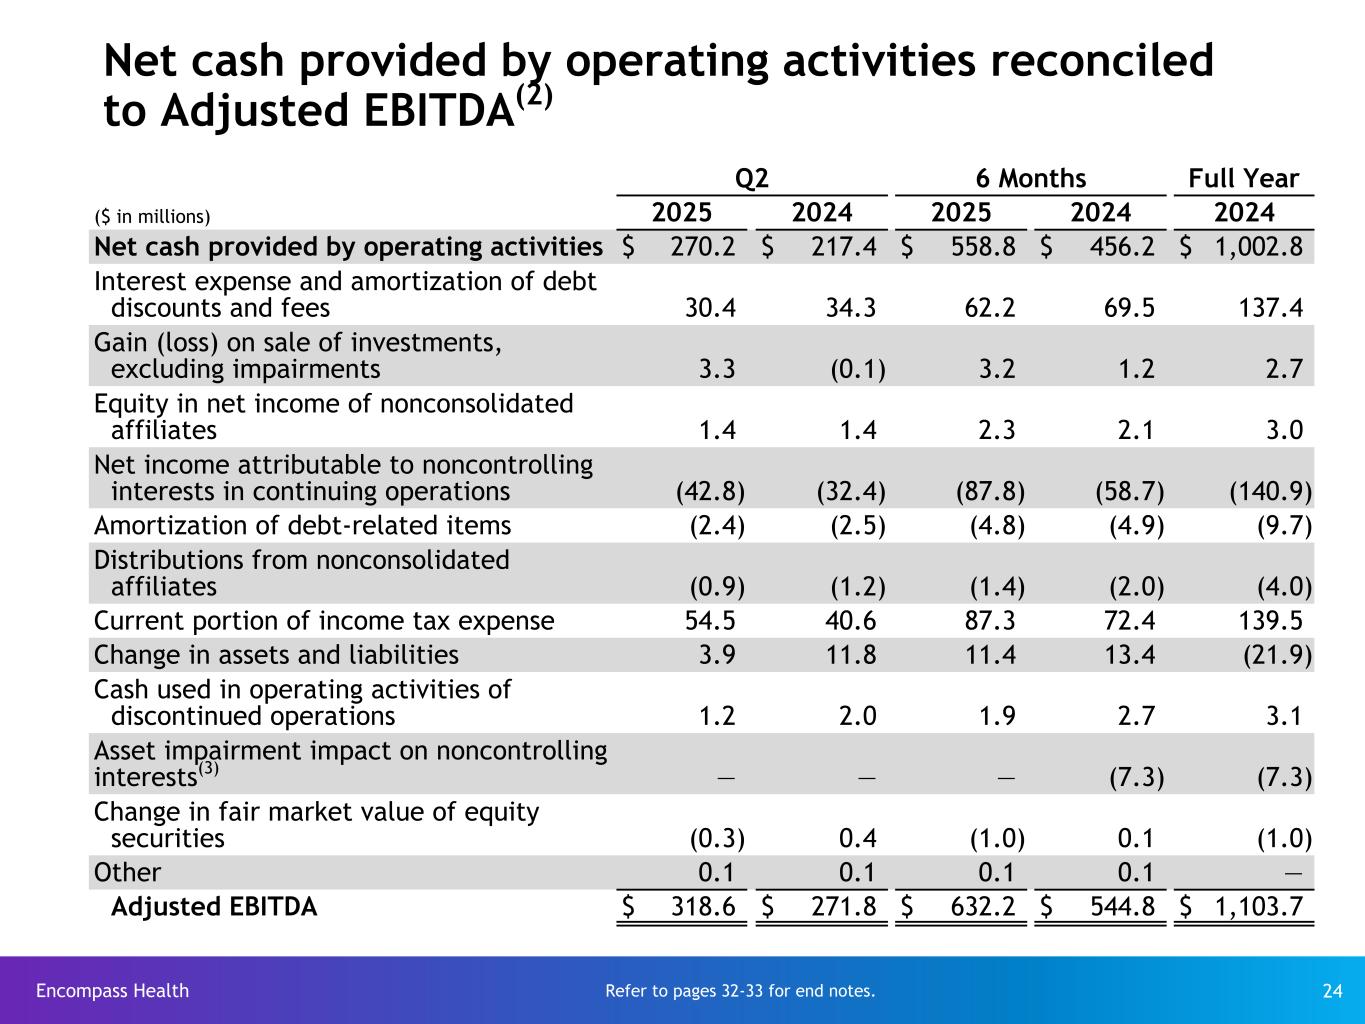
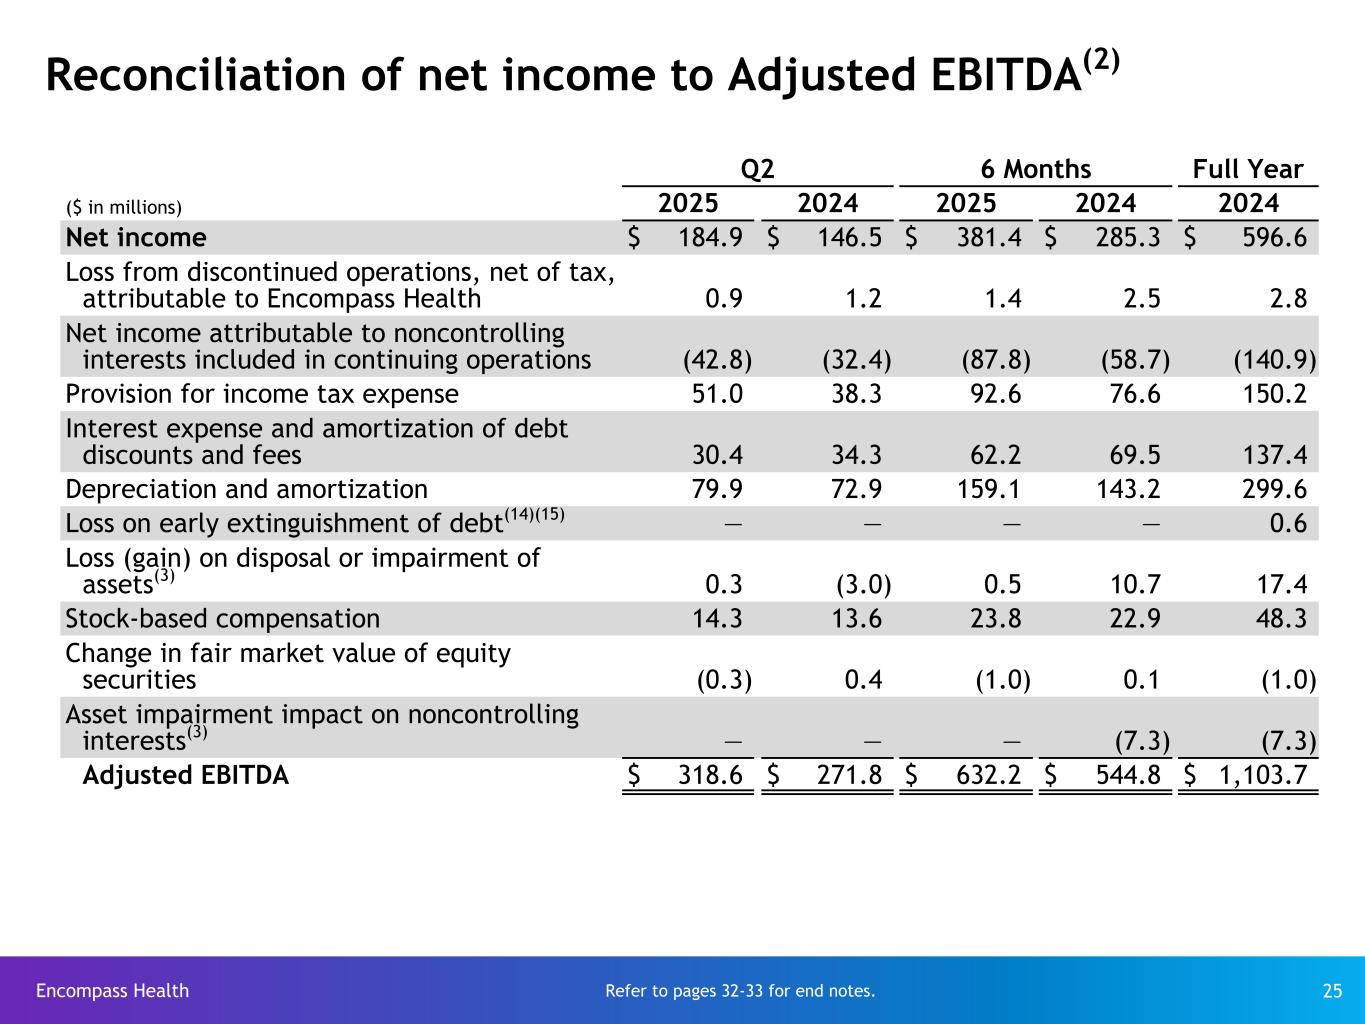
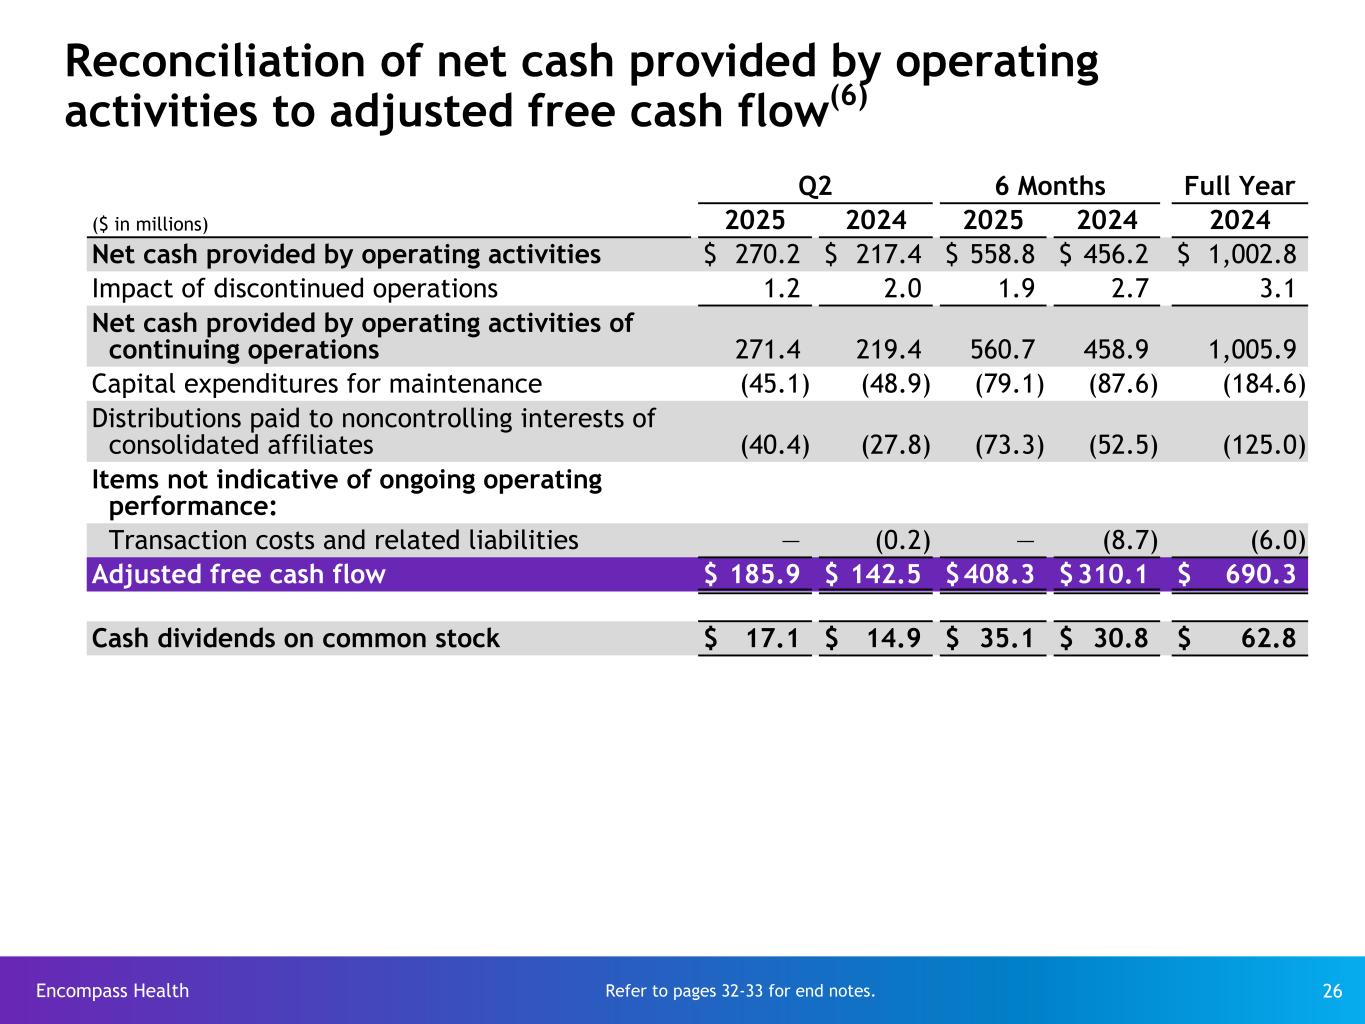
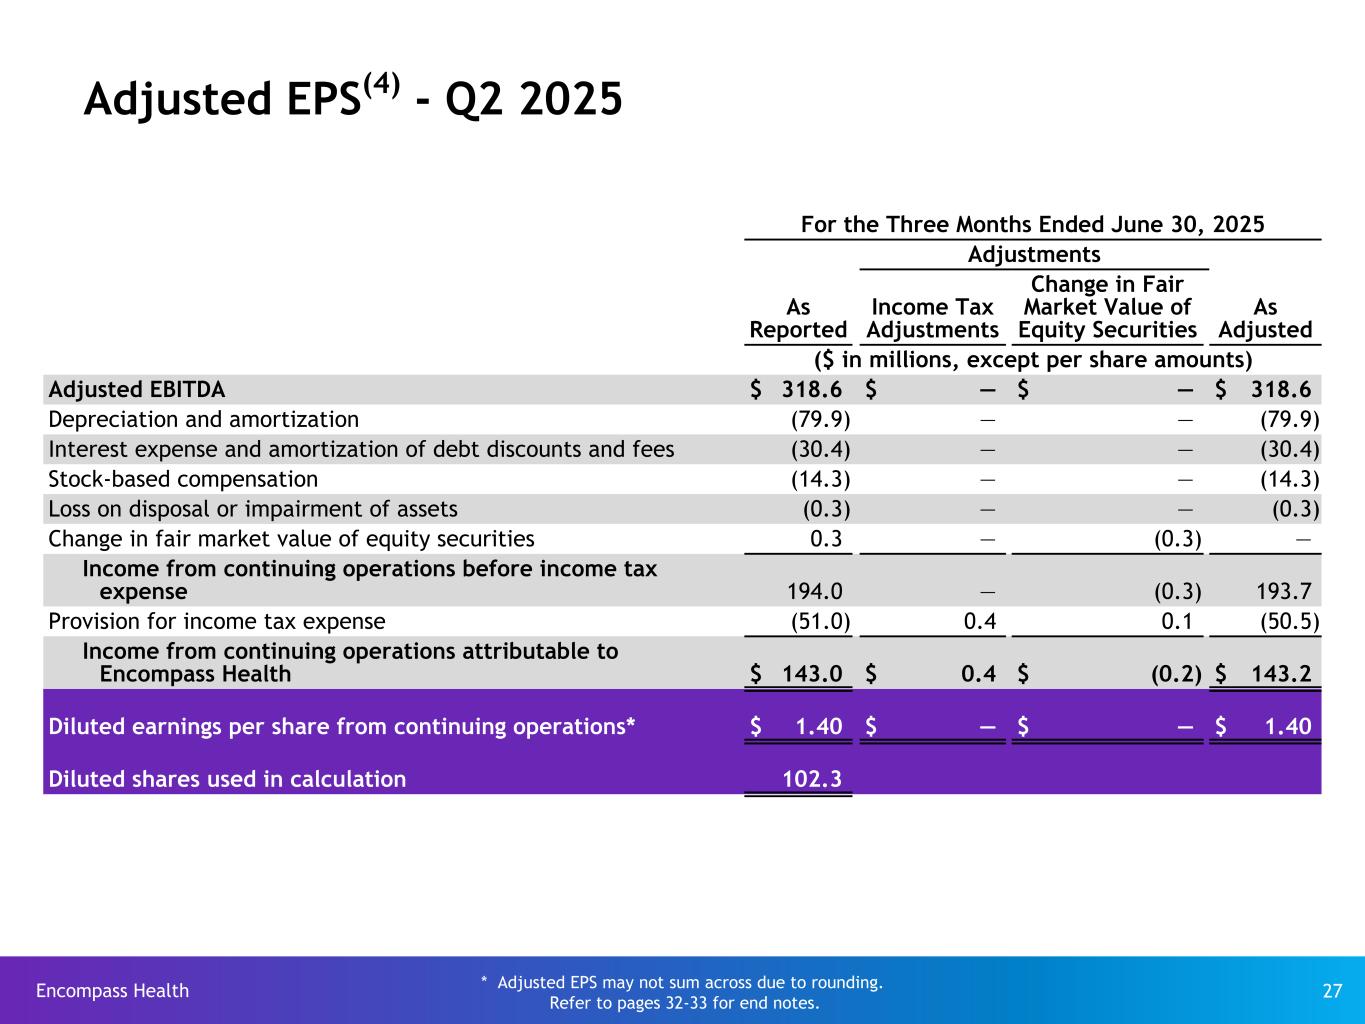
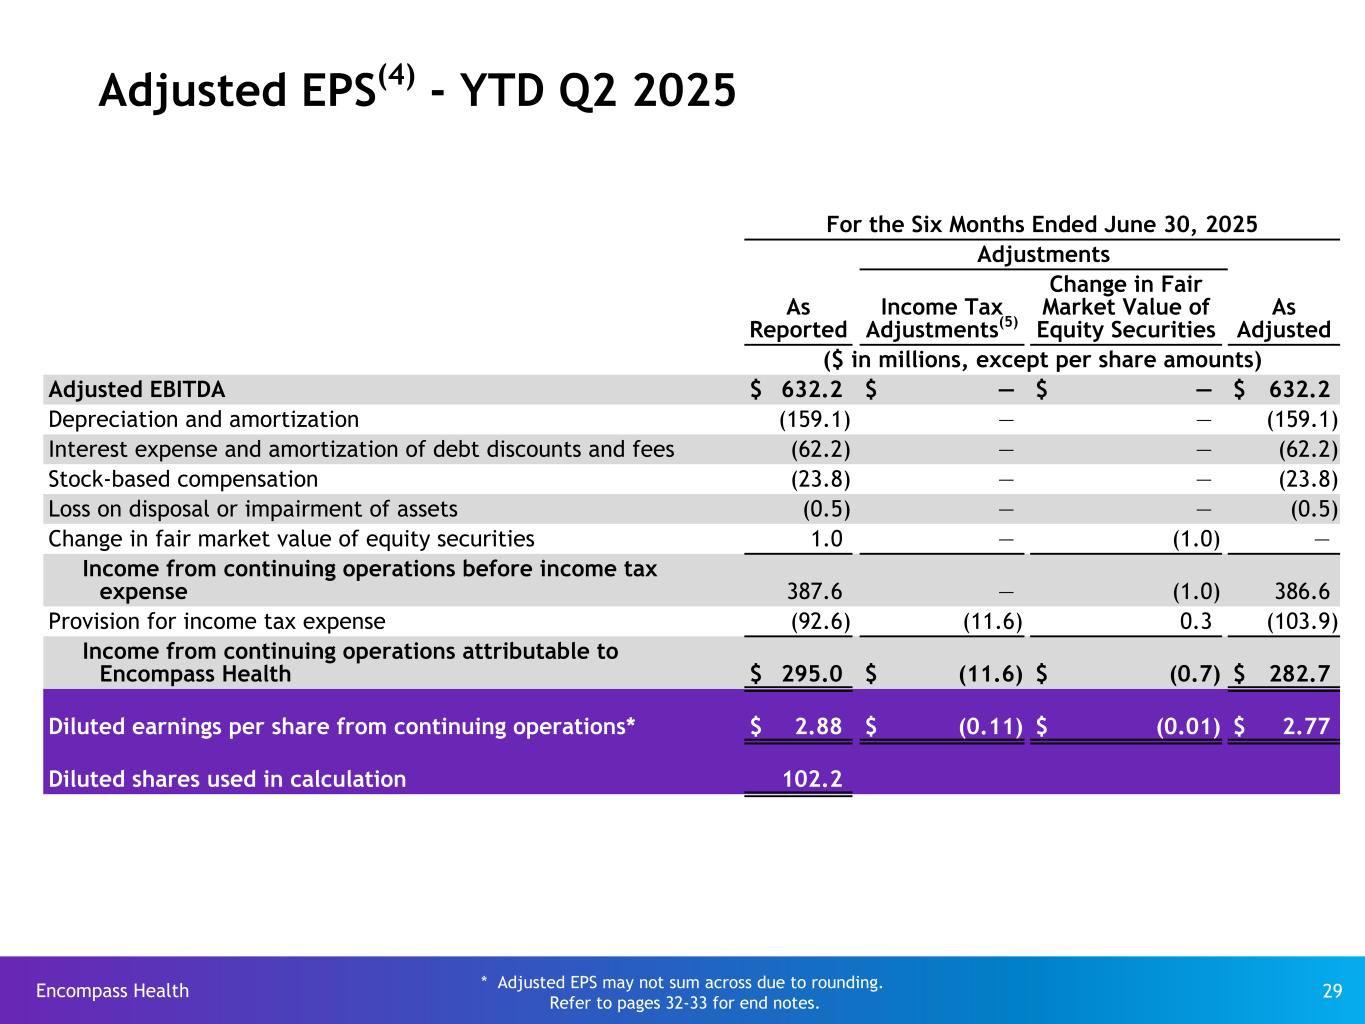
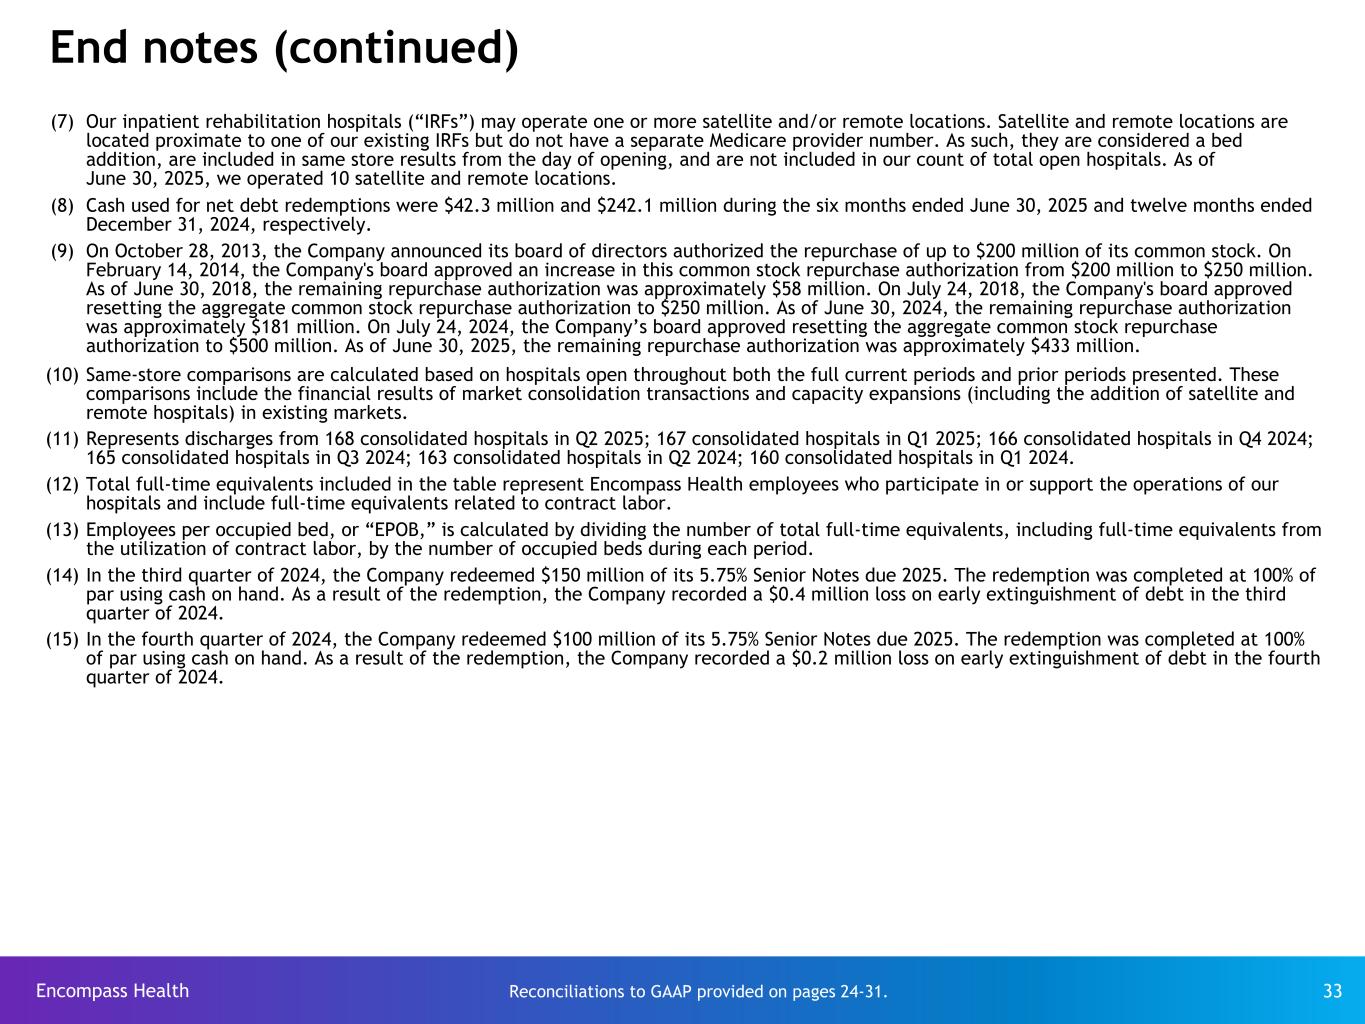
Thank you, Mark, and good morning, everyone. Revenue for the second quarter increased 12% to $1.46 billion, and adjusted EBITDA increased 17.2% to $318.6 million. The revenue increase was comprised of 7.2% discharge growth and a 4.2% increase in net revenue per discharge. Q2 net revenue per discharge benefited from a decrease of 90 basis points in bad debt expense to 2 percent. Recall that Q2 24 bad debt expense included reserves associated with significant increase in prepayment claims reviews under TPE. Q2 FWB per FTE increased 4 percent. Calories and wages per FTE, excluding contract labor and sign-on and shift bonuses increased 3.4 percent. Contract labor and sign-on and shift bonuses declined by $4.9 million, or 15.1 percent. Contract labor FTEs represented 1.3 percent of total FTEs. Q2 benefits expense per FTE increased by 18 percent. Benefits expense growth continues to be driven by an increase in the frequency of high dollar medical claims. We expect group medical expense growth to moderate in the second half of the year as we anniversary the increase we experienced in 2024. Net pre-opening and ramp-up costs were $4 million in Q2, taking the first half total to $6.1 million. We expect these costs for the full year to be in a range of $18 to $22 million. Q2 adjusted free cash flow increased 30.5% to approximately $186 million, bringing year-to-date adjusted free cash flow to approximately $408 million, a 31.7% increase from the first half of 2024. On the basis of our strong Q2 performance and the tax benefit of additional bonus depreciation resulting from recent legislation we now expect 2025 adjusted free cash flow of 705 to 795 million our leverage in liquidity remained very favorable net leverage at quarter end was two times we ended the quarter with approximately $100 million in unrestricted cash and in excess of $950 million available on our $1 billion revolving credit facility. During the second quarter, we repurchased approximately 232,000 shares of our common stock for $24.7 million. We recently announced an increase in our quarterly dividend, next payable in October, to $0.19 per share. As can be seen on page 13 of our supplemental materials, we have again increased our anticipated growth CapEx estimate for 2025. You will recall that following Q1, we raised our estimated 2025 spend by $15 to $20 million to pull forward a number of bed expansions in response to our increasing occupancy rates. We are now further increasing our 2025 estimated spend on vet expansions by $25 million, predominantly related to our recently announced CON approval for a freestanding hospital in Cleveland, Tennessee, which we intend to operate as a satellite of an existing hospital. Production of this fully prefabricated hospital will commence shortly. We also added $5 million to our anticipated 2025 DeNovo spend as we have elected to accelerate the land purchase of a future period DeNovo. Moving on to guidance, we are raising our 2025 guidance as follows. Net operating revenue of $5.88 to $5.98 billion. adjusted EBITDA of $1.22 to $1.25 billion, and adjusted earnings per share of $5.12 to $5.34. The key considerations underlying our guidance can be found on page 11 of the supplemental slides. And with that, we'll now open the lines for questions.
Operator
Thank you. At this time, if you would like to ask a question, please press star 1 now on your telephone keypad. To withdraw yourself from the queue, you may press star 2. You will be limited to one question and one follow-up question. Thank you. We'll take our first question from Andrew Muck of Barclays. Your line is open.
Good morning, Andrew. Good morning, Andrew.
Hi, good morning. Occupancy rates have increased more than 200 basis points year over year through the first half of the year. I think some of that has benefited from a shift to single bedrooms. But if you just look purely at your single room, single bedroom facilities, like where is mature occupancy and what levels are you comfortable operating at?
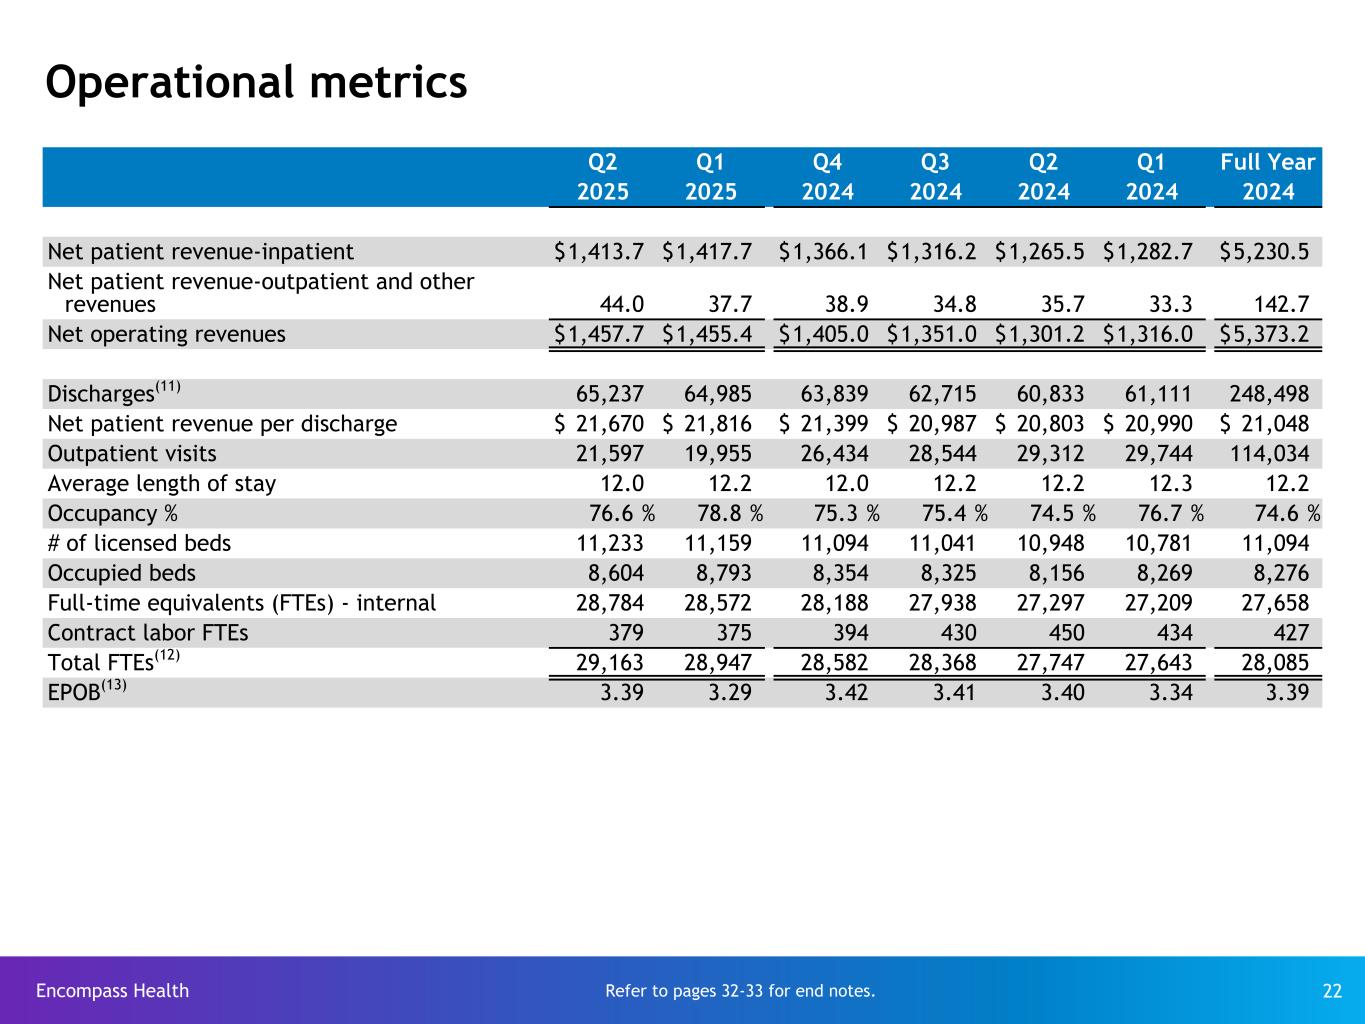
So it varies pretty widely across the portfolio, really, depending on the maturity of the hospital itself. First, to begin and give some of the specifics, the numbers that you're looking at, Andrew, at the end of 2020, 41% of the beds in our portfolio were private. At the end of the second quarter, we were at 56%. To your point, occupancy in Q2 was 76.6%. That's up 210 basis points over the second quarter of last year. When we're looking at an all-private room facility, when the occupancy starts to stabilize north of 80%, we start putting it on a list. We put it on list to start thinking about a future period bed expansion now the capacity in those facilities can run into the mid to high 90s because you're not facing issues of gender or germ compatibility it's lower than that for the the hospitals that are still semi-private rooms recall as we move into the back half of the year based on the opening schedule that mark highlighted during his comments you're going to see a little bit of a downward pressure on the occupancy because we've that new capacity coming on board great and maybe just as a follow-up there was some discussion of quality ratings in previous cms rate proposals but i don't think any of that has moved forward
yet just curious to get your thoughts on um those initiatives what you what would you be willing to whether you support that and where you do stand if those quality initiatives ultimately came to play Thanks.
Yeah, Andrew, it's Mark. So the quality initiatives, any change in those did not get included in the final rule. They did take out some of the ones around COVID that were COVID specific. I mean, we work with our trade associations. We are fine with looking at and including various quality measurements and think that we would do extremely well on that. We just want to make sure as an industry that we all agree on what those would be and how they would be measured.
Operator
Great. Thank you. Thank you. We'll take our next question from Matthew Gilmore of KeyBank. Please go ahead.
Hey, good morning. I just wanted to do a quick follow-up on Andrew's question around quality. Can you just remind us how you share your quality results with different stakeholders? I guess I was thinking referral sources and JV partners. And are there any particular areas of quality that are sort of most relevant or important to those stakeholders?
Yeah, so we work closely with Joint Commission. And as a matter of fact, they do our Medicare validation surveys for all of our new startup de novos. And relative to outcome metrics, the ones that we really focus on and share, although with our joint ventures, you know, we can go as deep as they want to. but the ones that are really focused on are discharge community discharge to acute discharge to sniff and then we always include the patient satisfaction measurement with the net promoter score those have all been prioritized by medicare in the past i think they are a good representation of the functionality of the patients at the time of discharge and as you heard me in my prepared to marks those are the ones that we do extremely well in uh we do well in others there are 16 measurements as part of the cms care compare uh but we're very proud of our of our outcomes and and have been so for many years and and continue to improve our outcomes matter of fact if you look at the discharge community uh as well as to acute those were all uh the highest we've had in recent quarters. So we're very proud of our quality and make it a priority.
You know, in addition to the acute care hospitals, obviously another important constituency are the physicians who refer patients to us, and many of us oversee the care of those patients when they come into our facility. And they tend to be very data-driven, and so we share with them a lot of the patient improvement scores that Mark cited in his comments earlier today. So we're looking at the gains that they have in functional capabilities and the ability to care for themselves and so forth. And again, that's all, those are very numerically driven scores that physicians like to see and that they really study very hard.
Great. I appreciate that. And then I wanted to ask a follow-up on payer mix. It seems like the Medicare fee-for-service mix was pretty stable this quarter, maybe managed care ticked up a little bit, and I noticed you increased, I think, your managed care pricing assumption. I was curious if there was a story around that to tell, or, you know, what's driving that trend, or perhaps it's just within kind of normal variation of what you'd expect.
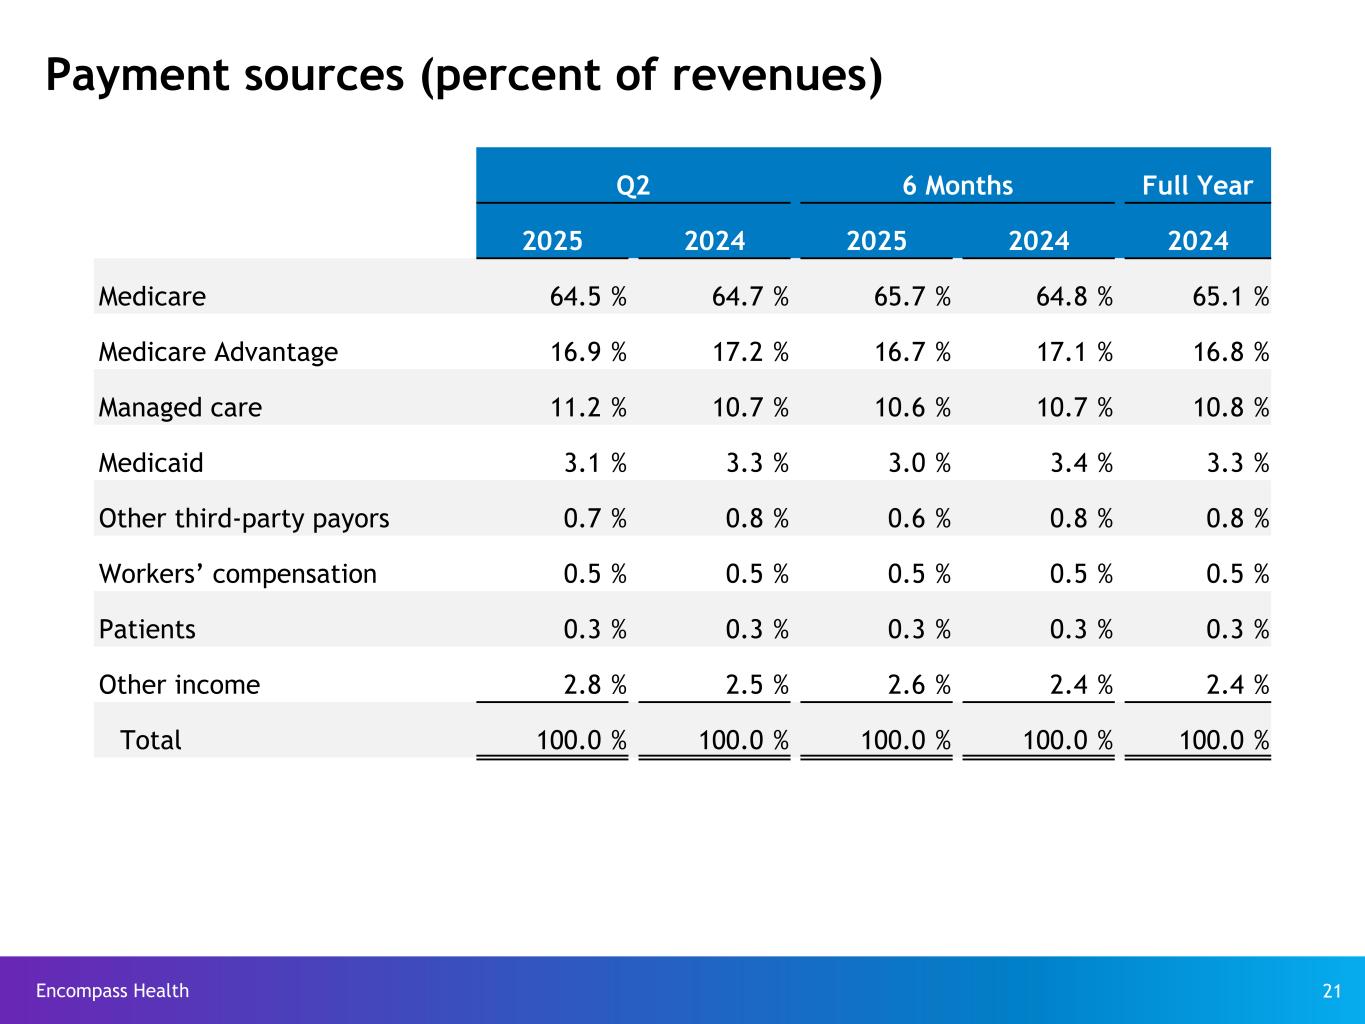
There actually is a bit of a story there, and that has to do specifically with the VA Community care network contract. And so we have been seeing and that again is administered by two companies in the U.S. One is a division of Optum and the other is TriWest. More of our hospitals fall under the administration of Optum. When I say it's administered by those companies, it is on behalf of the VA, but unlike Medicare Advantage, the VA is still the party that is making authorization decisions regarding patients that are referred to that network. So over the last three years, we've seen growth in that line of business that's been in the mid-teens, and it now comprises almost 18% of our overall managed care business, and importantly, it pays at the Medicare CMG. So, that has been a driver of the growth and the managed care and also the improved pricing.
Operator
Thank you. We'll take our next question from Pito Chickering of Deutsche Bank. Your line is open.
Hey, guys. I take my questions next quarter. Let me get the EBITDA on the first half. Can you sort of bridge to us sort of what the implied guidance is? How would you be thinking about startup losses in the back half of the year, changes to employee-occupied bed in the back half of the year, or any other changes as we bridge the first half of the year to the back half of the year?
Yeah, absolutely. And so as we move into the back half of the year, we do expect to incur the lion's share of pre-opening and ramp-up costs. Again, if you're at the midpoint of the $18 to $22 million for the year and you subtract out the $6 million in the first half, you're looking at about a $14 million number. We ran at a 2% bad debt number for the first half of the year. We hope that continues, but in our guidance assumptions, we've assumed that there is some resumption of TPE activity, which would cause that number to go higher. So, you know, pick your point for the second half of the year, between 2% and 2.5%, you'd see an increase there. It's a smaller number, but we had favorable insurance adjustments of about $4 million in the first half of the year. we're not necessarily anticipating that those would continue. Even though it was down on a year-over-year basis, the net EBITDA impact from provider taxes was about $7 million. There's no guarantee that that continues in the second half of the year. And then the item that you suggested is we ran it at 3.34 EPOB in the first half of the year. We expect that to be closer to 3.40, particularly given the new capacity coming on board in the in the second half of the year going the other way is the q4 pricing update at least a portion of which will be offset by our annual merit cycle i think those are most of the pieces pito i hope that was responsible yeah uh that's perfect uh can you uh uh you look at the script you talked about it but what was the premium labor in the first quarter versus second quarter sort of sequentially just looking of the contract employees, they're basically flat sequentially.
I'm wondering if you saw a reduction over time as you brought on more employees in the second quarter, and then any other comments you have on the ease of hiring today versus turnover on the full-time employees. Thanks.
Yeah, so sign-on and shift bonus from Q1 to Q2. In Q1, it was $12.2 million. It was $10.9 in Q2. In terms of the shift bonus component, it was 10.7 in Q1 and 8.4 in Q2. So nice improvement there. With regard to contract labor, we went from 16.4 in Q1 up just slightly to 16.7 in Q2. Contract labor FTEs, I think you actually hit this number, moved slightly from 375 to 379.
Peter, I'm going to ask Pat Stewart to weigh in on what he's doing in terms of labor. He and the operations team have been working real hard, specifically on the recruitment and the retention, as we've mentioned in past calls.
Thanks, Mark. So we continue to see strong hiring. You may recall a few years ago we centralized our talent acquisition function. So we have 83 full-time employees that do nothing but focus on bringing people into our organization, and that encompasses both recruiters as well as the recruitment marketing function. So we continue to see net hires up. We had 71 net hires in Q2, which is another strong quarter for us. And from a turnover perspective, we are hovering around pre-pandemic levels, just at 21%. That's up slightly from Q1, but it is well below the turnover rates that we saw during the pandemic. And our local teams are focused on making sure that the employees in their markets are paid competitively. We've also created a number of career ladders, and we're focused on enrolling as many folks that qualify for those into those ladders we have shown if we can get an employee a nurse specifically on the clinical ladder they're turning over about a quarter of the rate of our non-laddered nurses so the the other two things i'll point out is from a retention standpoint we've put some effort into workflow analysis just to make sure that we're reducing the burden on our clinical employees and making their workday as efficient as possible. And then another benefit of the centralized talent acquisition function is that with that recruitment function being centralized, our local HR folks have been able to focus more heavily on the engagement side, which has also helped retention.
I feel those turnover numbers were specific to nursing, which obviously has been a huge focus for us too. I mean, we are also focused on therapy openings and making sure we retain our therapists as well. So I feel like we're making some continued progress here in what continues to be, you know, a challenging market out there.
Great. Thanks so much, guys, next quarter.
Operator
Thank you. We'll take our next question from Whit Mayo of Leer Inc. Partners. Please go ahead.
Morning, Whit. Hey, guys. Chris, maybe just to follow up on the hiring efforts, I was just thinking that we never talk about the physiatrist market, only nurses and therapists. How does that market look like today? And maybe talk about how you find bringing doctors into new markets.
Hey, I'm going to ask Pat to deal on that. I will say, before he gets on specifics, we have a team of physician recruiters here at Encompass, And that is somewhat centralized, but we've also had to use market and regional recruiters as well. I would say that overall the physiatry market is challenging but has been fairly stable over the last two to three years. So I'll let Pat give you some specifics.
Thanks, Whit. So just a couple of specifics. So from market to market, this can vary, but I would say the supply has stabilized, as Mark has alluded. In a number of our markets, we partner with or have established residency programs with universities that have helped from a recruitment perspective. And then we also have a strong component of internal medicine physicians that also have worked to become rehab physicians in markets that may be challenging to get a PM&R physician. So I would say we have been able to fill all the needs that we currently have. And as Mark alluded, we have a pretty strong recruitment team that focuses solely on this.
You know, it too remains a challenge. I will say over the last decade, we've seen a pleasant trend in what used to be 10 years ago, a lot of physiatrists primarily wanted to do outpatient and in some cases pain management. And then we've seen a nice trend in the last couple of years where, you know, these physiatrists are very interested in inpatient setting and treating complex patients. So that's been a nice little push as we've gone out to recruit doctors.
Okay. My follow-up is I'm looking at my model here, and it's got leverage now below two times now. and are we not at a floor where you should look to maybe hold it steady and take that excess capital and prioritize larger buybacks? I appreciate the increase in the growth capex, but it seems like you can probably balance both. Thanks.
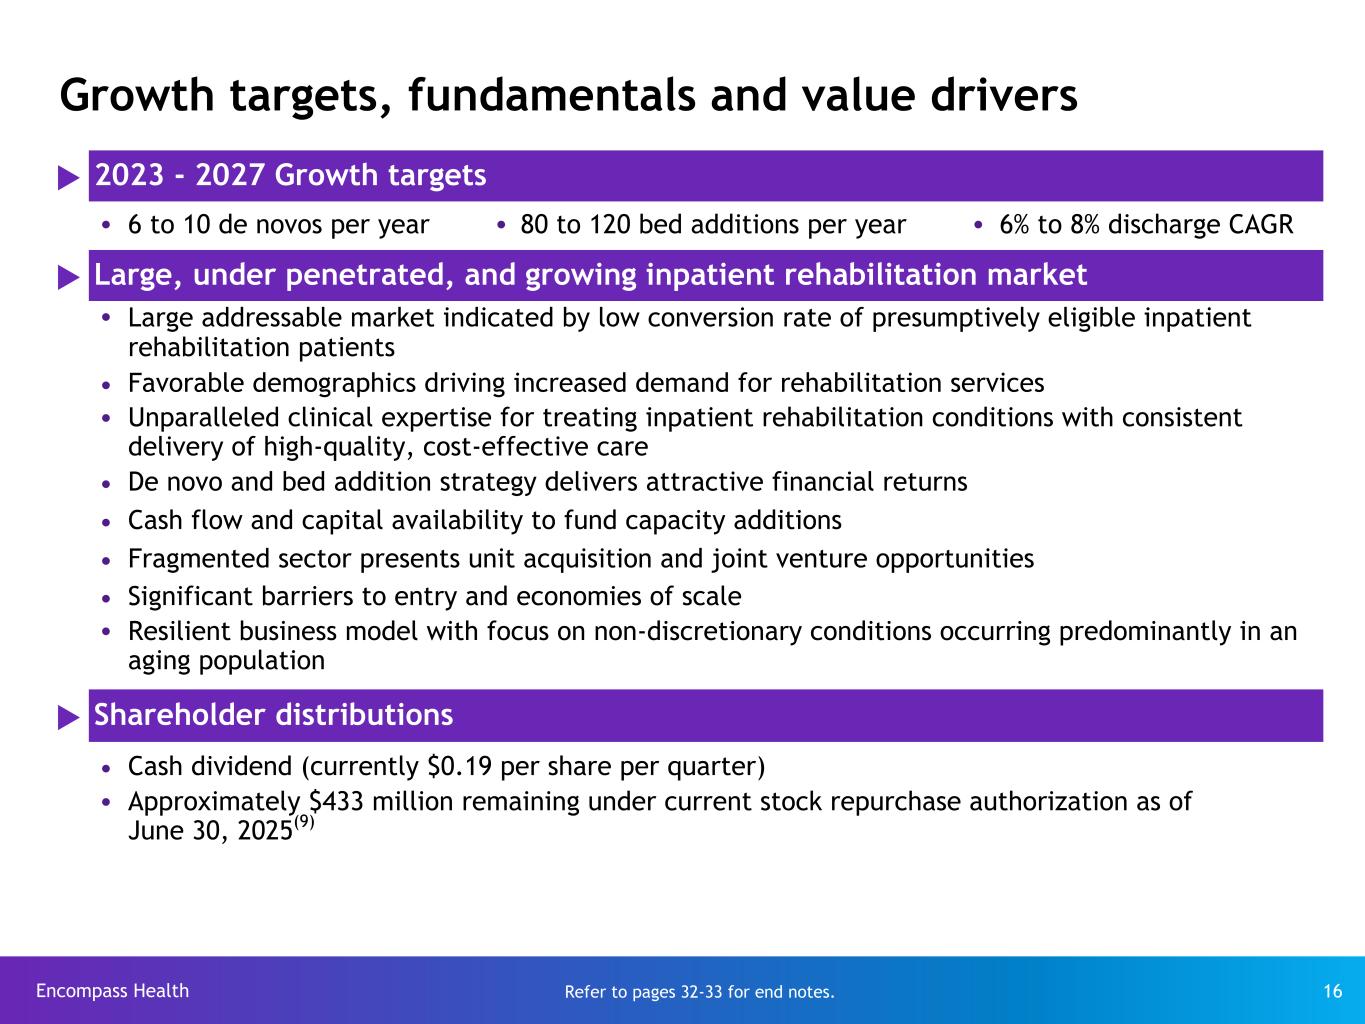
Yeah, the short answer is yes. So again, as we think about capital allocation, the top priority is going to continue to be towards capacity expansions. And as we noted in our comments, we have increased this year the allotment to both bed expansions and to de novos. We expect it to be at an elevated level for the next several years, given the opportunity that exists to meet some of that rising demand. We do get a benefit both this year. It's almost $50 million, and we'll have an ongoing benefit related to bonus depreciation so even as we increase our capital expenditures we're getting a favorable cash flow from from the tax benefit also and so the likely place to go is going to be with more share repurchase activity okay great thanks thank you we'll take our next question from Joanna Gajek of Bank of America please go ahead hey hi thanks for taking the question so I guess first um maybe first I get that the follow-up on
the on this last I guess discussion around the capital deployment priorities such as they're likely more sure repo any considerations around acquisitions I think I've asked you this before it sounds like you know you believe when it comes to your core business, the inpatient rehab, you believe, you know, the novos and beta additions, you know, still, you know, you prefer those because of the returns over deals. But any consideration around looking outside of the inpatient rehab? I just want to ask that just in case. Thank you.
Right now, we have not identified any particular service lines or capabilities that are important to our key constituencies uh that we don't currently provide and so there are no adjacencies that are on our radar screen to move into we would consider those only to the extent some of those key constituencies whether it was referral sources or payers came to us and said you could be meaningfully more valuable to us as a partner if in addition to earth services you could do this additional thing and you know that has not arisen in any of our discussions yet With regard to acquisitions within the IRF space, you know, we continue to use the model as part of our business development effort where we will acquire a unit in an existing hospital and have it folded into a new de novo as a market entrance strategy. That'll continue to be an arrow that we have in our quiver. As we've mentioned before, there are some portfolios of freestanding IRFs that are out there predominantly sponsored by private equity. Some of those have experienced attractive growth and have some favorable operating characteristics. As those become available, we would probably evaluate those, but it's a pretty high bar to surpass the returns that we're getting from our de novo activity. So the real focus of our cash flow and our capital allocation in terms of capacity expansion is going to remain on our own de novo activity, and then bed expansions at existing hospitals.
Thanks for that. And my question about the same throw volumes, I'm very nice seeing the quarter. Can you talk about, I guess, the metrics by specialty? Sometimes you give us these metrics. I'm just curious about whether there's any outlier or every kind of category is going similarly. Thank you.
Yes. So we can provide you with some of that. So if we look, and Mark hit on some of these numbers in his comments, in the quarter, neurological was very strong, up 12.5%. We saw another good quarter of stroke growth. That was up 6.7%. Brain injury is smaller, but still a significant category. That was up over 12%. So, good growth in a lot of those areas where we focused in terms of being able to treat more medically complex, higher acuity patients. That's been a portion of our differentiation strategy for more than a decade now.
Operator
Thank you. Our next question is from Anne Hines of Mizuho Securities. Please go ahead.
Good morning, Anne. Good morning. Thank you. I know there is a few CONs, states that might relax the CONs, maybe North Carolina, South Carolina, and Tennessee. Can you just give us the update on the status of those and maybe how you view denover activity in those states once the CONs are lifted?
Yeah, and so we have a presence, as you know, in South Carolina, up to and all around the Charlotte marketplace that their CON will subside January 1st of 2027. There is a lot of discussions among many within the decision makers in the state of North Carolina. We have one hospital now in the state of North Carolina in Winston-Salem, and I believe that that state with its growth and its demographics and its shortage of rehab beds would be a state that would look not dissimilar to what Florida had looked for us in terms of our ability to be a first mover in the state and have a significant number of attractive markets in which to pursue.
Perfect. And then on, you know, a big theme is this quarter with the payers is just, you know, increased coding and maybe more of the use of AI with documentation. How is Encompass using AI to code and document better?
Yeah, so we mentioned previously we do have a partnership with Palantir, And what we're really looking to do is utilize AI, and Pat mentioned this in some of his remarks earlier, to reduce the administrative burden on our staff and also just to improve the consistency with which we're presenting information. It also allows us, for instance, when we get a medical record on a patient who's transferring to us from an acute care hospital, it is voluminous. and it's very taxing on our staff to have to comb through that record and make sure that we're pulling forward the most pertinent information in our own documentation, and AI can really facilitate that process. Now, nothing that we're doing with AI is overriding individual clinical judgment. We make sure that there is a stringent manual review of these processes as well, But it is a tool that ultimately, we think, can reduce administrative burden, improve accuracy, and in so doing, also increase the job satisfaction of our staff.
And one specific application of that has been used by our nurse liaisons to go out and do patient evaluations, which can take a lot of time, and many of these patients don't turn into admissions. So, I mean, anything we can do to help these nurse liaisons become more efficient, and we've done that working with Palantir as they use their iPad to do the assessment and all the documentation around that. And we've been able to reduce the time for documentation of the assessment by 20 minutes, which you start multiplying that out by all the liaisons that we have and the patients that are being evaluated. and you can see a significant gain in efficiency. And it's also a job satisfaction plus for those liaisons. But that's just one specific application of how we're applying, working specifically with Palantir and Oracle in some cases.
And ultimately, it inures to the benefit of both the acute care hospital as a referral source and the patient. you know, it allows us to be more responsive and respond faster, which has the potential to free up that bed in the acute care hospital. It also means that if we can make a faster decision and the patient comes into our facility, they're going to start their therapy regime earlier, which has substantial clinical benefits.
And I was just going to add, this is Pat. We also use predictive analytics and modeling to help us with our fall risk model. So since 2021, we implemented this model our fall rate is improved by 30 percent and that model looks at 50 different clinical elements consolidates those into a risk score and and informs our clinicians for patients that enhance fall risk and then the other is on acute care transfers back in 2015 we developed a react model which continues to be refined and that has led to a rate improvement of 24 percent since 2020. So two other examples of where we're using predictive analytics within our systems to help improve quality in the clinical process.
Operator
Thank you. We'll take our next question from A.J. Rice of UBS. Your line is open.
Hello, Gordon, A.J. Hi, everybody. Just on the managed care contracting, anything with the pressure and care experience in changing the dynamics, terms, discussion, and rate updates you're seeing?
A.J., you were a little bit garbled there. I think the question was specifically around managed care contracting. As we go through some of the renewals, are we seeing anything that is significantly different from recent historical? I mentioned earlier, because it's contained within the managed care bucket for us on payer mix, the impact of the VA work in the community care network that has been very favorable, and that's led to the higher-than-anticipated price increase there. Also good growth because it's been increasing the last two-plus years at a growth rate in the mid-teens.
Other than that, I'd say it's been fairly standard in terms of annual price increases kind of in that two and a half to three percent range and you know volume growth is not all that significant and then another one that you're pacing on uh uh de novo new deals partnerships etc has been very steady uh it's not improving increasing a little bit but i always want to be aware of the pipeline and what you're seeing out there if the discussion with acute care partners and potentials on jvs and things like that is there any change in that or
in the depth of the potential backlog that you see anything to call out there no you know we uh we included supplemental slides the development activity that has been announced and there are 18 projects including those that have already opened up this year consistent with what we've said before we maintain an active dialogue or an active pipeline of right at about 50 projects and it's it's stayed pretty steady at about that level so feel good about the the visibility to continue with this level of growth for the next several years hey john i think one thing that's notable on this uh on this development list is the fact
that we're growing not only in states where we already have a presence uh like such as pennsylvania or Georgia, but we also have some new states that we're entering and we'll open up our first hospital in Danbury, Connecticut here in Q3. And then we'll also be in the outer years, we'll be looking at adding hospital in Utah and another out in Nevada. So we're looking at where we have market density, as well as some opportunities to open up in new states.
Okay, great. Thanks so much.
Operator
Thank you. We'll take our next question from Jared Haas of William Blair. Your line is open.
Hey, Jared. Good morning. Thanks for taking the questions. Maybe I'll ask one around the benefits expense, and I think he said that was up 18% in the period. A couple quick ones. One, just can you remind us the split in total swv spend between wages and benefit costs and then i assume much of that growth is is driven by kind of specialty pharmaceuticals but just wanted to confirm that and then i guess with that being the case assuming things like specialty pharmaceuticals are a big driver it doesn't seem like that's going away anytime soon so i'm wondering if there's anything incremental to sort of your strategy to manage benefits expense going forward Yeah, so a lot to unpack there.
So in response to the first question, total benefits runs at about 10.5% of the total SWB line, right between 10.5% and 11%, even with the recent increases that we've seen. The double digit increases that we've been seeing for the last year have been driven predominantly by an increased frequency of high dollar claims, which we typically classify as an individual claim of over $100,000. Some of that is due to overall inflation in the healthcare system. So those patients, even if they're experiencing a malady similar to what they had previously, whereas the cost of treatment may have been less than $100,000, it's over $100,000. It's not really been driven by the specialty pharma with one exception that I'll go through in a minute. And so I think when a lot of folks think of specialty pharma, you're thinking of things like the GLP-1s and then also some of the other notable drugs that we see out there like Keytruda and so forth. And what we've seen there is that the rate of increase in terms of our spend on those drugs has been relatively modest, kind of in the mid-single-digit increase, and that's because rebates have kept pace with the increased spend on those drugs where we are seeing the impact of specialty drugs is with some of the cancer treatments and that gets picked up in the medical claims versus the pharma claims because those are administered on an inpatient basis that's really helpful color i appreciate all that uh and then maybe just as a quick follow-up
I'll ask on free cash flow. A nice quarter, I think it was up about 31%. If I look at the revised guidance, I think it implies about 9% or so for the full year, 9% growth. I think you kind of clarified some of the bridging items in the second half and sort of the timing of the capital investment. But maybe the question, if I think longer term, any guardrails or parameters you would frame in terms of how we should think about free cash flow growth going forward, either in in terms of a total annual growth rate or conversion relative to EBITDA?
Yeah, I think it's gonna be relatively similar. So I think that CapEx is gonna be roughly similar over the next several years. Obviously we're to anticipate further growth in EBITDA. And as we mentioned earlier, we've gotten a benefit this year and would expect to see a benefit over the next several years as well from the change in the tax legislation regarding bonus depreciation. And so that should enhance the flow through.
Okay. That's perfect. I'll hop back in queue.
Operator
Thank you. We'll take our next question from Brian Tanquilet of Jefferies. Your line is open.
Morning, Brian. Good morning.
Congrats on the quarter. Maybe just a question, Doug.
As I think about, you know, tariffs and I know you're expanding your CapEx budget for the year, are you seeing any changes there that we need to be thinking about as we think through 2026 budgeting for capex uh construction costs not yet obviously there's still a whole lot that is in flux you know we've talked previously about how we source our materials we don't have a lot of exposure for instance to concrete which is predominantly sourced out of mexico given the building composition from a steel perspective a lot of the steel that we use is recycled steel that we're able to procure in the U.S. So thus far, we haven't seen a pronounced impact from tariffs on construction cost inflation, but it's obviously something that remains in flux for everybody who's out there, and we continue to keep an eye on it.
I appreciate that. And maybe, Mark, I appreciate all the comments on the quality and the discussions you're having with the JV partners. Maybe curious if you can share with us any feedback or any discussion since July that you or your staff and your team have had with the referral partners?
Yeah, so Brian, we were very transparent and reached out to our partners. We were aware that this article may come out. We didn't know when it was going to come out. We didn't know what it was going to say. But we reached out to all of our partners and said this may be out there. we we have always been transparent with our partners relative to our quality outcomes or anything that might be out in terms of changes and regulations or otherwise but you know I think that our partners certainly are referring physicians or referring hospitals and the patients themselves recognize our quality uh and uh as at least the outcomes that we can get relative to return back to the community or the net promoter score or their uh likelihood or or low likelihood of being readmitted back to keycare hospitals and then that's what they appreciate we think it's um you know the the article that took um 0.001 percent of our total discharges for that uh time period reviews in in the article and tried to consider being a mischaracterization across our quality was a really helpful commentary thank you mark thank you and once again if you would like to ask a
question please press star one now on your telephone keypad thank you we'll take our next question from raj kumar of stevens your line is open hey raj good morning uh just you know kind of looking at, you know, this is 12 straight quarters of same-store discharge growth above 4%, maybe kind of just balancing insights from upstream acute care hospital providers and how they're seeing moderating volume growth to more normalized levels, and then, you know, also kind of a tougher comp backdraft for Encompass.
Now, how do you see, you know, same-store growth in the back half, and then, you know, there's a lot of new facilities coming on line in the back half as well, so maybe kind of providing a framing of growth relative to that six to eight percent target in the back half between same store and new store i think you've hit on the right factors which is you're going to have more capacity coming on board of the second half which will help in terms of new store growth but some of that capacity is coming on very late in the year so it's not going to impact uh this year as much as it will benefit next year in terms of new store growth from a same store perspective you're absolutely right it's great we've had 12 consecutive quarters north of four percent that has raised the bar in terms of the comp that we're up against uh we uh as it relates to what you may be seeing upstream at the acute care hospitals just a reminder that although it feels like because we get in excess of 90 of our referrals from acute care hospitals that there ought to be a high correlation between our volumes and acute care hospitals, but it does not exist. And it does not exist because only less than 5% of the patients being discharged from acute care hospitals in the U.S. wind up going to the IRF setting. And that portion of their volume, because it relates to non-discretionary illnesses that ultimately qualified for treatment in an IRF are not very volatile. So the volatility that the acute care hospitals see that we do not is predominantly around discretionary treatments.
Yeah thank you for the color and then maybe just separately you know on a smaller portion of business you know outpatient visits was up nicely sequentially although still down year over year and then pricing has been going up drastically in that business as well. So maybe you know what was that driver growth was just kind of like a one-time surprise like we saw on like fee for service and inpatient side in the first quarter or is there something being strategically done to maybe stabilize that business since pricing has been kind of accommodative so is your question more around yeah is your question more about outpatient revenue or outpatient volume because the outpatient revenue increase is largely attributable to the increase in medicaid supplemental payments that that category is outpatient and other if you're looking at page five of our supplemental slides Yeah, I'm more referring to these volumes as kind of up 8% quarter over quarter, which is much more higher than how it has been historically between one Q and two Q.
Thanks, Raj. This is Pat. So outpatient, we only have a small number of locations, and we've intentionally lowered that footprint over time, including the closure of three outpatient facilities within the last year.
So I would just say that the operations that we still have running have a good look of business.
They're well-known in their communities, and they often are specialized from an outpatient therapy perspective that draws volume in. So I wouldn't say that it is a nationwide intentional strategy, but a very market-specific strategy with the teams that have outpatient in their communities. Thank you very much.
Operator
Thank you. And it does appear that we have no further questions at this time. I'd be happy to return the call to Mark Miller for any closing comments.
Thank you, Operator. If anyone has additional questions, please call me at 205-970-5860. Thank you again for joining today's call.
Operator
Thank you. This does conclude today's conference. You may now disconnect your lines. And everyone, have a great day.