Operator
Good morning and welcome to the Limbach Holdings fourth quarter and full year 2025 earnings conference call. At this time, all participants are in a listen-only mode. A question-and-answer session will follow the formal presentation. If anyone should require operator assistance, please press star zero on your telephone keypad. As a reminder, this conference is being recorded. I will now turn the conference over to your host, Lisa Fortuna of Financial Profiles. You may proceed.
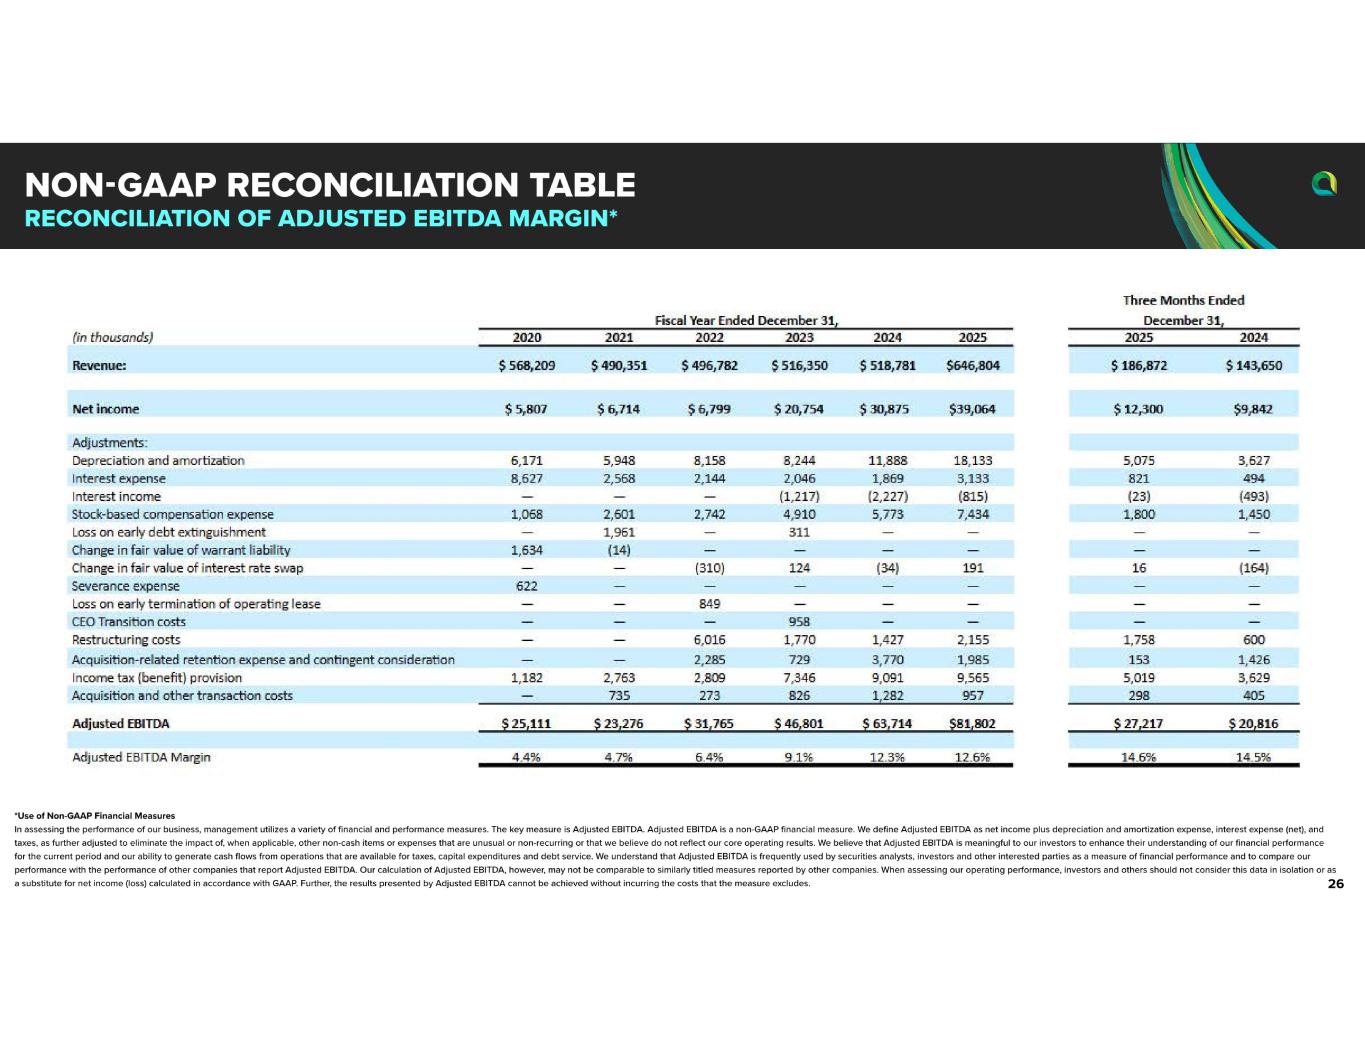
Good morning, and thank you for joining us today to discuss Limbock Holdings financial results for the fourth quarter and full year 2025. Yesterday, Limbock issued its earnings release and filed its Form 10-K for the period ended December 31, 2025. Both documents, as well as an updated investor presentation, are available on the Investor Relations section of the company's website at LimbockInc.com. Management may refer to select slides during today's call and encourages investors to review the presentation in its entirety. On today's call are Michael McCann, President and Chief Executive Officer, and Jamie Brooks, Executive Vice President and Chief Financial Officer. We will begin with prepared remarks and then open the call to questions. Before we begin, I would like to remind you that today's comments will include forward-looking statements under the federal securities laws. Forward-looking statements are identified by words such as will, be, intend, believe, expect, anticipate, or other comparable words and phrases. Statements that are not historical facts, such as those about expected financial performance, are also forward-looking statements. Actual results may differ materially from those contemplated by such forward-looking statements. A discussion of the factors that could cause a material difference in the company's results compared to these forward-looking statements is contained in Limbock's SEC filings, including reports on 10-K and 10-Q. Please note on today's call, we were referring to non-GAAP measures. You can find the reconciliation of these non-GAAP measures to the most directly comparable GAAP measures in our fourth quarter 2025 earnings release and in our investor presentation, both of which can be found on Limbock's investor relations website and have been furnished in the form 8K filed with the SEC. With that, I'll now turn the call over to President and CEO Mike McCann.
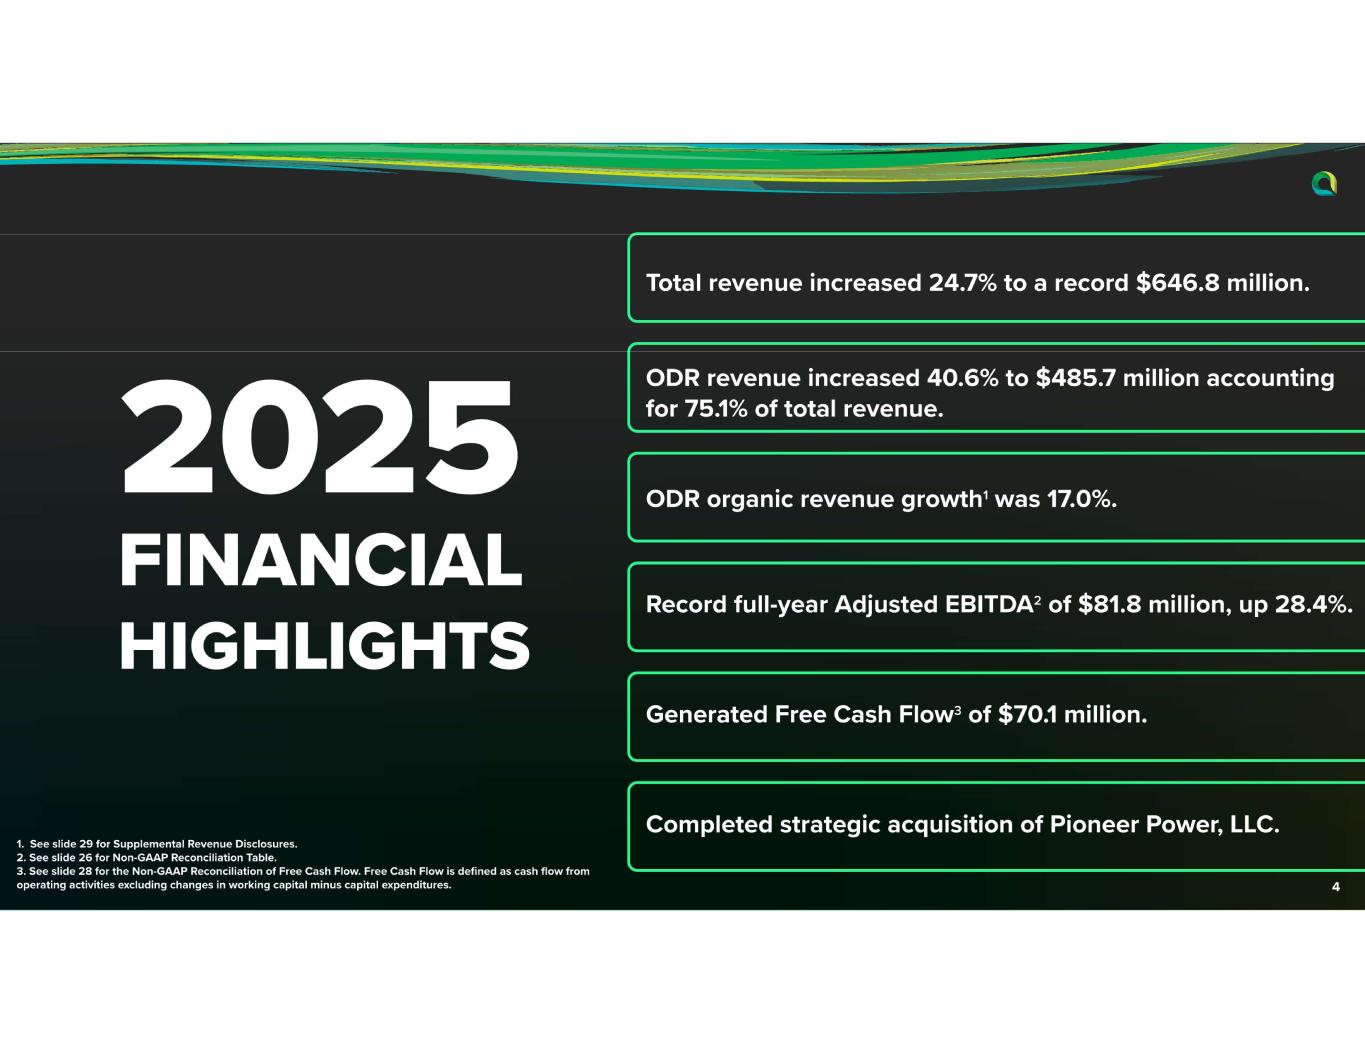
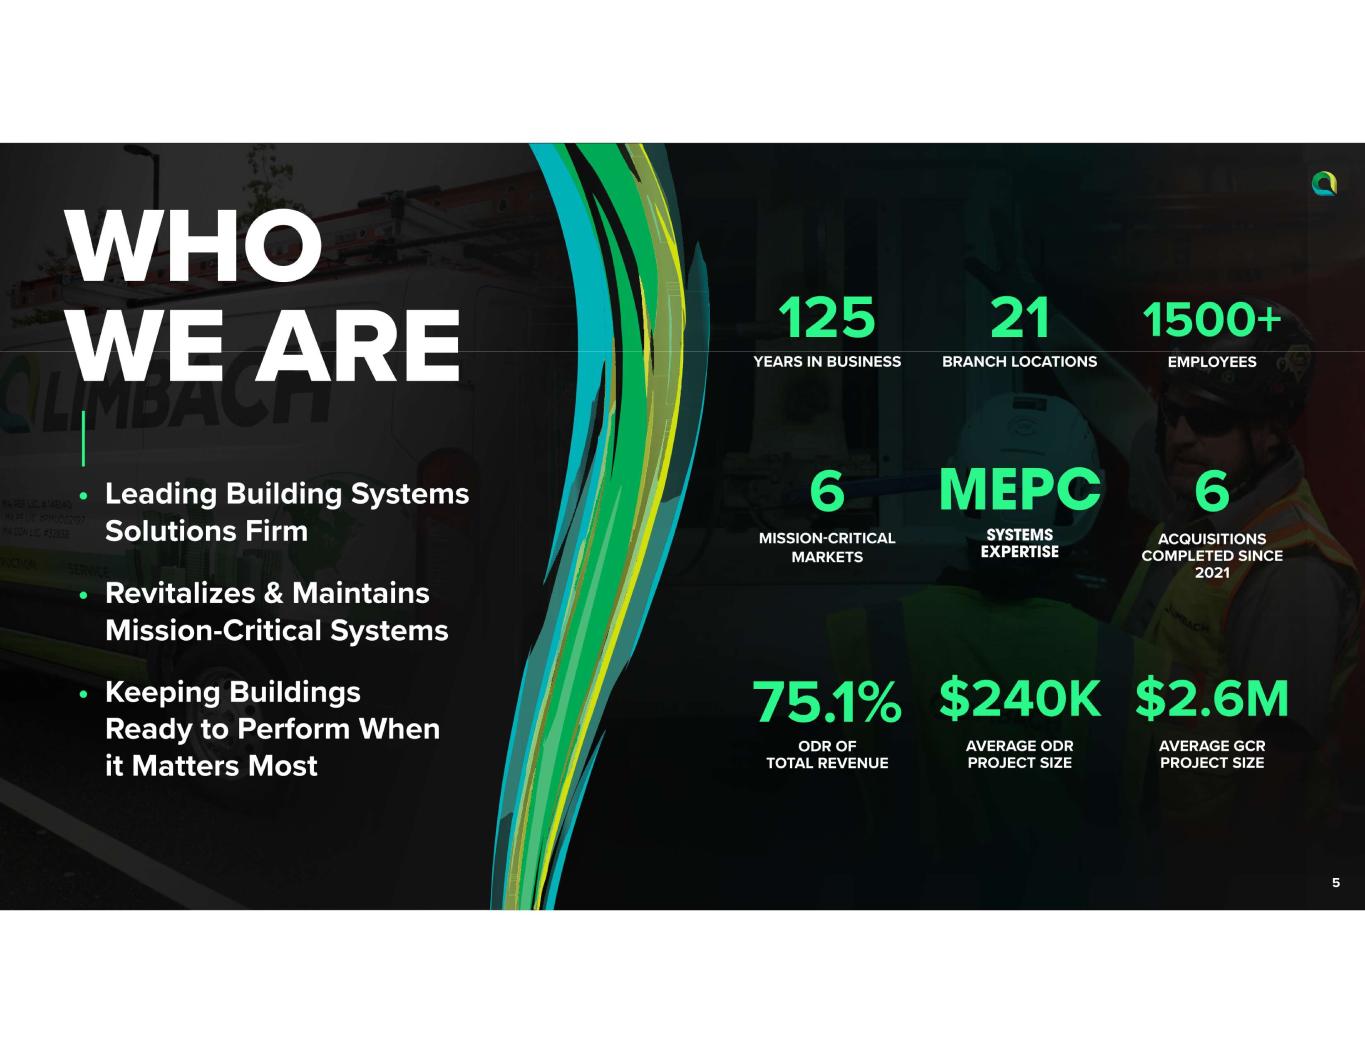
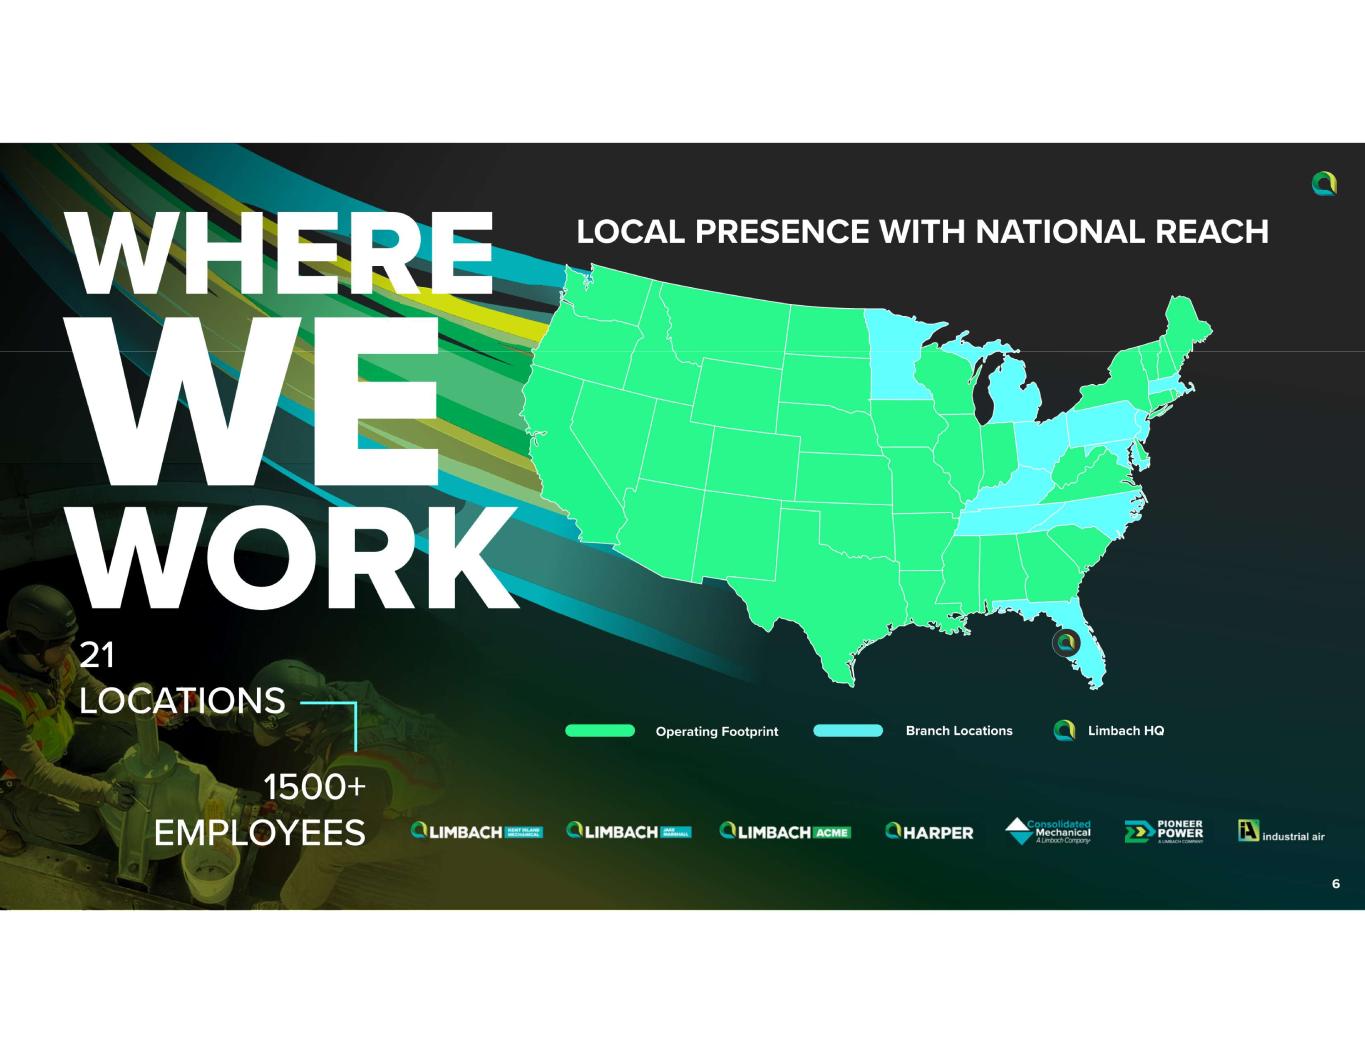
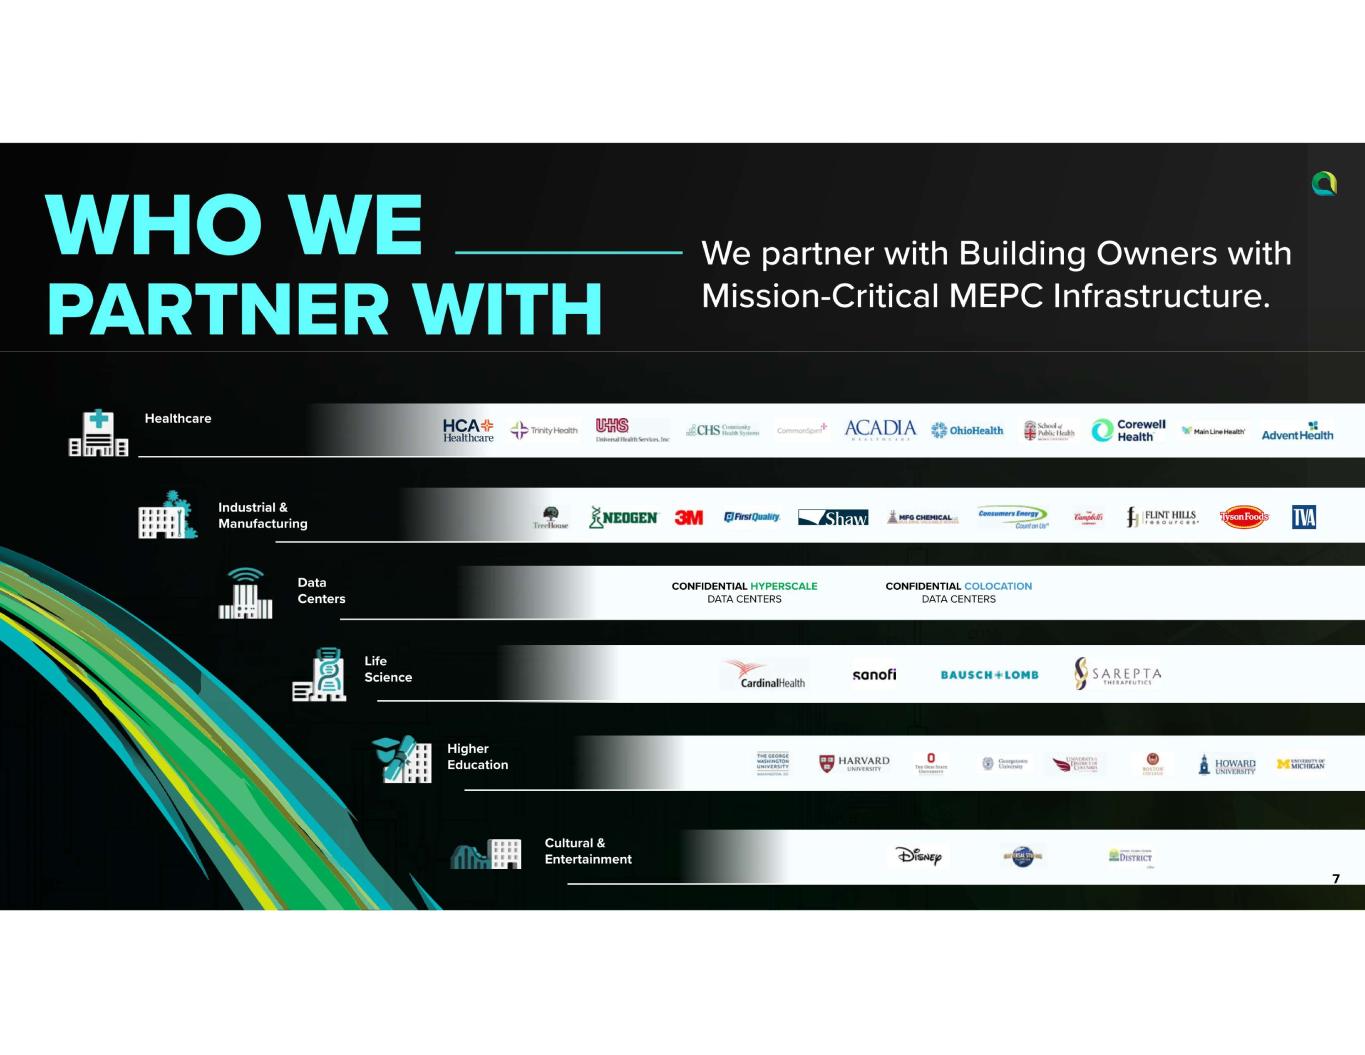
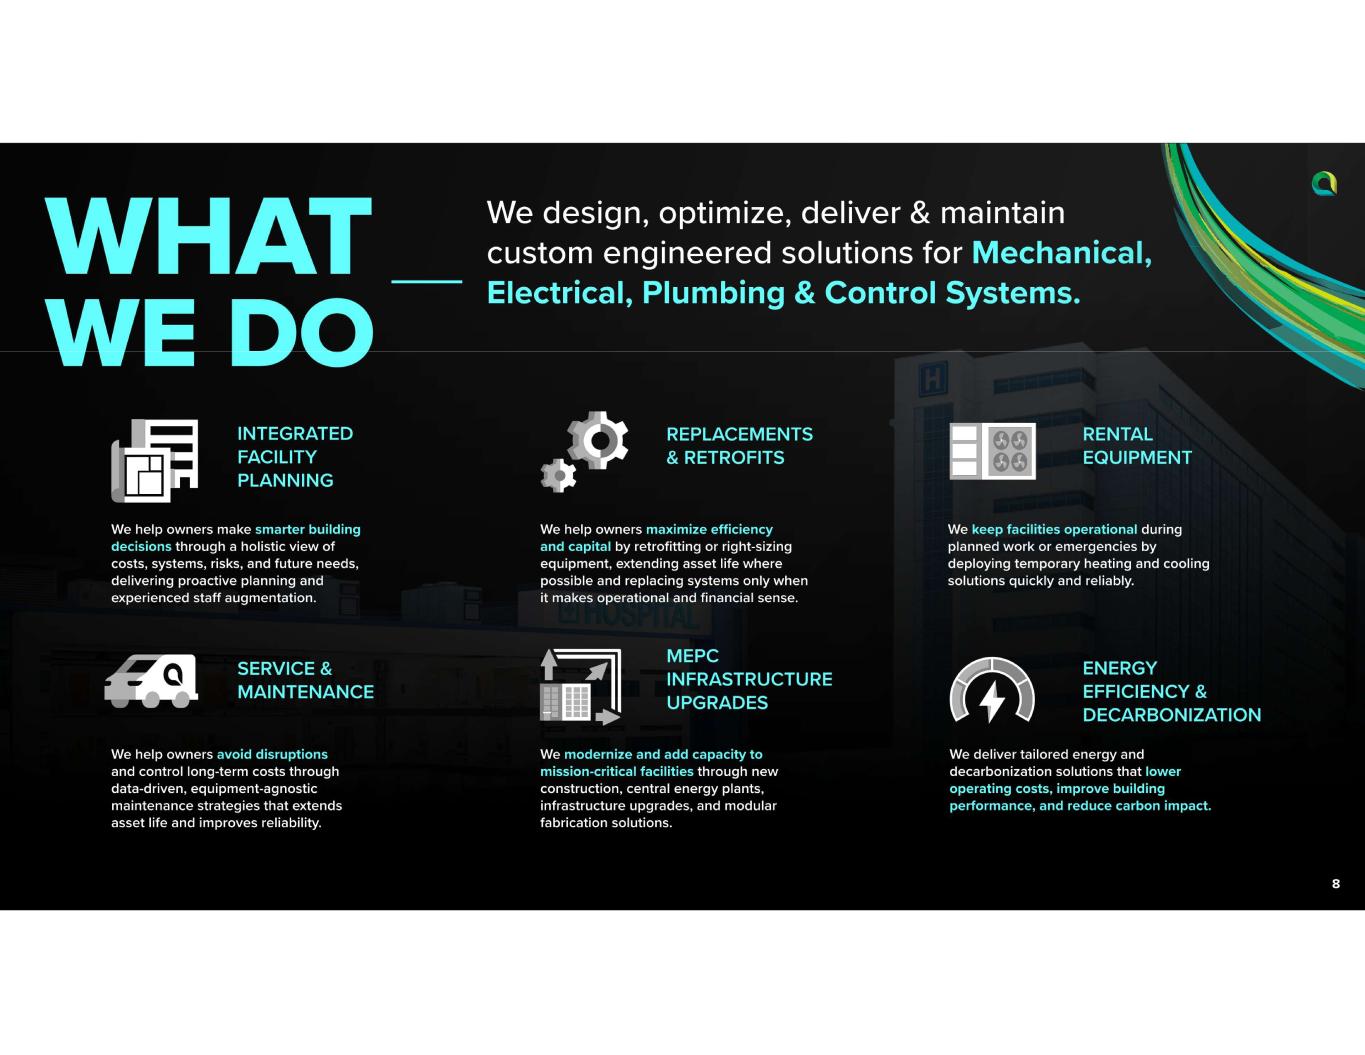
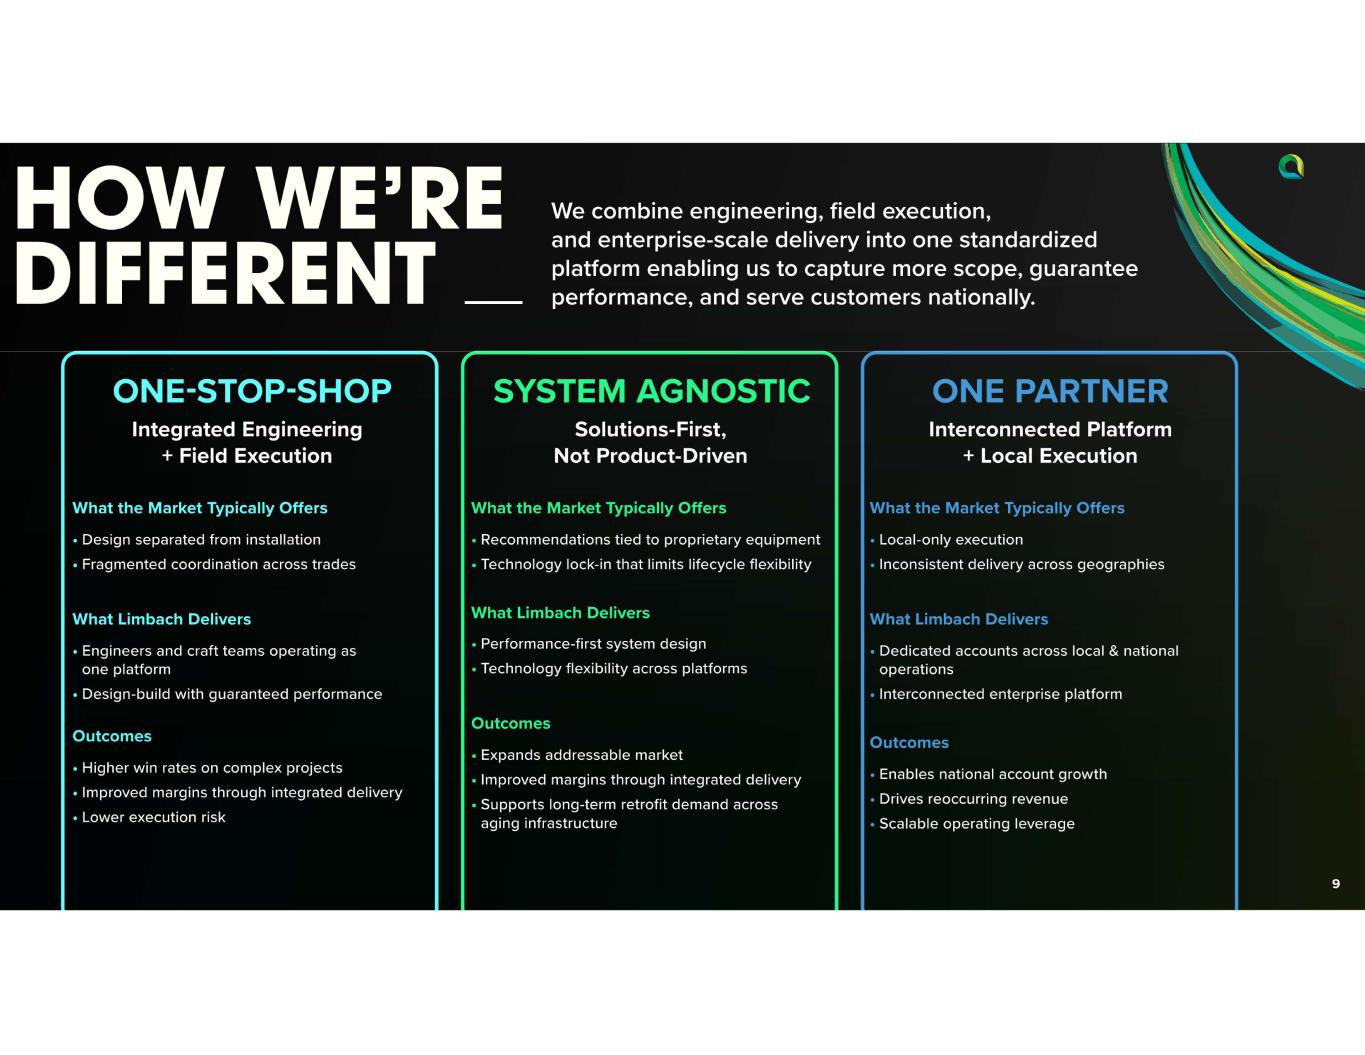
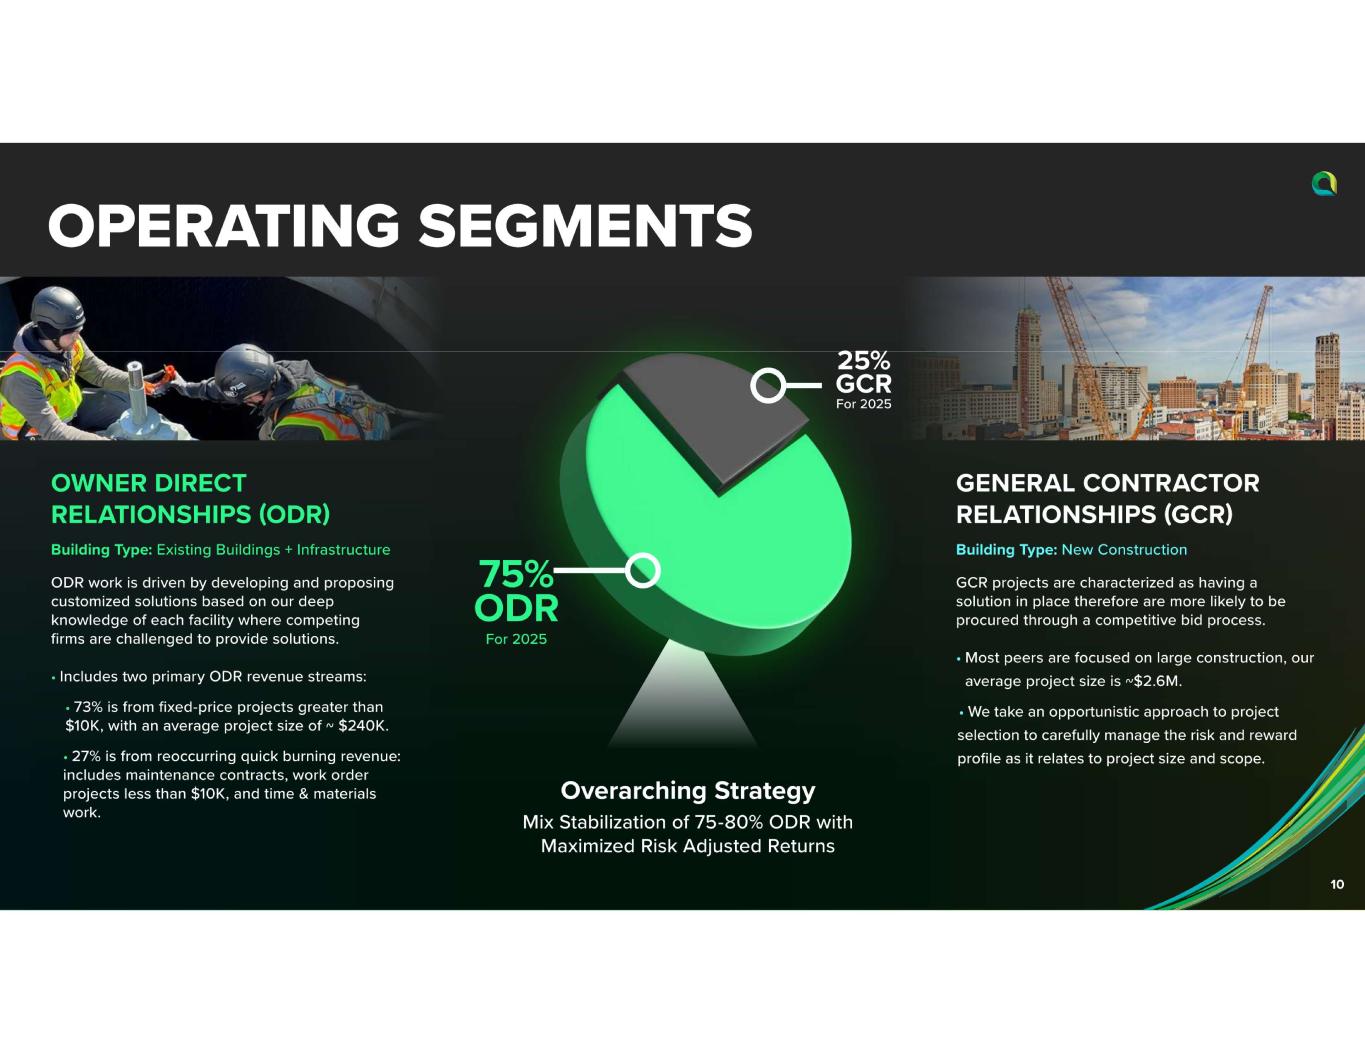
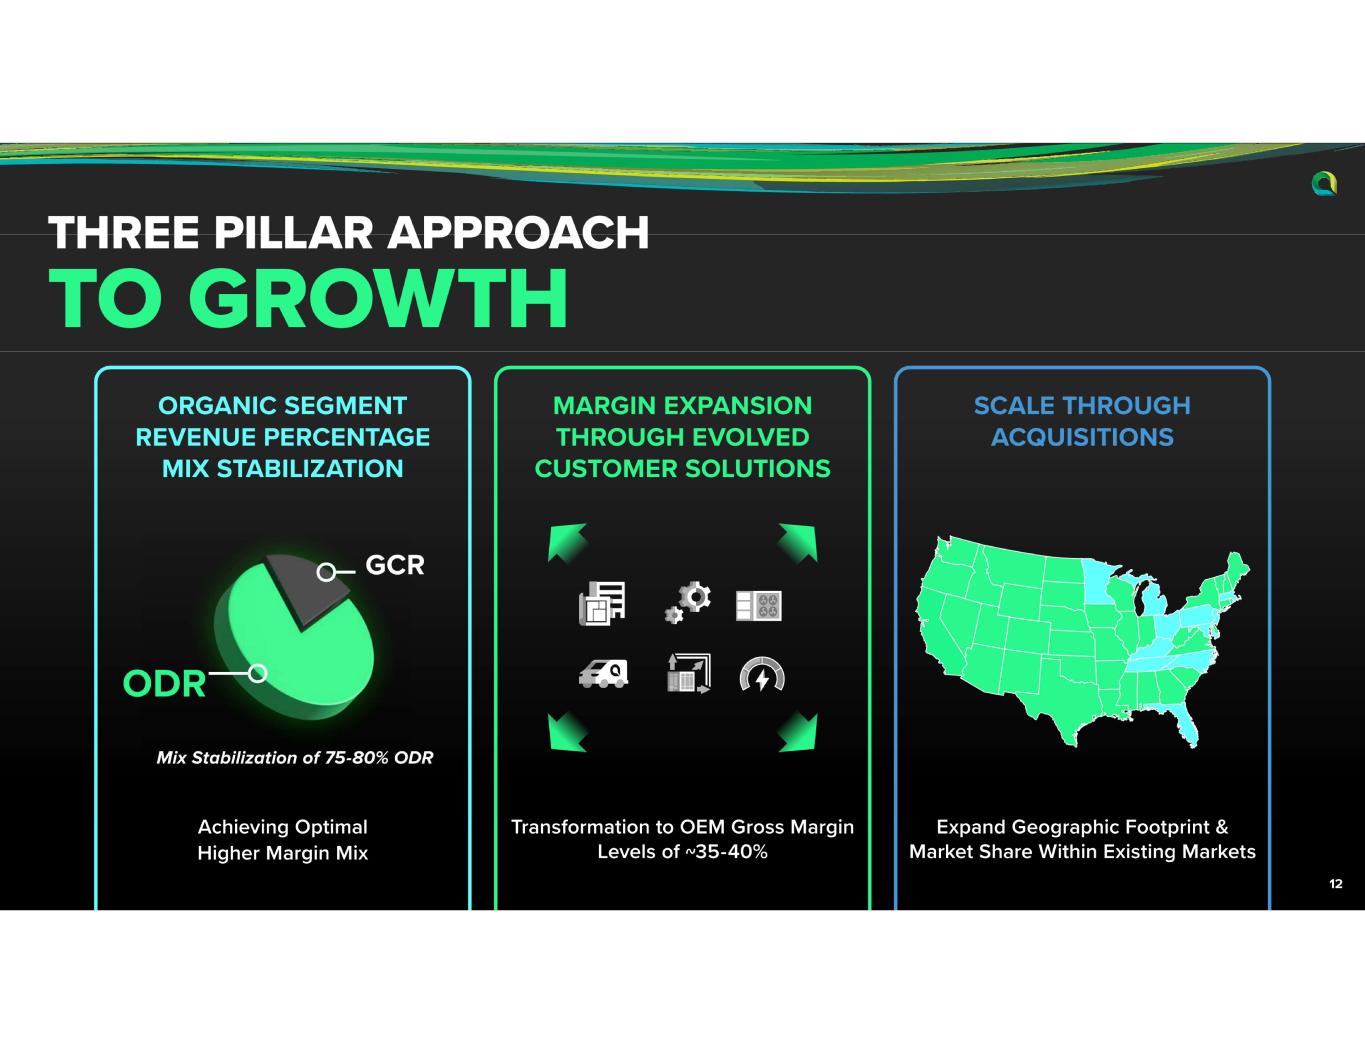
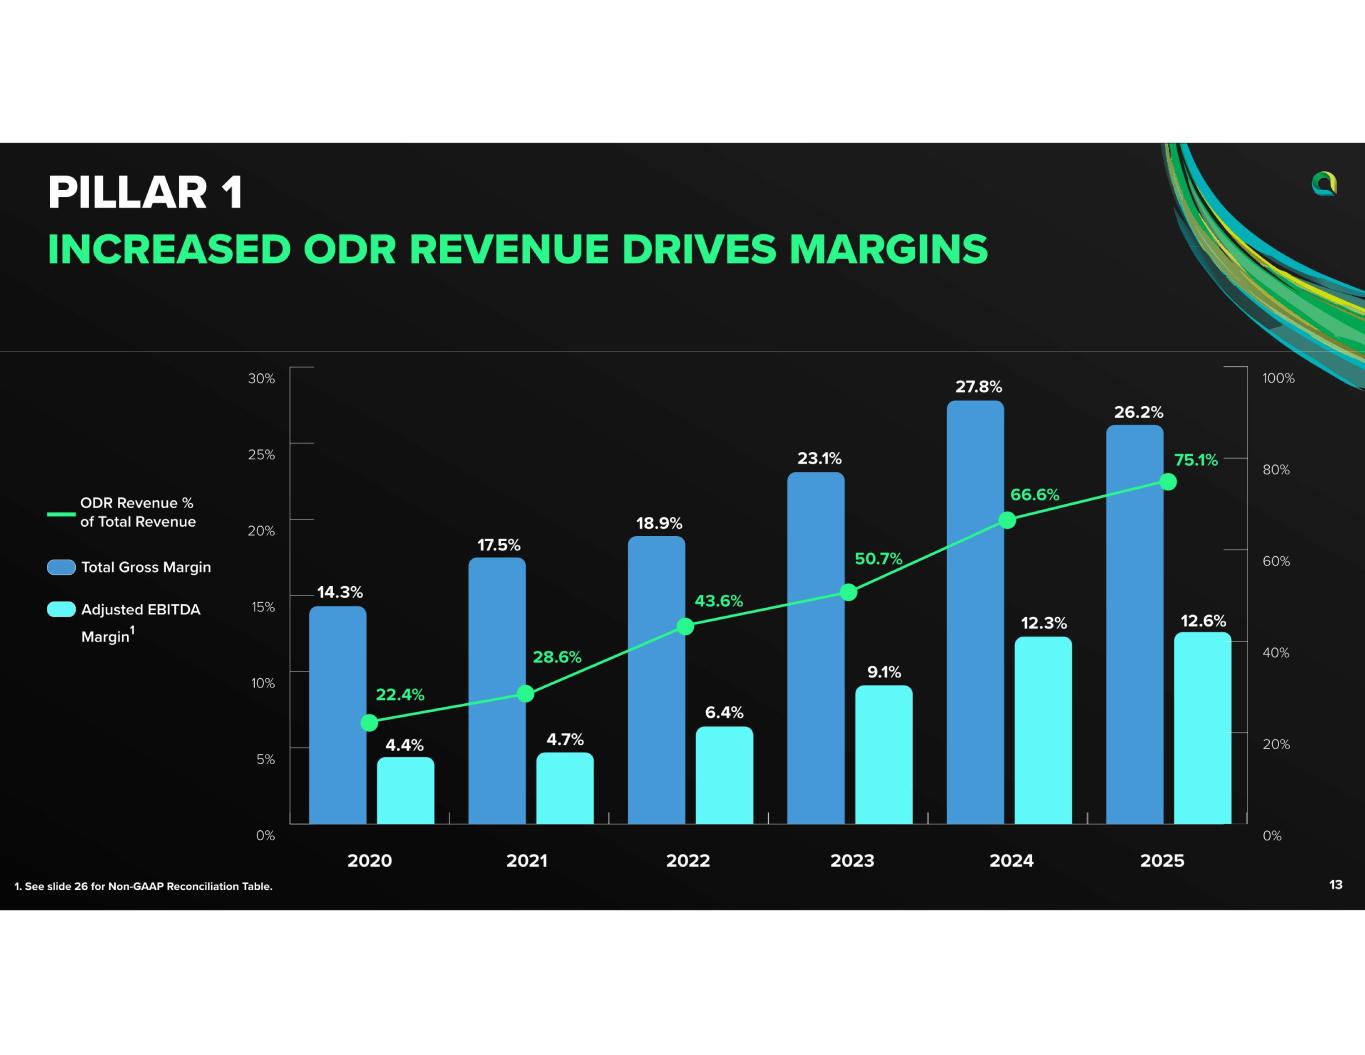
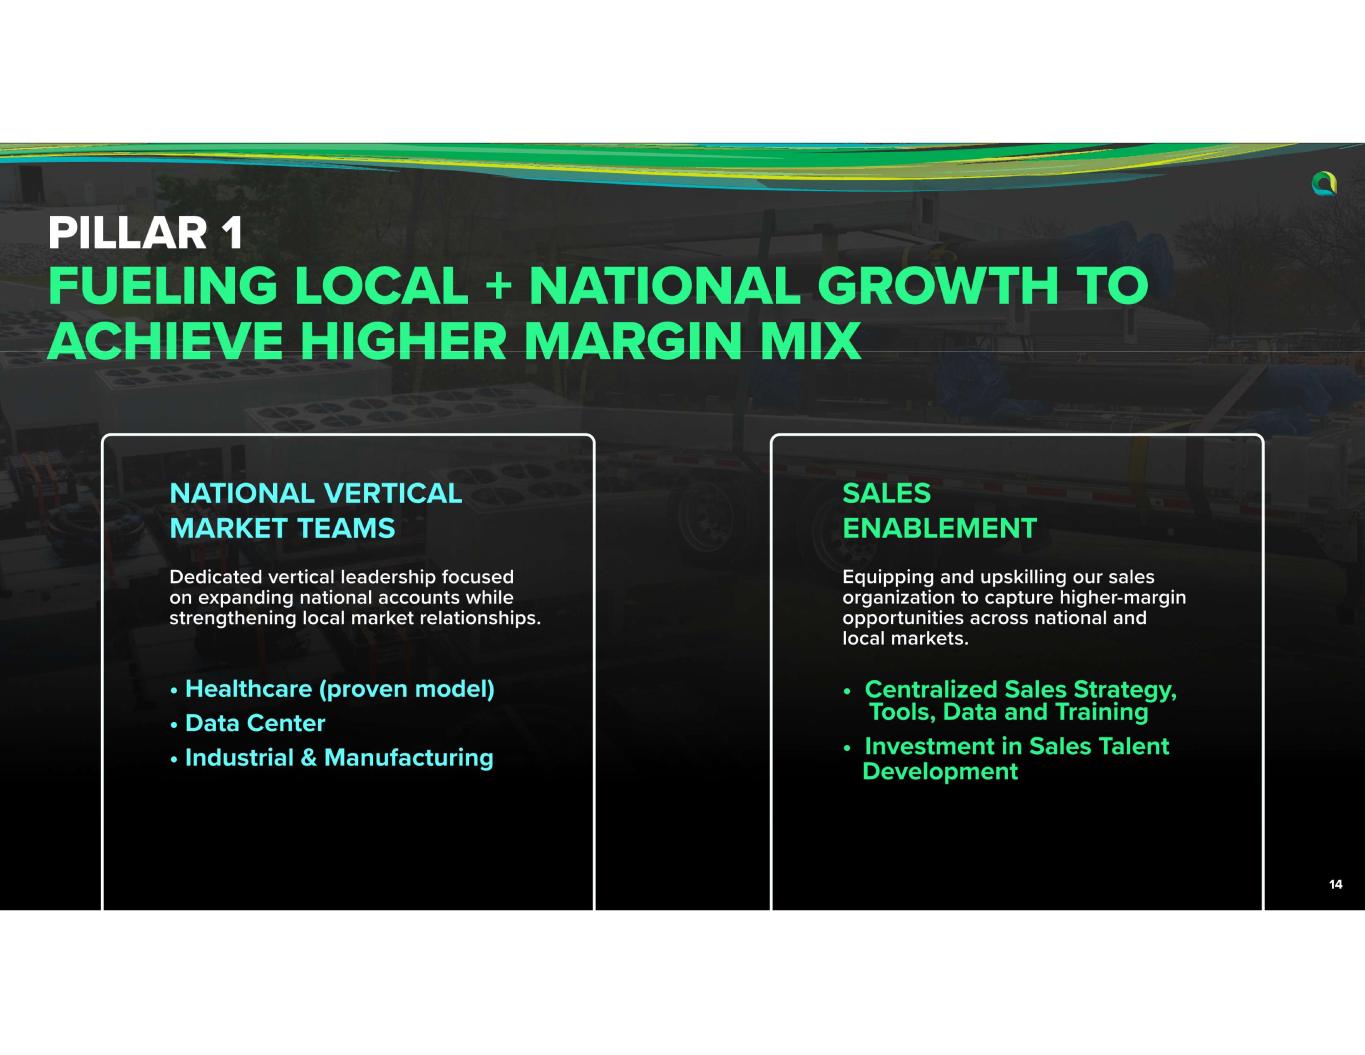
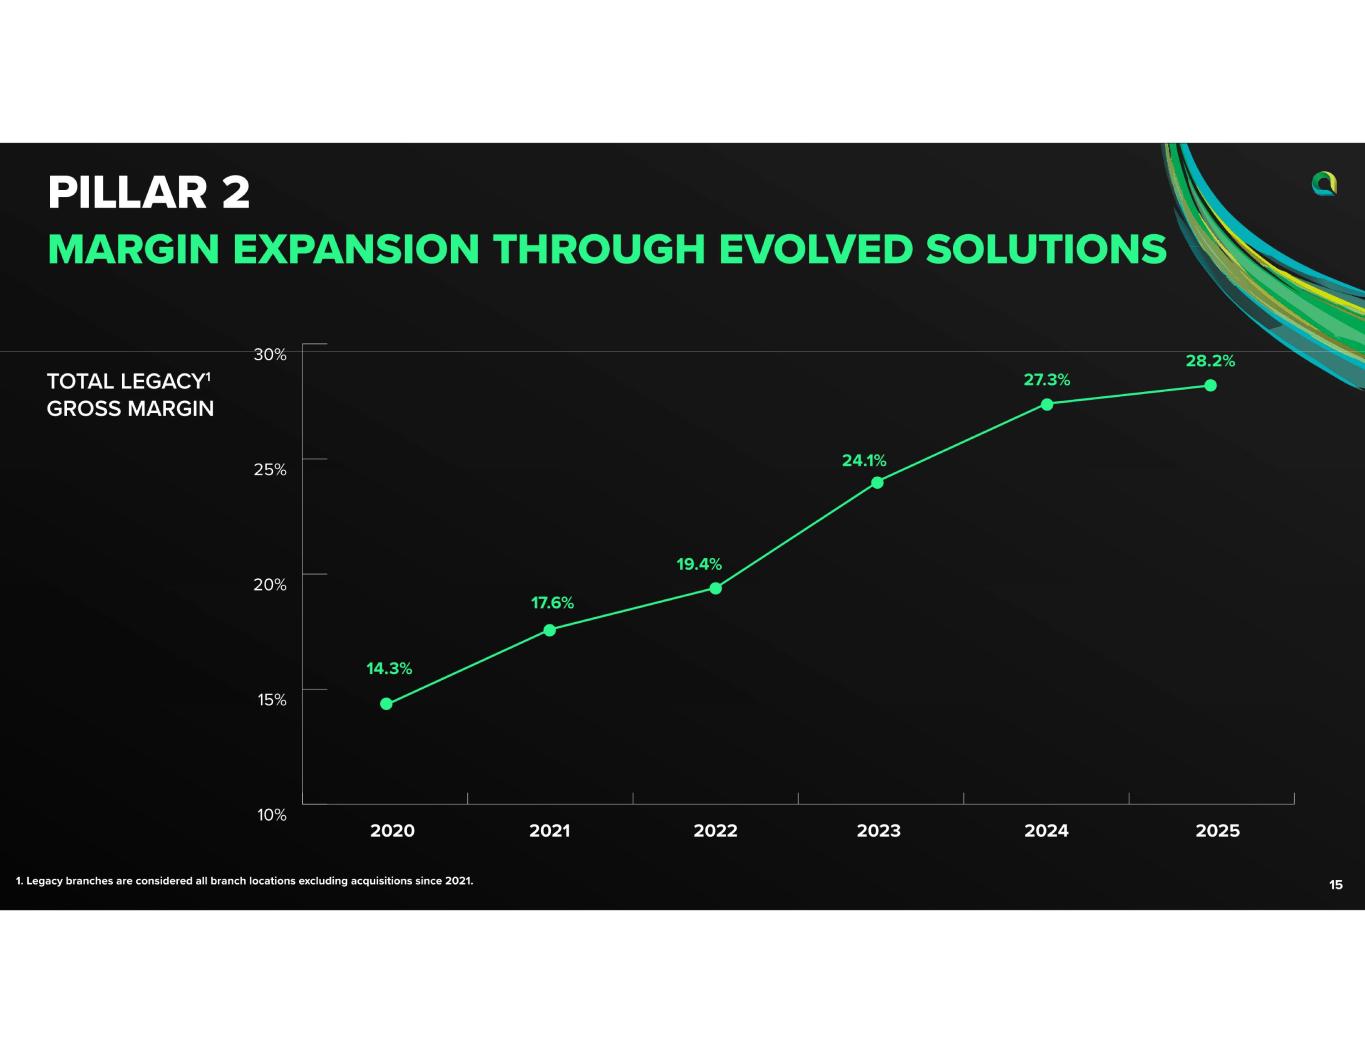
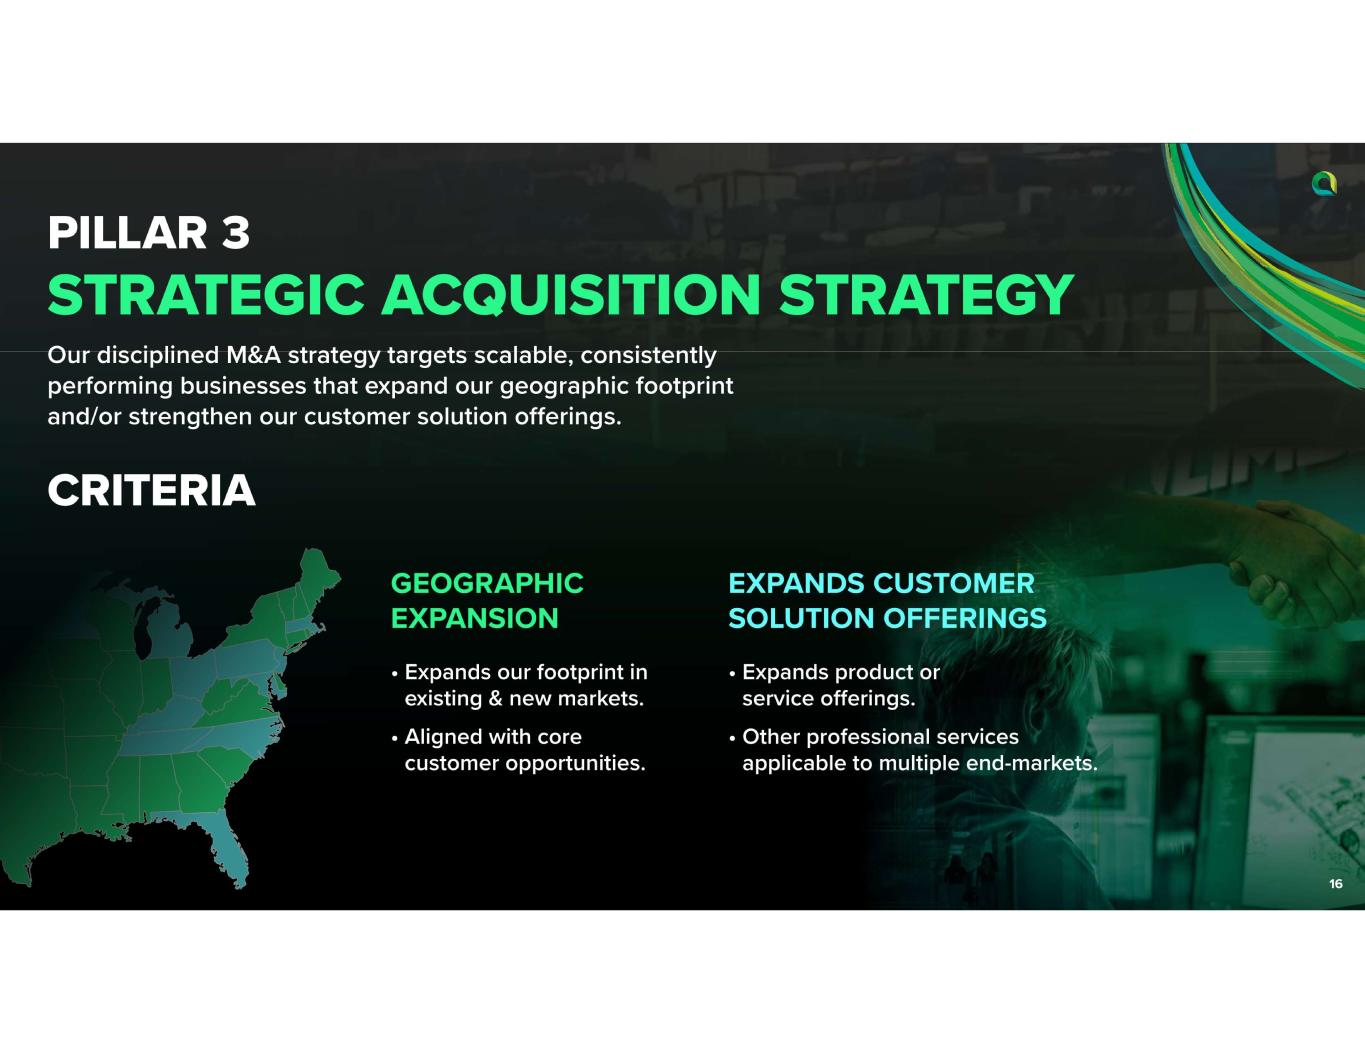
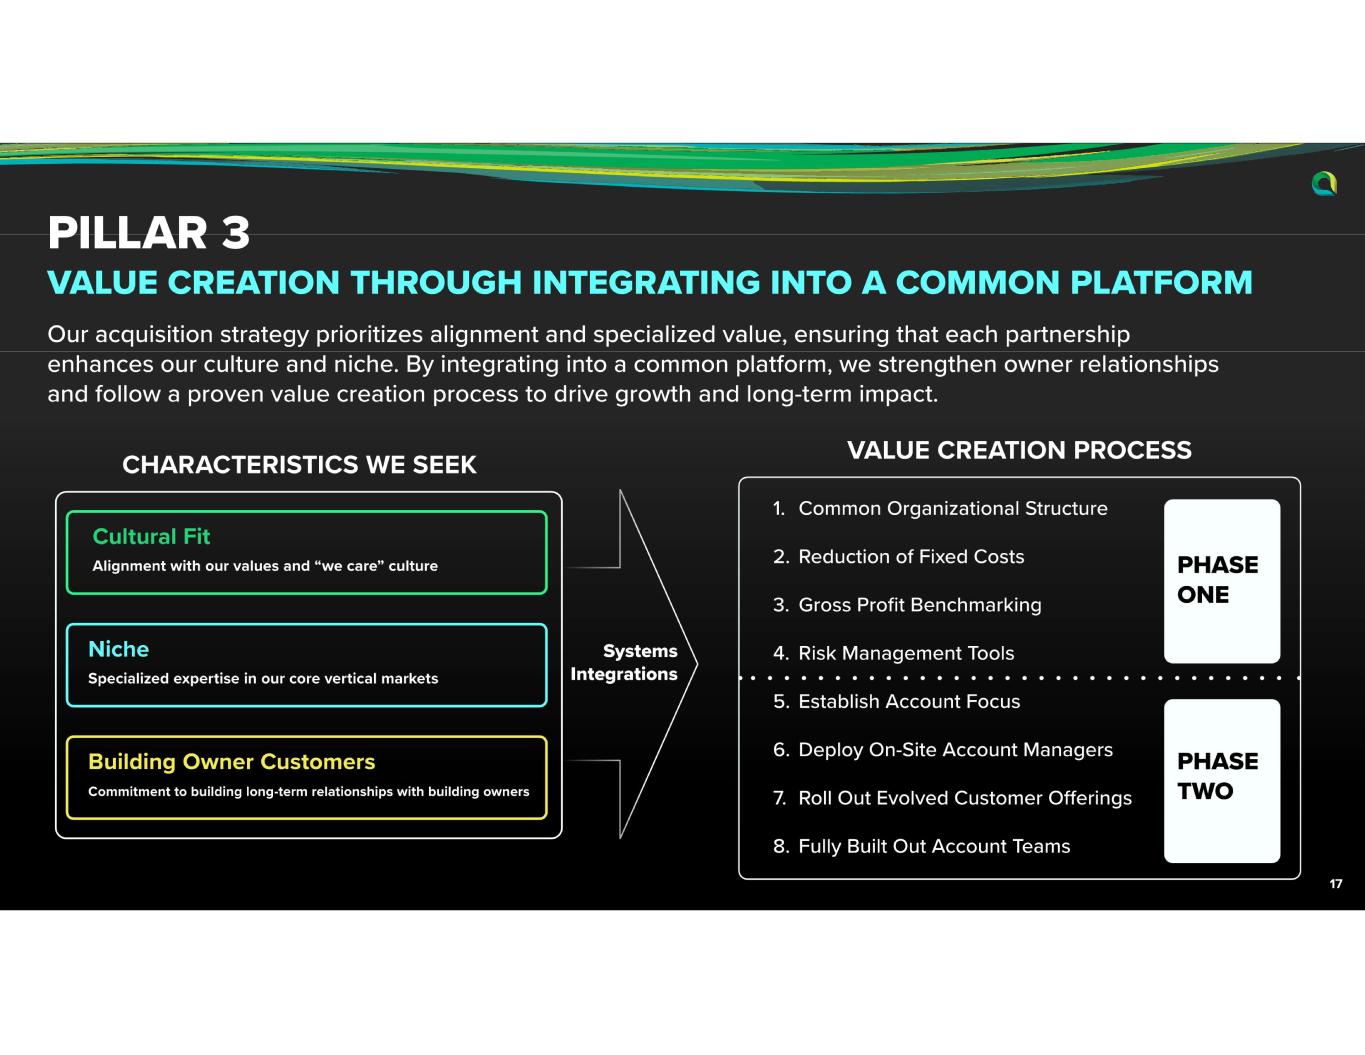
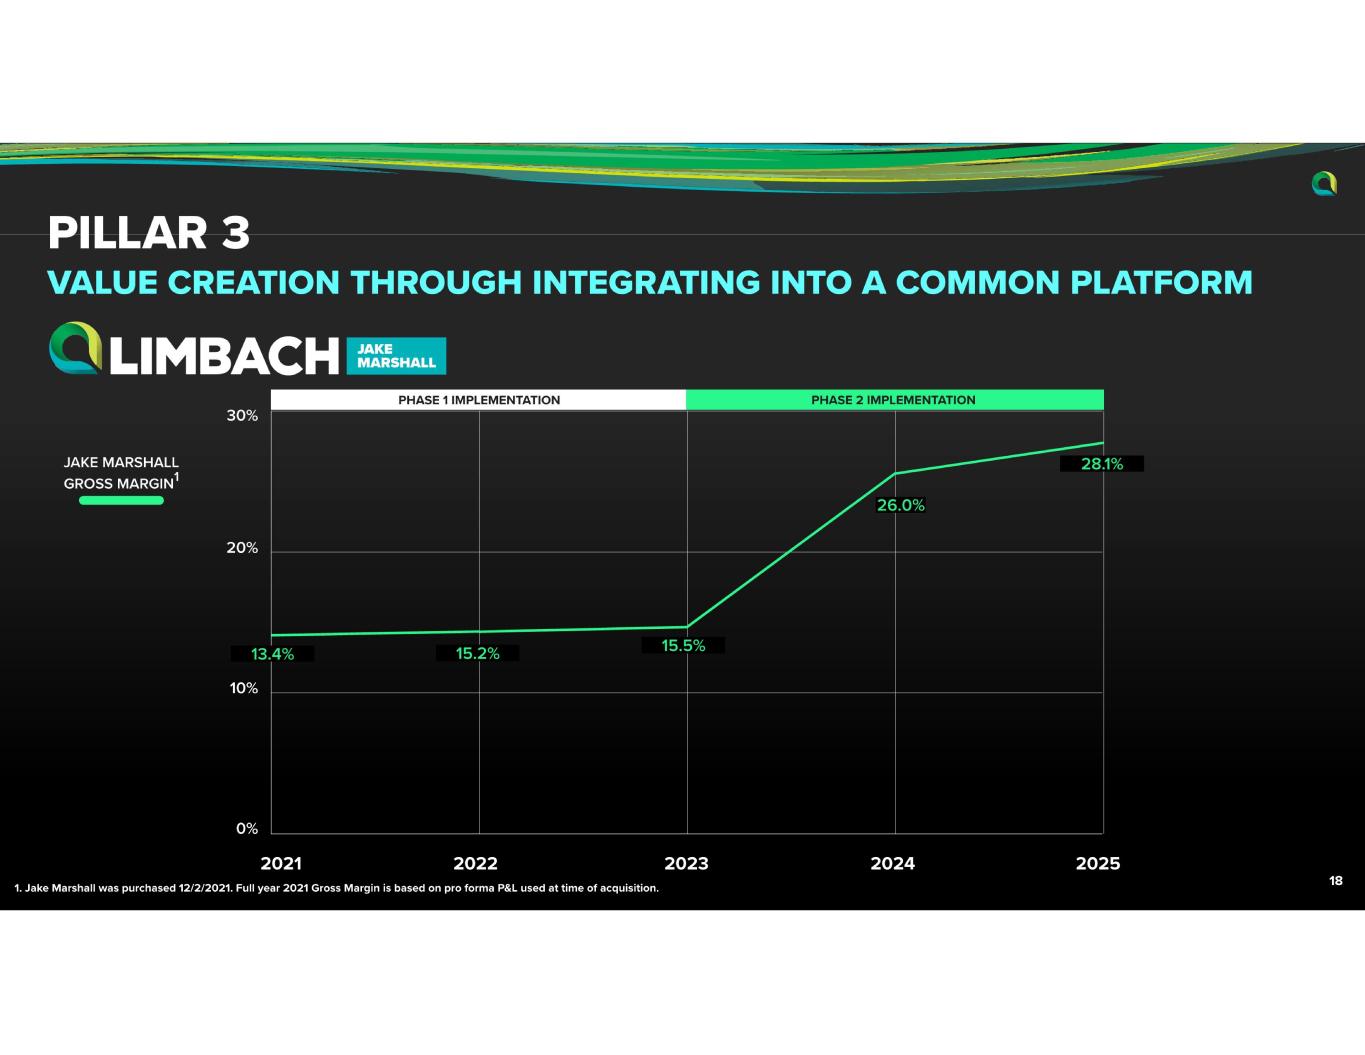
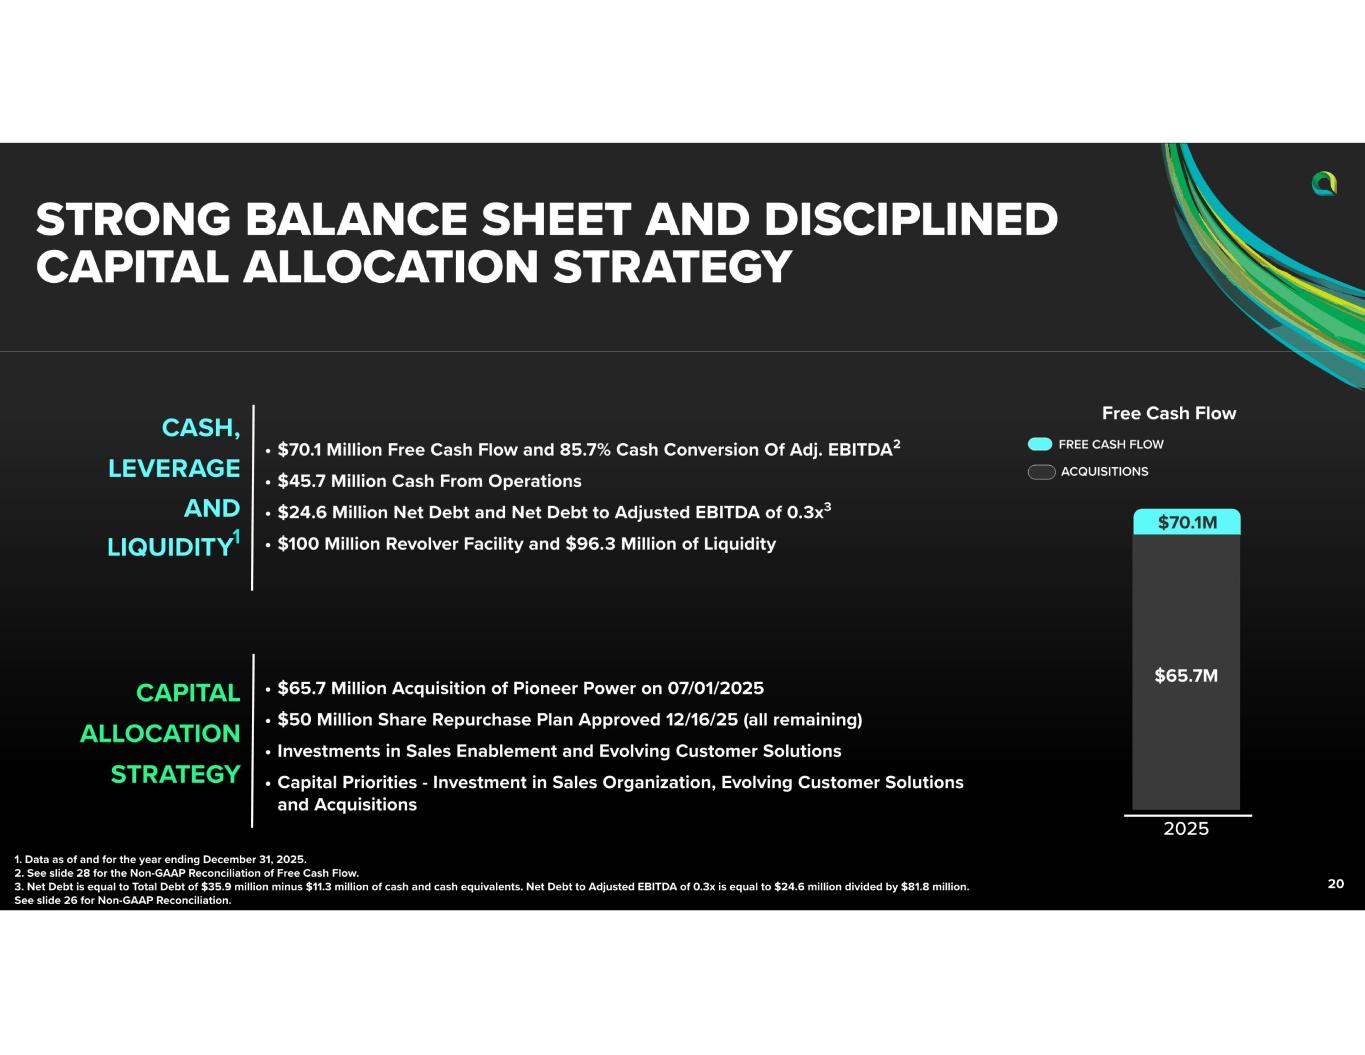
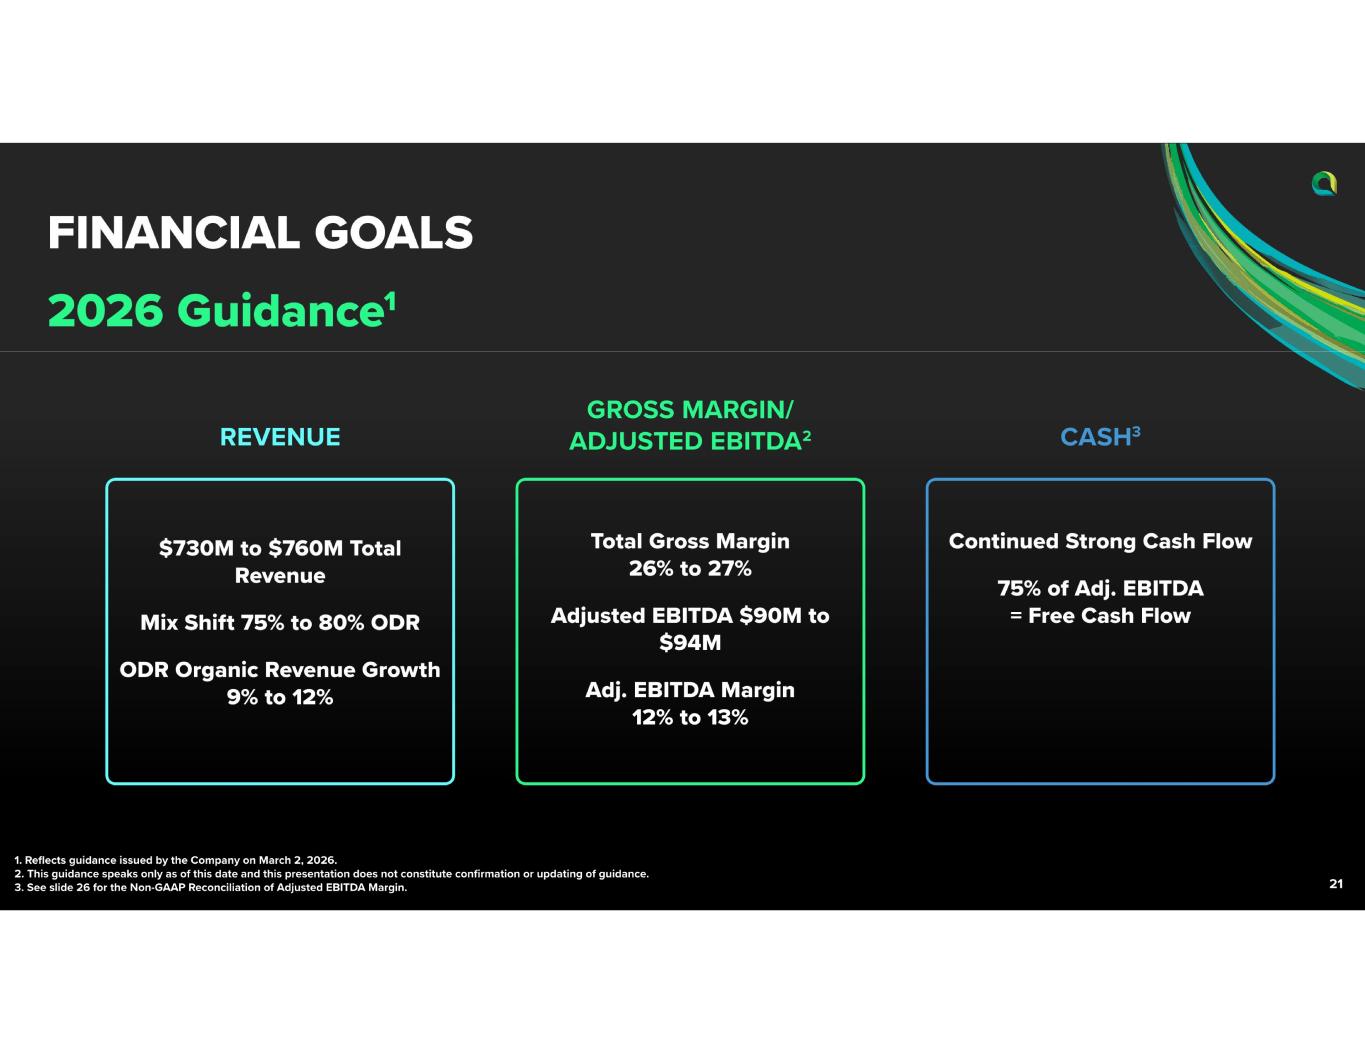
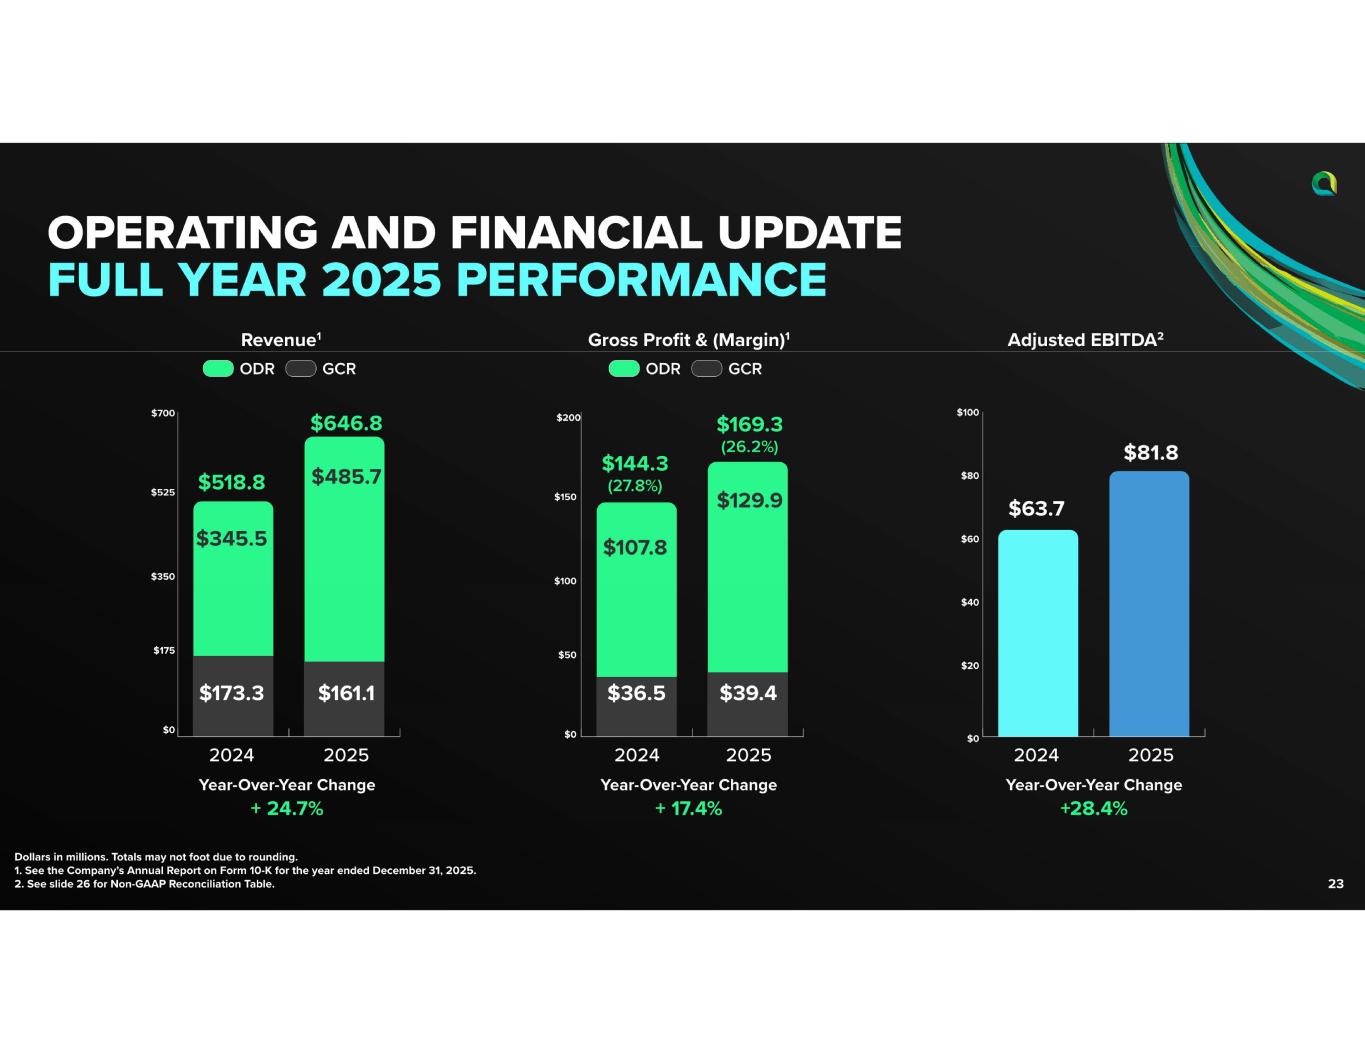
Good morning and welcome to our stockholders, analysts, and interested investors. We appreciate you joining us today. Yesterday, we reported our fourth quarter and full year 2025 results. But before I get into some of the business highlights, I want to recognize all the Limbock team members who deliver safe, quality-driven customer solutions. Our strategy is built on the foundation of great people, and this team delivered a record-setting year. I also want to comment on our announcement yesterday that we've been relocating our headquarters to Tampa, Florida. The relocation of our headquarters to Tampa reflects the fact that a significant portion of our senior leadership team and nearly 40 percent of our corporate workforce are already based in Tampa, where our presence has grown substantially since establishing the corporate office in 2020. The move marks a milestone of the company's 125th anniversary year, and we look forward to the future as we continue to grow and strengthen our presence in Tampa. Now turning to our strong results. 2025 marked a record year of significant total revenue growth of 24.7%. Notably, it's the first year our revenue has grown substantially since 2020 when we began executing our strategic shift to ODR. Our ODR-GCR mix for 2025 was 75% ODR and 25% GCR, right in the middle of our guidance range and a meaningful improvement from 2024's mix of 67% ODR and 33% GCR. Total ODR revenue grew by 40.6% with organic ODR revenue growth of 17%, reinforcing organic growth as a major driver of our success. Total gross margin was 26.2% for 2025 and 28.2% when excluding all of our acquisitions since 2021, demonstrating their legacy business gross margins remained stable when compared to 2024. We reported record full-year adjusted EBITDA of $81.8 million within our guidance of $80 to $86 million and a 28.4% increase from 2024. We generated $71.9 million in cash from operations, excluding working capital, in 2025, with $21.4 million generating Q4, reflecting our high rate of cash flow conversion. In December, we authorized a $50 million share repurch program, and finally, our balance sheet remained strong, with only $24.6 million in net debt, or a net debt to adjusted EBITDA ratio of 0.3 times. Turning to 2026, we are focused on three strategic core growth pillars, which include ODR and organic total revenue growth, margin expansion through evolved customer solutions, and scaling the business through acquisitions. Our first pillar is to grow ODR and organic total revenue. We expect our revenue mix between ODR and GCR to hold steady, but we focus on growing total revenue with ODR being the primary growth driver. Our strategy for growth is designed to combine national scale with local execution, allowing us to better serve mission-critical facilities. We're investing both to the local and national level to accelerate sales, leveraging its genetic growth. We have supported both growth objectives by strategically positioning two seasoned senior executives on accelerating sales. One executive is focused on local sales, while the other is responsible for driving national relationships. We believe this strategy will be a key element to supporting our investments and driving growth. As we focus on growth, we continue to manage project risk and reward through careful selection based on project size and short life cycle. In Q3, we discussed in detail our various ODR revenue streams. And as we mentioned, ODR revenue is broken down into two different categories. The first is fixed-price projects greater than $10,000, which represented approximately 73% of total ODR revenue for 2025. with an average ODR product size of approximately $240,000. The second category is recurring quick-burning revenue, which includes maintenance contracts, work orders for small fixed-price jobs less than $10,000, and time material work. In the full year 2025, our quick-burning revenue represented approximately 27% of total ODR revenue. We have also expanded our GCR gross profit by carefully managing the risk and reward profile as it relates to product size and scope. The average ECR project for 2025 was only $2.6 million. Our second pillar is margin expansion to evolve customer solutions. We differentiate ourselves from the competition by being a single-source provider for building owners, capable of providing comprehensive lifecycle engineered solutions. In 2026, we plan to continue to expand our offerings in six differentiated customer solutions, including integrated facility planning, service maintenance, equipment replacements and retrofits, equipment, mechanical, electrical, plumbing, and control, or MEPC infrastructure upgrades, energy efficiency and decarbonization analysis and projects. Our staff is being trained to bundle customer solutions and deliver long-term value to our clients. Each individual transaction may have a different margin profile, But the overall quantity of gross profit and the quality of blended margins is carefully managed. From 2020 through 2025, our total gross margin for the legacy branch businesses has grown from 14.3% to 28.2%. In total gross profit margin, total gross profit dollars has increased almost 50%, demonstrating that our teams are able to grow total gross profit while simultaneously enhancing margin. The third pillar is strategic M&A, aimed at extending the reach of the Lombok brand, strengthening our market presence, and expanding our capabilities. Through targeted acquisitions, we seek to diversify our vertical market exposure and broaden our geographic footprint, while adding new offerings to enhance our customer solutions. In 2026, we remain selective, as we would expect to pursue one to three acquisitions to meet our return thresholds by expanding our geographic footprint and increasing our local service capabilities. Additionally, we are looking for companies that expand our six core customer solutions. We are particularly focused on companies that expand our integrated facility planning solution. Due to their deep involvement in the capital planning process, these companies tend to have national relationships at healthcare, data centers, and industrial manufacturing. We believe the synergies between these two types of deals will help us reach our long-term vision to be an indispensable building system solution partner, providing national reach with local presence. Turning to our last acquisition, Pioneer Power, where the integration is well underway. We have largely completed the first phase of our value creation process, centered around system integration. Next, we are focused on the second phase of our value creation, which is all about increased gross margin. These strategic priorities in 26 will include negotiating T&M contracts, measuring margins by revenue size and type while setting specific goals, introducing Limbox sales training and sales enablement resources, identifying cross-selling opportunities by leveraging our respective national account relationships, and aligning resources to most profitable accounts. We expect margin improvement at Pioneer to take shape throughout 2026, with exit margins higher than current levels, as we start the second phase of our value creation process. We expect the gross margin improvement to continue for the next two to three years until Pioneer's margins reach alignment with the current business. Our record for improving margins of acquired companies is best demonstrated by our acquisition of Jake Marshall in December of 2021. At the time of purchase, the gross margin was approximately 13.4%. After four years of executing our value creation model, from gross profit benchmarking to establishing account-focused teams, Jake Marshall's gross margin increased to 28% for 2025. Today, Pioneer Power's gross margins is below the level where Jake Marshall was at the time of the acquisition. This is an indication of the meaningful value creation opportunity we have. Turning to the macro environment, we experienced positive demand improvement in the fourth quarter across all our verticals. Our institutional markets, healthcare, life science, and higher education rebounded after softness in the middle of last year. The government shutdown and the DC policy changes caused many of our customers to temporary pause activities. However, the subsequent recovery in these verticals allowed us to achieve 24% ODR organic revenue growth in Q4. I'll now make some specific comments on several of our key verticals. In our healthcare vertical market, many customers were spending their leftover budgets while also preparing 2026 normalized spending patterns during the fourth quarter. Due to the uncertainty of economic conditions in 2025, several national customers have started to engage us much earlier in their planning process. Our unique combination of professional service and installation expertise creates both speed-to-market and cost-certainty advantages. As customers are planning their budgets now, and given our early involvement in the design and planning process, we anticipate a softer start in 2026 with a revenue building throughout the year. As an example, in late December, one of our key national healthcare customers called us to help execute a critical infrastructure project. The engagement is worth approximately $15 million in contract value across three different hospitals in Florida. For this project, we are providing both program management and design-built services. They chose Limbock because of our demonstrated ability to seamlessly procure, design, and execute a complex project swiftly, whereas the engineering firm who performed the original assessment wasn't able to execute the project fast enough. The project expected to be designed in the first half of the year, with work on site to begin in the second half of 2026. Shifting to the data centers, where we have two very strong emerging relationships with hyperskilled data center owners. These relationships have been developed due to our successful delivery of projects out of the Columbus, Ohio location over the past several years. Given the traction we have achieved and future opportunities with these owners, we've decided to dedicate resources towards building a national vertical marketing focused on data center work. We believe we have the availability of resources and a unique skill set to position ourselves thoughtfully in this vertical. As an example of our traction at the data center vertical, it took place in Q4, where we awarded a specialty infrastructure project worth approximately $10 million in contract value. The scope of the project is to provide fabricated piping systems directly to the owner. This is the fourth project of this scope, and the owner has expressed interest in further expanding our relationship. We believe we are well positioned to see growth in this vertical in 2026 and beyond. In 2025, revenue from this vertical is less than 5% of total revenue. Our objective in 2026 is to increase vertical market diversity in the business, and expanding our data center market contribution is critical to achieving that objective. We see the opportunity for this vertical to represent a meaningful portion of revenue over time. In 2025, our industrial manufacturing vertical produced strong and steady results and was less affected by the D.C. policy concerns. Our recent acquisitions of Pioneer Power and Consolidated Mechanical help provide us with diversity, both from a geographic footprint and vertical market standpoint. Our work here is conducted primarily via time and material shutdown work and small project work. We expect first quarter revenue in this vertical to also be soft due to spending seasonality that traditionally picks up in April. Our success in 2026 will be driven by our ability to accelerate sales and leverage our previous investment. We expect our revenue and earnings to be weighted to the second half of the year, with growing confidence in the sales growth demonstrated by fourth-quarter bookings of $225 million, compared to $187 million in total revenue during the quarter, giving us visibility into 2026. Moving to our 2026 guidance, we expect revenue of between $730 to $760 million, implying year-over-year growth of 13% to 17%. Adjusted EBIT of $90 to $94 million, implying year-over-year growth of 10% to 16%. Underlying that guidance, we have used the following assumptions. Total organic revenue growth of 4% to 8%. ODR organic revenue growth of 9% to 12%. We expect ODR as a percent of total revenue in the range of 75% to 80%, reflecting the stabilization of the mixed shift, total gross margin of 26% to 27%, S&A expense as a percent of total revenue to be 15% to 17%, and free cash flow to be 75% of adjusted EBITDA for 2026, with significant cash shoots from operations at Q1 due to the timing of incentive compensation, insurance, and tax payments, with strong cash generation building during the remaining quarters of the year. As investors and analysts model 2026, it's important to note that our first quarter tends to be the slowest quarter of the year due to seasonality and customer spending patterns. We expect first quarter revenue to be similar to last year with lower adjusted EBITDA due to higher SG&A in 2026. Additionally, we don't expect Q1 of 2026 to have the same gross margin write-ups of $900,000 that we had in Q1 of 2025. And as previously stated, we expect the second half of the year to be stronger than the first half. As our booking momentums from last year converts into revenue, we expect revenue growth to accelerate in Q3 and Q4.
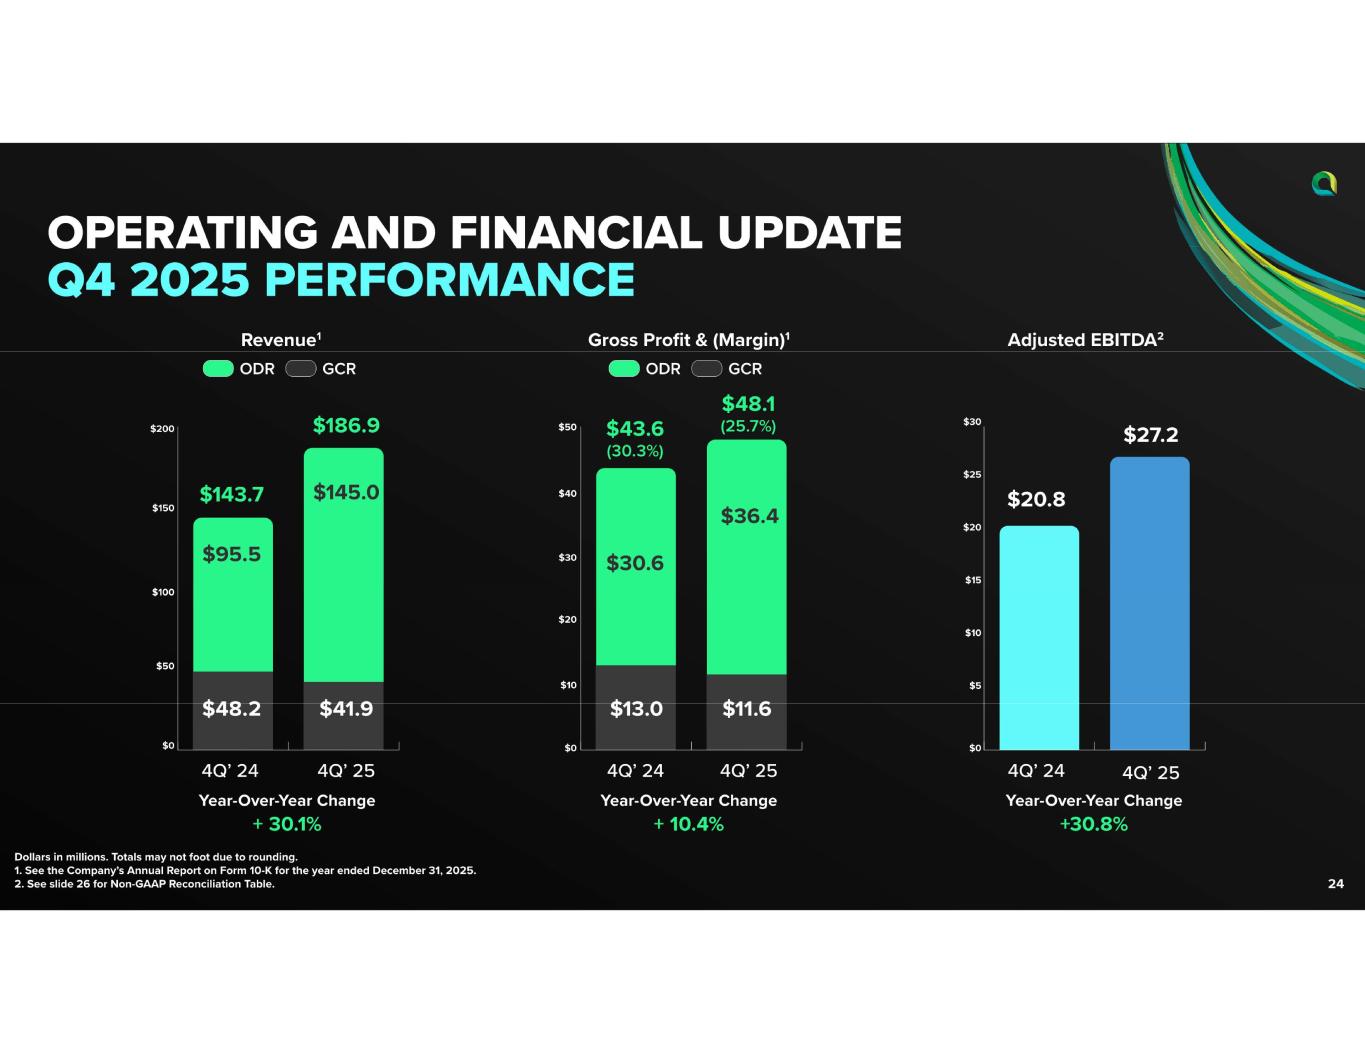
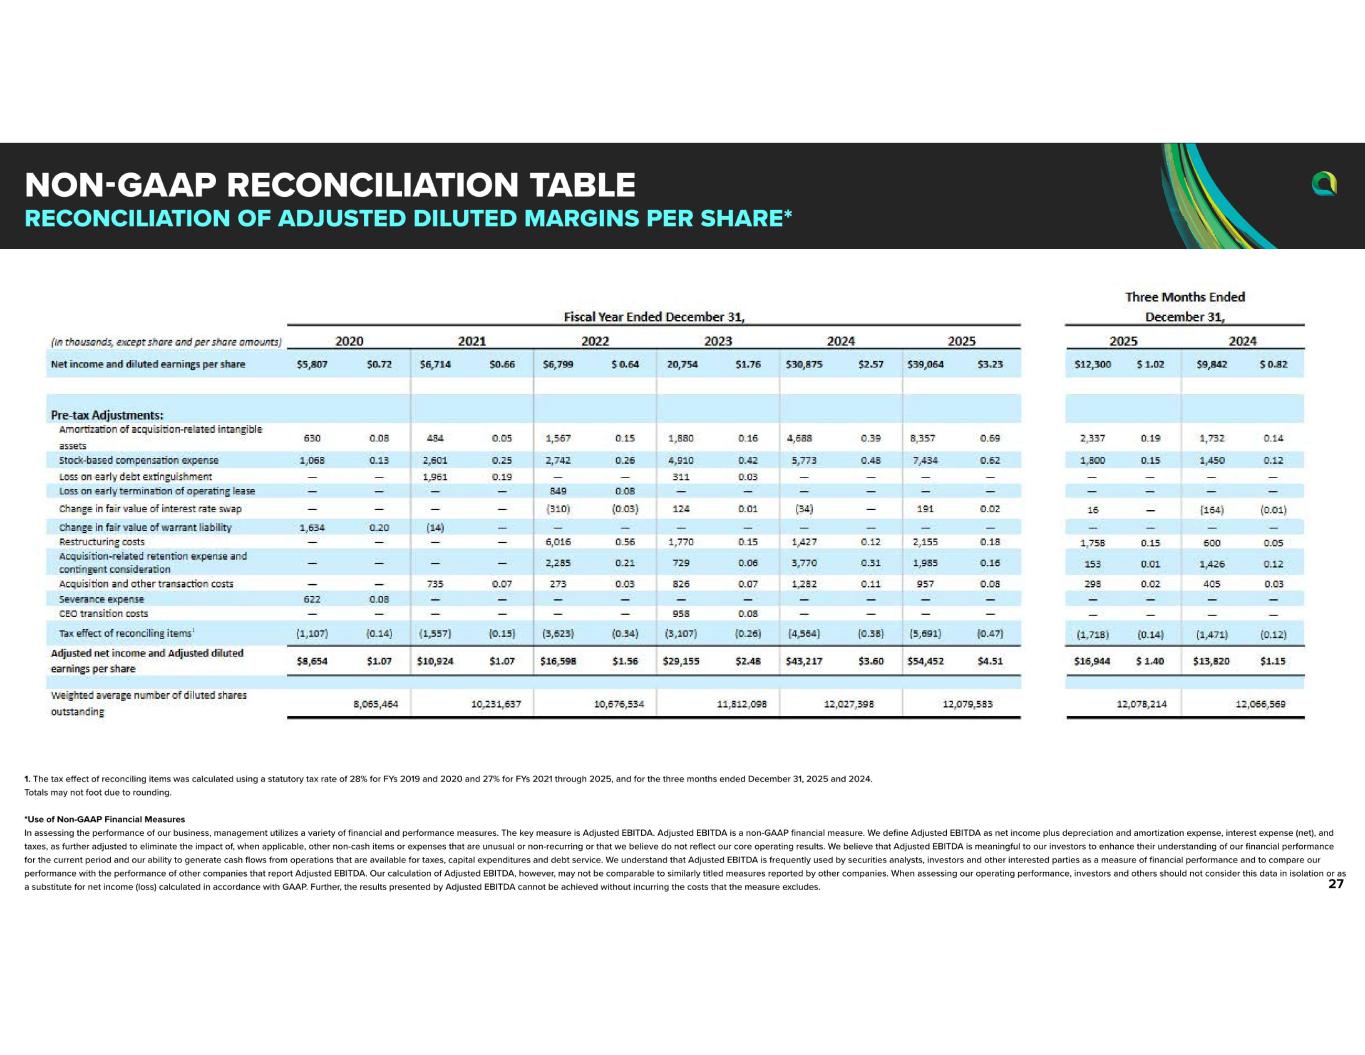
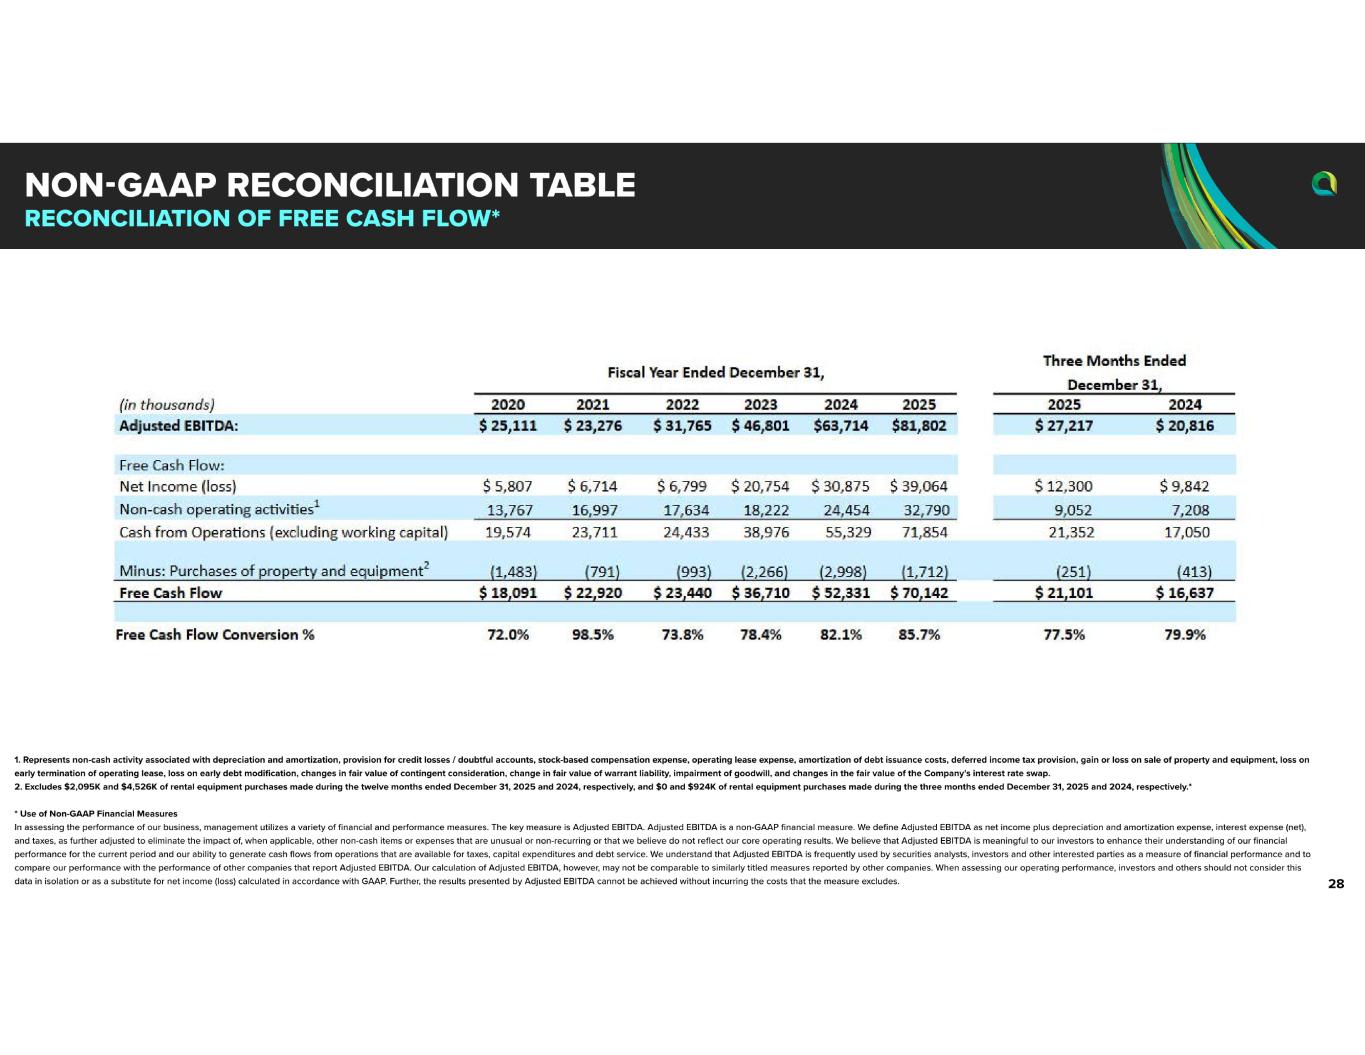
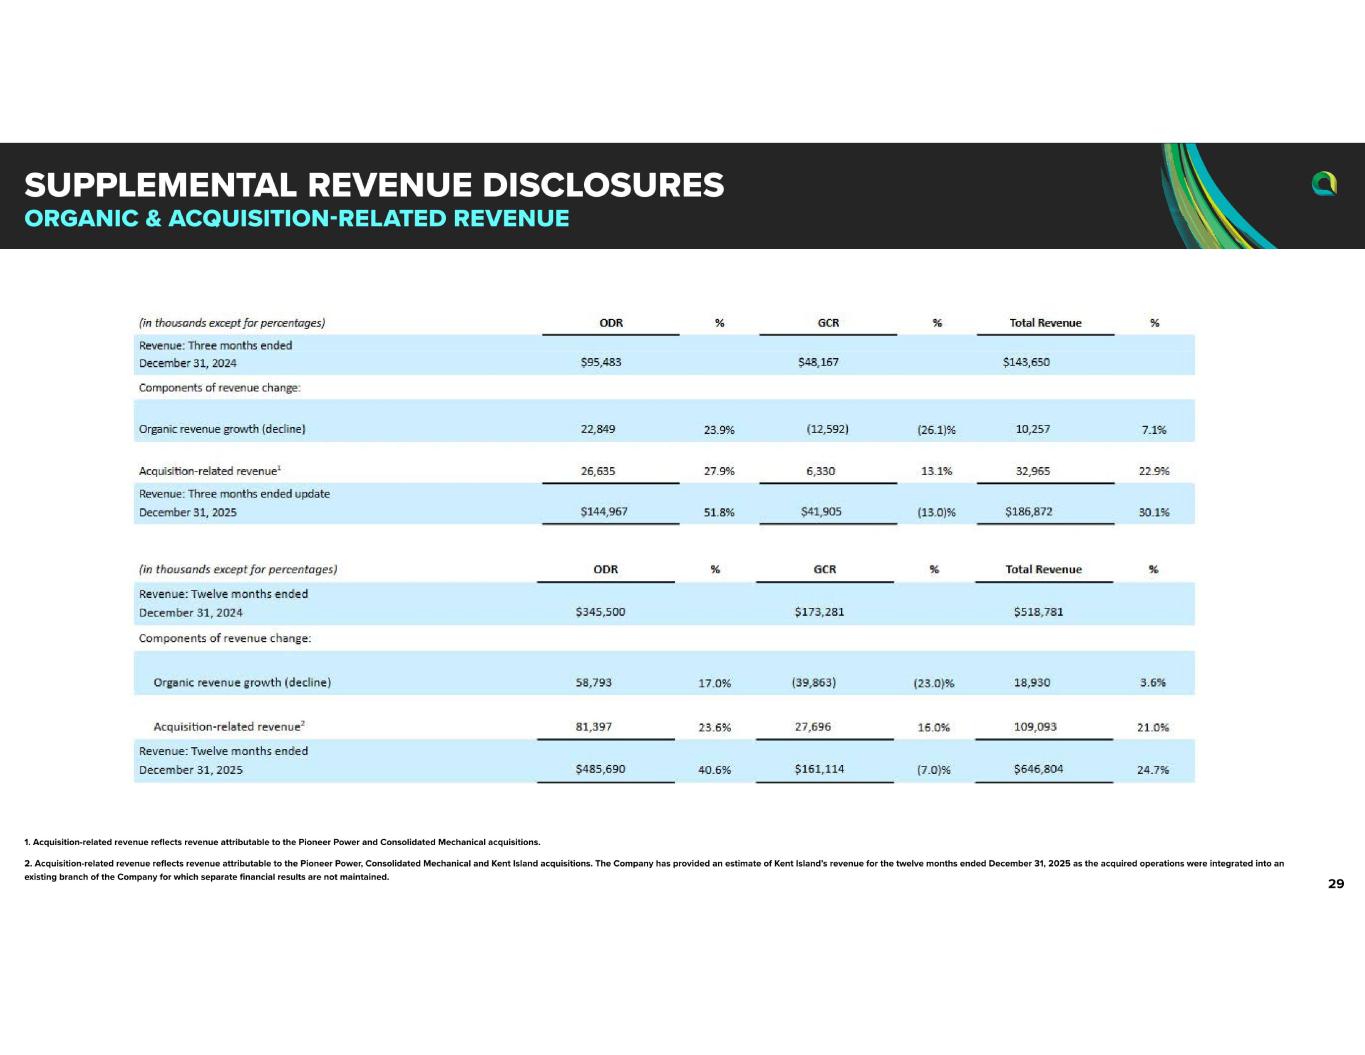
With that, I'll turn over to jamie to walk through the financials in more detail jamie our form 10k and earnings press release filed yesterday provide comprehensive details of our financial results so i will focus on the highlights of the fourth quarter and full year all comparisons are for the fourth quarter and full year 2025 versus fourth quarter and full year 2024 unless otherwise noted Starting with the fourth quarter, we generated total revenue of $186.9 million, compared to $143.7 million in 2024. Total revenue growth was 30.1%, while ODR revenue grew 51.8% to $145 million. Of the total ODR revenue growth rate, 27.9% was from the acquisitions and 23.9% was organic. GCR revenue decreased 13% to $41.9 million, of which 26.1% was a decrease in organic revenue, as designed as we continued our mid-shift towards ODR, offset by 13.1% growth in revenue from acquisitions. ODR revenue accounted for 77.6% of total revenue for the fourth quarter, up from 66.5% in 2024. Total gross profit for the quarter increased 10.4% from $43.6 million to $48.1 million, reflecting the ongoing growth of our ODR segment. Total gross margin on a consolidated basis was 25.7%, down from 30.3% in 2024, primarily driven by the impact of Pioneer power. As we previously communicated, our acquisition integration strategy is focused on improving the acquired company's gross margin to align with our broader operating model over multiple years. ODR gross profit comprised 76% of total gross profit dollars, or $36.4 million. ODR gross profit increased 19.1%, or $5.8 million, driven by higher sales volume, partially offset by lower ODR segment margin of 25.1% compared to 32.1% in the year-ago period. The decrease in segment margin was primarily attributable to Pioneer Power's lower gross margin profile. DCR gross profit decreased 10.2% or $1.3 million due to lower revenues. Gross margin increased from 26.9% to 27.8%, driven by our ongoing focus on higher quality projects. SG&A expense for the fourth quarter was $28 million, an increase of approximately 2.3% from $27.4 million. The increase was primarily attributable to incremental costs associated with Pioneer Power and Consolidated Mechanical. Consolidated Mechanical was part of the company for one month in the fourth quarter last year and Pioneer Power was not part of the company during the fourth quarter last year. As a percentage of revenue SG&A expense decreased to 15 percent of total revenue as compared to 19.1 primarily due to the increased revenue from Pioneer Power. Interest expense increased 0.3 million to 0.8 million compared to 0.5 million in the prior quarter, driven by higher borrowings under the company's revolving credit facility to partially finance the Pioneer Power's acquisition, as well as higher financing costs associated with the larger vehicle fleet. Net income for the quarter increased 25 percent from $9.8 million to $12.3 million, and earnings per diluted share grew 24.4 percent from $0.82 to $1.02. Adjusted net income grew 22.6% from $13.8 million to $16.9 million, and adjusted earnings per diluted share grew 21.7% from $1.15 to $1.40. Adjusted EBITDA for the quarter increased 30.8% to $27.2 million, compared to $20.8 million. Adjusted EBITDA margin was 14.6% compared to 14.5% in Q4 last year. Turning to cash flow, our operating cash inflow during the fourth quarter was $28.1 million compared to $19.3 million in the year-ago period, driven by higher net income in 2025, along with slight improvement in working capital. Free cash flow, defined as cash flow from operating activities, excluding changes in working capital minus capital expenditures, years, excluding our investment in additional rental equipment, was $21.1 million in the fourth quarter, compared to $16.6 million in Q4 last year, representing a $4.5 million increase. The free cash flow conversion of adjusted EBITDA for the quarter was 77.5% versus 79.9% last year. Now turning to the full year 2025. Total revenue increased 24.7%, or $128 million, to $646.8 million from $518.8 million, primarily due to the acquisitions of Piner Power, Consolidated and Mechanical, and Kent Island. Of the total percentage increase, acquisition-related revenue represented 21%, or $109.1 million, and organic revenue represented 3.6%, or $18.9 million. ODR revenue increased 40.6%, or $140.2 million, to $485.7 million, with acquisition-related revenue representing 23.6% of the increase, or $81.4 million, while organic revenue represented 17%, or $58.8 million. GCR revenue decreased 7%, or $12.2 million, to $161.1 million. Organic revenue represented 23% of the decrease, or $39.9 million, decline as the company continued its strategic makeshift to ODR, offset by acquisition-related revenue growth of 16%, or $27.7 million. Total gross profit increased 17.4% to $169.3 million compared to $144.3 million and total gross margin was 26.2%, a decrease from 27.8% in 2024, primarily due to the impact of Pioneer Power's lower gross margin and total net project write-ups of $5.8 million recognized in 2024 compared to $1 million in 2025. ODR gross profit increased 20.5% or $22.1 million to $129.9 million from $107.8 million, while gross margin decreased to 26.7% from 31.2%, primarily due to the impact of Pioneer Power's lower margin profile and ODR-related project write-ups of $3.9 million recognized in 2024 that did not recur in 2025. GCR gross profit increased 8%, or $2.9 million, to $39.4 million from $36.5 million, and gross margin increased to 24.5% from 21.1%, driven by the company's intentional focus on higher-quality projects. SG&A expense increased by approximately $12.3 million to $109.5 million, compared to $97.2 million in the prior year period. Of the increase, $9.3 million of the increase was attributable to incremental costs associated with Pioneer Power, Consolidated Mechanical, and Kent Island. Consolidated Mechanical was part of the company for only one month last year. Kent Island was part of the company for four months, and Pioneer was not part of the company during the entirety of last year. The remaining SG&A increase of $3 million is attributable to the existing business. SG&A expense increased primarily due to a $1.2 million increase in non-cash stock-based compensation expense and a $1.1 million increase in bad debt expense associated with the write-up of certain customer receivables that were deemed uncollectible. SG&A expense as percentage of revenue decreased to 16.9% compared to 18.7% primarily due to increased revenue resulting from the Pioneer Power acquisition. Interest expense increased $1.3 million from $1.9 million to $3.1 million due to higher borrowings under the company's revolving credit facility to partially finance the Pioneer Power acquisition as well as higher financing costs associated with our larger vehicle fleet. Net income increased 26.5% to $39.1 million from $30.9 million, and diluted earnings per share increased 25.7% to $3.23 compared to $2.57 in the prior year. Adjusted net income increased 26% to $54.5 million compared to $43.2 million, and adjusted diluted earnings per share increased 25.3 percent from $3.60 to $4.51. Adjusted EBITDA increased 28.4 percent to $81.8 million compared to $63.7 million and adjusted EBITDA margin was 12.6 percent compared to 12.3 percent. Our operating cash flow for the full year was 45.7 million compared to 36.8 million in the prior year free cash flow defined as cash flow from operating activities excluding changes in working capital minus capital expenditures excluding our investment in additional rental equipment was 70.1 million for 2025 compared to 52.3 million in 2024 representing a 17.8 million dollar increase the free cash flow conversion of adjusted evita for the year was 85.7% versus 82.1% in 2024. As Mike mentioned, for full year 2026, we continue to target a free cash flow conversion rate of at least 75% of adjusted EBITDA and expect CapEx to have a run rate of approximately $5 million. At this time, we don't anticipate any additional investments in our rental fleet. Turning to our balance sheet, as of December 31st, we had $11.3 million in cash and cash equivalents and total debt of $35.9 million, which includes $10 million borrowed on our revolving credit facility, hedged at a rate of approximately 5.37%. As a reminder, at the end of June last year, we expanded our revolving credit facility from $50 million to $100 million in principal amount borrowings. On July 1st, we used a combination of cash and revolver proceeds of approximately $40 million to fund the pioneer power acquisition during the quarter we paid down the revolving credit facility 24.5 million to the hedged amount of 10 million dollars and as of december 31st our total liquidity defined as cash and availability on a revolving credit facility was 96.3 million with this expanded facility and our expected strong cash generation our balance sheet remains strong and believe we are well positioned to support our continued organic growth initiatives, strategic M&A, and opportunistic share repurchases. That concludes our prepared remarks. Operator, you may begin the Q&A.
Operator
Thank you. We will now be conducting a question-and-answer session. If you would like to ask a question, please press star 1 on your telephone keypad. A confirmation tone will indicate your line is in the question queue. You may press star 2 to remove yourself from the queue. For participants using speaker equipment, it It may be necessary to pick up the handset before pressing these start keys. One moment, please, while we poll for questions. Our first question comes from the line of Chris Moore with CJS Securities. Please proceed with your question.
Hey, good morning, guys. Thanks for taking a couple. So, Mike, I might have missed a little bit of it. Can you talk a little bit more about the investment or specific steps you're taking to take advantage of the data center opportunity?
Yeah, absolutely. So one thing that's going to be, I think, really important to our strategy, and we started this last year as well, too, is really building three national vertical market teams. Healthcare, and in some sense that's been our proof point, industrial manufacturing and data center. And when we think about the way that customers buy, they buy some stuff locally, but I think from a national perspective and a capital planning perspective, it's a lot advantageous for us, even from a resource perspective. So from a data center market specifically, we've had some really good success in the Columbus, Ohio market with a few different customers. And we always like to prove things out before we really make sure that we go all in from an investment perspective. But as I referenced in the prepared remarks, it's our fourth project that we were recently awarded. And that customer and a couple customers are starting to tell to us, Based on your availability of resources, your unique combination of engineered solutions with your ability to install and fabricate, we think we're really in a great position, not just in the Columbus market, but in other markets as well, too. And some of that will be overlap from a geographic footprint perspective, and some of that may be providing services just like we do in healthcare and other geographies as well, too. So we think it's a really good opportunity. We've been patient, and I think we're at a point now we want to dedicate some resources, and we hope this vertical becomes a meaningful portion of our revenue over time.
Got it. You could see that potentially in a few years that could be your number two vertical?
We're going to see how it goes. We think there's tons of potential, though. I mean, the spending of these customers, you know, and we're really all in on these three verticals, healthcare, industrial manufacturing, data center, but we think it's also a great opportunity of an avenue from a diversity perspective as well, too. So we're pretty bullish on it.
Got it. In terms of the ODR organic guide, 9% to 12%, Pioneer, in terms of the back half of 26, is there any organic from Pioneer embedded in the 9% to 12%?
Yeah, so after the first half of the year, then it becomes part of our organics because the acquisition date was July 1 of last year.
Exactly. I just wasn't sure if you're assuming much growth from Pioneer. I'm just trying to get a sense in terms of how that business is going and if you assume some growth there later in the year as part of that, as part of your 9% to 12%.
Yeah, no, just a couple things on Pioneer as well, too. Our focus, for sure, obviously we want to see growth in them, but I think the gross profit improvement is equally, if not more, important than really seeing from a revenue perspective. Several different things. We're kind of moving past the phase one, which is really that system integration, people process, getting the accounting system switched over. And I think we're really focused, especially in the back half of the year, from a gross profit perspective. A couple things that I'll really hit on that we're going to focus on is, number one, our ability to push resources towards their best account, look at metrics from a year-over-year perspective, revenue types, getting on our accounting system allows us to do this, utilization of sales resources as well as to. So we're really looking to deploy the full breadth of our value creation process, and really that's really getting into the phase two implementation. So in the back half of the year where it's going to be our focus, it's still going to take some time. You've got to go back and renegotiate some contracts. You've got to reintroduce yourself from a customer standpoint. So we've seen some real positive things, and we're looking, I think, not just in 26 but in 27 and 28 of really seeing that business get to the point where it matches the other legacy businesses from a margin perspective. We think this is a really good opportunity.
I'll leave it there. I appreciate it, guys.
Operator
Thank you. Our next question comes from the line of Rob Brown with Lake Street Capital Markets. Please proceed with your question.
Rob Brown
Analyst — Lake Street Capital Markets
Coming up on the organic growth, I know you've kind of gotten for a year, but what longer term, how do you see the organic growth in the ODR segment once you sort of get Pioneer integrated and the business is running? What's sort of the long-term organic growth there? I think in the past you said that in 2018 it's 20%.
Sure. You know, last year we were at 17%. we had a strong finish in Q4. And this year, we're guiding to 9 to 12. I think we're really kind of focusing only on 26 from that perspective, but we're also trying to think about what is our real normalized growth rate from an organic revenue perspective as well, too. And I think about our growth trajectory as we look forward, our ability to still get really strong local results. We're going to continue to invest and support our sellers that we've really invested in the last three years as well, too. The other thing, too, is I think, you know, from a national vertical market perspective, our access to capital and driving different decision makers and being a national provider, that's going to be an avenue as well, too. So we're really focused on that 26, but we're obviously looking forward to see what the normalized level is and what I would say also from an opportunity perspective, too.
Rob Brown
Analyst — Lake Street Capital Markets
You talked about pretty strong bookings in Q4 above the run rate. How is that compared to normal and, you know, it seems like the environment is getting better? You know, maybe a sense of just how the bookings are coming in and what you see for the next one.
Yeah, so one of the things that we've learned as we continue to transition the business, backlog is a factor, but sales bookings are really what we look from a business perspective. In Q4, we booked $225 million versus $187 million in revenue in Q4, 1.2 ratio. I mean, anything, in our opinion, above one obviously shows that there is some forward trajectory in the business as well, too. So we like when the bookings are more than the revenue. We think we're starting to turn the corner from a sales perspective. We've learned a lot from a sales perspective, and I think we're really starting to turn I think the other thing, too, that we saw a little bit in Q4 was our ability to get involved And sometimes that may be from customers that looked at strained budgets from 2025 and really starting to plan effectively. I would say specifically in the healthcare vertical market, we're definitely involved much more from a planning perspective. We're starting to understand where customers spend. I think probably the third different quarter in a row, we reported kind of a national healthcare provider giving us multiple projects that were born out of facility assessments as well too so we think we're turning the corner um and uh we're looking forward obviously from from continue to look at that sales bookings versus revenue as kind of a key indicator okay thank you i'll turn it over thank you our next question comes from the line of jerry sweeney with rob capital partners please proceed with your question good morning jamie mike thanks for taking my call good morning um just staying on the topic
of growth. Obviously, earlier in January, you announced two new positions, EVP is sales and a head of national customer solutions. How does this sort of play into the strategy of growth? And it feels as though you're sort of maybe maturing into maybe a different position of growth. I just wanted to see how this all plays together and maybe drive some opportunity down the line.
Yeah, I think one thing that's really important from a messaging perspective, local and national, they're both really important to us. So, and we thought to ourselves, the best way to make sure that we're going to get the results is to take two proven executives and make sure that they're assigned specifically to that task. So one of them is going to be working on sales enablement. Really, how do we, we've invested about 100 to 120 salespeople over the the last three years? How do we support them with tools training? How do we help them actually deliver those sales? And we're really excited to have that particular focus. The other individual is focused on national accounts. You know, in some organizations, that may be two different roles. For us, it's so important that we want to make sure we have two different executives working on it. And I think the other thing, too, it's not like these two were working kind of independently from that perspective. They have independent focus, but there's lots of synergies as well, too. So I really, and I think that's why it's important that we've got people that understand the business. So I think when we start to mature, having that ability to sell at the national level and from a national reach, geographic, and as well as being able to deliver from a local geographic footprint perspective, we think that's going to be one thing that's going to make us really differentiated and really continue to elevate where we're at as far as from a customer experience perspective.
How much of your sales has come from sort of a national account opportunity or has it been much more on the local front?
I would say the majority have been local. We've had lots of opportunities over the years from a national perspective, but we haven't had that focus. At the end of the day, the national customers, I don't care if it's data center, industrial manufacturing, or from a healthcare perspective, they want to see a seamless experience. And when they see a seamless experience, they're more willing to allocate more capital. So sometimes even from a local perspective, we can only take it so far with the local team. The top person at one of these mission-critical facilities could be the facility manager.
And all of those corporate decisions get made at headquarters office and um we've had some success with healthcare that we feel like we can uh we can extend that but i would say a lot of the sales have been local our opportunity is that we have a combination of local and national gotcha and then just one more question on acquisitions listen um uh you know i think you're looking at uh maybe getting into different areas like integrated facilities uh opportunities and and um there's a lot of companies out there that sort of fit in that space that maybe even purchase for higher multiples. So one question maybe with an A and B aspect, I mean, do you continue to go after these opportunities or will you have to pay up for these opportunities? And secondarily, does it make sense to maybe shift away from the pioneer powers where it takes multiple years to sort of integrate it into your system and go after acquisitions that are more like right down the middle, like a fully integrated facility-type acquisition. So in other words, buying, paying up a little bit for an opportunity right in the wheelhouse versus maybe fixing one up.
Yeah, so we look at it as important. Our long-term objective is to be an indispensable part of building owners with national reach and local presence. So when you think about national reach from an acquisition perspective, our ability to invest in companies from an integrated facility planning perspective. They could be professional service companies. They're the ones that are going to have some of these relationships. They're going to be from a planning perspective. We think that's really important. When I think about the concept of local presence, you're still going to need that geographic footprint as well too. So I don't think it's a question of one or the other. It's a question of combining the two of them together and making sure these acquisitions fit with that long-term projective. Obviously, from a geographic footprint perspective, the multiple may be different than from an integrated facility planning perspective. But our end game remains the same. Buying companies, great companies with great people that can ultimately achieve our long-term objective and making sure there's a really good fit. We're not just buying assets and compiling them. We're making sure that they're really smartly integrated from a strategy perspective.
Got it. I appreciate it. Thanks. Thanks, Jerry.
Operator
Thank you. Our next question comes from the line of Brian Brophy with Stiefel. Please proceed with your question.
Yeah, thanks. Good morning, everybody. Just following up on the national account discussion here, in the past, you kind of talked about going from 20 MSAs to 40 MSAs and then pursuing national accounts. Now it seems like you're leaning into it a little bit more heavily, but we haven't obviously hit that 40 MSA number. So can you talk about what's driving that change and just confidence level and being able to secure some of these despite not having a larger footprint?
Yeah, so we've looked at it, and we've really tested our paradigms on this as well, too. So we've realized, I think, especially in the healthcare, and I think we're going to see the same thing in the data center, it's great that we're in a geographic location. It's almost an added benefit, but we can still provide a suite of services. as an example, we can still provide design-built services even if we're not in a geographic footprint as well, too. So I think about when we think about future MSAs, we're looking for overlap of national customers because not only can we provide high-level program management design-built services, we get an added benefit from an installation process as well, too. So I think really we're still going to need geographic footprint, but if we can combine with a national account, national account presence, it's going to accelerate the opportunity within not only the acquisition that we purchased, but also from a national vertical market perspective. So we're going to be really strategic from those MSAs.
Got it. That's helpful. And then do you have a sense or can you give us a sense of how much of the growth in the guide is related to capitalizing on some of this national account opportunity? Or should we expect to see more of these benefits in 27?
I think to really, for it to really take off, it's going to be 27. I think there's some built in, but I think it's really going to be this year is focusing on from a selling perspective. So some of this stuff you've asked questions for about the healthcare jobs that we sold last year, well, those are going to obviously get a revenue this year. But we're going to see some of it, I think, in the back half of the year. But I think the real opportunity from accessing capital, being able to burn the work, I think that's going to be as much of a 27, even more so than a 26 perspective.
Okay, that's helpful. And then just one clarifying question on the data center opportunity. Are you still focused on existing buildings here, or are you starting to get into new construction at this point?
We're focused on existing building. There's been situations where we've been able to provide infrastructure. From a carve-out perspective, a lot of the work is direct-to-owner. So I think that's one thing that we're super focused on. I think as we get into these relationships, we're going to make sure we're always getting the right risk-adjusted returns, too. I think we want to make the smart business decision as well, too. So we're going to look at the opportunity, and we're going to make sure that it makes sense with our strategy.
Appreciate it. I'll pass it on.
Operator
Thank you. And our next question comes from the line of Tomo Sano with J.P. Morgan. Please proceed with your question.
Good morning, Mike, Jamie. Good morning. Thank you. Could you please provide an update on integrations of Pioneer Power and share a concrete some timelines, milestones for gross margin improvement? Additionally, what lessons have you learned from previous integrations, such as Jake Marshall, regarding driving a margin improvement at acquired businesses, please?
Yeah, absolutely. So there's a couple different pieces of information that we provide. One of them, I mentioned the prepared remarks, but it's also in slide 18 in our deck as well, too. So a couple things. You know, we're at the point from a Pioneer Power perspective, we're really wrapping up phase one integration. And we've learned from past deals, the sooner we can get through phase one, the better. And a lot of times that's directly related around the accounting system upgrade. We've, you know, we just want to get that out of the way. We want to accelerate that process. That allows us to see numbers. It's a big change management piece that we try to get through. So I think at this point, we're really focused from a phase two implementation perspective. So we tried to provide some additional information that we thought would be helpful for investors just to kind of show the trajectory from a Jake Marshall perspective. Jake Marshall, at approximately the time of purchase, was 13.4% gross profit. At the end of 2025, they were approximately 28.1%. So a tremendous increase in gross profit. One thing we learned from Jake Marshall is our phase one got pretty extended. We didn't really switch over the accounting system for 12 months, and we learned that we wanted to get that out of the way as quickly as possible. So that's one of the lessons learned we applied. The second lesson learned that we applied is we want to be in front of the customers as soon as possible. We want to listen to customers. We want to have joint meetings. We've already started that process from a pioneer power perspective last year, and we want that to build into additional. So part of the reason for that is we want to learn what their pain points are, what kind of value are we bringing, so we can then propose on different solutions that can drive margins as well, too. Sometimes there's an opportunity to rate margins, but margins with value is much more better from a long-term customer perspective as well, too. So we want to be, I think the focus, especially at the beginning of the year, hopefully we see impact in the second half of the year, is get in front of customers, making sure we're focused on them, listening to what they want, and then propose solutions that can drive margins hopefully in the back half of the year and really start to impact in 27. So when I look at the trajectory from a gross margin perspective, we kind of have that Jake Marshall example. Our objective, of course, is how can we accelerate that timeline but still implement those lessons learned?
Thank you, Mike. And follow up on gross margins. To achieve 26%, 27% gross margin guidance, what are the most material risks and uncertainties you are monitoring for 2026, and how are you preparing the business to navigate potential headwinds?
Sure. So we're very focused on making sure that we're smart from a risk perspective. So one of the things, too, if you look at both our Owner Direct fixed-price projects greater than $10,000, and still an average project size of $240,000. GCR projects are an average project size of 2025 of $2.6 million. So we really try to make sure that the projects have as short a duration as possible. That allows us to flex and ebb as well, too. So that's always been very important from a strategy perspective. And I would say kind of maybe from a holistic perspective is a lot of our model really comes down to our ability to sell. That's why, from a Q4 perspective, our ability to sell $225 million versus revenueing $187 million is, to us, an important step. I think as we continue to sell work, we really want to evaluate from a risk perspective as well, too. So it's a careful balance, but those are probably the two things that we really look at and are always looking for opportunity to improve gross margin.
Thank you. I appreciate it.
Operator
Thank you. And we have reached the end of the question and answer session, and now I'll turn the call back over to Mike McCann for closing remarks.
In closing, our strategic priorities for 2026 are the following. ODR organic revenue growth and total revenue growth, margin expansion through evolved customer solutions, smart capital allocation scale through acquisitions. Over the past several years, the company has transitioned from a typical ENC contractor with single-digit EBITDA margins to a predominantly ODR-based platform with strong free cash flow conversion, operating with very minimal leverage. The structural shift is largely complete, and our focus is now on growth. Every acquisition since 2021, Jake Marshall, Acme Industrial, Industrial Air, Ken Island Consolidated Mechanical, Pioneer Power, was sourced on a proprietary basis and was strategically aligned with our specialized value approach, cultural fit, and niche expertise across our verticals. All of our acquisitions were underwritten at multiples of five to six times adjusted EBITDA, and with the operational improvements we make, the ultimate multiple paid is lowered by the growth in EBITDA. Through a repeatable playbook, we improved margins and used resulting cash generation, deleveraged, and redeployed capital. The company has expanded its adjusted EBITDA margin from 4.4% to 12.6% in 2020, and our leverage sits at just 0.3 times. And we maintain nearly $100 million of liquidity, all while meaningfully increasing the quality and margin of the business. At Limbock, we're building a long-term business model focused on delivering durable value over time. We bring a unique combination of engineered expertise and direct execution with building Through long-term consultative relationships, we help our customers deliver multi-year capital plans that extend beyond traditional backlog. We believe this differentiated approach positions us well for sustained growth and shareholder value creation on march 22nd through 24th we're attending the ross conference in california and we hope to see some of you there thank you again for your interest in limbach and have a great day this concludes today's conference and you may disconnect your line at this time we thank you for your participation have a great day