Operator
Hello, and welcome to today's Matthews International Third Quarter Fiscal 2026 Financial Results. At this time, all participants are in a listen-only mode. Later, you'll have the opportunity to ask questions during the question-and-answer session. To register to ask a question at any time, please press star 1 on your telephone keypad. Please note that this call is being recorded, and I'll be standing by should you need any assistance. It is now my pleasure to turn the meeting over to Daniel Stopar, Chief Financial Officer and Treasurer. Please go ahead, sir.
Good morning. I'm Dan Stopar, Chief Financial Officer of Matthews. And with me today is Joe Bartolaci, our company's President and Chief Executive Officer. Before we start, I'd like to remind you that our earnings release was posted on the Investor Section of the company's website, www.matw.com, last night. The presentation for our call can also be accessed in the Investors section of the website under Presentations. Any forward-looking statements in connection with this discussion are being made pursuant to the safe harbor provisions of the Private Securities Litigation Reform Act of 1995, factors that could cause the company's results that differ from those discussed today are set forth in the company's annual report on Form 10-K and other public filings with the SEC. In addition, we will be discussing non-GAAP financial metrics and encourage you to read our disclosures and reconciliation tables carefully as you consider these metrics. In connection with any forward-looking statements and non-GAAP financial information, please read the disclaimer included in today's presentation materials located on our website. Now I will turn the call over to Joe.
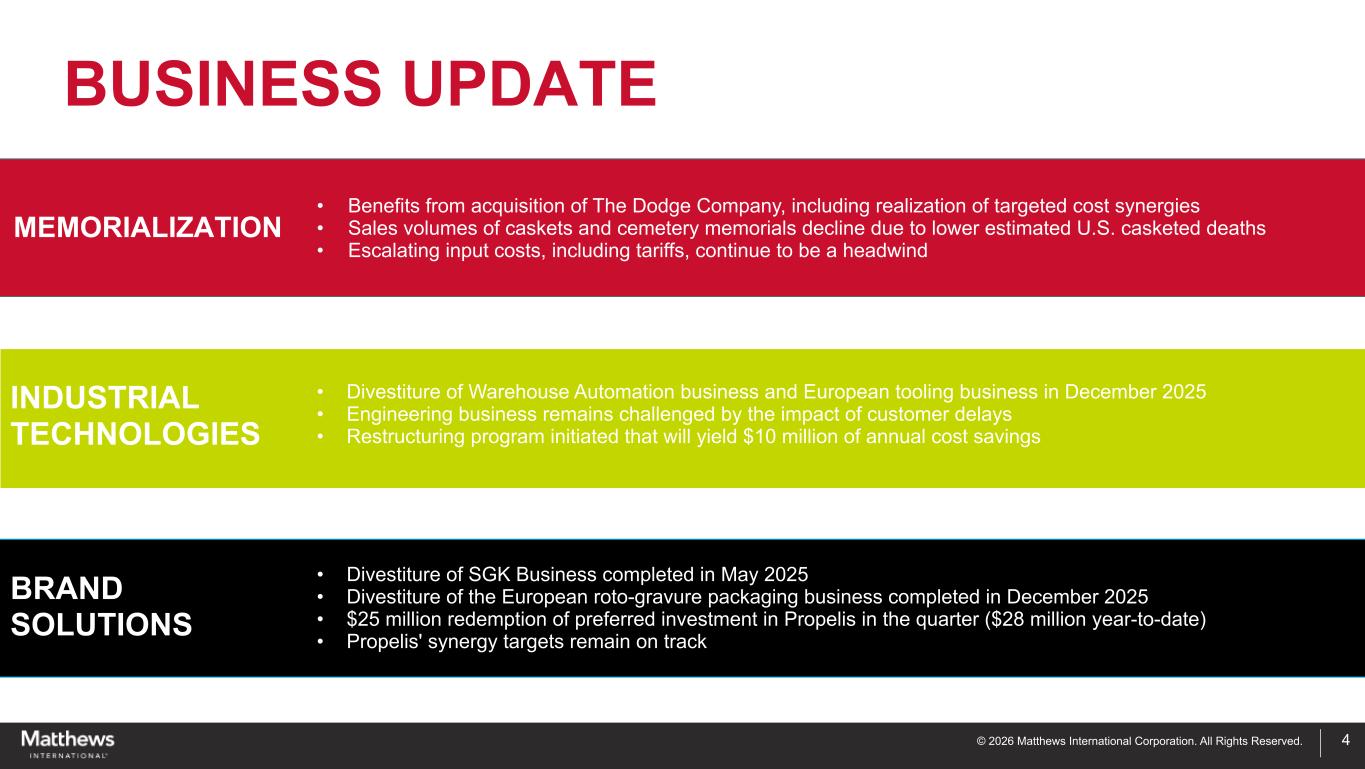
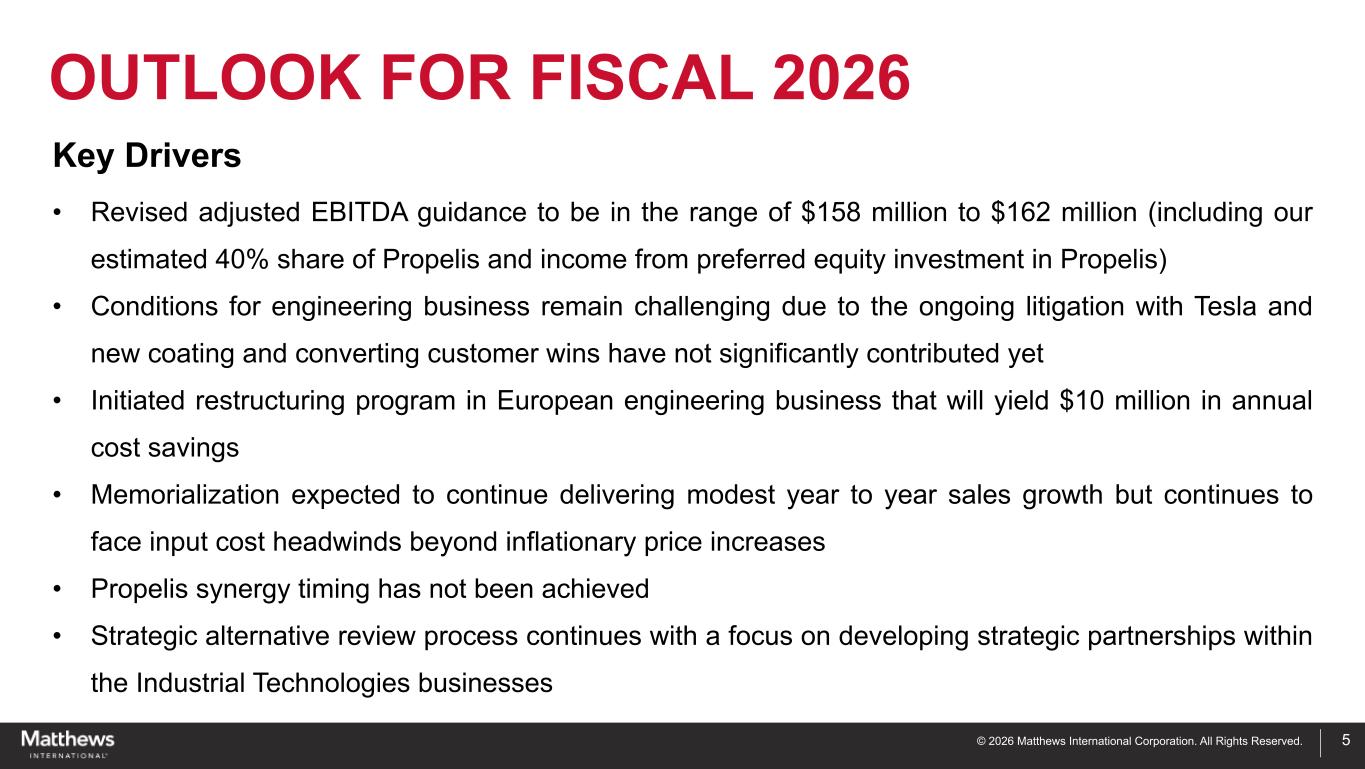
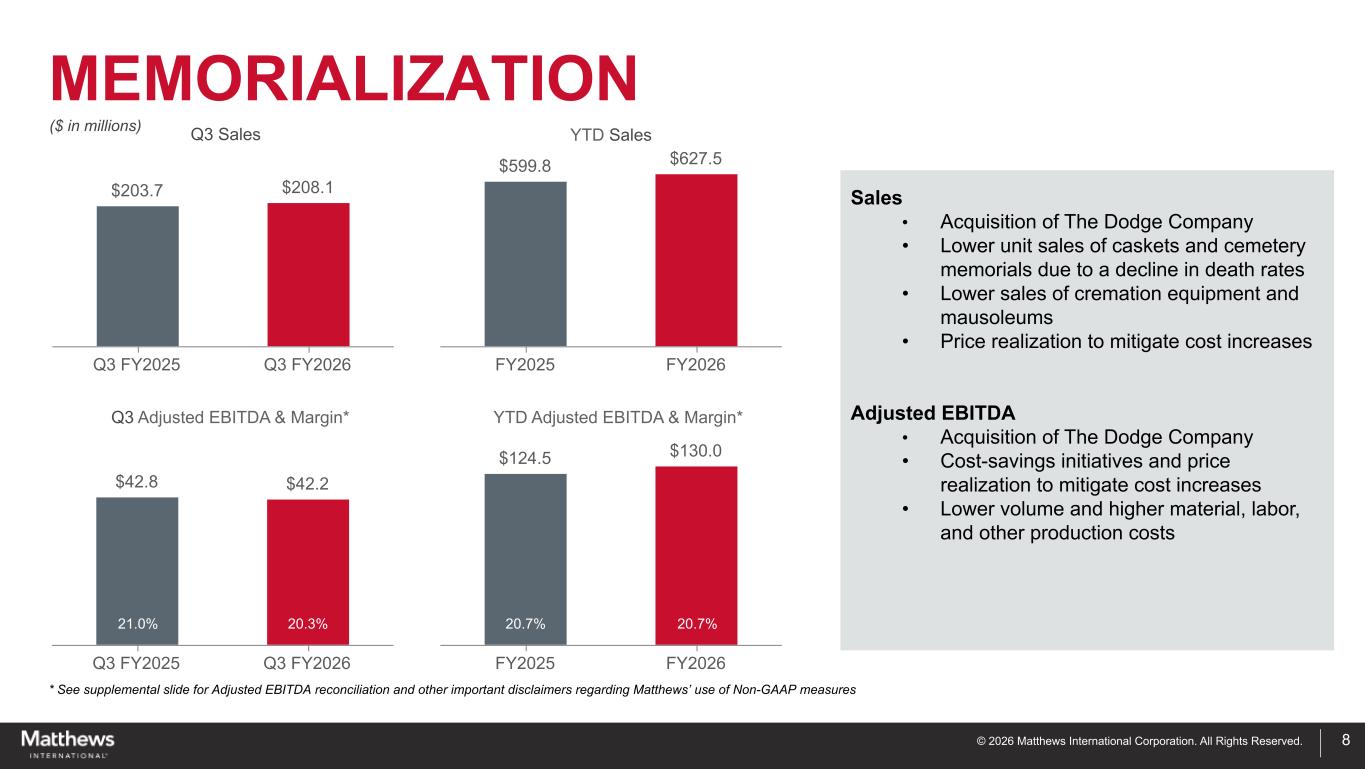
Thank you, Dan. Good morning and thank you for joining us to discuss Matthew's fiscal 2026 third quarter results. Before I begin, I want to acknowledge that this was a difficult quarter. I'm going to be direct with you about the choices that we made, what happened, what didn't, and why we remain confident that we have taken action to prevent this from happening again. Moreover, I want to emphasize some exciting developments in our business in which we see significant opportunity. Now then, on our last quarter call, we told you four things could impact our full year results. The pace and timing of engineering orders, the outcome of tariff discussions at the federal level, the timing of synergies at Propelos, and the economic impact of geopolitical challenges. This quarter, all four of those identified risks affected us negatively to some extent. We would rather be direct about that than suggest that we're caught by surprise. We knew these were risks to our guidance and we appropriately cautioned for those risks. Unfortunately, we did not expect that all of those risks would go against us. Now, what this quarter did deliver. Propelos returned $25 million of our preferred equity as we have targeted, which we used to primarily bring down our debt balance. Memorialization continued its year-over-year improvement on a nine-month basis, and product identification sales grew 5% in the quarter compared to a year ago. Our corporate cost structure continued to come down, and we took decisive restructuring action in our European engineering operations. While painful in the near term, we expect this action together with others will prevent this from happening again. What this quarter did not deliver. The engineering order conversions at the timing we expected. A memorialization death rate rebound that remained softer than we had modeled. Materially higher input costs, which we thought would dissipate and propel a synergy capture in line with our expectations. I will address these head on. The fiscal 2026 third quarter was a challenging quarter for us across most business segments, but in particular on our engineering business. We continue to experience delays in the energy storage solutions business, which are expected to extend through the balance of the fiscal year. Those delays are in line with the overcapacity for battery production across the industry. Importantly, however, we are commissioning our new mass production machine to be used to test chemistry formulas at mass production scale. I'm happy to report that the line of OEMs and battery suppliers who have reserved time on the equipment starting in October continues to grow and represents the most significant interest that we have ever seen. Many of the leading players in the European, Japanese, Korean, and U.S. auto industries and several key players in the battery industry are back again at our doors seeking testing time, quotes, and joint development discussions. In particular, we are seeing accelerated interest in the commercialization of our DBE solution by auto manufacturers who have concluded they must own their own battery manufacturing capability in order to compete in the future. This is all good news as we continue to be the only provider to have developed a solution to meet this market need. Regarding the balance of our engineering business and our coding and converting business known as Olbert, we won one of the orders that we had anticipated this quarter. Moreover, despite that order being significant, the project will not be a major contributor to our financial results this year. The order was received in early June and the customer immediately modified the scope of the work, thus limiting our ability to recognize any material revenues. Regarding other orders that we were anticipating, we are notified in early June that we lost two of those orders and others are now not expected to be received until September. In response to these challenges, we have taken difficult but necessary action to reduce the cost base of this business by $10 million annually. Unfortunately, being based in Germany, those actions are not as immediately impactful as they may be in the United States due to local regulations and unions which have negotiation rights. And most importantly, we are evaluating strategic alternatives for this business, a process which is expected to continue through the fourth quarter. During this time, we will be required to retain some of the talent, thus causing us to make the choice of being less than complete with our restructuring. These activities have delayed further action at this time, but should they fail, we will take the necessary actions to further restructure the business. Additional good news on the energy business front comes from our ultra-capacitor capabilities. We are in the early stages of qualifying DBE electrode with potential partners to be sold into the industry as a finished product. We remain optimistic about the opportunity and are evaluating different business models. We are not going to put a timeline on a partnership announcement at this stage and note that this remains early stage work, but suffice it to say that we have already produced the product and we know the economic benefits that we bring to an existing substantial industry. With regard to our energy business, our objective is to control our cost structure while not degrading the capabilities of our team. We know that we have a highly valuable know-how and are biding our time as the market comes to us. As I mentioned earlier, we initiated a restructuring program in our European operations, but we have remained cautious not to cut to the core. We expect this business to show signs of improvement in 2027. On the Tesla matter, the arbitration's liability phase is complete, and the outcome affirmed the limited scope of Tesla's misappropriation and breach claims. The remaining phases of that case, Tesla's damage claim, which we do not believe are material, and our counterclaims are moving through the process. The long-term thesis on DBE technology is intact and is actually strengthening. If you follow the industry at all, LG has publicly stated its intent to pursue strategic DBE applications across new and existing facilities they have specifically identified roll-to-roll processing the most viable technology and as i have stated we remain the most advanced provider in that space samsung and others continue to affirm db is a critical enabling technology for our next generation battery chemistries and we are working with several solid-state battery providers on joint marketing solutions to deliver the end product regarding our memorialization business, we continue to experience headwinds in terms of lower volumes as a result of its record low death rate combined with significantly higher input costs, which have escalated beyond our inflationary price increases. We have watched as copper prices have gone from $4.50 per pound to $6.60 per pound and continue to rise. Steel prices have risen 21% on a year-over-year basis, while fuel costs have outstripped our expectations that we had when we provided guidance last quarter. Although we have raised prices and intend to continue to do so in order to meet our rising costs, the speed and magnitude of cost increases have materially outpaced our price increases, particularly where we have fixed contracts which do not allow more frequent price adjustments. The memorialization segment reported sales of $208 million for the third quarter, up from $204 million a year ago, a 2.1% increase on a reported basis. Adjusted EBITDA was $42.2 million, roughly in line with the prior year's $42.8 million. For the first nine months of fiscal 2026, memorialization has delivered $130 million in adjusted EBITDA, compared to $124.5 million in the prior year, a 4.4% improvement that demonstrates the fundamental health and stability of this segment. Our memorialization revenue step down from Q2's $215.3 million to Q3's $208 million reflects a consistent seasonal pattern in this business. Gasket volume is an at-need product that peaks alongside flu season in our second quarter and steps down in the third. Bronze and granite memorial products work on a lag, particularly in the Northeast, where installations wait for ground to thaw, which is why our third and fourth quarters are typically the strongest for our memorial products, and our first quarters seasonally weak across the industry. Layered on top of that, ordinary seasonal pattern this year, casket and cemetery memorial volumes continue to be a headwind due to lower estimated U.S. casket of death, a trend felt across the industry. To give you a sense of the industry backdrop, published U.S. mortality data show the overall death rate fell to its lowest recorded level last year, down approximately 4.6 percent, the largest annual decline on record as a share of the population. We build our forecast on the assumption that volume would improve in the second half, consistent with historical patterns. What we have seen instead is an unusual industry-wide further decline, reflecting a new historic low for death rates on a per capita basis. This is not a Matthews-specific issue. July volume has been better, but we do not yet have visibility into August and September and have adjusted our forecast to account for this reality. Adjusted EBIT does step down more sharply from $48.8 million in the second quarter to $42.2 million in the third quarter. That additional margin compression is a separate dynamic from the revenue seasonality described above. It reflects escalating input costs, particularly copper, labor, steel, and oil, which inflationary price realization only partially offset during the quarter. With respect to pricing, we are evaluating the impact of taking certain actions later in the calendar year consistent with our historical practice. We plan to be deliberate in managing this given the impact of ongoing tariffs and ever-escalating input costs, but these factors continue to be volatile. The Dodge acquisition continues to contribute meaningfully. This acquisition continues to be nicely accretive to earnings as we leverage the benefits of our memorialization commercial platform, and we have already realized the majority of the targeted cost synergies. We believe there are more M&A opportunities in the memorialization space that look like Dodge, highly accretive, highly strategic, defensible market positions. Our relationships in this industry are deep and long-standing, and we are positioned to move when the time is right. With respect to the fourth quarter, memorialization typically benefits from seasonally stronger cemetery and bronze product demand, which you expect to mitigate input cost headwinds. We continue to target approximately $175 million and a full-year adjusted EBITDA for memorialization, which would be a record year. At Propelous, while the total anticipated synergy benefits remain clear and are now beginning to scale, our expectations of the timing to realize those synergies has not yet been achieved. The delay beyond our expectation has resulted in an estimated $5 million shortfall to our full-year forecast. The synergy delay was caused by the SAP implementation project, which continued to go smoothly, but it's taken more time than expected. The delay in synergy capture does not impact our expectations of total synergies to be realized by Propelos, and we still expect to exit calendar year 2026 at an annualized EBITDA run rate of about $130 million. Moreover, we continue to expect that the ultimate sale of Propelos will generate significant cash flow, which will materially reduce our outstanding debt. With respect to exit timing, we continue to expect the marketing process for this investment to commence within the next 12 months, triggered by Propelos reaching the $130 million EBITDA run rate discussed above. Now starting with our new printhead product, Axion. We are placing production units with paying customers, and the commercial response remains strong. Our customers continue also to demonstrate significant interest in our Imperia Axion inkjet systems, a proprietary controller system that we have developed, which is crucial to the integration of Axion into the workflow of our customers. The value propositions we committed to, superior print quality, substantially lower solvent consumption, and lower total cost of maintenance are proving out in real production environments, while Imperia has risen as a key differentiator, which will allow us to open more customers thanks to its ease of use. Customers who beta-tested Axion are converting, and that pipeline is growing with increased interest from new accounts, including significant CPG players. Axion's high-quality print relative to its price, coupled with an ease of use, is expanding our addressable market while effectively positioning the product as a credible displacement solution against legacy technologies. As we have said, this is a disruptive technology. I am pleased to say that our product identification business continues to receive significant interest in the Imperia Axion inkjet systems and announced today a strategic partnership with Lynx printing technologies designed to broaden the customer access to each company's product portfolio in key markets, opening the opportunity for our products to reach consumer packaged goods, customers in the UK and France. Due to this combination of factors mentioned above, we are reducing our previous earnings guidance for adjusted EBITDA to be in the range of $158 million to $162 million, which includes our estimated 40% share of Propelos adjusted EBITDA for fiscal 2026. Despite the near-term challenges for the remainder of this fiscal year, we remain focused on driving shareholder value, including properly aligning our cost structure with the future state of our business operations. As we prepare for the end of our transition services agreement with Propelos next year, we are implementing actions that will reduce our corporate costs by $5 million next year. This reduction is over and above the amount needed to cover the services generally being provided to divested businesses. These actions, together with the restructuring noted above and other opportunities that I have noted give us confidence that what we saw happen this quarter will not repeat again. Finally, on the strategic review, the board remains actively engaged. Over the last two years, the board, with the support of our bankers, identified several alternatives for evaluation and consideration toward improving shareholder value and better alignment with underlying value of the organization. As I have stated before and called out today, we are focused on finding partners to help develop the high value of our strategic businesses. The partnership described above for our product identification business is one example of such a partnership. As well, the discussions we are having with auto OEMs regarding joint development agreements are other forms of partnerships that we are discussing, and there are more. Some of these actions take time, but we believe in the value of our technology, and we intend to demonstrate that value. Finally, as you all know, I've informed the board of directors of my intention to retire in the near future. The actual timing of my retirement is tied to the hiring of a replacement, the process for which the board has commenced. We hope to have more information on this soon, but with regards to me, I want to thank you all for the support over the years. It has truly been an honor for me to have worked with a wonderful team here at Matthews and to help come to know many of you investors well over the years.
Thanks again, and God bless.
Now I'll turn it over to Dan for a deeper dive on our financial performance. Thank you, Joe.
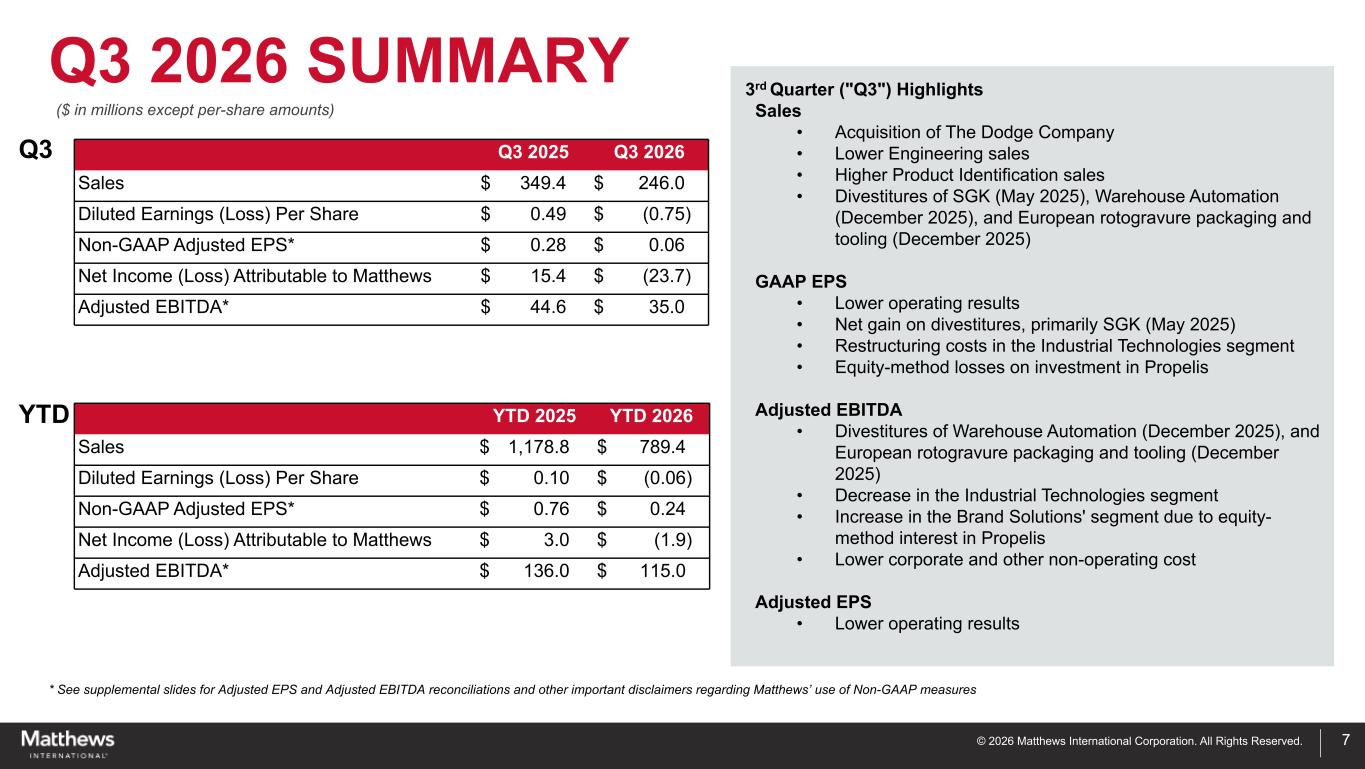
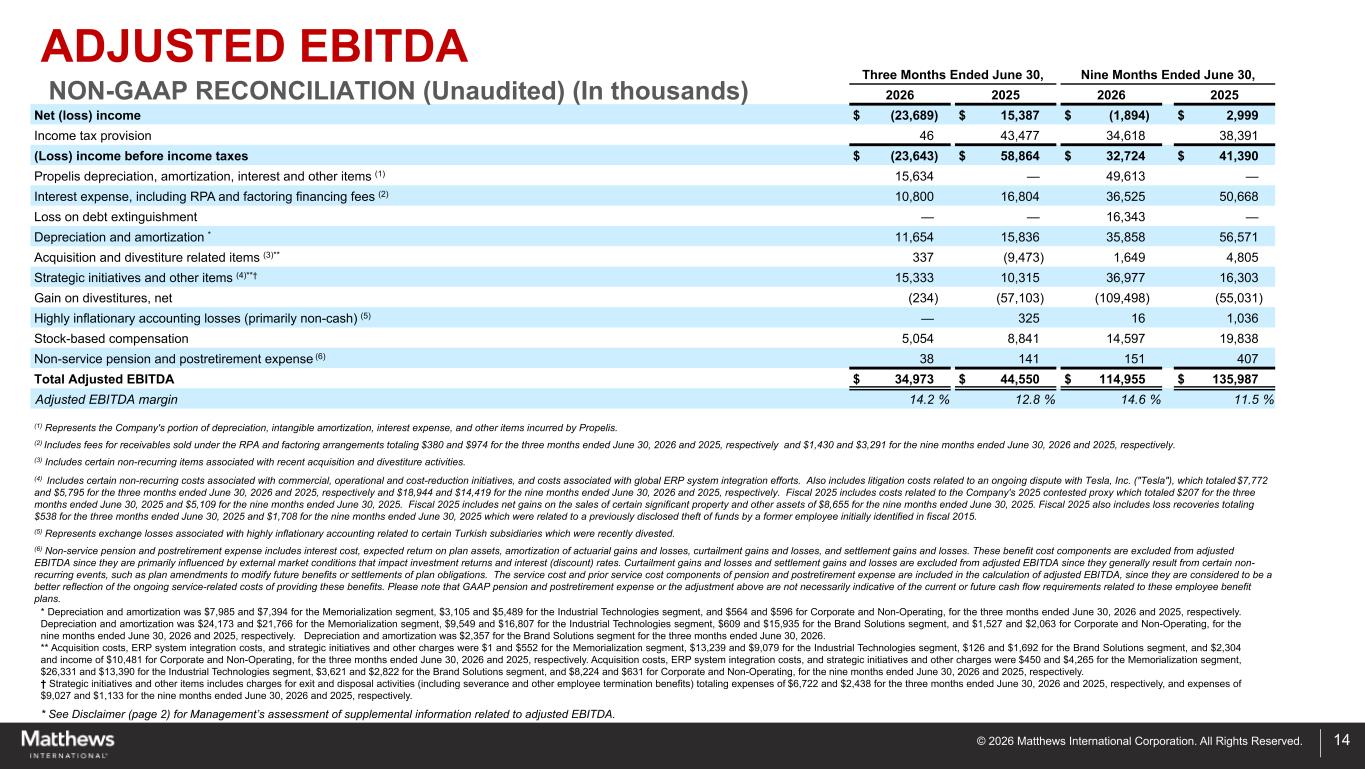
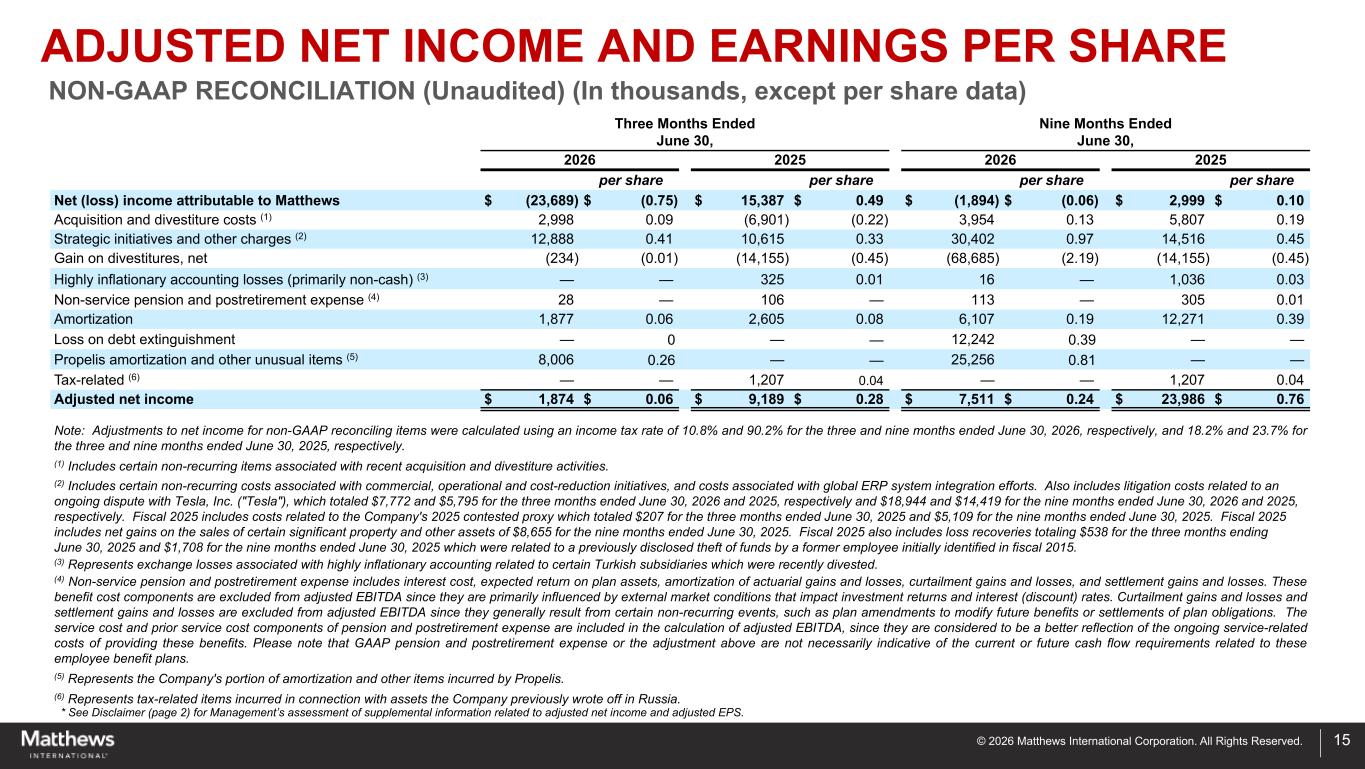
Now let's begin the financial review with slide seven. For the third fiscal quarter of 2026, the company reported a net loss of $23.7 million, or 75 cents per share, compared to the net income of $15.4 million, or 49 cents per share, a year ago. The change primarily reflected the net impact of a gain recorded on the divestiture of SGK last year, lower operating performance in the industrial technology segment, negative results contributed by our equity investment in Propelos, higher strategic initiative costs, and lower income tax benefits, all partially offset by reduced net interest and other deductions and lower stock-based compensation expense. Consolidated sales for the third fiscal quarter of 2026 were $246 million compared to $349 million a year ago. The decrease primarily reflected the divestitures of the SGK business in May 2025, the European packaging and tooling businesses, and the warehouse automation business in December 2025. The consolidated sales impact of these divestitures was approximately $85 million for the current quarter and was partially offset by an incremental contribution of $4.4 million from the acquisition of the Dodge Company. Sales for the industrial technology segment were lower for the quarter, offset partially by higher sales for the memorialization segment. Consolidated adjusted EBITDA for the third quarter of fiscal 2026 was $35 million compared to $44.6 million a year ago. The decline reflected lower operating performance by the engineering business within our industrial technology segment. Our 40% share of Propelos' adjusted EBITDA included in our results for the quarter was higher than the amount of adjusted EBITDA that were reported for the brand solution segment last year. The memorialization segment reported slightly lower adjusted EBITDA for the quarter, while corporate and other non-operating costs were lower in the current year. On a non-GAAP adjusted basis, net income for the current quarter was $1.9 million, or $0.06 per share, compared to $9.2 million, or $0.28 per share last year. The decrease primarily reflected the impact of lower operating profits and income tax benefits partially offset by lower interest expense, reduced stock-based compensation, and higher other non-operating income. Please see the reconciliations of adjusted EBITDA and non-GAAP adjusted earnings per share provided in our earnings release.
Please move to slide eight to review our segment results.
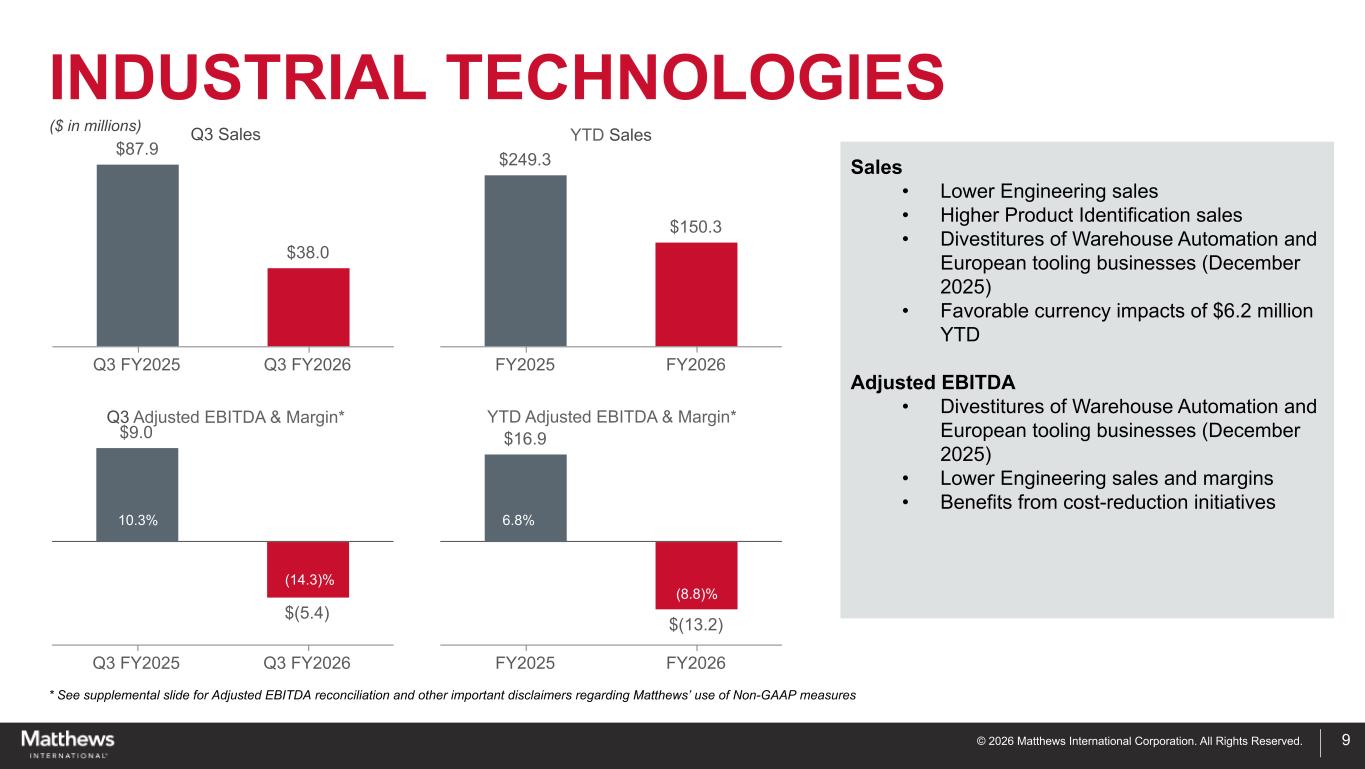
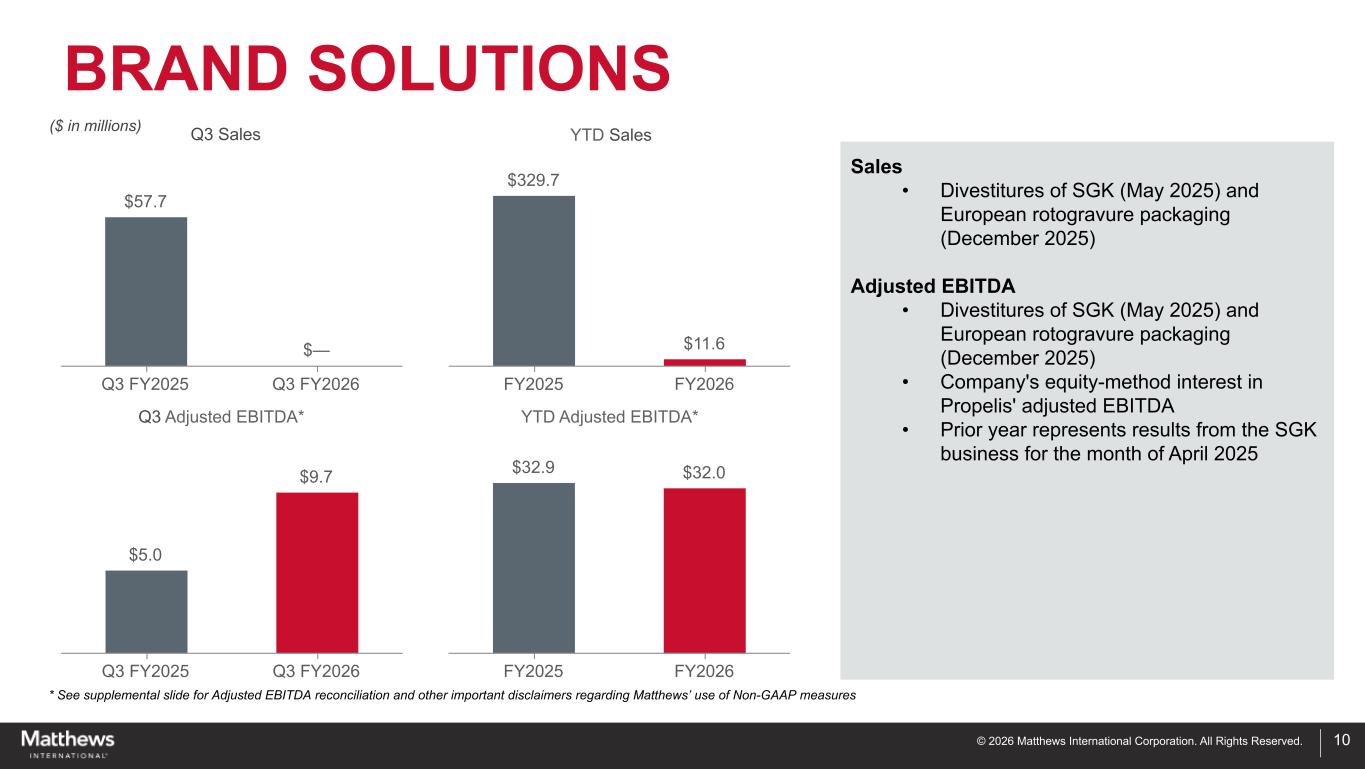
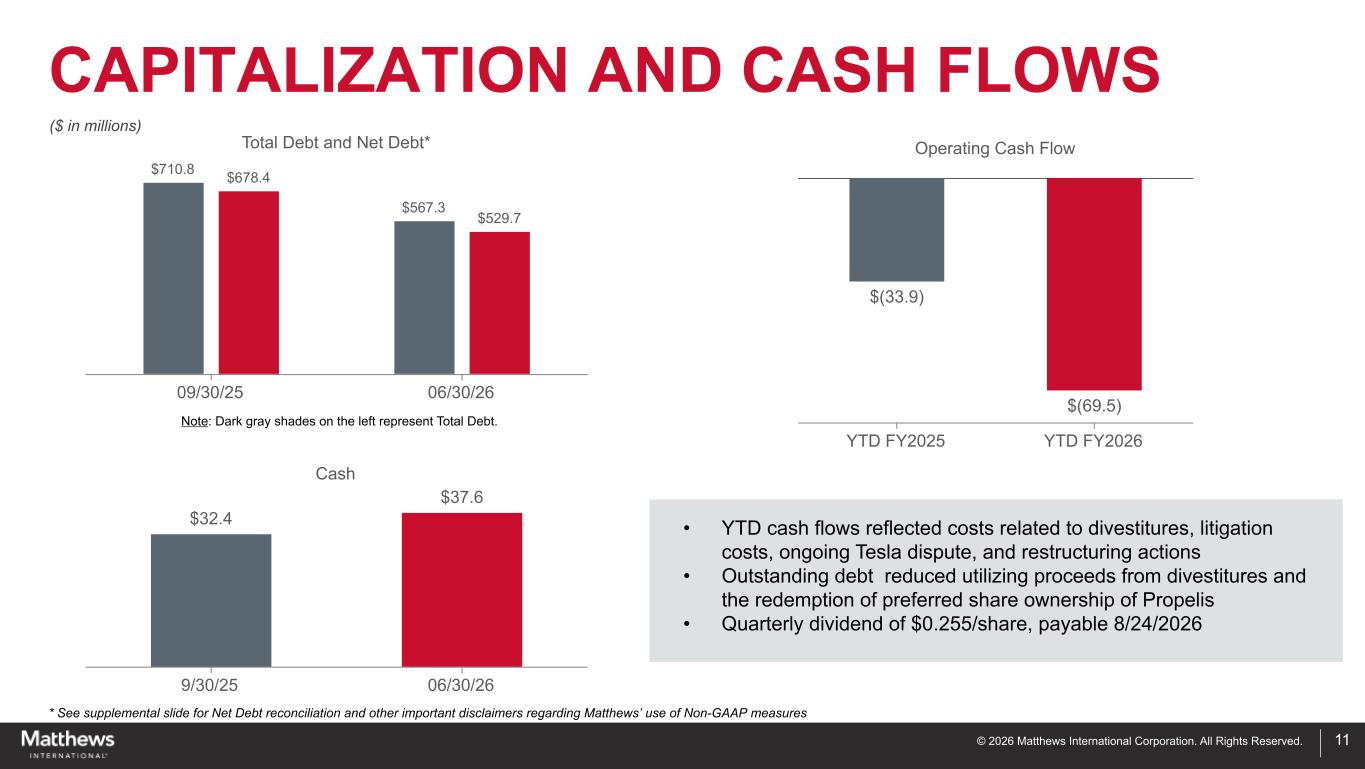
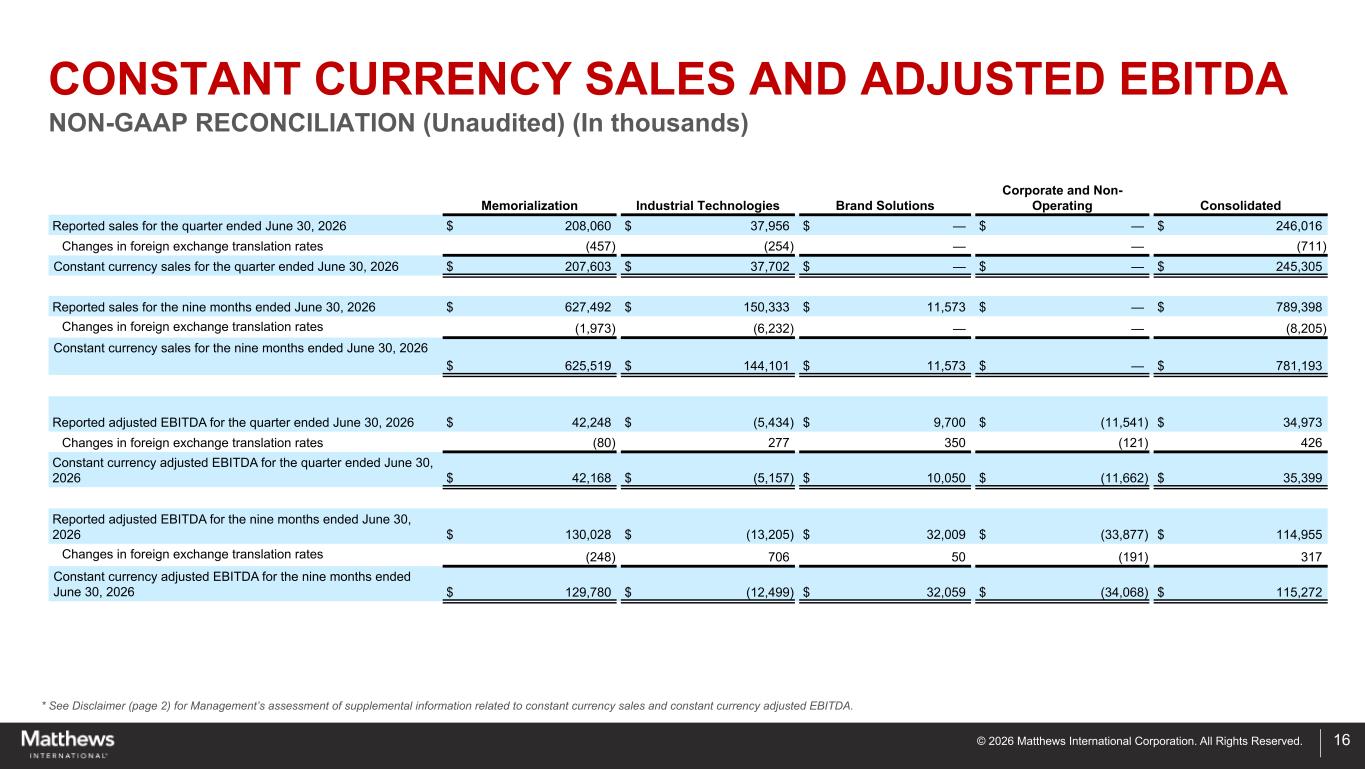
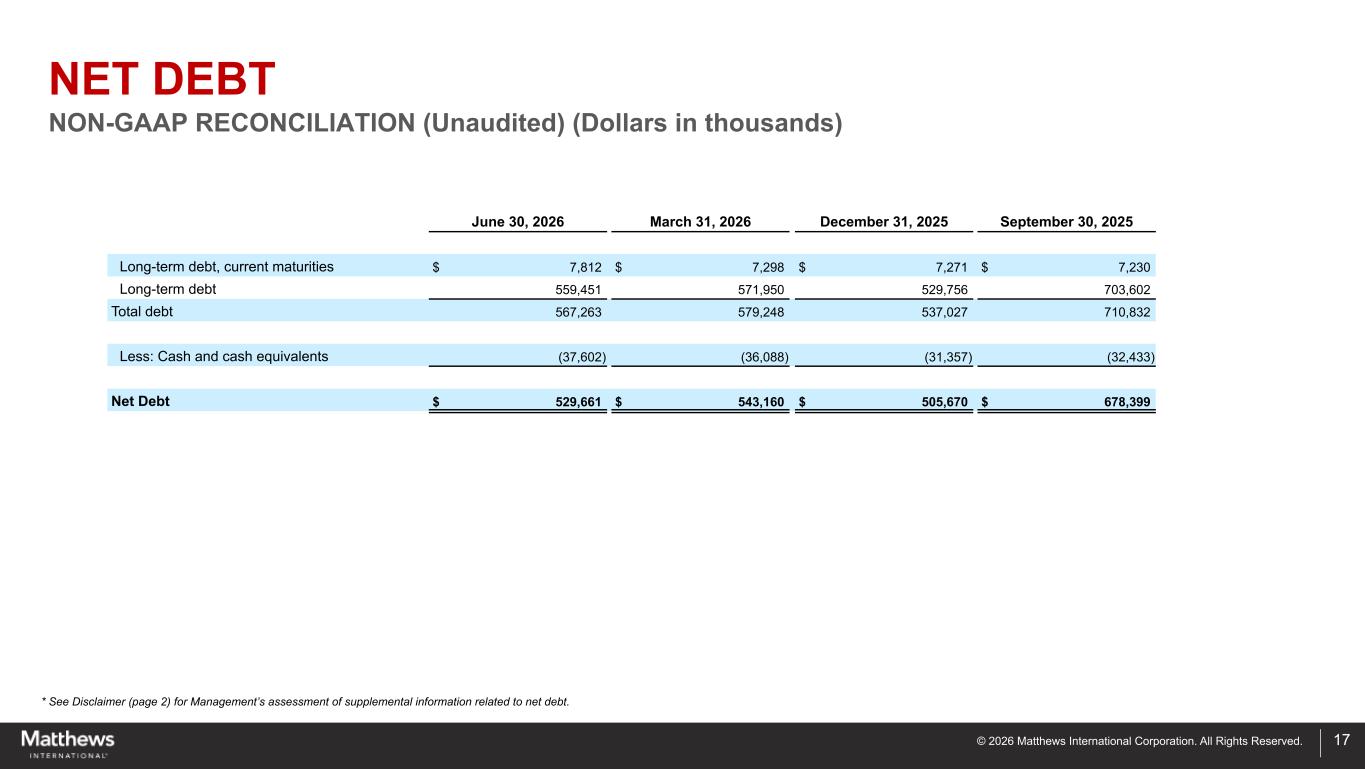
Sales for the memorialization segment for the third quarter of fiscal 2026 were $208.1 million compared to $203.7 million for the same quarter a year ago. The Dodge acquisition contributed incremental sales of approximately $4.4 million to the current quarter. Sales volumes for caskets and cemetery memorials declined in the quarter due to lower estimated U.S. cascaded death rates. Sales of cremation equipment and mausoleans were also lower in the quarter. These volume declines were partially offset by the impact of inflationary price increases. The memorialization segment adjusted EBITDA for the current quarter was $42.2 million compared to $42.8 million for the same quarter last year. The decrease was due to the impact of lower sales volume combined with higher labor, material, and other input costs that were partially offset by benefits from inflationary price realization, cost savings initiatives, and incremental contributions from the Dodge acquisition. Please move to slide nine. Sales for the industrial technology segment for the third quarter of fiscal 2026 were $38 million compared to 87.9 million a year ago. The decrease primarily reflected the divestiture of the segment's tooling and warehouse automation businesses in December of 2025. The segment's engineering business reported a decline in sales compared to last year, which was offset partially by higher sales for the product identification business. Adjusted EBITDA for the industrial technology segment for the current quarter was a loss of $5.4 million, compared to a profit of $9 million for the same quarter a year ago. The decrease primarily resulted from the impact of the warehouse automation divestiture and lower engineering sales, partially offset by cost reduction action in the segment's engineering business. Please move to slide 10. With the divestiture of the European packaging operations in December and combined with the divestiture of the SGK business in May of 2025, the brand solution segment did not have reportable income for the third fiscal quarter of 2026. A year ago, those divested entities reported combined sales of $57.7 million. Adjusted EBITDA for the brand solution segment was $9.7 million for the current quarter, compared to $5 million a year ago. The current quarter reflects mainly the company's 40% interest in Propelos. As a reminder, our 40% portion of the financial results of Propelos is recorded on a one-quarter lag. As a result, the consolidated financial information for the quarter ended June 30, 2026, includes our 40% interest in the financial results of Propelos for the month of January through March of 2026. Based on the preliminary estimates of adjusted EBITDA provided by Propelos for the month of April through June, our 40% portion of their adjusted EBITDA would be $12.7 million. The prior year adjusted EBITDA for brand solutions segment represents the results of SGK for the month of April 2025. Move to slide 11. Cash flow used in operating activities for the nine months ended June 30, 2026 was $69.5 million, compared to $33.9 million a year ago. During the period, the company made significant disbursements in connection with divestitures, including income taxes, transaction fees, and repayments of securitized receivables. Expenditures for litigation and proxy defense also consumed significant cash in the period. Additionally, the engineering business performance has resulted in the need to fund cash to continue operations through the first nine months of fiscal 2026. Outstanding debt at June 30th, 2026 was $567 million, and net debt, which represents debt less cash, was $530 million. Growth debt decreased by $144 million since the end of fiscal 2025, driven by receipt of $244 million of cash proceeds from the vestiges of the warehouse automation business and the European packaging and tooling business, combined with $28 million of proceeds received for the redemption of a portion of the company's preferred share ownership in Propelos. These cash inflows were partially offset by cash used in operations and the payment of fees to redeem $300 million of senior secured notes. During the third quarter of fiscal 2026, the company purchased 404 shares under its stock repurchase program at an average cost of $26.62 per share. These repurchases were solely related to withholding tax obligations for vested equity compensation. And finally, the board declared last week a quarterly dividend of 25.5 cents per share on the company's common stock. The dividend is payable on August 24, 2026 to stockholders of record as of August 10, 2026. This now concludes the financial review and we will open up the call for questions.
Operator
Thank you. If you would like to ask a question, please press star 1 on your keypad now. To leave the queue at any time, please press star 2. Once again, that is star 1 to ask a question. We'll pause for just a moment to allow everyone the chance to join the queue. Our first question today comes from Liam Burke with B. Riley Securities. Your line is open.
Thank you. Good morning, Joe. Good morning, Dan. Good morning, Liam. Good morning, Liam. Joe, as in the last several years, as you've been receiving favorable rulings in this dispute with Tesla, quote activity in the DBE portion of the battery storage business picked up with both automotive OEMs and then the traditional battery makers. Where are you on the DBE side? Where are you on order of quotes? And do you have any type of visibility on potential order activity there?
Yeah, thanks, Liam. As you heard on my call, and you've heard me in the past, we've talked about the process through which orders are received. It goes from lab machines to pilot lines to initial mass production, then mass production at scale quantities. As we've told the market over the last several years, we've been building our own mass production machine. That mass production machine gets commissioned as we speak right now with people coming in to test. We have received, let's call it soft commitments at this point in time from several of our customers, both on the battery side as well as on the auto side, that should they have success, improve scalability at the mass production scale, they will move to that in 2027. When that is, it's difficult to tell, but we are confident as we are seeing very successful tests of our own on that equipment to produce mass production scale quantities of DBE product.
Great. And on the print technology platform, JV in Europe now, or at least in France and UK, how are you envisioning scaling this business as you get more commercial uptake on the product?
Well, interestingly enough, you've identified that it's only in Europe, only in the UK and France. And as you might expect, one of the issues that we're facing is the scaling up of the product itself. We don't produce a silicon chip. We rely on a fab to be able to do that. Some of the limitations as we speak about for regions that we're hoping to develop are caused by that ability to scale up at our fab. As that continues to scale, and as you know, this is a ramp at these facilities. As it ramps, I expect more markets to be open through that relationship, and we expect big things from it over time. No, it's not lost also on us that it is a bilateral agreement, meaning we get access to a significant portion of their products in North America to be able to expand our portfolio as well. So we think this is a nice moving agreement for that part of our business.
Operator
Thank you. Our next question comes from Daniel Moore with CJS Securities. Your line is open.
Thank you. Good morning, Joe. Good morning, Dan. So Joe, you don't sound like someone that's retiring. So you're still in the CEO seat until successor is identified, that's the right way to think about it?
Absolutely, Dan. I mean, my team is sitting around me right now. I think I'm still engaged and I will remain engaged as long as I have to be. I still have a little bit of vim and vigor to do this and I continue to want this to be a success. We started a lot of great things. A lot of those things are coming to fruition as we speak right now. The agreement on the product identification side is validation in my mind. Lynx is one of the largest players in the world. They have access to the world. And over time, we expect to be able to expand that market significantly. DBE is starting to take off. As we talked about, we're seeing significant interest. We've never seen this level of interest. It is a perfect time for the future of Matthews, and I still have the vim and vigor to kind of push that forward.
And any commentary on what the board is looking for at a potential successor or kind of leave that to them? Somebody younger than me. I'll get into the more, you know, minutiae questions, but memorialization, just maybe talk a little bit about margin compression. How much is just timing of rising commodity and input costs versus price increases? Is there a tariff impact there given, you know, your production of steel caskets, you know, over the border, just kind of talk about those challenges and, you know, how long it might take to work through those.
It's all of the above, Dan. I mean, that's the nature of the beast right now. And on top of that is the historically low death rates. I mean, we just got whacked with a lot of things going the wrong way at that point in the business. At the end of the day, let's give you a perspective. So typically in the funeral home business, as you know, we are the followers, not the leaders in the industry. The leader is Batesville. They come out to market in September. We'll see price increases going out in September. We'll follow, I presume, or at least to adjust our prices for that. We are taking alternative action within our businesses to mitigate the impact of tariffs, But we'll also find ways to cover those as well. And when it comes to copper and other related products in our bronze business, we have raised prices. It just keeps continuing to go up faster than we can keep up. And, you know, there is a level that we do have. Although we are the leader in the industry, we do have competition, and we do have to be sensitive to that. But we also – what we don't want to see, and this is what we've been sensitive to throughout that part of our business, is a mixed shift where all we do is raise the price and ultimately we see a mixed shift down in product that ultimately doesn't get us the benefit that we need. We have lived through this before, and we will live through this one as well. As commodities cycle, they come back to a normalized rate, and we have the benefit from that as a tailwind at that point in time. So we are doing the best we can to prepare the business for the long term, not for an immediate reaction.
Okay. And shifting to industrial, Dan, is it possible to bucket the $38 million in revenue by kind of product ID, energy storage? I'm trying to remember what remains in that post some of the divestments. But I'm assuming energy storage is down pretty close to de minimis at this stage. But if you could help level set that for go forward, that would be great.
Yeah, Dan, the the energy storage piece or well, total engineering, as we refer to, which includes coding, converting some of which does go into the the energy market for the quarter. That was 14 million.
And the balance of about 24 was product ID.
Got it. The product ID, you said, was up multiple digits?
Yeah, that was about 5%. 5% up, Dan.
Okay. Go ahead. I'm sorry. I didn't mean to interrupt.
I was just going to say it was up 5%.
And then one more, or two-part, one more. But guidance at the midpoint implies 10 million sequential improvement. Propelus is 2 to 3 million of that. What are the other factors or drivers, you know, maybe between memorialization, rebounding or recovering a little bit, product ID? What, you know, what's the under the hood in terms of that gives you confidence in that sequential improvement beyond the propellant incremental contribution?
Yeah, Dan, well, first of all, we've told you the actions we've taken in that engineering business. That certainly will reduce our cost base, maybe not at a full run rate for the quarter, but certainly help bring that cost base down for the quarter. And quarter four, as you know, is seasonally one of our best quarters. uh as joe mentioned for cemetery products it is it's uh uh our strongest quarter uh but also product ideas have been very strong so we're you know we're expecting to kind of rebound um and pick up in those two uh business lines um all right and last for me um i don't let me get the pronunciation right to start.
Is it Meodio? How do I pronounce? Is that correct?
Yes, it is. I mean, it's an acronym.
We might have to change that. We don't have to change that acronym going forward, but.
Understood. Just trying to get a sense for any more details in terms of, you know, what the customers have expressed interest, you know, timing of when you start thinking about demoing, as you've laid out, you know, in the earlier remarks, you know, the kind of sequencing, but any details about kind of the operations and logistics and when you might start to see a meaningful ramp in revenue?
We expect that the second half of 27. I mean, that's what we're currently expecting. Those are the kind of indications we're seeing. It's going to be more in terms of, because of the size of these projects, Dan. It's more the discussion about the winning of orders. But as I pointed to you in the call, LG has expressed strong intent to convert and to land, to start new DBE projects. We're hoping that that equipment comes through us. They are one of our early players in our testing and have kind of given us some indication of what they think they want to do. I mean, the really big change for us from where we were just several years ago is the number of auto players in the space. As I said earlier, there was a recent article just today talking about the change in the European auto manufacturers and the need to accelerate that. We're seeing that acceleration push on us as well. So we're hoping to have more news around that over the next several months or the next quarter or two, let's call it that. and we'll be able to talk about it more clearly.
Is the litigation with Tesla still a hang-up for folks like LG and others, or are we largely past that?
I would say we're largely past that from our standpoint. We've had to explain what our situation is, and the limiting nature of the last win, the so-called win on the trade secret item, makes it a more solid footing for us to be able to have those kinds of discussions with our customers. But at the end of the day, it still has had some impact. We had talked about for a while a fairly significant order on the Oldbrick side for a coding line, not DB, but into the energy space. Unfortunately, we were informed that's one of the projects we were informed that we did not win. And one of the answers from that customer is they did not want to get entangled in a potential suit with Tesla, even though it had nothing to do with DBE.
All right. I appreciate taking all the questions. Got to get them in while I still have you. So thanks again for the color.
Operator
Thank you. Again, as a reminder, that is star one if you would like to join the queue. Our next question comes from Justin Bergner with Gabelli Funds. Your line is open.
Good morning, Joe. Good morning, Dan. And congratulations, Joe. I know you'll be missed. I realize this isn't your last earnings call, but just wanted to put that out there.
Well, appreciate it, Justin.
A couple questions here. So on Propelus, with the $12.7 million, I guess you would be at about $45 million of EBITDA for the fiscal year for your 40% stake. So I guess you expect it to be about $50 million. And have we got kind of caught up on the SAP implementation, or is there the chance for further delays there?
So, yes, we did expect $50 million, Justin. You're exactly right. The work on the implementation isn't necessarily getting the system up and running. it's beginning to migrate work over from the legacy SGS business. And that's what ultimately the delay in the go-live delayed, right? So that's where the synergies will come out. But that work is ongoing. It is delayed by the one quarter. It remains to be seen where they'll end up, but they're certainly working hard at it as we speak.
Okay. Okay. Switching gears to memorialization, you talked about elasticity risk from higher prices. Have you seen that yet, or are you just worried that we're getting close to the point where it might come into play?
No, Justin, we did see a little bit of it this quarter. I mean, that was part of the reason for the downgrade. We saw a migration shift down, and we obviously didn't – we did not lose share. We did not shift from one product to another. They shifted within the product mixes, for example, a more expensive casket to a lower-priced casket just because of pricing. So that is something we are sensitive to. We saw it was not a significant item, but it was enough to kind of cause us to sit back and watch.
Okay. One or two more quick questions. On the energy storage side, and particularly the automotive side, I mean, given the industry is still oversupplied and EV demand has kind of hit a lull, just maybe if you could rephrase for us or reiterate for us what has changed among these automakers to suddenly kind of be reinterested in DB technology amidst a soft production environment.
Well, the simplest answer to that is that – but there's two sides to that, sir. First off, conversations we've had literally with the OEMs themselves has been that they have come to the realization that they need to be in control of their battery production. They do view batteries as a solution. Electrification is the future of the industry, whether it be hybrid or whether it be full electric, TBD. So that's the first part of the decision. So they're much more engaged on that front end. Secondly, there's a lot of new chemistries coming out. I mean, we've heard about sodium. You've heard about solid state. You've heard about lithium iron phosphate versus nickel. There's a lot of chemistries out there, and each one of those chemistries have different attributes and different benefits, ranging from cost to longevity and so forth. Many of those chemistries are only facilitated through dry battery. So failure to kind of take advantage of that at the early stages right now would put them further behind in the process and further reliant on battery operators themselves and do what they think is in their best interest. The last part of that, and I think this is also critical, we're starting to see government involvement. You see it in the German market pretty easily. There's discussion of a multibillion-dollar fund to help support the advancement of this over in Germany. And you know who those customers are targeting over there. There is a rapid push, just an article in the CNBC today you all can look at, that identifies the need to push faster to be able to compete with oncoming Chinese competitors. So all of those factors is what's changed in that formula, and we sit right in the middle as a critical component of that party. Not the least of which, Justin, one of the things we've said for years, and it's proving true today, it's a lot less expensive and a lot smaller footprint to put up the same capacity of dry battery electrode than it is wet electrode. You've got a 100-meter oven. We don't need a 100-meter oven. It's a cheaper cost to produce, a better battery density, better energy density. Ends up with a cheaper, better battery, as we've said all along. If they're going to invest, they're going to invest in the next generation of technology, not in old technology if they can.
Got it. That's helpful. But they're not necessarily looking to convert existing plants from wet to dry technology. It's more that they want to get ahead of the next set of production.
The battery operators, LG has specifically said they're talking about converting. They've said that publicly, not using our name. They've said they intend to convert. So, I mean, think about it. In the space of a 100-meter oven, there is a significant uptick in the capability to produce volume using our footprint. Our footprint is a fraction of that 100-meter oven that they have for that process. So we could probably put three times, four times the capacity in that same gigafactory. Then it becomes an economic decision about sunk cost versus additional investment and so forth. But at the end of the day, the economics will ultimately win out, whether it's this year or next. Sooner or later, they will convert.
Operator
Thank you. This concludes our Q&A session and brings us to the end of today's meeting. We appreciate your time and participation. You may now disconnect.