Operator
Good morning, ladies and gentlemen, and welcome to the Teleflex Second Quarter 2026 Earnings Conference Call. At this time, all participants have been placed in a listen-only mode. At the end of the company's prepared remarks, we will conduct a question and answer session.
Please note that this conference call is being recorded and will be available on the company's website for replay shortly.
Operator
And now we'll turn the call over to Mr. Lawrence Kirsch, Vice President of Investor Relations and Strategy Development. Please go ahead.
Good morning, everyone, and welcome to the Teleflex Incorporated second quarter 2026 earnings conference call. The press release and slides to accompany this call are available on our website at teleflex.com. As a reminder, a replay will be available on our website. Those wishing to access the replay can refer to our press release from this morning for details. Participating on today's call are Jason Weidman, President and Chief Executive Officer, and John Darin, Executive Vice President and Chief Financial Officer. Jason and John will provide prepared remarks, and then we will open the call to Q&A. Before we begin, I'd like to remind you that some of the matters discussed in the conference call will contain forward-looking statements regarding future events as outlined in the slides posted to the Investor Relations section of the Teleflex website. We wish to caution you that such statements are, in fact, forward-looking in nature and are subject to risks and uncertainties, and actual events or results may differ materially. The factors that could cause actual results or events to differ materially include, but are not limited to factors referenced in our press release today, as well as our filings with the SEC, including our Form 10-K, which can be accessed on our website. Now, I'll turn the call over to Jason for his remarks.
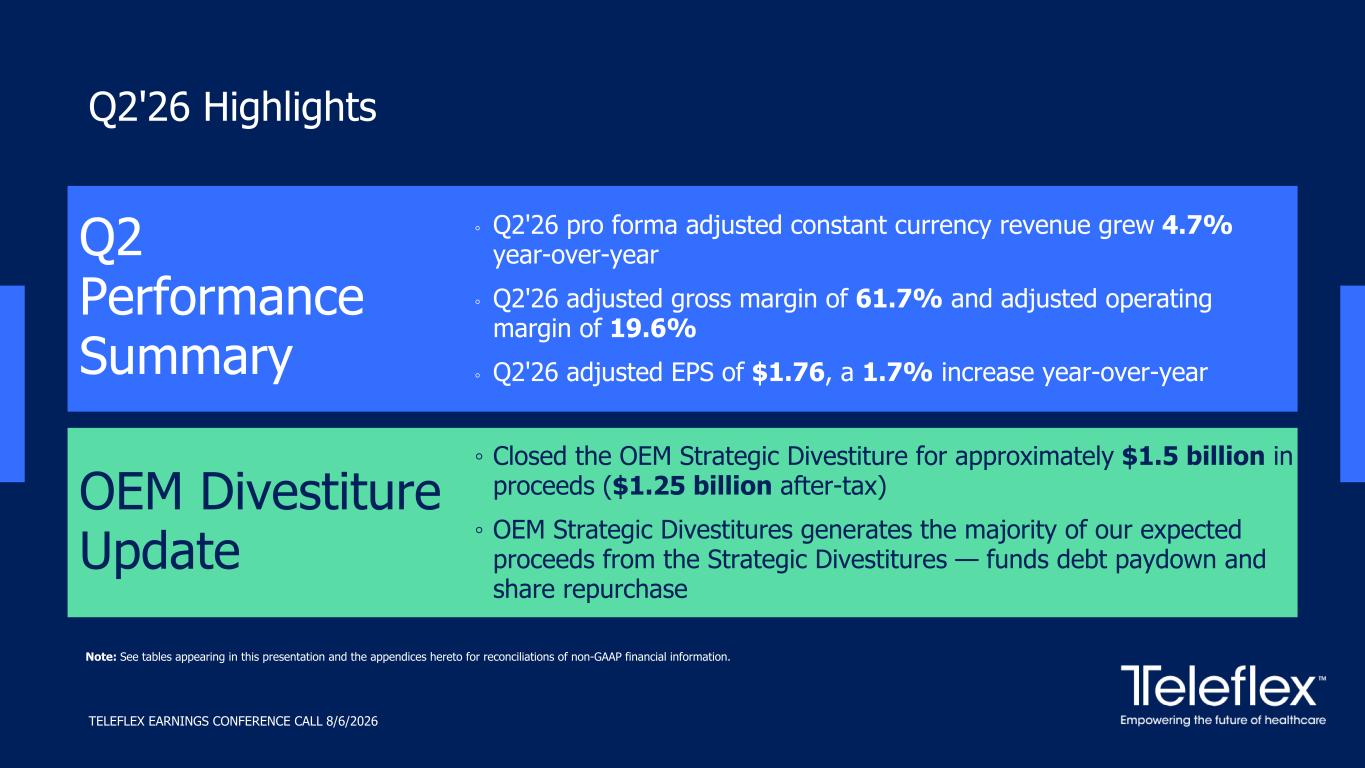
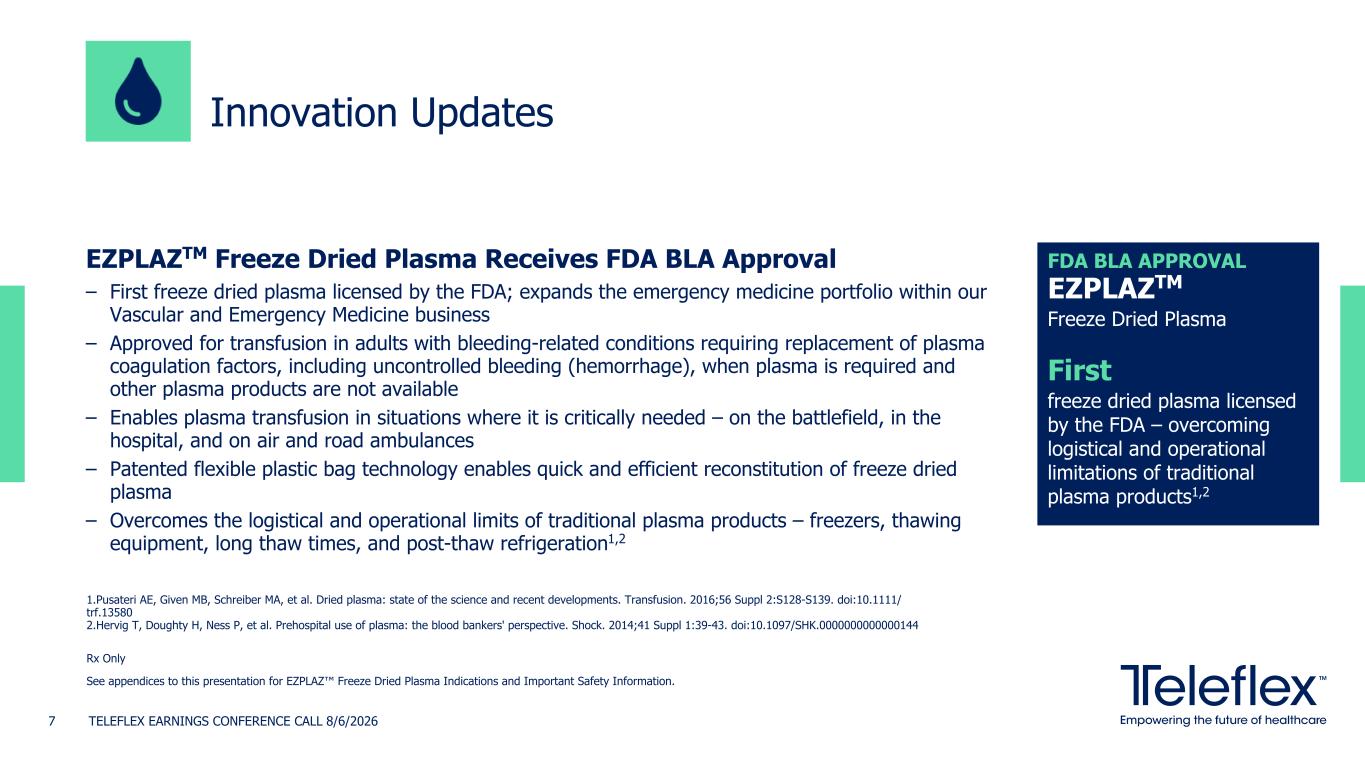
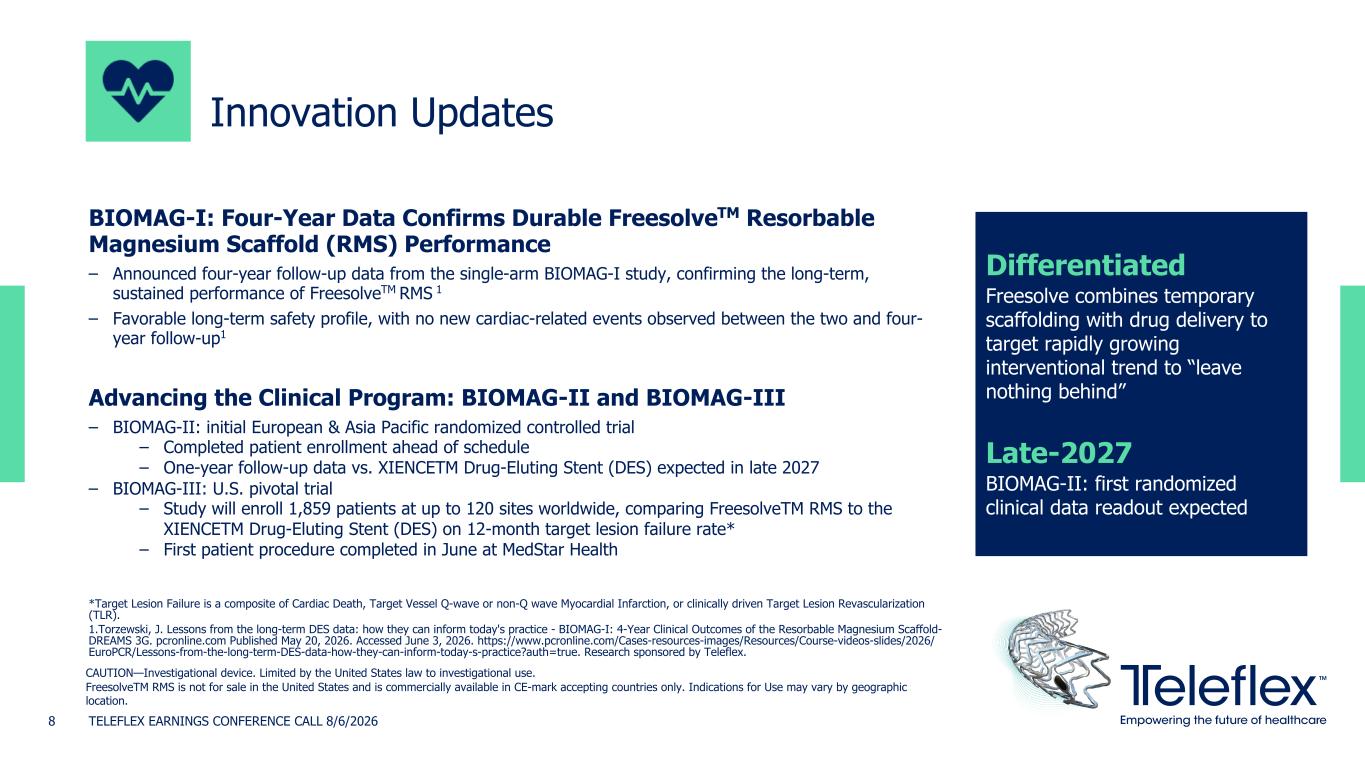
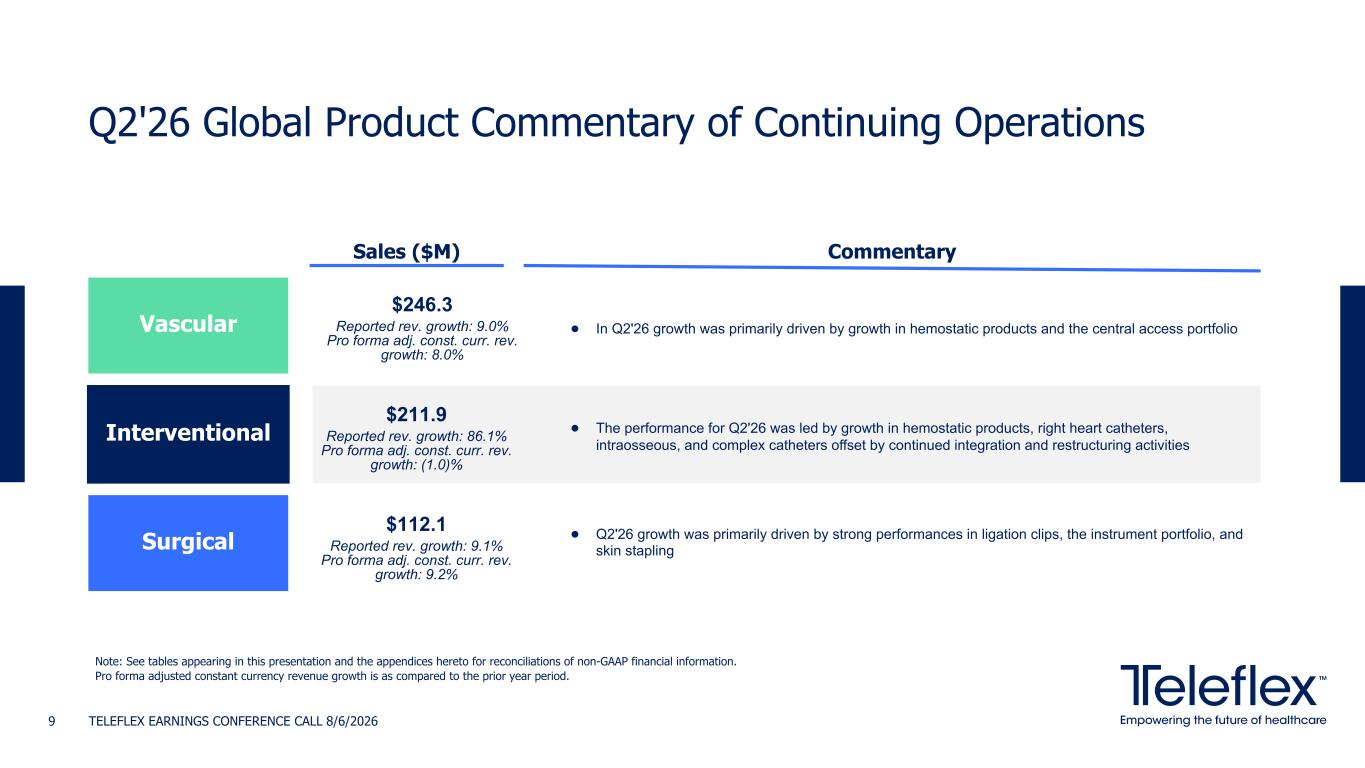
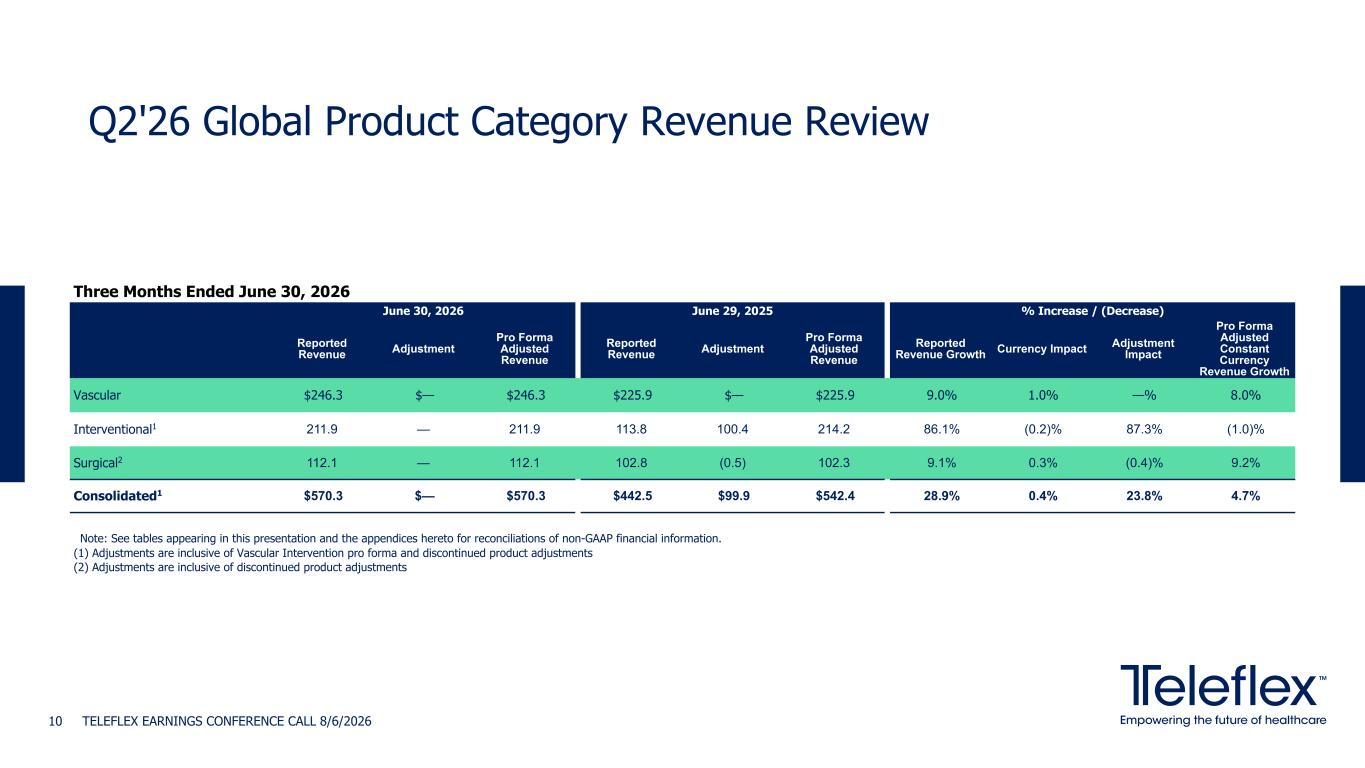
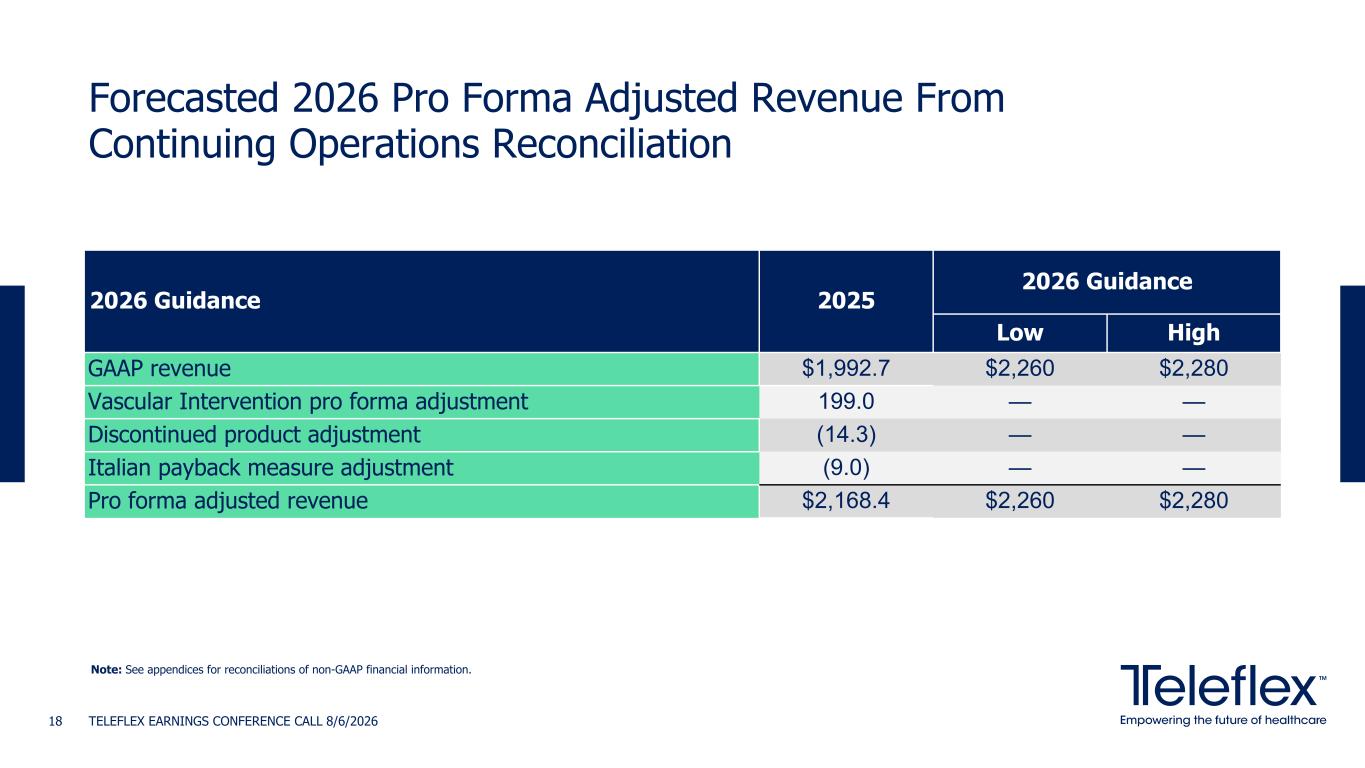
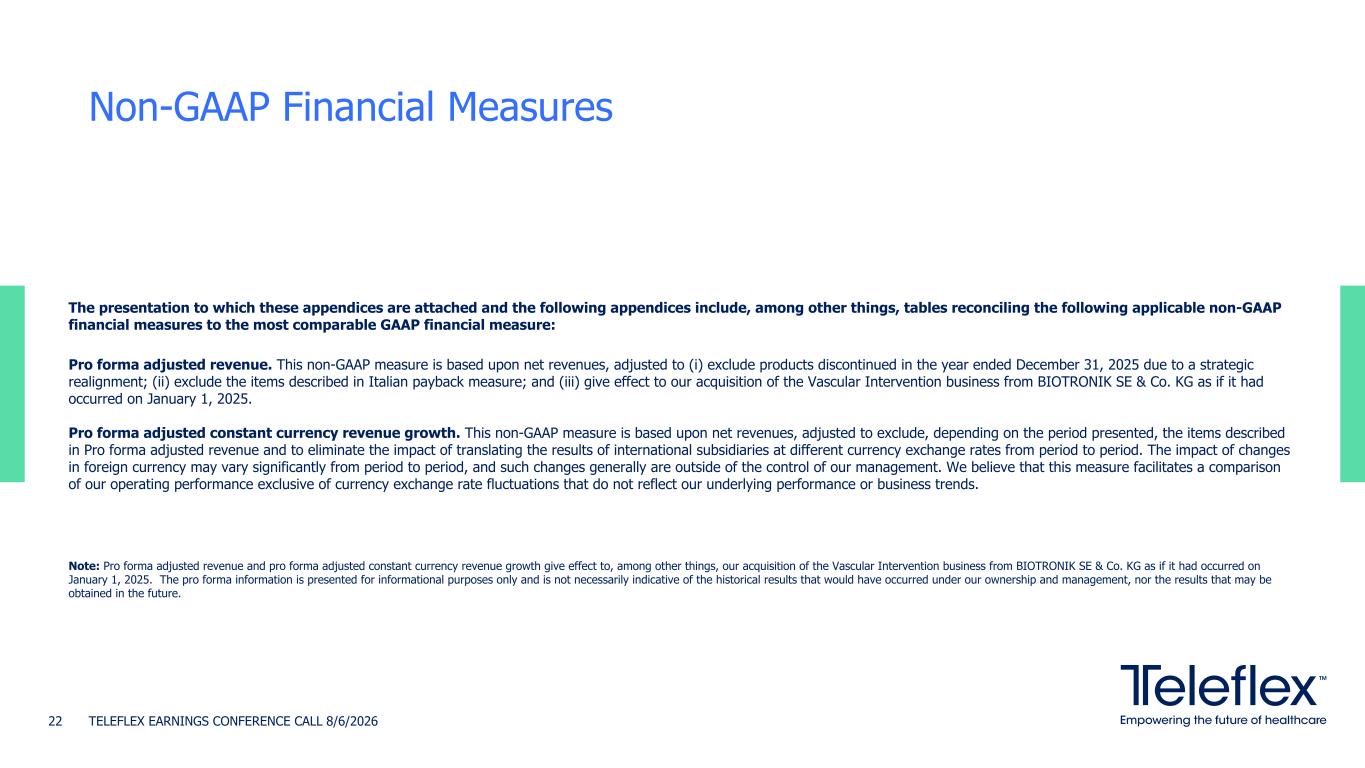
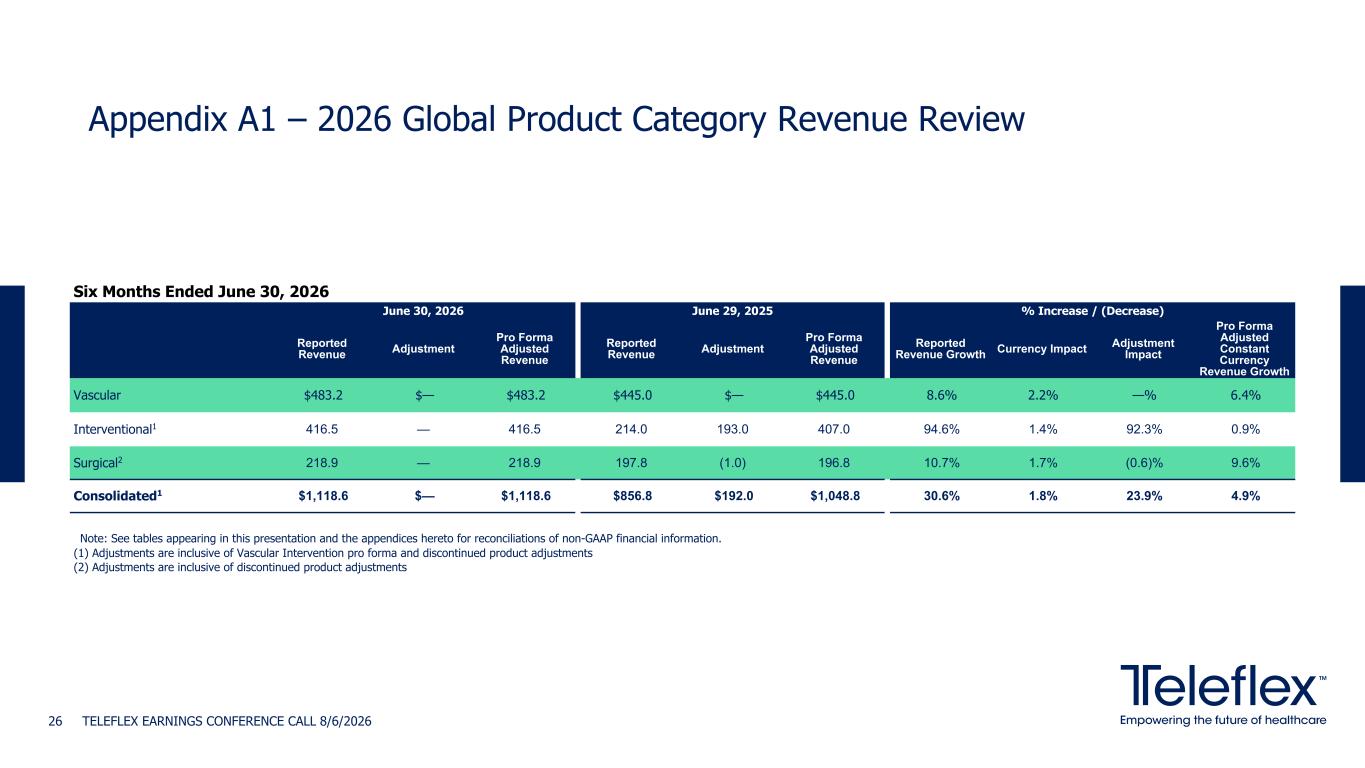
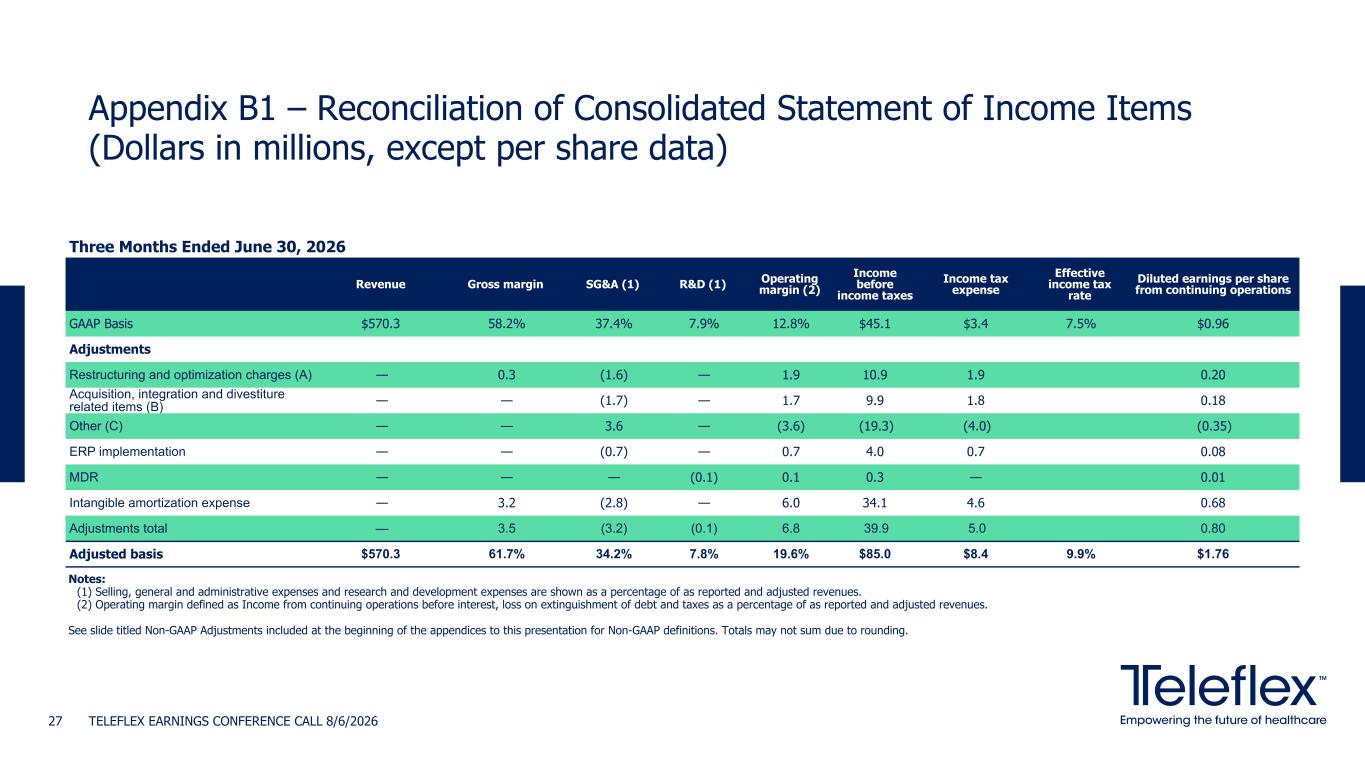
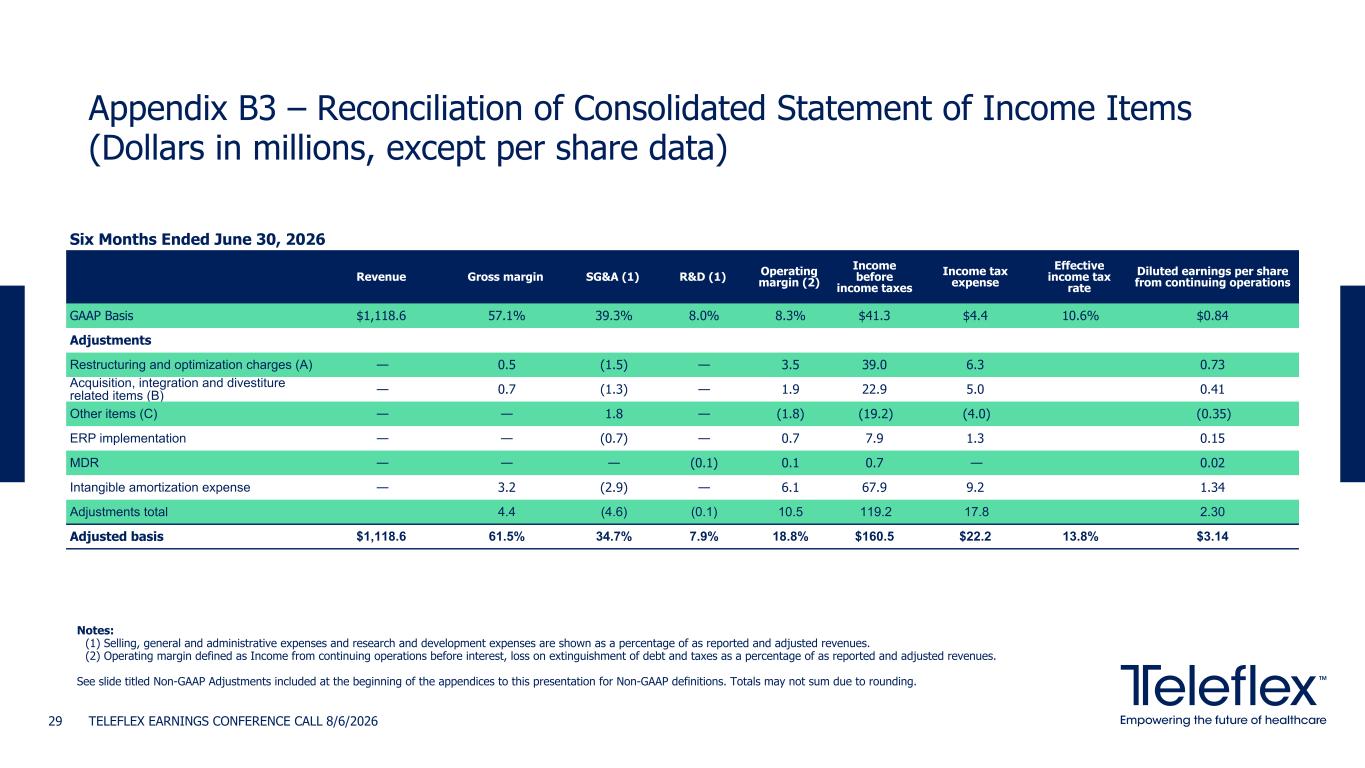
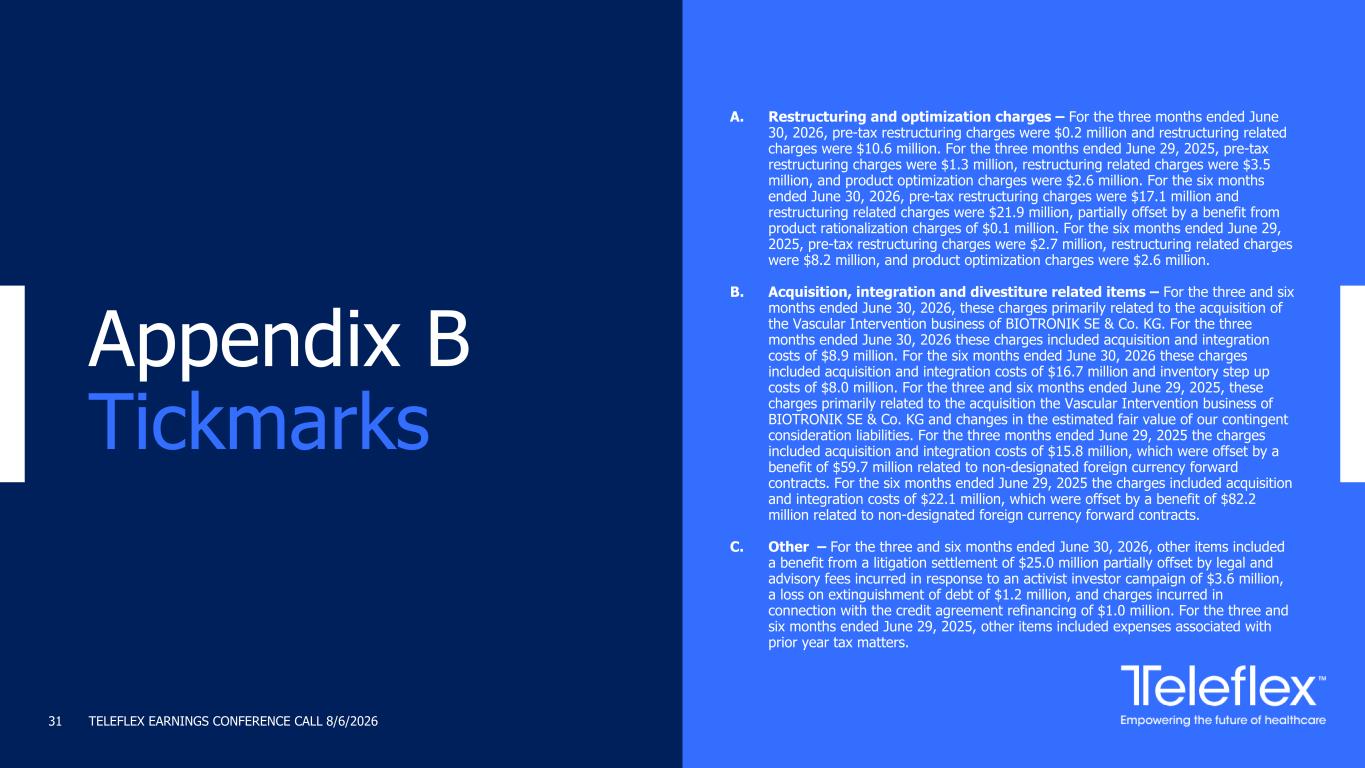
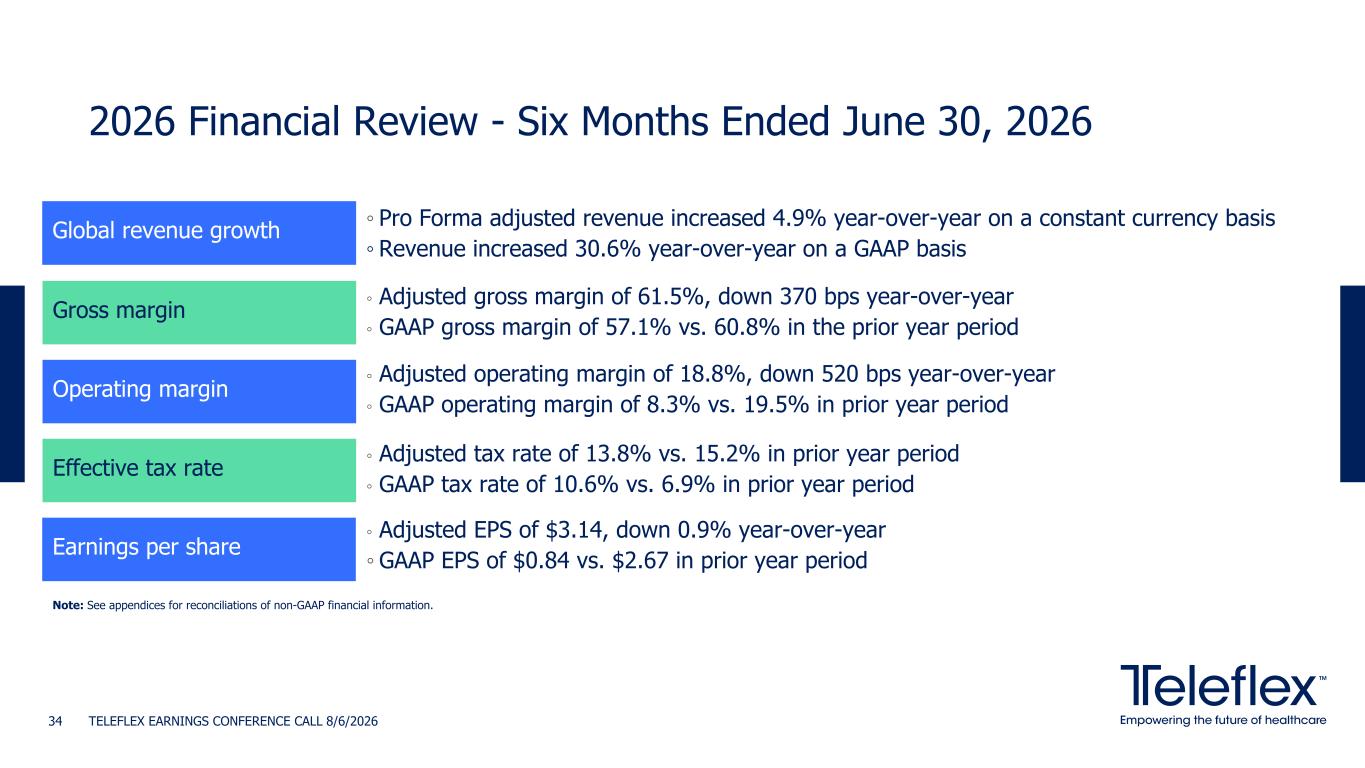
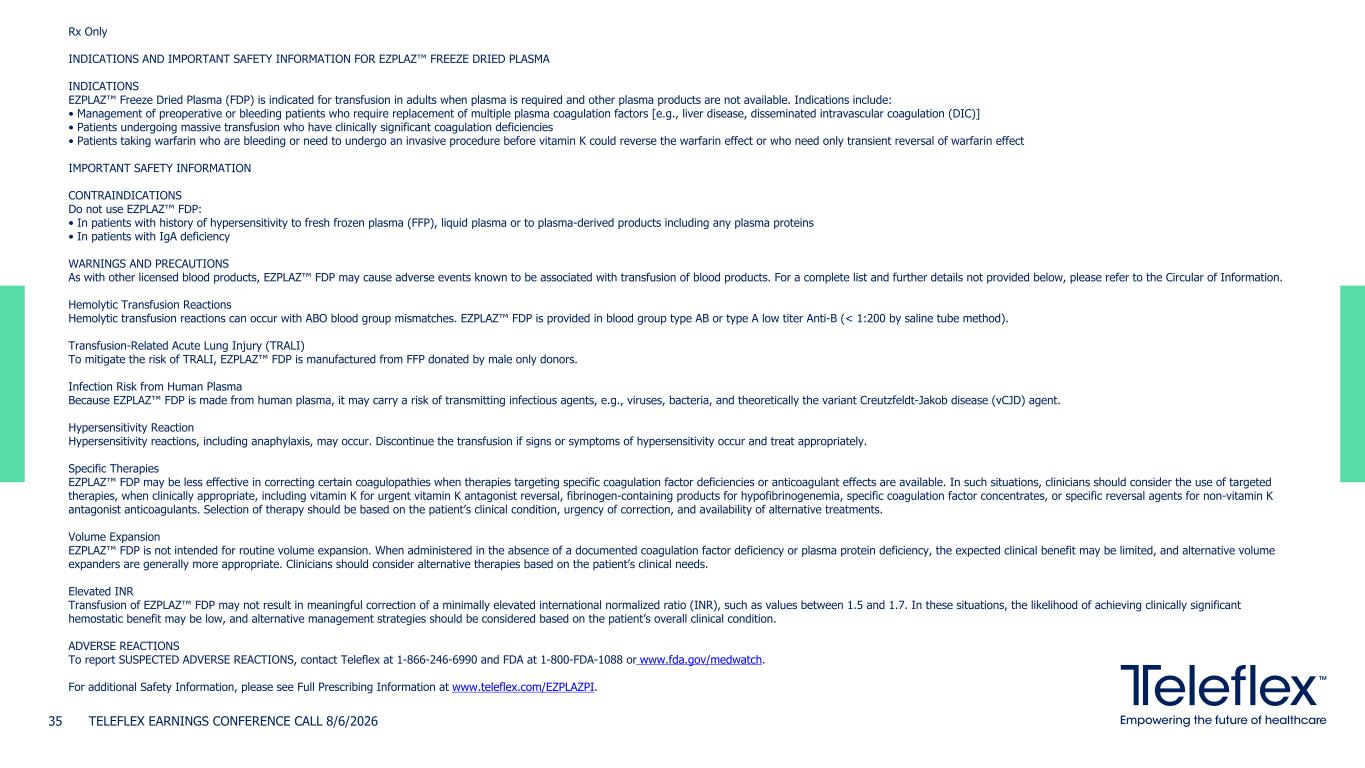
Thank you, Larry, and good morning, everyone. Let me begin by saying it's been a great start to my time at Teleflex. Over the past two months, I've really focused on learning our business, our products, and our organization. This has meant considerable time visiting many of our sites around the globe, meeting with employees across the organization, engaging with customers and physicians, and reviewing the company's portfolio, operating priorities, and long-term growth opportunities. While it's still early, a couple of things have stood out immediately to me. Our employees are fantastic. They're dedicated, there's real pride and belief in what we do for patients, and they're eager to build on our accomplishments and drive execution. Second is the strength of Teleflex's underlying businesses. We have great products with market-leading positions in many important categories, strong brands, and a substantial global commercial footprint. My initial observations have also reinforced my belief that there is substantial opportunity ahead for Teleflex and that we have the right foundation to capture this potential. We remain focused on executing key initiatives underway, including completing the announced divestitures, deploying the proceeds through our committed debt reduction and share repurchase initiative, and mitigating stranded costs associated with the divestitures. Taken together, these actions will create a more focused portfolio, give us greater exposure to core critical care and high-acuity hospital markets, and further strengthen Teleflex's financial and strategic flexibility in its next phase of growth. The divestitures and capital allocation plan reflect a thoughtful and proactive approach to value creation, but realizing our full potential will require continued deliberate action and consistent execution across the company. As I step into this role, my top priority is to thoroughly assess the business and to develop the strategic and operational plan that focuses our resources on the areas where we see the greatest opportunities for sustainable growth, innovation, and operational leverage with the objective of maximizing value for our shareholders. While this review is ongoing, like most medical device companies, the focus will center on operational rigor and predictability across the organization, accelerating growth and innovation-driven platforms, and ensuring disciplined and balanced capital deployment. I look forward to partnering with the leadership team and our employees to build upon the strong foundation that's already in place and continue advancing Teleflex's transformation into a more focused medical technologies leader with durable long-term growth. Now I'd like to transition to the second quarter highlights. Our overall pro forma adjusted constant currency growth was 4.7%, while adjusted operating margin was 19.6%. We delivered better-than-expected revenue, adjusted margin, and adjusted EPS with excellent performance in the vascular and surgical businesses in particular. At the same time, interventional performance fell short of our expectations as the integration associated with the BI acquisition is taking longer than anticipated. As John will discuss, we have updated our full-year revenue outlook to reflect a more tempered expectation for interventional growth while maintaining our adjusted operating margin outlook and increasing our adjusted EPS guidance. We've previously emphasized that 2026 would be a transition year for Teleflex as we become a stronger, more focused company for the future. To that end, I'm pleased to share that we're making significant progress on our strategic transformation and our commitment to maximizing shareholder value. In December of 2025, we announced agreements to sell the acute care, interventional urology, and OEM businesses as part of our overall transformation plan. As announced early this week, we have successfully closed the OEM divestiture, which resulted in proceeds of approximately $1.5 billion in estimated after-tax proceeds of $1.25 billion. The OEM strategic divestiture generates the majority of the proceeds from the planned strategic divestitures and will fund both debt reduction and share repurchase. John will get into more details on the use of proceeds from the OEM close and capital allocation in a few minutes. Turning to the acute care and interventional urology divestiture, we remain confident in closing the transaction. As previously disclosed, the FTC issued a second request in March seeking additional information in connection with its review of the transaction. Both parties are working cooperatively with the FTC. The strategic divestiture is currently anticipated to be completed in the fourth quarter of 2026, although the timing is dependent on the regulatory approval process and remaining steps to complete the transaction. As I focus on durable future growth, driving innovation is a key priority for Teleflex. I am excited about the new product opportunities we are developing, and over the past several quarters, we have deliberately increased our R&D investment with R&D expense at 7.9% of sales in the first half of 2026. As I look ahead, we will focus on effectively allocating capital to new R&D opportunities that fortify our existing product portfolio, leverage our call points, and are accretive to our long-term growth profile. Importantly, we have had a number of exciting new product innovation developments recently, including the late July BLA approval from the FDA for EZPLAS freeze-dried plasma, as well as the achievement of important clinical trial milestones for Freezol, our novel drug-eluting resorbable magnesium scaffold. EZPLAS, which will expand the emergency medicine portfolio in our vascular business, represents a novel solution to administering plasma to critically injured patients in combat and pre-hospital settings. Approved for the treatment of adults with uncontrolled bleeding resulting from traumatic injuries when plasma is required and other plasma products are not available, EZPLAS is the first freeze-dried plasma licensed by the FDA. EZPLAS uses an innovative, flexible plastic bag technology that enables quick and efficient reconstitution of freeze-dried plasma. It fills an unmet need by enabling the transfusion of plasma in situations where it is critically needed, including on the battlefield or on air and road ambulances, where the use of traditional plasma products is limited by logistical and operational challenges. Turning to the future for the interventional business, and as part of our commitment to increasing R&D investment in innovative technologies, we continue to advance our clinical study program for the highly differentiated Freesolve drug eluting resorbable magnesium scaffold technology. Freesolve pairs temporary scaffolding with drug delivery to target a long sought goal in interventional cardiology and is anticipated to address the rapidly growing trend in coronary and endovascular procedures towards treatments that leave nothing behind. During the second quarter, we announced several milestones from the Freesolve clinical program. Four-year follow-up data from the single-arm Biomag 1 study were presented in May at the Paris course of revascularization, demonstrating sustained long-term performance in a favorable long-term safety profile of freezolves. We also announced the completion of patient enrollment ahead of schedule for the Biomag 2 study, which is the first randomized control trial for freezolves run outside of the United States. This positions us for a late 2027 data readout. Finally, we commenced the Biomag 3 randomized pivotal trial in the U.S. with the first patient procedures completed in June at the MedStar Washington Hospital Center. While this comprehensive clinical program is still in its early phases, we are encouraged by the data-to-date and excited about the optionality that Resolve provides us in the future. In summary, taken together, all of these updates and actions reflect a more focused portfolio, disciplined capital allocation, and innovation progression. We believe they position Teleflex to deliver improved execution and stronger long-term performance. We are building a clearer financial profile and path to value creation through improved adjusted margins, lower interest expense, and stronger adjusted earnings per share over time. 2026 remains a transition year for the company, and our transformation is well underway with tangible milestones being met, including the close of the OEM strategic divestiture and return of capital to shareholders. As we continue to execute on our priorities, we expect a meaningful step up in our financial performance in 2027 and beyond. Now let's move on to our second quarter continuing operations detailed results and updated financial guidance for 2026. All growth rates that I refer to are on a year-over-year pro forma adjusted constant currency basis, unless otherwise noted. Pro forma adjusted constant currency growth for 2026 excludes the impact of foreign exchange, the $9 million Italian payback measure recorded in the second half of 2025 and the impact of approximately $14 million in continuing operations product revenue that was discontinued at the end of 2025 due to a strategic realignment, but includes revenue generated by the acquired vascular intervention business for the prior full year period. All comments relate to continuing operations for the second quarter of 2026. For the second quarter, Teleflex revenues were $570.3 million, up 28.9% year-over-year on a gap basis and up 4.7% on a pro forma-adjusted constant currency basis. In the quarter, our revenue performance reflected strong execution in our vascular and surgical businesses, partially offset by the performance of our interventional business, which was impacted by integration and restructuring activities related to the VI business. Second quarter adjusted earnings per share was $1.76, a 1.7% increase year over year and ahead of our expectations. Now let's take a deeper dive into our second quarter revenue performance. I will begin with a review of our revenues by global product category for the second quarter. Starting with vascular, revenue was $246.3 million, an increase of 8% year over year, primarily driven by growth in our hemostatic products and in our central access portfolio. In our surgical business, revenue was $112.1 million, an increase of 9.2%, which was primarily driven by strong performance in ligation clips, our instrument portfolio, and skin staplers. Moving to interventional, revenue was $211.9 million, a decrease of 1%. While several categories, including hemostatic products, right heart catheters, intraosseous, and complex catheters, outperformed, growth was softer than expected in the quarter, reflecting ongoing integration and restructuring activities associated with the VI acquisition. Although 2026 was always expected to be a transition year, the integration in the quarter was slower than anticipated, reflecting several transition factors that we expect to be temporary. We are making progress on mitigation actions to address the primary drivers of these temporary impacts, and we remain confident in the long-term strategic and financial prospects for this business. That said, while the original plan contemplated that the integration would be largely completed towards the middle of 2026, we believe it is prudent to extend the timeline for full integration through the second half of 2026, given some of the lingering transition issues still impacting the business. I've spent the last 20 years of my career working in the interventional space, and that experience gives me real conviction in the opportunity ahead for Teleflex. At a high level, the legacy Teleflex interventional and acquired vascular intervention business fit together very well and with highly complementary product portfolios in geographic strengths. I believe that these are the right assets for Teleflex to expand its presence in interventional coronary, and peripheral procedures. Drilling down a bit more, we have great products, a broad portfolio that includes specialty devices that physicians rely on and appreciate. I see meaningful opportunities to gain share, expand geographically, and bring new products to market, including through our innovation pipeline, which features differentiated products like Frieself. As we actively work through the 2026 transition year, my focus is on positioning the business for success in 2027 and beyond. My broader review is ongoing, but my immediate priorities are clear. Complete the integration associated with the VI acquisition and position Teleflex for improved growth as we continue the overall transformation of our business. That completes my comments on the second quarter revenue performance. Now I'd like to turn the call over to John for a more detailed review of our financial results. John?
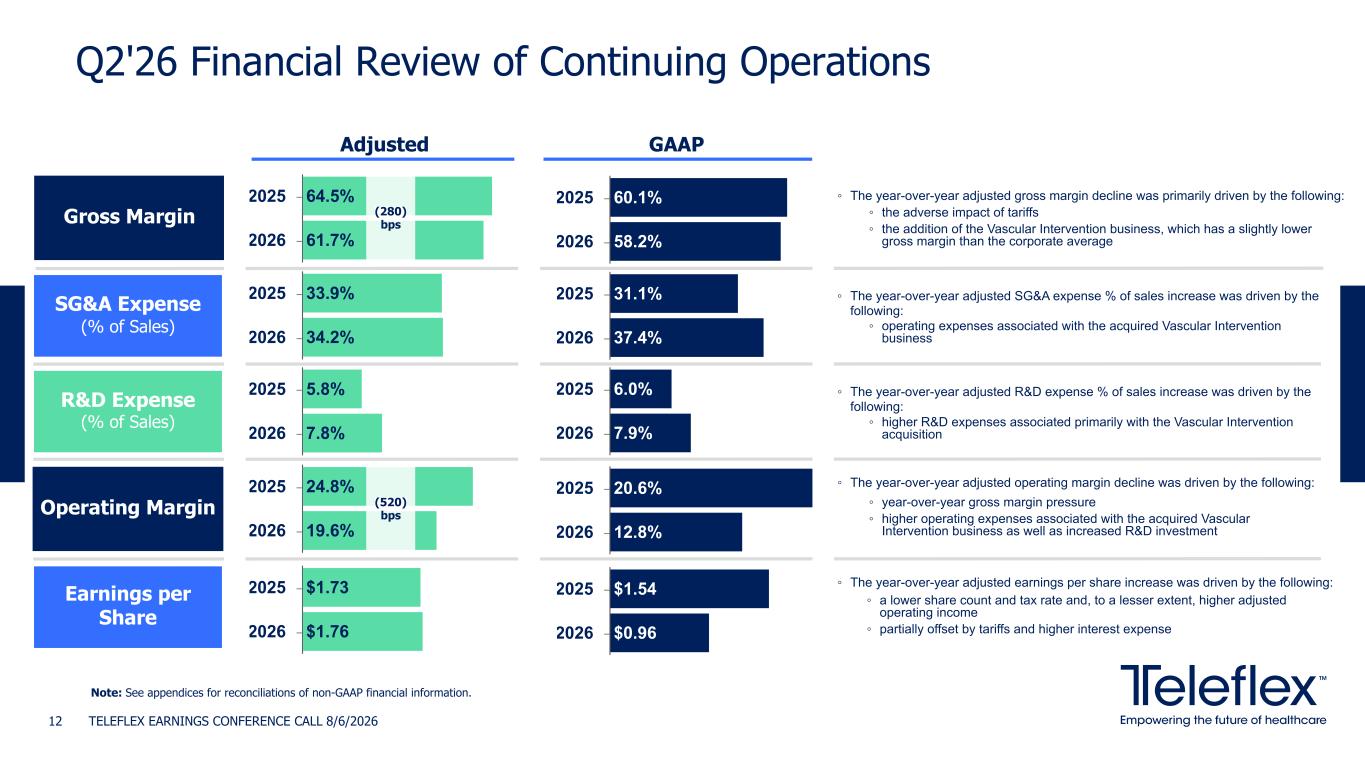
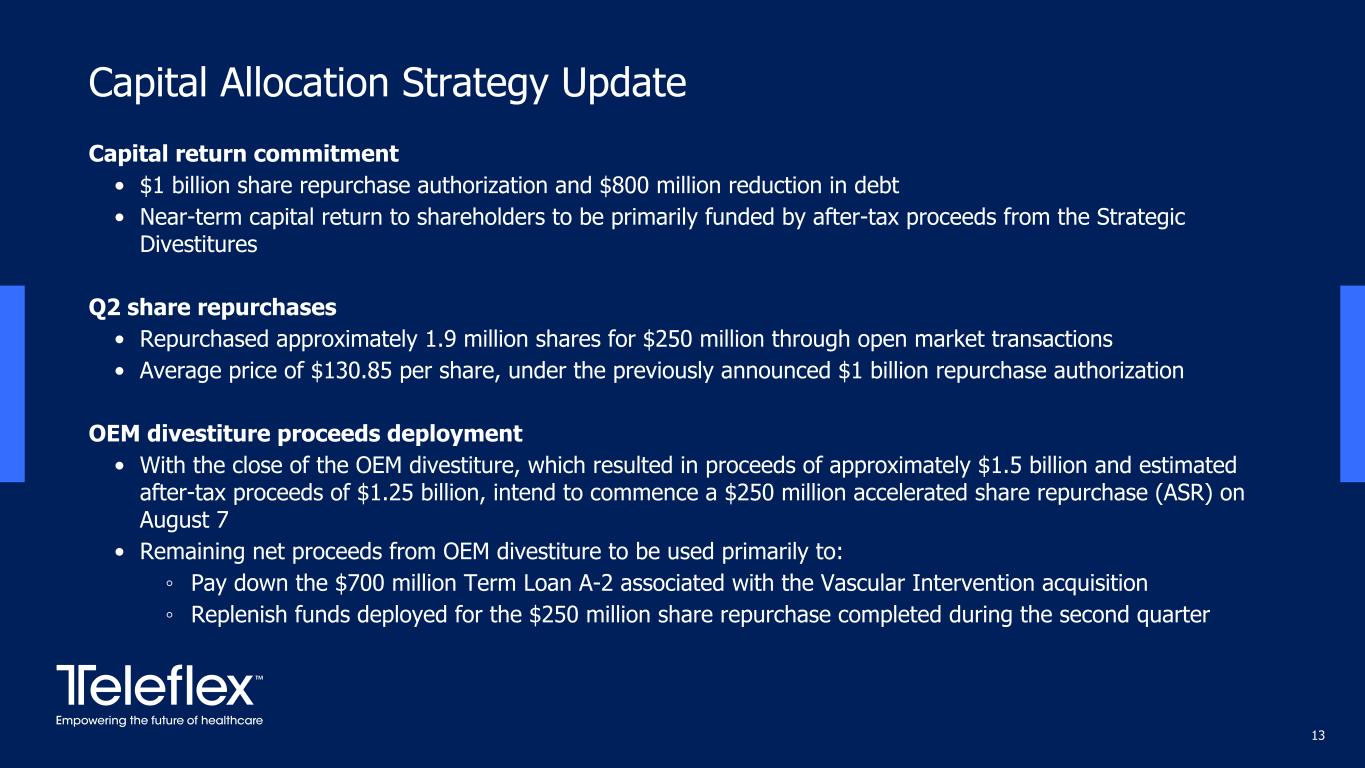
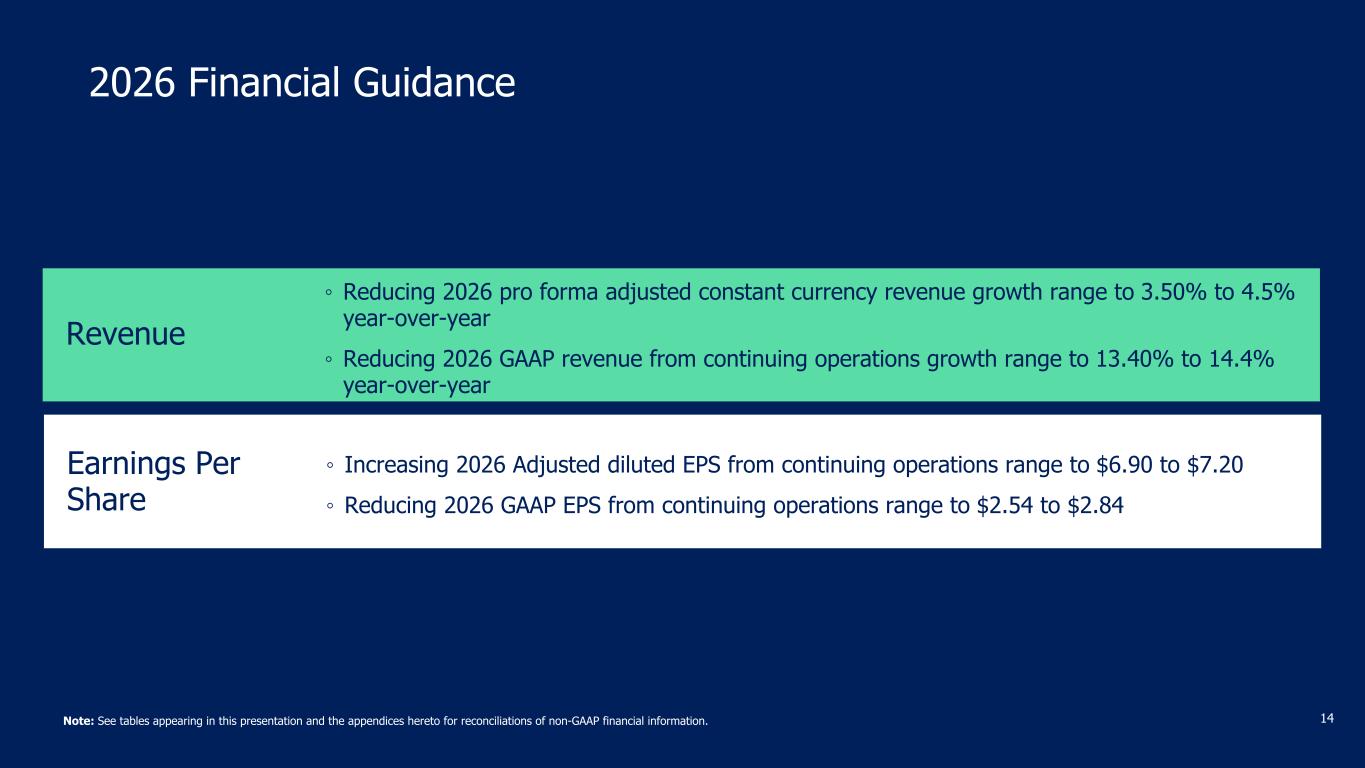
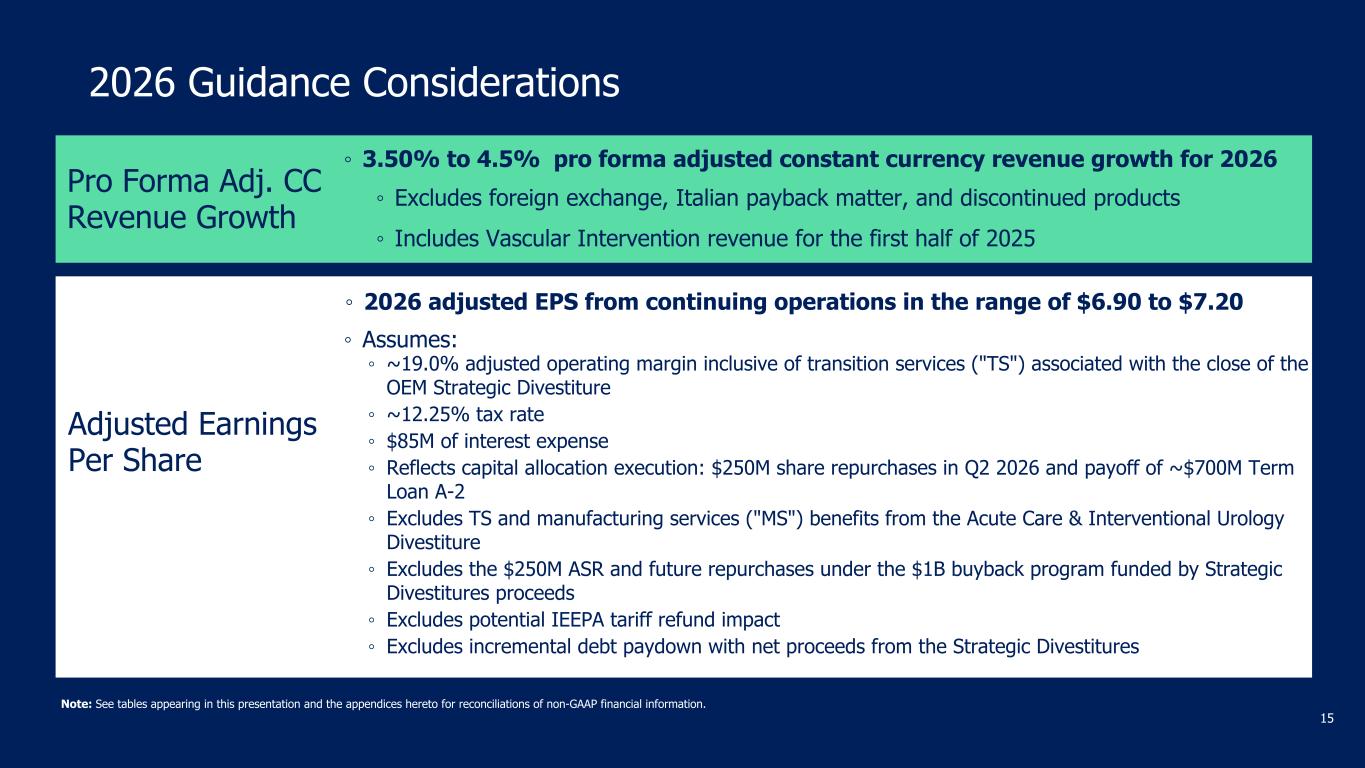
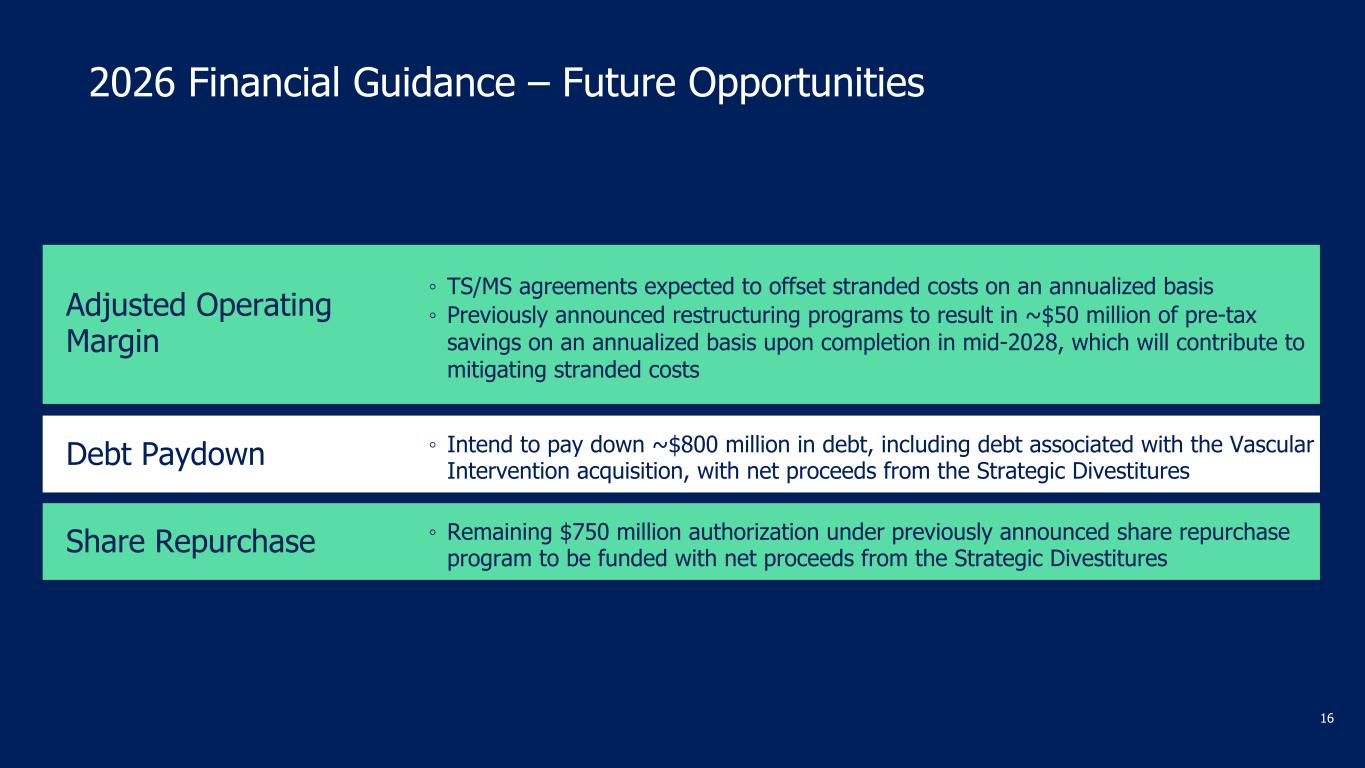
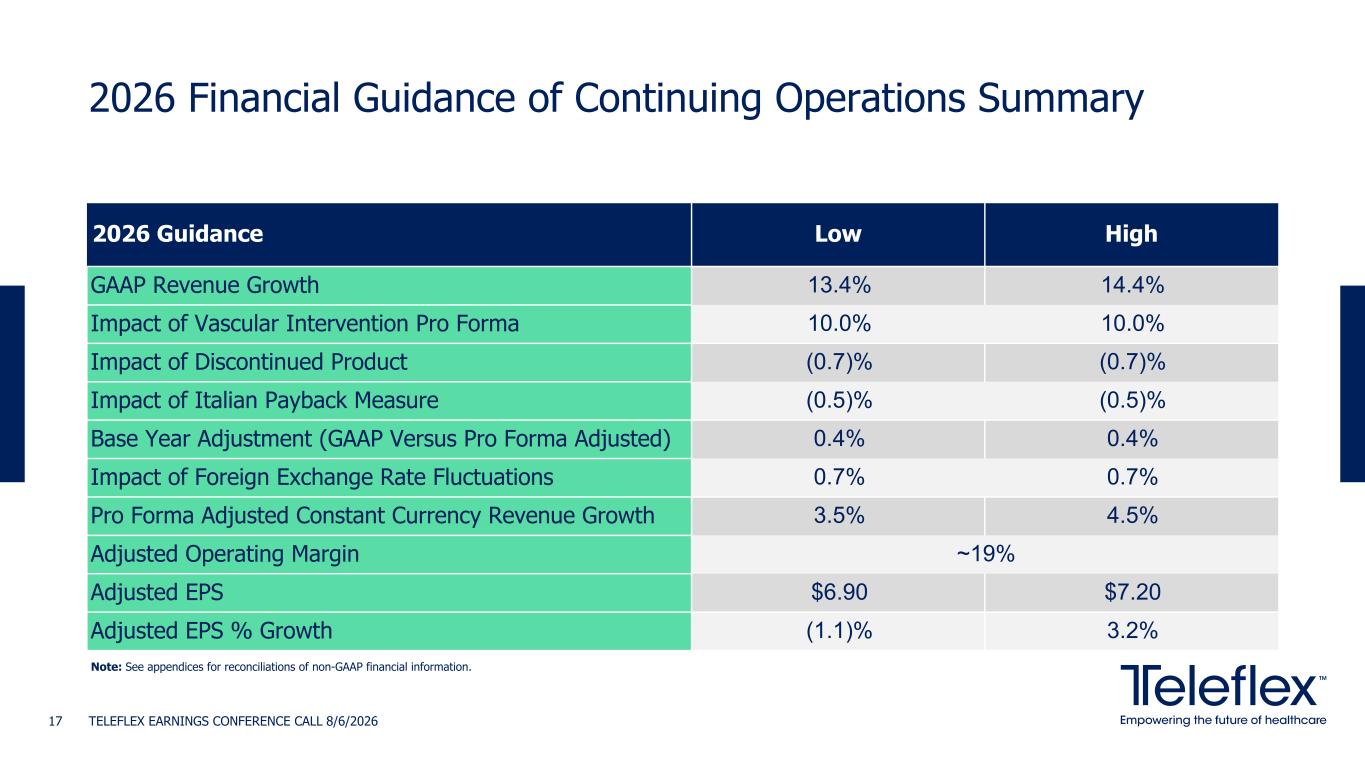
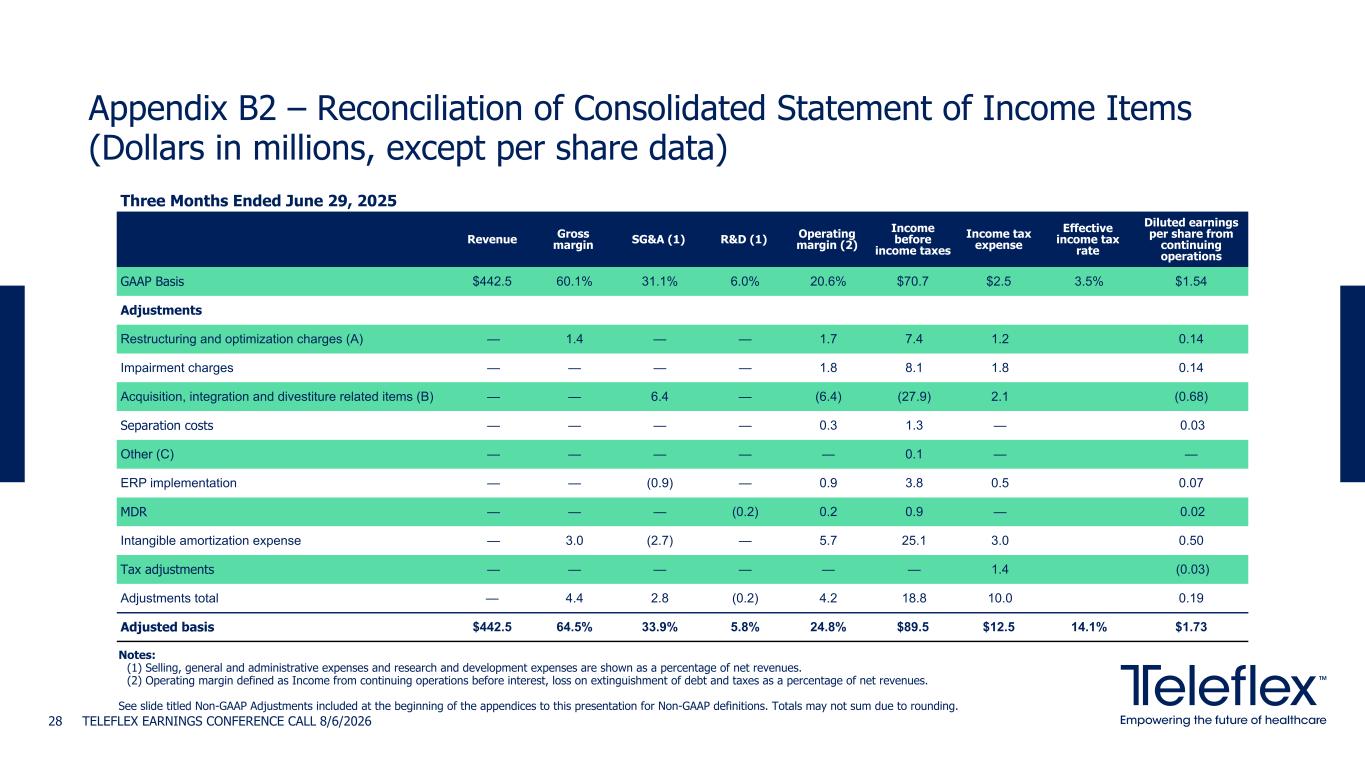
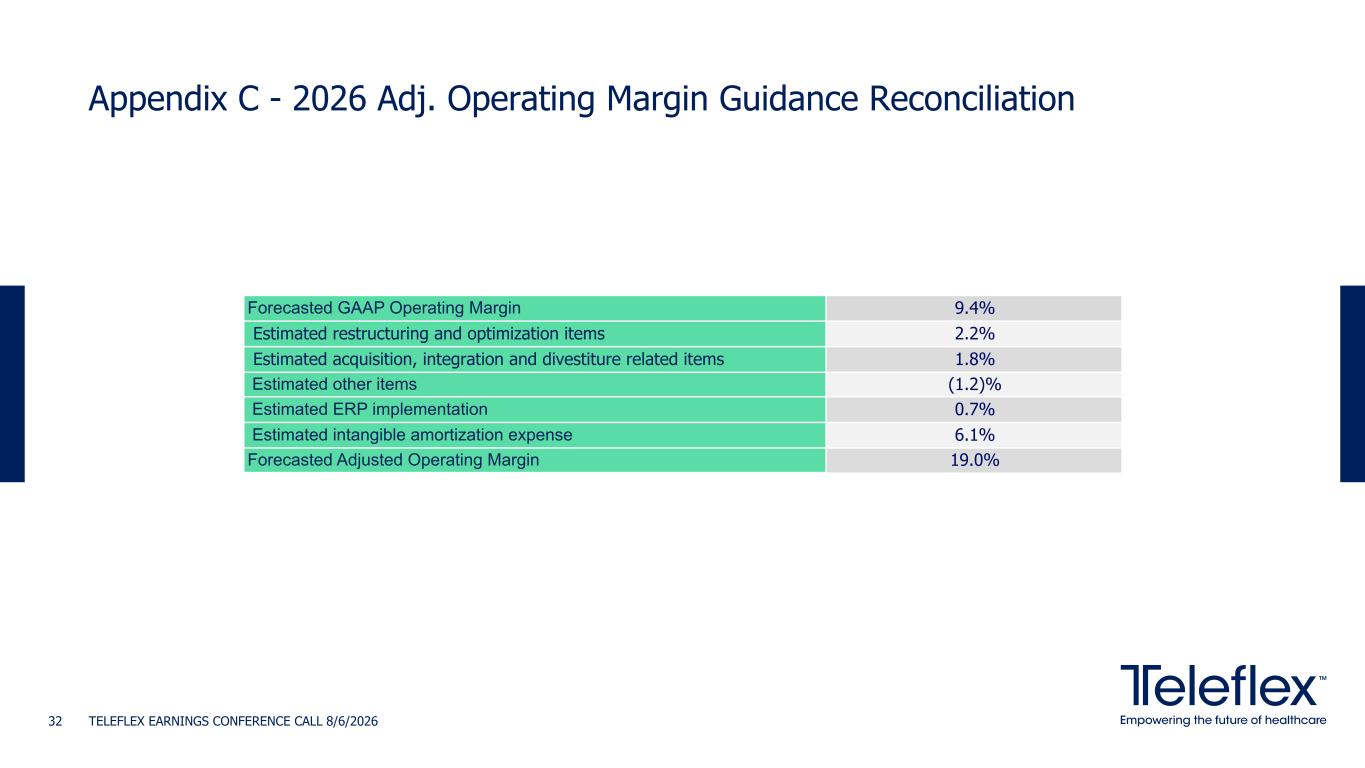
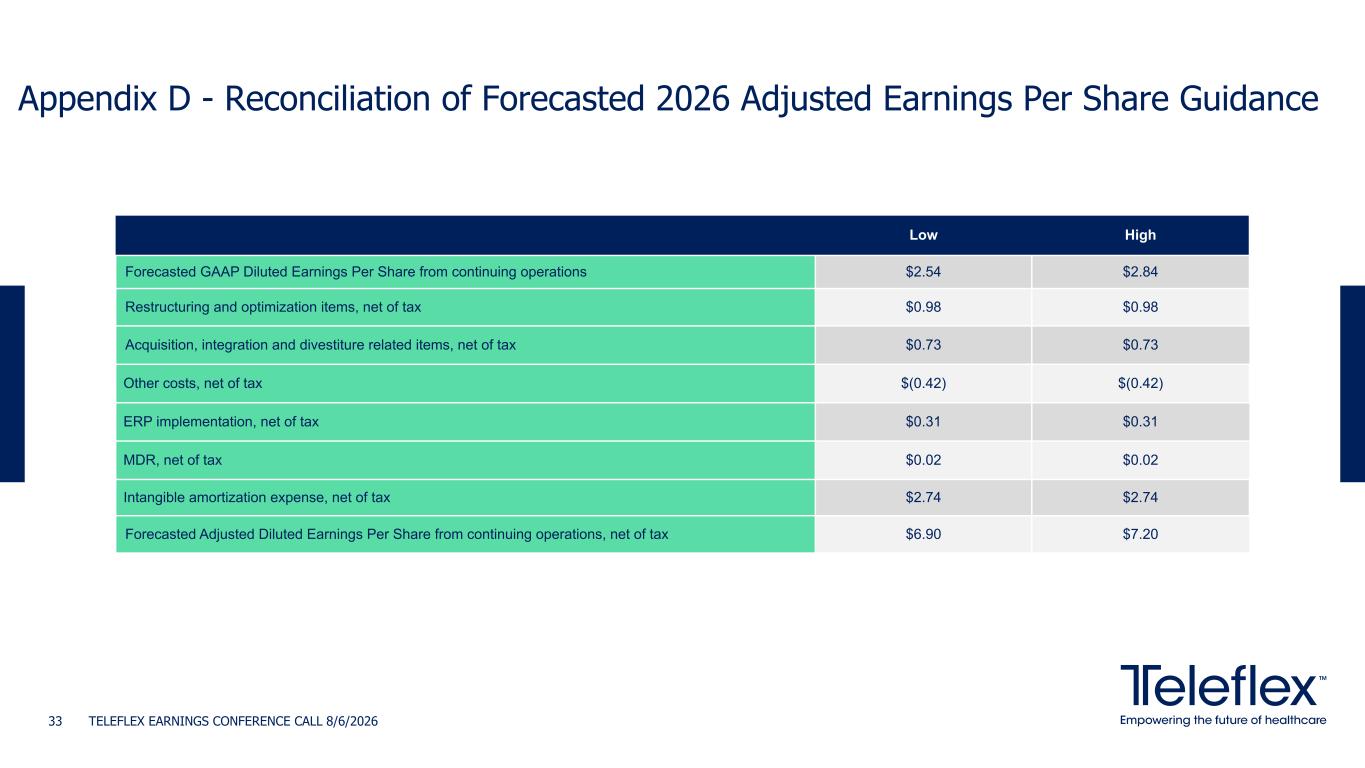
Thanks, Jason, and good morning. All results that I speak to will be on a continuing operations basis for 2026. Through the reclassification to discontinued operations, historical continuing operations reflect the impact of stranded costs in all periods presented. Given Jason's previous discussion of revenue, I'll begin with margins. For the second quarter of 2026, adjusted gross margin was 61.7%. The 280 basis point decrease year over year was primarily due to the adverse impact to tariffs and the addition of the Vasker intervention business, which has a slightly lower gross margin than the corporate average. Of note, there were no recognition of IEFA tariff refunds in the second quarter. Second quarter, 2026 adjusted operating margin was 19.6%. The 520 basis point decrease reflects year-over-year gross margin pressure and higher operating expenses associated with the acquired vascular intervention business, as well as increased R&D investment. Adjusted net interest expense totaled $26.5 million for the second quarter as compared to $20.3 million in the prior period. The year-over-year increase is primarily due to the borrowings used to finance the vascular intervention acquisition and a portion of the open market share repurchases in the second quarter of 2026 partially offset by lower interest rates. Our adjusted tax rate for the second quarter of 2026 was 9.9% as compared to 14.1% in the prior period. The year-over-year decrease is primarily due to the beneficial tax provisions included in the One Big Beautiful Bill Act, increased utilization of U.S. tax credits, and favorable jurisdictional mix in the quarter. At the bottom line, second quarter adjusted earnings per share was $1.76, representing a 1.7% increase year over year. The year over year increase was primarily due to a lower share count and tax rate, and to a lesser extent, higher adjusted operating income partially offset by tariffs and higher interest expense. At the end of the second quarter, our cash and cash equivalents and restricted cash equivalents balanced with $316.9 million as compared to $402.7 million as of year-end 2025. Net leverage at the end of the quarter was approximately 2.8 times, up slightly from the first quarter, primarily driven by borrowings to fund the share repurchases completed during the second quarter. Perform a net leverage for the OEM strategic divestiture was approximately 1.9 times. Turning to our capital allocation strategy, we remain committed to returning cash to shareholders under our previously announced $1 billion share repurchase authorization, by reducing debt by $800 million. To accelerate the return of capital shareholders, during the second quarter, we repurchased approximately 1.9 million shares of our common stock for $250 million through open market transactions at an average share price of $130.85. With the close of the OEM Strategic Divestiture, I am pleased to announce that we intend to commence an additional $250 million accelerated share repurchase on August 7th. The remaining net proceeds from the OEM strategic divestiture were primarily used to pay off the $700 million term loan A2 associated with the acquisition of the vascular intervention business. And we will replenish funds deployed for the $250 million share repurchase that was completed during the second quarter. Turning now to our financial guidance framework, as we previously indicated, 2026 results include a number of transient factors related to our strategic divestitures that will impact our near-term results, which we expect to be mitigated with the close of both transactions. Therefore, we anticipate 2027 will be more reflective of the underlying business, ultimately building a clearer financial profile with significant improvements in adjusted margins, interest expense, and adjusted earnings per share. As previously announced, we have also launched a multi-year restructuring plan that is expected to achieve approximately $50 million in annual pre-tax cost savings upon completion in mid-2028. The restructuring activities which are on track began in the first quarter of 2026, and our guidance continues to assume savings from these activities will accelerate in the second half of the year. We are also identifying further cost production opportunities and remain committed to mitigating the stranded costs associated with the strategic divestitures. With that context, I will review items that will impact our 2026 results. First, our assumptions for 2026 continue to reflect the impact of stranded costs partially offset by TS agreements associated with the recent close of the OEM strategic divestiture. Of note, the TS and MS agreements associated with acute care and interventional urology strategic investitures are more expansive than those for OEM due to the buyer requiring more support, which will drive adjusted margin expansion in 2027 as we offset stranded costs. Second, the exact timing of the closing of the acute care and interventional urology strategic investiture will pace our ability to deploy additional capital during the remainder of 2026. Third, our 2026 adjusted gross margin assumption does not reflect any benefit from IEPA tariff refunds. As we look forward to 2027 and beyond, we anticipate our capital deployment actions in combination with the impacts of the TS and MS agreements and our efforts to further mitigate stranded costs and right-size the organization will result in a significant increase in our adjusted operating income, adjusted margins, and adjusted EPS. Moving to an update on our 2026 guidance, please note that our 2026 guidance is provided on a continuing operations basis and excludes the acute care, interventional, urology, and OEM businesses. We now expect Proforma adjusted constant currency revenue growth for 2026 to be in a range of 3.5% to 4.5% as compared to 4.5% to 5.5% previously. The updated guidance reflects the performance in the first half of 2026, the extended timeline for the integration of the interventional business, and our expectations for the vascular and surgical business for the second half of the year. Turning to adjusted earnings per share, we now expect an increased range of $6.90 to $7.20 in 2026 versus our previous guidance of $6.25 to $6.55. Our guidance includes the second quarter results, our updated expectations for the second half of 2026, including the benefit of the second quarter share purchase activity and lower net interest expense. Our adjusted EPS guidance does not include any benefit from the proceeds resulting from the acute care and interventional urology, strategic divestiture, and the anticipated positive impact from additional share repurchases in the second half of 2026, including the $250 million ASR referenced earlier in my remarks. Also, for the avoidance of doubt, our adjusted EPS guidance does not assume a benefit of tariff refunds at this time. We will recognize the tariff refund upon full confirmation from the U.S. government. We anticipate these actions will result in meaningfully lower share count and significantly reduced interest expense in 2027 and beyond. Taken together, we expect share repurchase and balance sheet deleveraging activities will contribute to significantly higher adjusted EPS beginning in 2027. Additionally, for modeling purposes, you should consider the following. The impact of foreign exchange for 2026 is still expected to be approximately $14 million tailwind to our pro forma adjusted constant currency revenue growth. We continue to expect our 2026 adjusted operating margin to be approximately 19%. As previously discussed, after addressing standard costs, we believe our steady state margin profile will be approximately 23%. Looking forward, we see opportunities to improve upon that state operating margin through operating leverage associated with revenue growth and other cost-saving initiatives, moving to assumptions below the line. For net interest expense, we now expect approximately $85 million for the full year 2026 as compared to the previous assumption of approximately $105 million. The change in outlook primarily reflects the $700 million debt reduction associated with our recent close of the OEM strategic divestiture, as well as the opportunities to optimize our near-term borrowers. We now expect our adjusted tax rate to be approximately 12.25% in 2026, as compared to approximately 13.5% previously. Finally, we expect shares outstanding to approximate $43.3 million, which excludes any benefit from the announced $250 million ASR. That concludes my prepared remarks. I would now like to turn the call back to Jason for closing commentary.
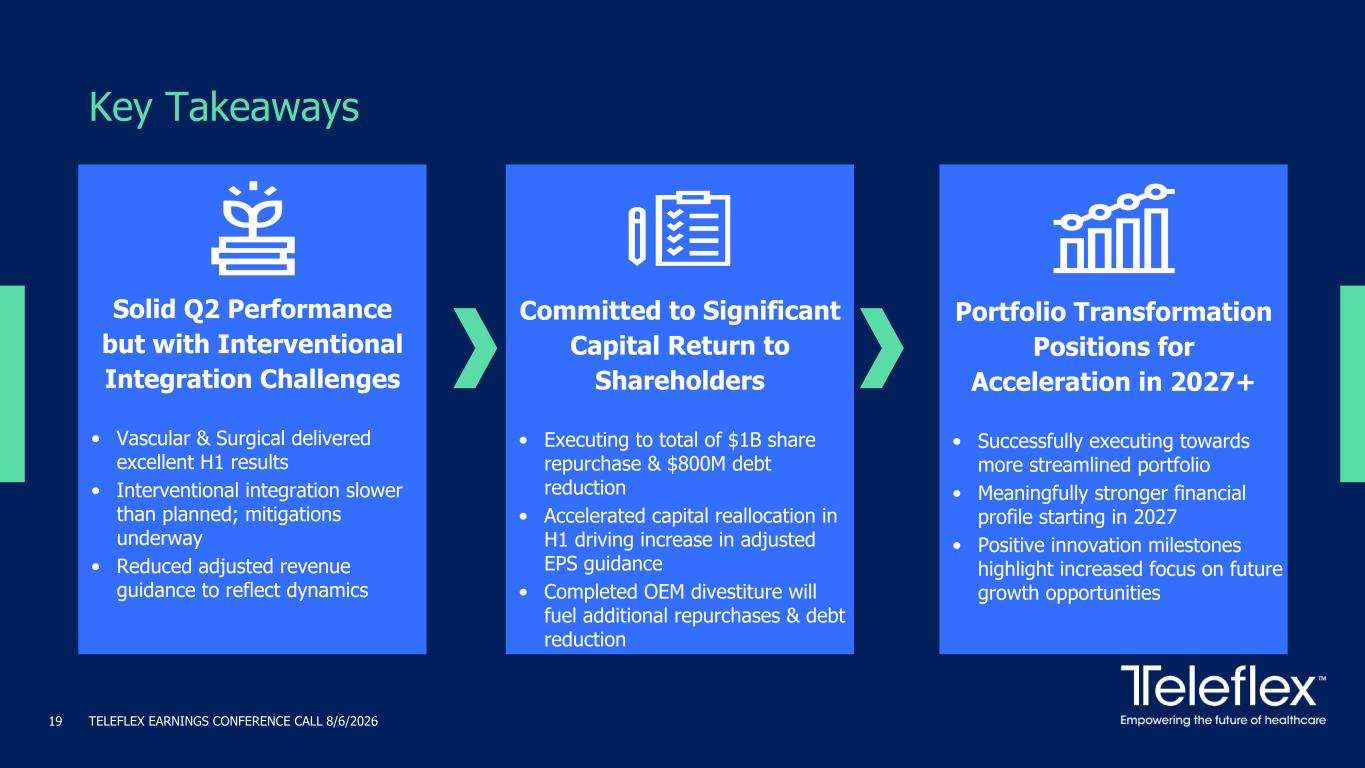
Thanks, John. In closing, I will highlight our three key takeaways from the second quarter of 2026. First, Teleflex had a very solid second quarter, delivering better than expected revenue, adjusted margins, and adjusted EPS. We expect continued solid performance in vascular and surgical in the second half of 2026, albeit at a more moderate growth rate than the first half, alongside extended timelines to full interventional integration. We have reduced our pro forma adjusted constant currency revenue growth guidance to reflect these dynamics, with the low end of the range contemplating no improvement in interventional revenues versus the second quarter for the remainder of the year, in addition to typical third quarter seasonality. Second, we are committed to returning significant capital to shareholders. Accelerated share repurchase and debt reduction in the first half are driving an increase in adjusted earnings per share guidance. The recently completed OEM strategic divestiture fuels additional repurchases and debt reduction going forward. Third, we are continuing to successfully execute on our transformation to a more streamlined portfolio, which will position us for acceleration in 2027 and beyond. We expect meaningful increases in adjusted operating margin and adjusted earnings per share in 2027. Additionally, recent positive innovation milestones with EasyPlaz and FreeZall highlight our increased focus on future growth opportunities. That concludes my prepared remarks. Now I'd like to turn the call back to the operator, for Q&A.
Operator
Thank you. If you would like to ask a question, please press star 1 on your telephone keypad. If you're using a speakerphone, make sure that your mute function is turned off to allow your signal to reach our equipment. We ask that you limit yourself to one question and one follow-up. If you would like to ask additional questions, we invite you to add yourself to the queue again by pressing star 1. Our first question comes from the line of Vic Chopra of BMO Capital Markets. your line is open hey good morning and thank you for taking the question uh two for me sorry vic just one moment i'll get you back your line dropped off here we'll take the next one i'll get you back in line vic your next question comes the line of jason bedford of raymond james and associates your line is open uh good morning and thanks for taking the question um maybe just first for Jason.
Speaker 0
Jason, you're walking into a situation here where the strategy through transformative deals is largely set. Are there any pieces of the strategy that make you uncomfortable? And if you can point out any areas of opportunity that maybe were not clear when you stepped into the role?
Yeah, thanks, Jason, for the question. Actually, one of the things that really attracted me to Teleflex as I was looking from the outside was this transformational strategy I thought that it was the right approach to provide better focus for the business and as I've come in I remain confident in that strategy there is nothing that stuck out to me in these first two months that make me think that we're on the wrong path obviously we need to determine what the what the long-term path is beyond that so I'm in the middle of that what I would call my comprehensive assessment of the entire organization and you know over the coming months here we'll put together the long-term operational and strategic plan to really drive long-term durable growth and shareholder value.
Speaker 0
Okay. And then just maybe as my follow-up, can you elaborate a bit more on the VI integration issues? What is the issue and what needs to happen to fully integrate the business?
Yeah, great question. So the first thing I want to emphasize here is that this is absolutely not a product issue. So with the coming together of these two portfolios, the legacy Teleflex interventional portfolio and the Biotronic VI portfolio, they really fit beautifully together. I think all of you guys know that I spent the last 20 years in the interventional business, so I know this space well. And what I can tell you is that when I took this role, I got countless numbers of messages, text messages, and emails from KOLs in the space that basically said, wow, you have a great bag. We're excited to see what you do with it at Teleflex. So this isn't a product issue. What it is simply is just integration transitions that are continuing, that are transient, that we need to work through. And I would primarily point to three areas. The first would be order to cash transitions. The second would be distributor transitions. and the third would be Salesforce transitions. All of these are manageable. So if I start and go into a bit more detail from the OTC perspective, so anytime you change an ordering system for a customer, no matter how smooth your internal transfer goes, and it was smooth for us, it's a change for the customer. And so there's an opportunity for disruption and confusion with them. And so that's what we are going through right now. We've identified where we have customer confusion and any lingering issues and we're systematically working our way through those. What I can tell you is that the vast majority of our OTC transitions happened in Q2, and so that gives us a real good line of sight into how we can work through any of those lingering customer confusions. The second is really about distributor transitions, and any time you move from one distributor to another, there's often a timing issue. So your original distributors start working down their inventory, and so they stop buying, and you haven't yet got to the point of the rebuy or the startup buys for your new distributors. So obviously, we're closely tracking all of those transitions from distributor to distributor and making sure we drive to completion of those. The final area is really about Salesforce transitions. When you bring two sales forces together, there's obviously going to be some territory realignment. So you end up with some reps that have new customers. You end up with reps that have new products to sell. And in some cases, we found that we didn't have the right reps to sell this combined bag, and so we have open positions. And so we have a very comprehensive plan in place to make sure we have enhanced training as well as to make sure we have a very clear hiring plan, and we're already making really good progress against that hiring plan. So, again, I'd say all of these are transient issues related to the integration, and we have this really strong foundation of really great products. And trust me, I wouldn't be here if I didn't think that there was great opportunity in the interventional business.
Operator
Our next question comes from the line of Vic Chopra of BMO Capital Markets. Your line is open. Hey, good morning.
Jason, you've had about two months to assess the business. I'm curious how quickly you expect to communicate the outcome of your strategic review, and should we expect a formal long-range plan?
And then I had a quick follow-up please yeah thanks for the thanks for the question vic um obviously as i said a couple minutes ago here one of my biggest priorities is really to fully assess the business and put together that long-range plan um you know i would i would i'm only two months in so i need a little bit more time i would expect that i'll have more to say and a little more color on on opinions of future direction here uh by the next earnings call okay great and a quick follow-up on uh on biotronic i'm curious what level of confidence you have that the current timeline reflects the full extent of the delay thank you yeah yeah i think that um when we when we look at um the as i said the main causes of of the integration delay we have mitigations in place and we're already seeing progress in those, in each of those factors. So we have pretty good confidence, a really good confidence that we will, we should be able to work through that by the end of the year. And thus our guidance also reflects that.
Operator
Our next question comes in line of Patrick Wood of UBS. Your line is open.
Amazing. Thank you so much for taking it. I'll do two quick ones up front. You know, just looking and thinking about the business, I know, I know it's obviously only been a few months for you. But, you know, the guide implies ever so slightly more conservative second half, I think like plus 3% or so. Is there any reason in your mind that midterm, this shouldn't be a business that can grow, you know, 4% or so? Is there anything that we might be missing, whether it's procedure environment or anything like that that would preclude, you know, 4% plus as a reasonable midterm benchmark?
Yeah, thanks for the question, Patrick. You know, I don't think there's anything major that you're missing here. And let me go back to the guidance and be really clear. So as we look at this revised adjusted revenue growth guidance of 3.5% to 4.5%, this is for the full year and for all of Romenco, and we're not going to guide on individual businesses. That said, the entire reduction in that guidance from previous guidance is due to this integration slowdown in interventional.
Operator
Our next question comes from the line of Matthew Taylor of Jeffries.
Your line is open. Hey, good morning, and thanks for taking the questions. This is Mike Sarkonnen for Matt Taylor. I guess just to follow up there on the guide, I think in the prepared commentary you mentioned maybe some more moderate growth expectations in the back half of the year for vascular and surgical as well. Can you just kind of square that away and elaborate there versus questions around the Sure, no problem.
So, again, the reduction in the guide is solely due to what we see in interventional. That said, we did provide some additional color in the prepared remarks to give you confidence in our ability to get to the lower end of the range. And that was that the low end of the range really contemplates no growth in interventional for the remainder of the year. And so it's take that Q2 revenue that we had in interventional and assume that that's what it would be for the remainder of the year with just some additional seasonality in Q3. For the other two businesses, for vascular and surgical, we expect them to continue to perform really solidly. But they've been growing at a high single-digit rate through the first half of the year, which is fantastic. But these are not high single-digit growth markets. So if we look at vascular, for instance, we did see with some of our major distributors that inventories creeped up a little bit in H1. So we would expect that eventually that's going to normalize. If I turn to the surgical business, when we get to the second half of this year, we just frankly face tougher comps. So if you look at H2 of last year, that's when we started to see some of the strength in the instrument portfolio.
Got it. And maybe just can you comment on whether or not you've seen any impact from ACA subsidy expiration and just kind of patient demand and utilization?
We haven't seen any impact from that.
Operator
Our next question comes from the line of Jason Bednar of Piper Sandler. The line is open.
Speaker 14
Good morning. Thanks for taking the questions. Jason, I want to go back and double-click on those three buckets you stepped through earlier impacting the revenue outlook. The first two, OTC and the distributor dynamics, those to me sound pretty manageable, very controllable. It's the last one, the Salesforce piece, and I'd love to get your thoughts around that, just being fully resolved by year-end. Some of those rows are still open, and in MedTech, we've all seen that it usually takes a little bit of time on ramp-up. So just given where we are in the middle of the year, just your comfort or confidence around addressing that Salesforce piece.
Yeah, I think that's a great question. I'm confident we can get through the hiring plan. I'm confident with our current reps we can get through the enhanced training that we need to do. But as you know, in these spaces, typically it takes a good six months or so to get a rep up to speed. So I would assume that our ramp up is not going to be a step up, but a ramp up, exactly like you're saying.
Speaker 14
All right. And then I don't mean to ignore all the heavy lifting here in 2026. But a lot of us are understandably trying to hone in also on, you know, where growth goes for 27, where EPS heads for 27. And just based on the margin normalization, capital deployment, all the things that are in play, it's not hard to see EPS move to something that's like 1125 or 1150 in that neighborhood for next year. You know, Jason, I know I'm kind of first call here. Just love to get your reaction to that.
Well, look, I'm going to – I'll pass that one to John to talk about what our expectations are on the EPS. But, yeah, go ahead, John.
So, obviously, we're not ready to guide 2027 yet. I appreciate your thoughts, and I don't know that I can confirm or deny your modeling. But, you know, I would tell you that, you know, with a 23% off margin from where we sit today, that your numbers don't sound unreasonable.
Operator
Our next question comes from the line of Lawrence Bagelson of Wells Fargo. Your line is open.
Speaker 4
Hey, good morning. This is Nathan Trabeck on for Larry. Jason, CMS is changing the requirement for NTAP and TPT. You know, breakthrough designation no longer eliminates the need to show a clinical advance to receive enhanced reimbursement.
How does this impact C-solve and where you might be able to price it? um well as you know with those with those rules it just eliminated the shortcut that you did not have to show superiority um with uh if you had breakthrough device designation and so we are aware that that goes away and that that pathway goes away uh at the same time you know and um you know we've got a lot of different scenarios we're looking at for free solve in the long term And, you know, certainly we're looking at different measures of which we could also attempt to show that there could potentially be long-term superiority of that device. But regardless, this is, you know, regardless of where that NTAP or TPT ends up, we think that if this plays out clinically in the randomized trials, this is a great opportunity no matter what.
Speaker 4
And I did want to ask, or Cyro, what percentage of interventional revenue is it today, and is it declining at a similar rate to the overall DES market? And do you think you can change the trajectory for that product?
So the first thing I would say is we're not going to get in guide in specific or talk about growth rates of specific product lines. That's just not something we're going to do. I can speak generally about the DES market, which is, I would call it, approximately flat. So pricing is usually counteracting the PCI growth that's happening worldwide. And what I would say about our CSIRO is that it's got a pretty low share position, not because it's not a great product, but it just hasn't had the commercial bandwidth across the globe to really go after it. And so I do think that there's actually opportunity for us to outperform the market over time with this product. You know, there's 70,000 patients studied with our SIRO. It's a good product. It has amazing data versus science, and I'm excited to see what we can do with it.
Operator
Our next question comes from the line of Mike Mattson of Needham & Company. Your line is open.
Yeah, thanks. So I wanted to start with one on EZPlaz. So you appreciate the commentary there, but I didn't really hear much about the market opportunity. I think in the past you talked about it being about $100 million potential market in the U.S. And then what about the timing of the launch and potential sales ramp?
Yeah, great question. So first let me start with just saying that I'm really, really pleased with this landmark approval. and I think that it really demonstrates Teleflex's expanded commitment to innovation. This is something that the company has been working on for more than a decade, and it is certainly not an easy project or an easy innovation. And so now we ended up as the first and only freeze-dried plasma that's licensed by the FDA. So I really wanted to compliment the team on that before addressing your question. So, look, with EZPLAZ, what I want to make clear is that our first and immediate priority here is the government and military market here in the United States. And there's a lot of work that needs to be done there. So the next steps for that are procurement solicitation with the Department of War. Then we have to negotiate contract. Then we sign a contract and start to actually commercially deliver product. Now, we're actively engaged in those conversations, and they're going well. In 2026, I would anticipate that any revenue we get from EasyPlaz would be immaterial, but in 2027, it will be a contributor. In terms of the long-term market, I am aware that in the past many years ago, the company had described this as a $100 million opportunity. opportunity, as you can imagine, as being new to the role, I want to reassess how and our ability to go after new segments and what that total market opportunity can be. And I would say we're still in the middle of that. And so I would say it would be premature for me to comment on the total market opportunity over time.
Okay. And then in terms of Freesolve and the Biomag 2 trial, which you're expecting results, I think, late next year, what's sort of at stake with that trial? So is it safe to assume that if the results are positive that that's going to allow you to see sales kind of ramp more aggressively outside the U.S. where it is on the market in Europe and other places?
Yeah, great question. So as we think about FreeSolve outside the United States, you're exactly right. A sales ramp is not an approval issue. It's really a data issue or a lack of data and a guidelines issue. And so we have really great single-arm data so far with Biomag 1, which I would say is hypothesis-generating. We hear great things from physicians that the device performs similarly to a conventional DES. The results in that single-arm study look like a conventional DES, but obviously we need to see it in a randomized fashion. And so we did, as you said, we finished enrollment in Biomag 2, which is about 2,000 patients, randomized versus science. We finished that ahead of schedule. So we will have a readout next year. And so that should take care of this data question. And so we're anxious to see that and to really see how this performs versus DES. And then in terms, though, but beyond that, I mentioned there's also a guideline issue. So the major guidelines outside the U.S. in cardiology are the ESC guidelines, European Society of Cardiology guidelines, and right now those guidelines state that you should only use bioabsorbable scaffolds in a clinical trial setting. So even as we get through, knock on wood, positive data next year, we'll still have to work with ESC to make sure the guidelines get updated, but positive data should allow that to happen.
Operator
Our next question comes from the line of Anthony Patron of Mizuho Financial Group. Your line is open.
Thanks, and welcome, Jason. Pleasure to meet over the phone, and hope you're doing well, John. One on procedure volumes, just a broader question, and one on capital allocation. You know, all three, you know, segments could be used as a proxy for procedure volumes. Your vascular or organic is eight. Your surgical is nine. And obviously, interventional, you have, you know, the organic growth down 1%. You know, to what extent can you give us a little bit on U.S. procedure volumes? There's been some noise out there. HCA had inpatient emissions down. Some of the medtech companies are not seeing impact. Some of them are. So what is the view from the Teleflex vantage point as it relates to U.S. procedure volumes into the back end of the year? And I'll have a follow-up on capital.
So, I mean, just in short, similar to what I said before, is we're not really seeing any impact of procedure volumes. We don't think that that's what's been driving the performance of our businesses.
And maybe on capital allocation, $250 million ASR. I think the prior target was a billion overall. So, you did $250 in a first sherry purchase, a $250 post-DOEM divestiture for an ASR, and instead there's debt buyback. So, maybe just to recap on capital allocation, what will be the steady diet of share repurchases versus debt service? And, of course, M&A was part of the Teleflex DNA. You know, what are your thoughts, Jason, on M&A?
So, at a high level, we remain committed to the billion-dollar share repurchase, the $800 million in debt reduction. So, as you said, we completed the $250 million share buyback in Q2. the first $250 million. We announced the next $250 million ASR here to start tomorrow. And then the remaining $500 million will likely use the proceeds from the acute care and interventional urology divestiture when that closes. From a debt reduction standpoint, we've paid down $700 million with the OEM proceeds from – and that was some debt that we incurred from the Biotronic acquisition, and then we'll pay down the additional 100 here of debt that we committed to by the remainder of the year. In terms of your question on acquisitions, the first thing I would say is we've got a lot on our plate right now that we need to execute to, and that's what our focus is on. We need to make sure both of these divestitures get done. We need to make sure that we fully integrate Biotronic, and then we'll work from there. But generally, my philosophy, though, on acquisitions is that I would like these – anything we look at would need to be tuck-in acquisitions to the businesses that we will have here in Romainco. I'm not interested, at least in the short to midterm, on anything that would be transformational.
Operator
Our next question comes from the line of Ravi Mizra of Truist Securities. Your line is open.
Hi. Thanks for taking the questions. uh also relay my congratulations and nice to start working with you jason over the coming quarters um just i guess my two i'll ask them up front uh can you talk maybe a little bit about pantera uh lux kind of what's going on in the the dcb isr space one of your competitors has been delivering pretty gangbusters growth in that segment so just want to understand how you're viewing the opportunity there. And then second, just I guess on the vascular strength, you know, there's growth acceleration despite some of the supplier headwinds that were mentioned. You kind of talked about the mortaring patterns here. Can you maybe point us to, John, what kind of a stabilized end market looks like for this segment? Thanks. Appreciate the time.
So first question on DCB. Yes, there's been – DCB has been a great growth opportunity, particularly in the coronary space over the last couple of years. We see this is a growth segment for us within our interventional business. We see more opportunity around the world. We are looking at the different options for us to get our DCBs into the United States and to Japan. Because of some contractual items on these products, the LUX platform, it's not necessarily straightforward, and so we're still trying to work through what our different options are. um let's see so the the other question was just about the vascular segment and um and oh yeah and ordering patterns and where we saw the the market stabilizing so so again so we had really strong business in our performance in our vascular business in h1 in particular in in the second quarter i'll call out that our team did a fantastic job of managing the lidocaine recall which we thought could have been a negative for us in the quarter with a backorder, but our team really, really managed through that in a great way. As I mentioned, though, as we track the inventories of the major distributors, they've creeped up a little bit, and so we would expect them to normalize a little bit in the back end. At the end of the day, this is a mid-single-digit growth market.
Operator
Our next question comes from the line of Michael Polark of Wolf. Your line is open.
Speaker 14
Hey, good morning. Follow up on the Biotronic integration update. I'm just curious on the revenue, call it disruption side. Is it legacy Biotronic, or is it legacy Teleflex, or is it both? And is there a geographic area that stands out more, Europe or U.S.?
So, look, we don't get into product line details, but I think it's safe to say that the Biotronic BI acquisition revenue base was disproportionately impacted through the integration struggles.
Speaker 14
And then a question on tariff refunds. I heard, John, none received, none in the guide, helpful. There are some companies that are reporting receipts of such refunds in the second quarter. So why haven't you seen them? Do you expect them to come in the third quarter? Can you help us think about how you would treat those if and when they do come? Thank you.
So we did see some refunds in this quarter, but they were not – they were, one, somewhat split between Romainco and NUCO, so between DO and CO, and they also related to 2025. So our non-GAAP policy will only recognize into earnings things related to 2026. With that said, the only opportunity for 2026 refunds is approximately about $15 million that hit in Q1 and Q2. So when we do see those refunds come in, that amount would come back into earnings. I can't really speak to timing because it's a little unsure. We have submitted all the refunds, but that amount will come back into earnings, that $15 million. Right now, in total, we expect somewhere in the neighborhood in cash of about $39 million in refunds to Teleflex.
Operator
Our next question comes from the line of Travis Steed of Bank of America. Your line is open.
Hey, thanks for taking the question. Just maybe, you know, as a new CEO, we'd love to have you talk about kind of your philosophy on creating shareholder value. And, you know, there's a lot of strategic and financial interests going on in MedTech and there's standalone ways to do that and other ways to do it. But like as a new CEO coming in and, you know, obviously a new, kind of a new path here for Teleflex, we'd just kind of love to have you talk a little bit about your philosophy in particular on shareholder value creation.
Yeah, thanks, Travis. So right now, I've got a lot to learn in this new job and in this new business, and so I've really been focusing on learning as much as I can. And like I said, the priorities have been to learn, to really focus on the execution of these big things that we've got to move, the divestitures, the integration, et cetera, and then to develop that strategic approach here on what we're going to do in the long term. So, again, I remain committed to what Teleflex has already put in place with the share repurchase and the debt paydown. I'm also very committed to innovation and believe in organic R&D to drive shareholder value. And if you look at what we've done here at Teleflex in the first half, we're getting close to 8% of revenue for R&D as opposed to historical levels at 6%. But as I think about exactly how I want to approach capital allocation and any changes in the long term beyond that, I'd ask that you give me a little bit more time. I want the time to really fully assess every aspect of the business first.
Operator
And that is all the time we have for questions today. I will now turn the comments back over to Mr. Lawrence Kirsch for closing remarks.
Thank you, JL, and thank you to everyone who joined us on the call today. This concludes the Teleflex Incorporated second quarter 2026 earnings conference call.
Operator
You may now disconnect.