Operator
Thank you for joining us for the V2X, Inc. First Quarter 2026 Earnings Conference Call and Webcast. Today's call is being recorded. My name is Gary, and I will be the operator for today's call. At this time, all participants have been placed in a listen-only mode. Following management's presentation, we will open the call for a Q&A session. To withdraw your question, please press star then 2 on your telephone keypad. I will now pass the call over to your host, Michael J. Smith, Vice President of Treasury, Investor Relations, and Corporate Development at V2X, Inc. Please go ahead.
Speaker 1
Thank you. Good afternoon, everyone. Welcome to the V2X, Inc. First Quarter 2026 Earnings Conference Call. Joining us today are Jeremy C. Wensinger, President and Chief Executive Officer, and Shawn M. Mural, Senior Vice President and Chief Financial Officer. Slides for today's presentation are available on the Investor Relations section of our website at gov2x.com. Please turn to slide two. During today's presentation, management will be making forward-looking statements pursuant to the safe harbor provisions of the federal securities laws. Please review our safe harbor statements in our press release and presentation materials for a description of some of the factors that may cause actual results to differ materially from the results contemplated by these forward-looking statements. The company assumes no obligation to update its forward-looking statements. In addition, in today's remarks, we will refer to certain non-GAAP financial measures because management believes such measures are useful to investors. You can find a reconciliation of these measures to the most comparable measure calculated and presented in accordance with GAAP on our slide presentation and in our earnings release filed with the SEC, both of which are available on the Investor Relations section of our website. At this time, I would like to turn the call over to Jeremy.
Speaker 2
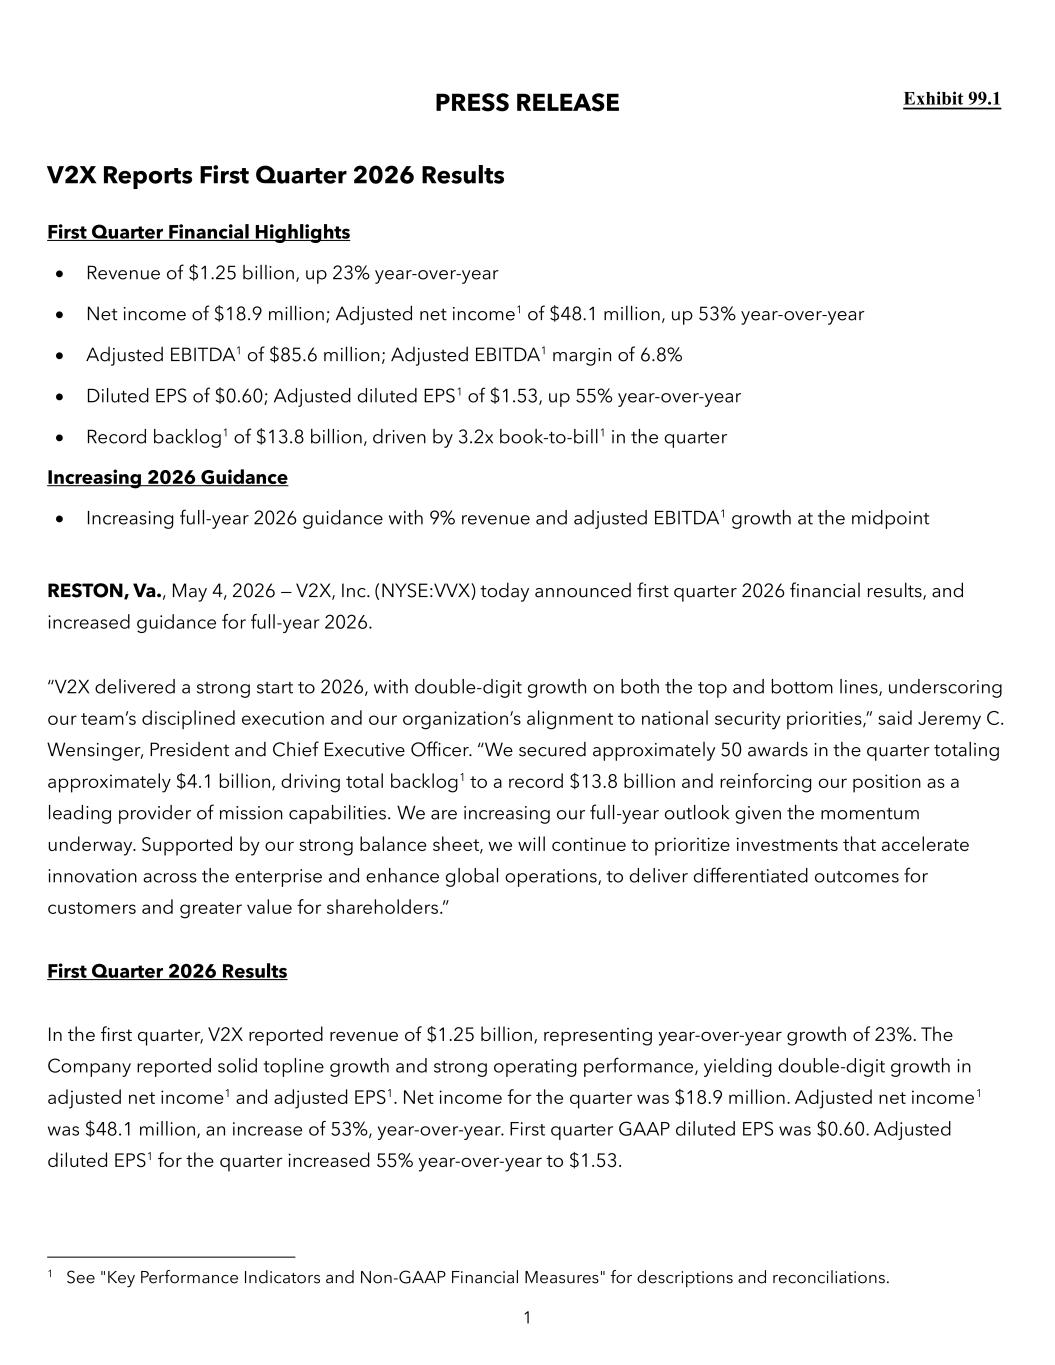
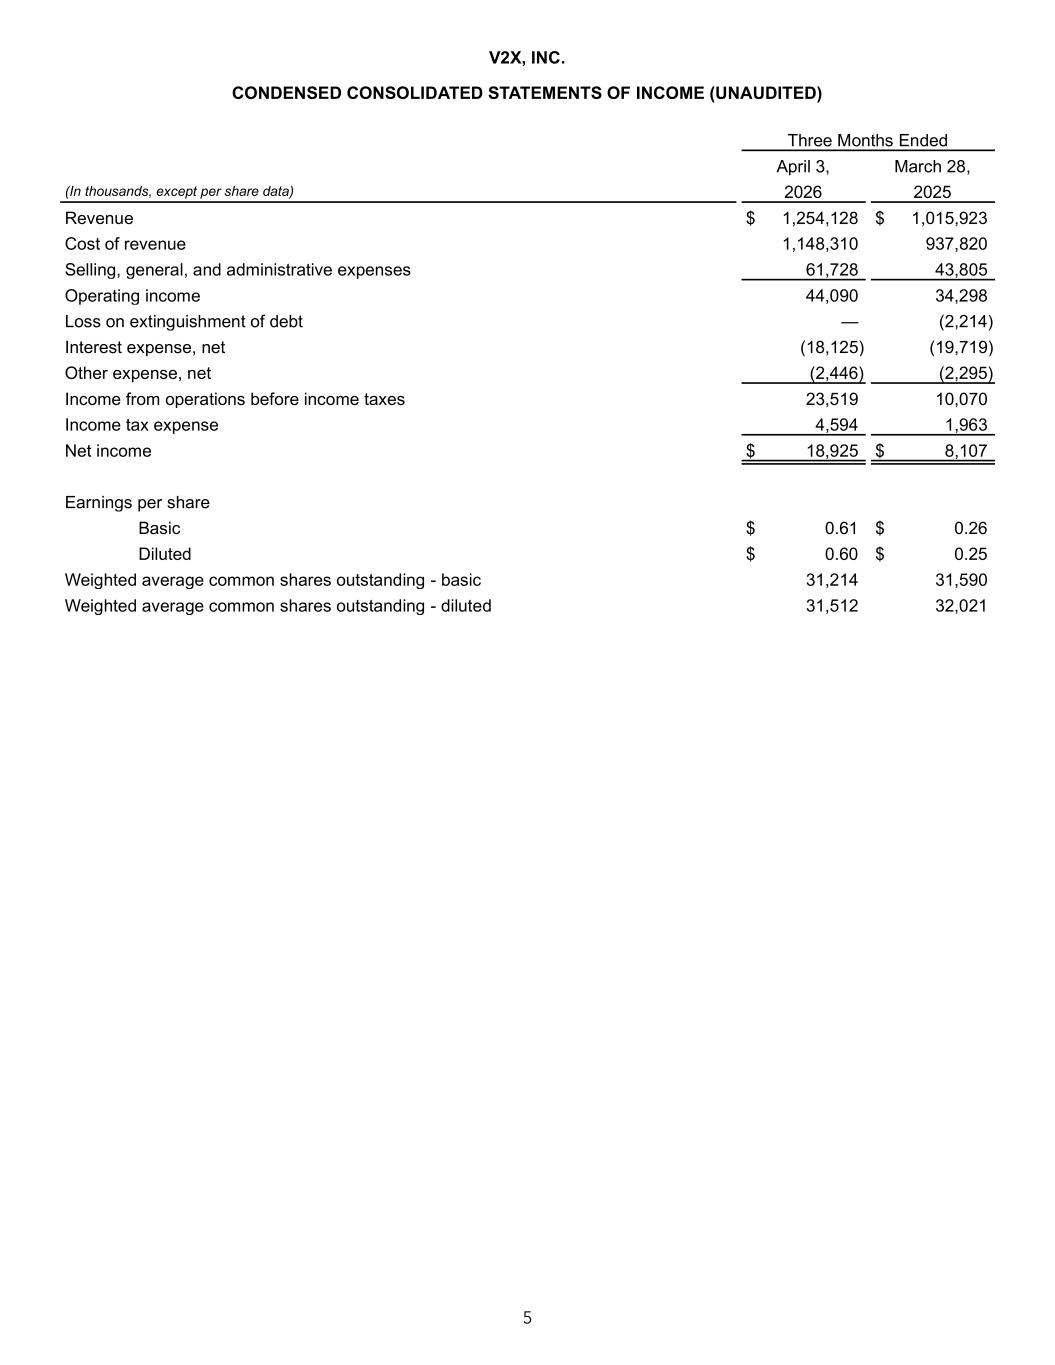
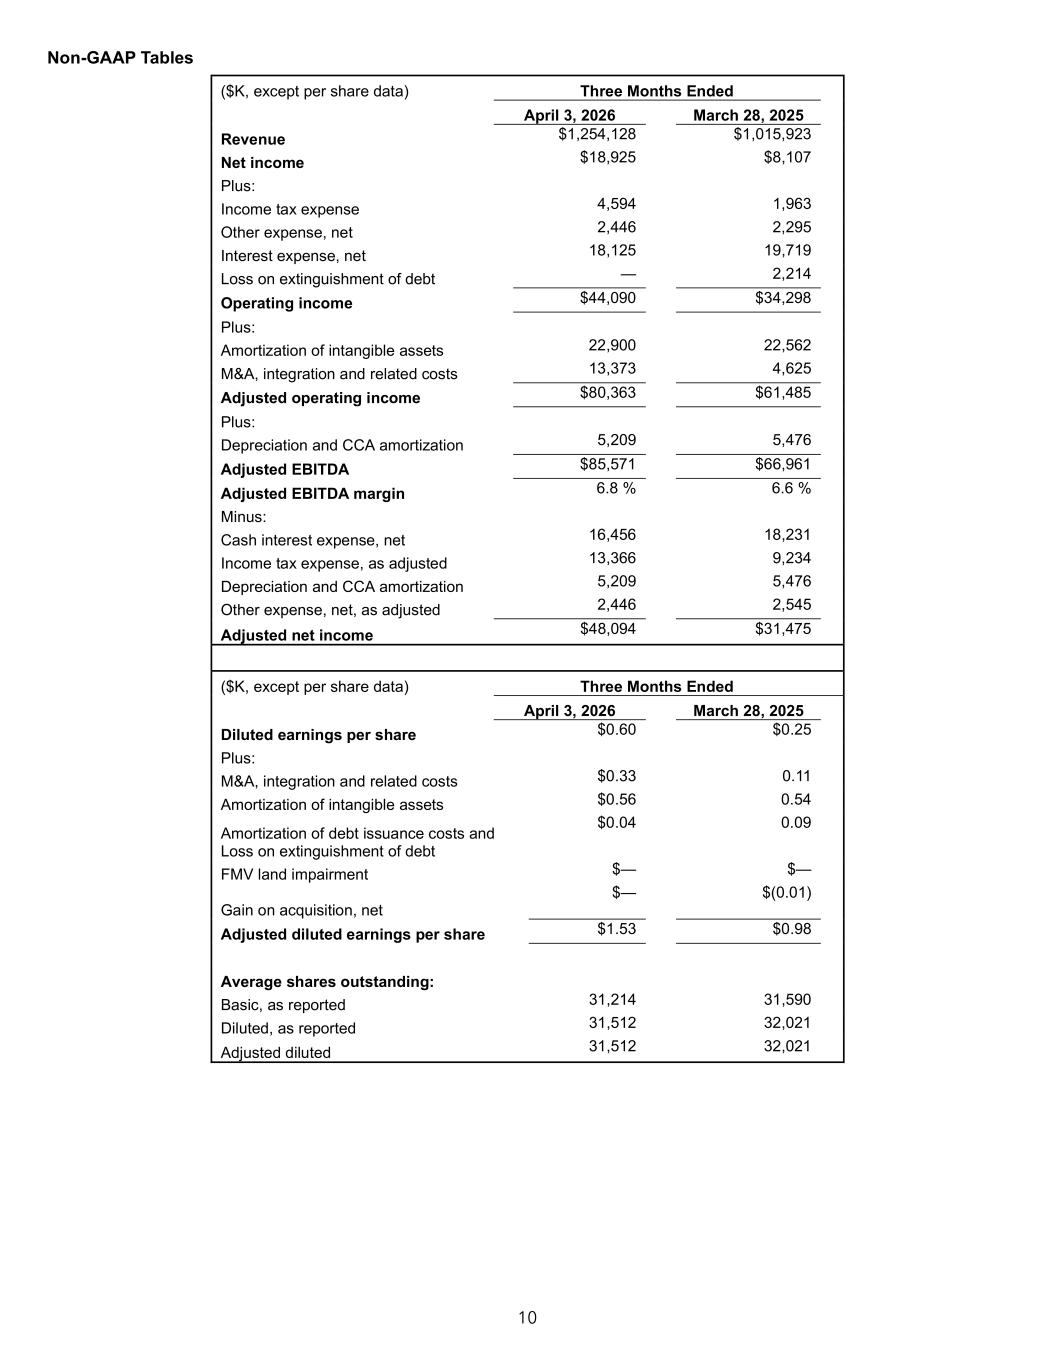
Thank you, Mike, and good afternoon, everyone. We appreciate you all joining us today. Please turn to slide three. Today, we will be providing a recap of our first quarter 2026 results and sharing more on our outlook for the year. First, I want to acknowledge the talent of our team at V2X, Inc. for their continued hard work and dedication to our company and our customers' mission success. With double-digit growth in revenue and earnings, we demonstrated how consistent strategic execution paired with close alignment with national security priorities results in enhanced financial performance. The strength of our awards is further proof of the momentum underway and the continued demand for the capabilities we provide. With robust bookings of $4.1 billion in the quarter across all business areas, we achieved a record backlog of $13.8 billion. We continue to make progress on our Go Towards Tomorrow strategy, innovating across the enterprise. This strengthens our global operations and delivers differentiated outcomes for customers operating in increasingly complex environments. As we advance this innovation-forward strategy, we do so with the benefit of a healthy balance sheet and the flexibility to invest for growth. Looking forward, we are confident in our position in the market and are increasing our guidance for 2026. We now expect revenue and adjusted EBITDA to increase 9% year over year at the midpoint, and adjusted diluted EPS to increase approximately 14% at the midpoint. This is a testament to our ability to deliver enhanced value for both customers and shareholders in the year ahead. With that, let us move to slide four, which summarizes the quarter's financial and operational highlights. In the first quarter, we achieved robust top-line growth and delivered strong operational results across the organization. Revenue increased 23% year over year to $1.25 billion, marking a record year-over-year organic growth rate for V2X, Inc. Adjusted net income for the quarter was $48.1 million, representing an increase of 53% year over year. Adjusted EBITDA was $85.6 million, with margins of 6.8%. Adjusted diluted EPS was $1.53, representing a significant increase of 55% compared to the same period last year. We believe our financial performance underscores our position as a leading provider of mission capabilities. I also want to recognize some of the key contract wins and highlights we delivered in the first quarter. We secured approximately 50 contract awards representing approximately $4.1 billion in total awards, spread across all business areas. We were awarded work to modernize critical components of the F-18, as well as integrate advanced infrared countermeasures for the KC-130J. These programs showcase our role in supporting long-term platform readiness. In global training, we captured multiple awards supporting customers across North America and Europe, reflecting both the reach of our training footprint and the demand for our capabilities. In aerospace, we achieved full operational execution for T-6, which highlights our ability to transition large national priority programs. Additionally, we supported the Artemis II mission, providing training, simulation, and recovery operations—another example of how technical expertise supports complex, high-visibility national initiatives. In mission readiness, we continue to support essential logistical requirements for national security customers across multiple geographic locations. These awards demonstrate the breadth and diversity of our opportunities and our ability to execute across capabilities to support our customers' most critical missions. Moving to slide five, our recent contract success is yielding record backlog, strengthening the foundation from which we are executing. We delivered bookings in the quarter of approximately $4.1 billion, reflecting the strength of our portfolio and the demand for our diversified solutions. This drove a quarterly book-to-bill ratio of 3.2x and a trailing twelve months book-to-bill ratio of 1.5x. As a result of increased awards, total backlog for the quarter was $13.8 billion, up from $11.1 billion at the end of the fourth quarter, providing strong visibility into future revenue. With a healthy pipeline, we remain on track to achieve a 30% year-over-year increase in bid velocity in 2026. Overall, the expansion in backlog, robust pipeline, and opportunities underscore the demand for our capabilities and reinforce our confidence in the long-term growth outlook for the business. Turning now to slide six, last quarter we introduced our efforts to invest in advanced capabilities and pursue best-in-class partnerships to drive innovation across the enterprise. In the first quarter, we made solid progress executing this strategy. In the last six months, we have introduced three artificial intelligence platforms operating on our enterprise IT infrastructure, and we are seeing a promising pace of adoption across our employee base. We are also seeing significant expansion in AI-enabled productivity, which is enhancing operational efficiency in our support functions across the organization and will drive lower costs over time. At the customer level, the targeted investments we are making in innovation are creating new offerings that expand how we execute customer missions and enhance our customer value proposition. One example is aviation operations. With our early prototype AI-enabled aerospace sustainment platform, we are building this platform with Google, Tactile, and NVIDIA products. Our goal is to capture unstructured data and turn it into predictive insights and automated decision support. We expect this to improve aircraft availability, reduce delays, and streamline sustainment operations. I look forward to keeping you updated as we continue to invest in innovation to meet customers' evolving and complex requirements. With that, I will turn the call over to Shawn for a more detailed review of the financials.
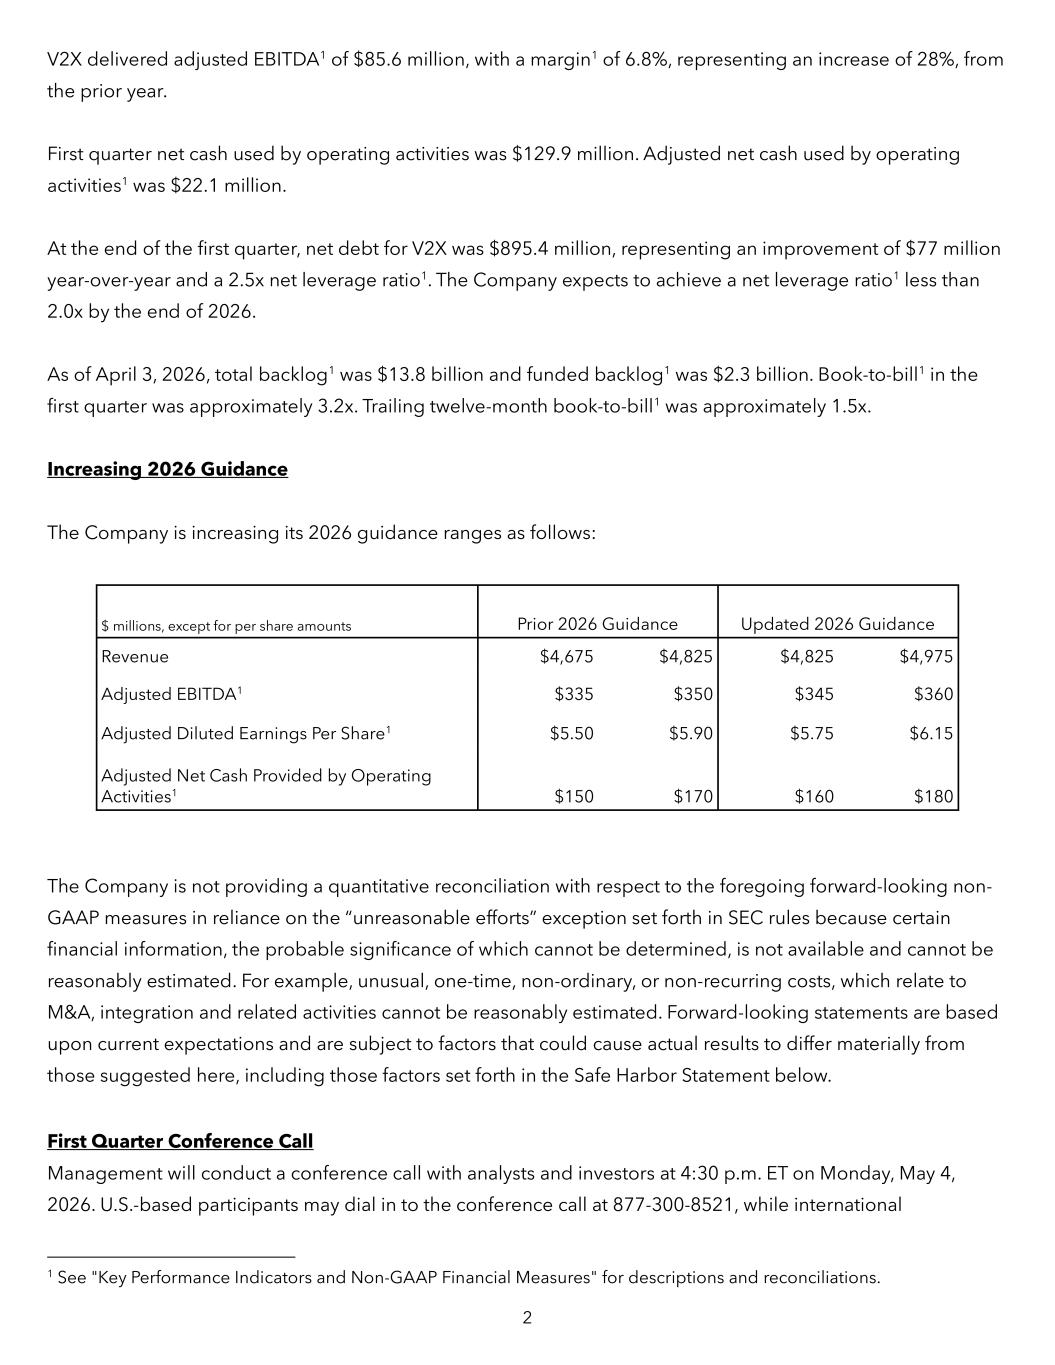
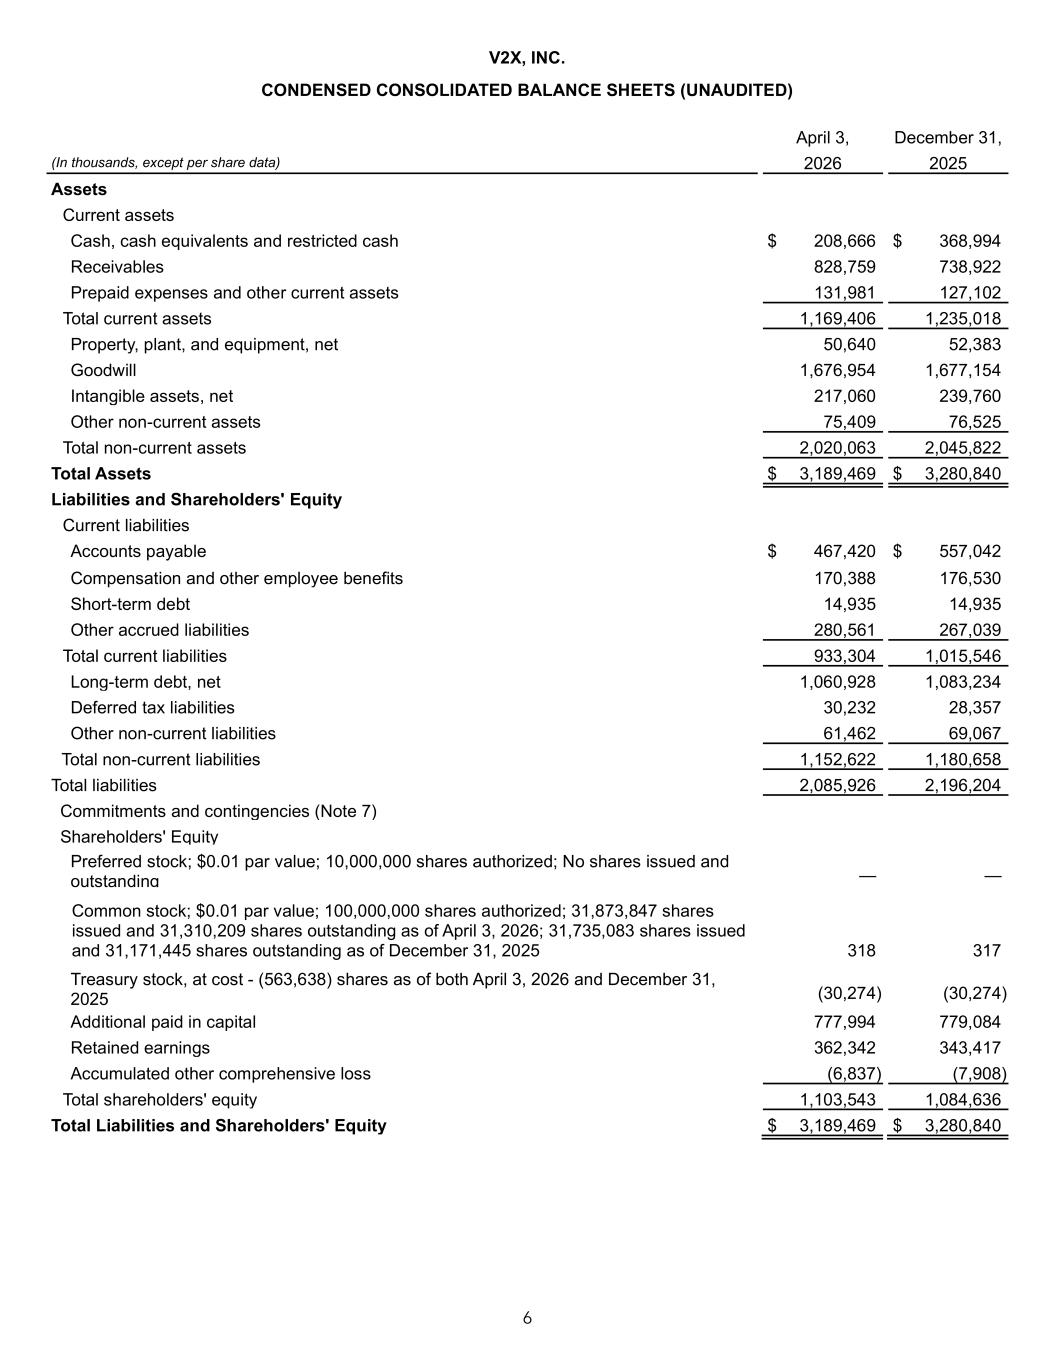
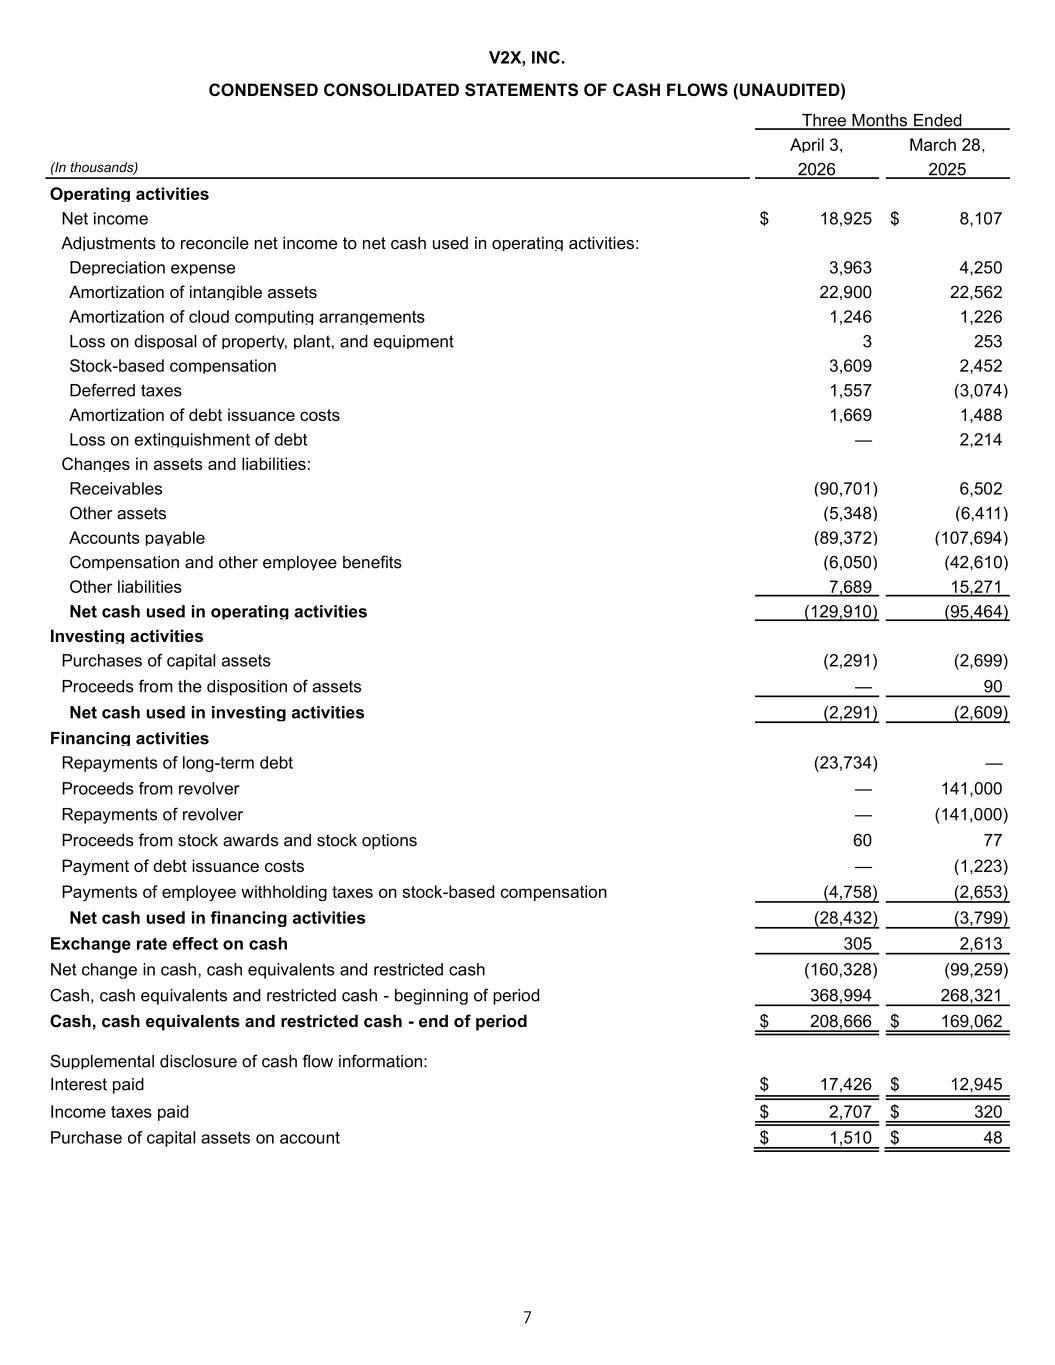
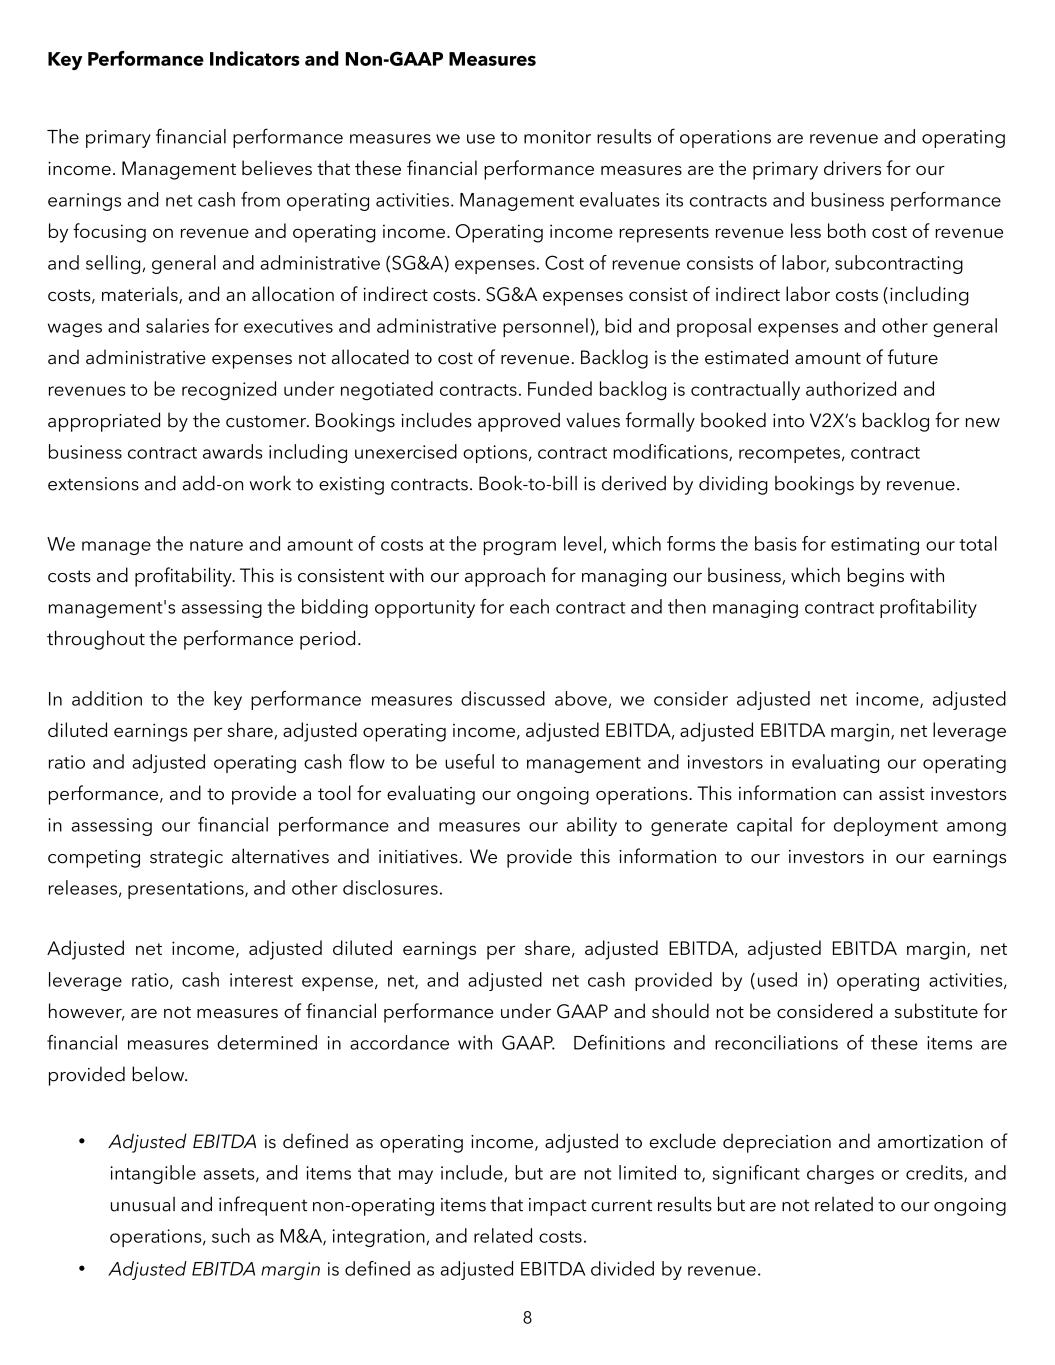
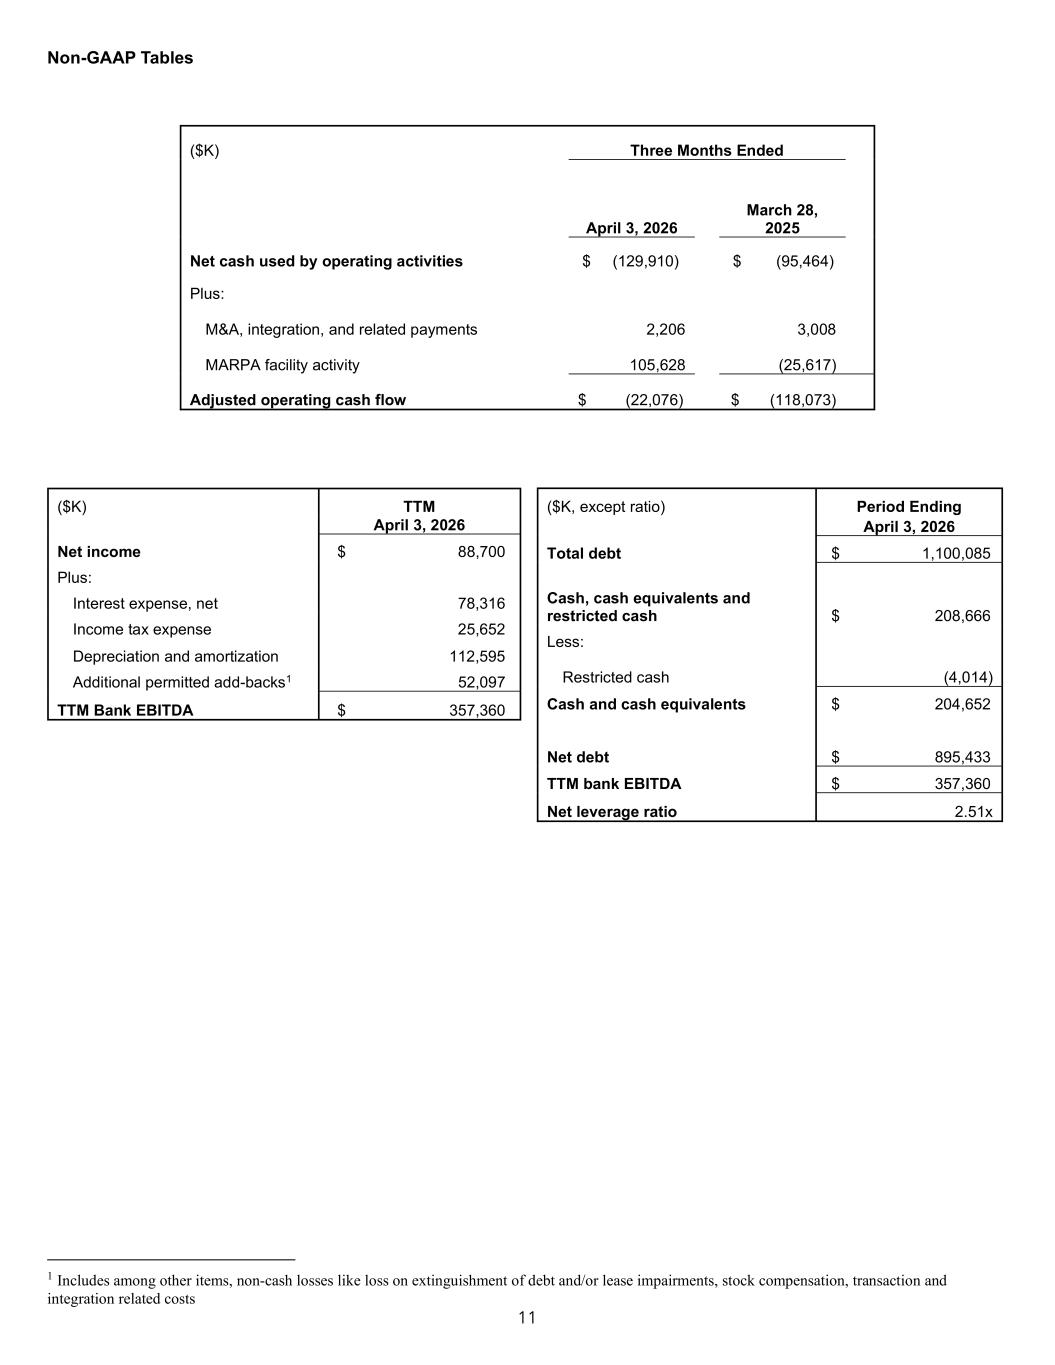
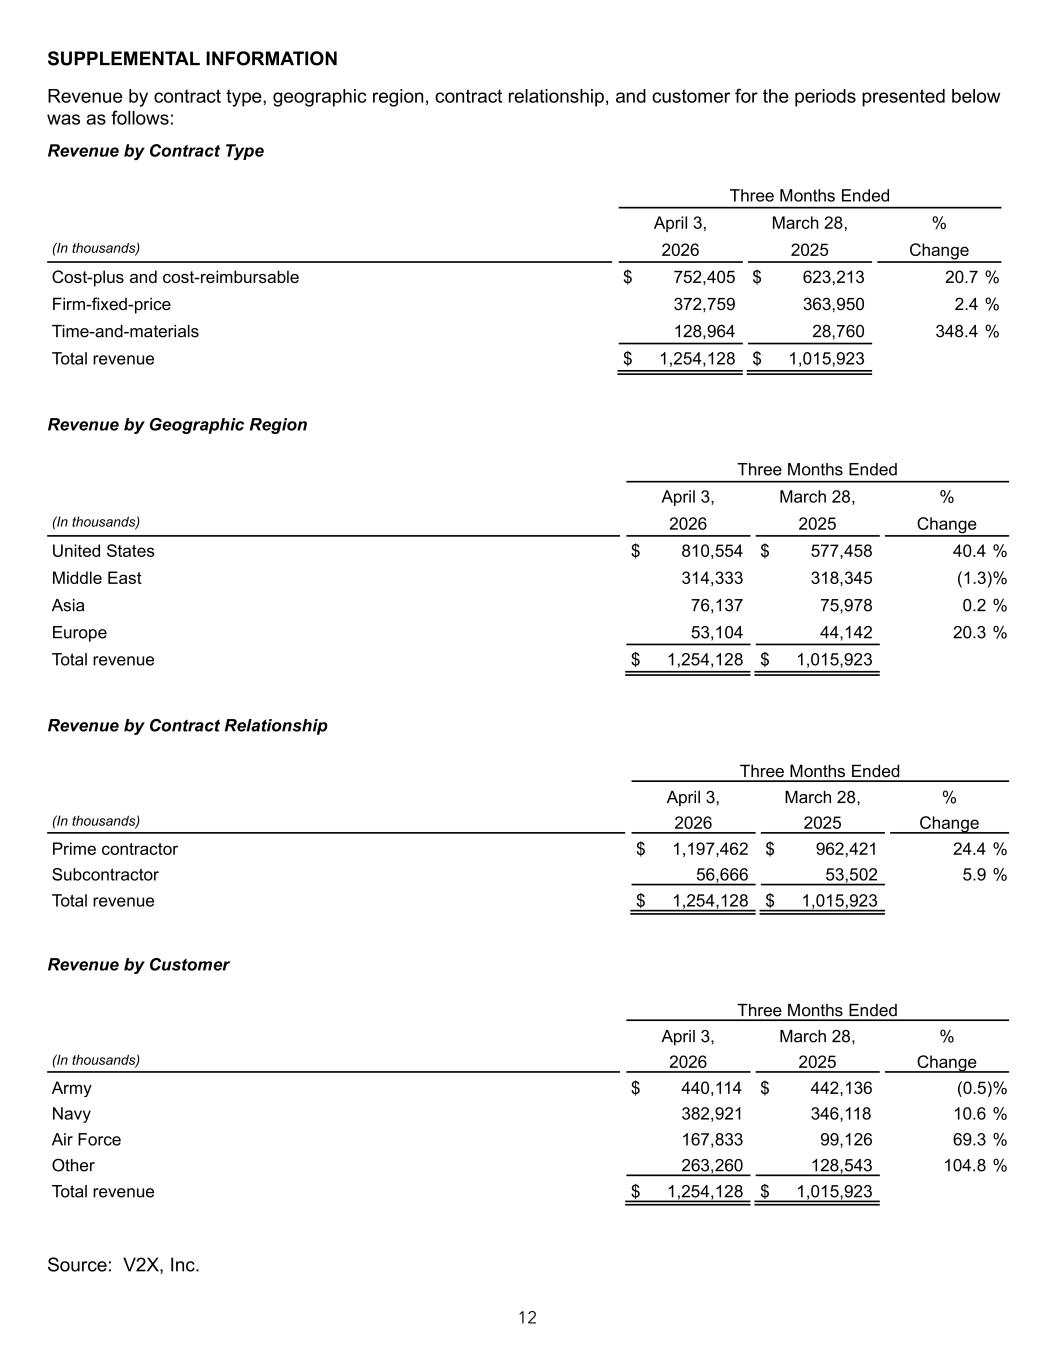
Thank you, Jeremy. Good afternoon, everyone. Please turn to slide seven. As you heard, we reported strong first quarter financial performance across all major metrics. Revenue in the first quarter increased 23% to $1.254 billion. As Jeremy mentioned, this was a record organic growth rate for the company, driven primarily by the ramp-up of training, foreign military sales, rapid prototyping, and engineering programs, as well as some discrete activities to support a national security customer. This growth also reflects continued diversification of capabilities across our business, which is visible in our customer mix, with approximately 21% of revenue in the first quarter coming from customers outside of the U.S. Army, Navy, and Air Force. This percentage is up from approximately 13% in the prior year period, reflecting expansion with national security customers. Adjusted EBITDA in the quarter was $85.6 million, increasing 28% from the same period in the prior year. Adjusted EBITDA margin was 6.8%, improving approximately 20 basis points year over year. The increase was driven by volume and mix changes. Interest expense in the first quarter was $18.1 million. Cash interest expense was $16.5 million. Net income for the quarter was $18.9 million. Adjusted net income was $48.1 million, up 53% year over year. First quarter diluted EPS was $0.60 based on 31.5 million weighted average shares. Adjusted diluted EPS in the quarter increased approximately 55% year over year to $1.53. Adjusted operating cash flow improved significantly year over year and was a $22.1 million use in the quarter, reflecting solid cash collections and our focus on enhancing quarterly cadence. Based on our progress to date, we expect our cash flow performance in 2026 to track more favorably relative to our historical profile. Please turn to slide eight. From a liquidity perspective, we are operating from a position of strength, with approximately $200 million of cash on the balance sheet and a $500 million revolver that had a zero balance at the end of the quarter. Additionally, we expect another year of solid operating cash flow generation, which we anticipate will drive our net leverage ratio to less than 2x by the end of 2026. Our ongoing progress is providing substantial flexibility and optionality to deploy capital for value creation. We have established clear criteria as we actively evaluate deploying capital to invest for growth, whether organically or through M&A. This includes investments that accelerate our innovation strategy, expand our capabilities, provide access to incremental growth, and enhance our overall margin profile. We will continue to be disciplined, focusing on growth opportunities that drive enhanced value for our customers and shareholders. Please turn to slide nine. Overall, our strategy is yielding positive results as demonstrated by our strong financial performance this quarter. We believe the combination of our global reach, proximity to mission and national security priorities, and diverse capabilities positions us well for the future. Given our momentum in the first quarter and current trends, we are increasing our guidance ranges for 2026. Revenue is now expected to be between $4.825 billion and $4.975 billion. Adjusted EBITDA is expected to be between $345 million and $360 million. Adjusted diluted earnings per share are expected to be between $5.75 and $6.15. Adjusted net cash from operations is expected to be between $160 million and $180 million. Overall, we are pleased with our performance across the business this quarter, as our team continues to bring the best of V2X, Inc. to meet our customers' critical mission requirements. Looking ahead, we believe this sets us up well for the rest of 2026. With that, I would like to turn the call back to Jeremy for some closing remarks.
Speaker 2
Thanks, Shawn. As summarized on slide ten, our fiscal year 2026 is off to a really strong start. We continue to accelerate our position as a leading mission capability provider. Before we begin the Q&A, I would like to recognize our more than 16 thousand employees around the globe for their unwavering commitment to our company, each other, and the customers we serve. They come to work day in and day out focused on the success of our customers, and it does not go unnoticed. It is because of them that we are prepared for today and to take on the missions of tomorrow. We will now open the call for questions.
Operator
We will now begin the question and answer session. If you are using a speakerphone, please pick up your handset before pressing the keys. To withdraw your question, please press star then 2. At this time, we will pause momentarily to assemble our roster. Our first question today is from Andre Madrid with BTIG. Please go ahead.
Speaker 4
Jeremy, Shawn, Mike, thanks for taking my question. Looking across the scope of your business, the recent announcement of troops out of Germany—5 thousand troops there—and I saw something in the queue about potential work scope change in Kuwait. What are the puts and takes that we should be looking out for across the regions right now?
Speaker 2
It is a really good question. In Europe, the missions we support are not necessarily at risk because of the programs we operate. When I look at Europe, I look at COBRA DANE, Ascension Island, and Thule, Greenland. We are well positioned with the missions we support. Regarding Kuwait, that is going to be TBD, but I do not see us changing our posture in the Middle East—at least that is not what we are hearing. I see us in a very good position in the Middle East. When I look at the macro side, it looks like we are well positioned because of the contracts we have, the work we do, and the support we provide. Overall, we are in a really good position both in Europe and in the Middle East to support our customer long term.
Andre, I will amplify because you mentioned we had a disclosure subsequent to the quarter relative to our Kuwait task order. On Kuwait, we have about $500 million in backlog. Our guide assumes that we continue at the levels that we performed at in the first quarter. We are continuing to see demand signals. We are working with our customer consistently on what that looks like, but we expect to be in the region and executing. Our guide and everything we are hearing assumes that we will be continuing to support our customers' missions.
Speaker 4
That is really helpful. Is the guide increase all on the back of the new work, or is that a mix of some programs that had previously been awarded and are just accelerating ahead of expectations?
Speaker 2
It is a little bit of both. We are getting T-6 stood up, and that will contribute, and we had some announcements around jobs in the Middle East that will accelerate as well. I am proud of the team's ability to capture wins and support our customer. The back half of the year will accelerate based on those contract wins.
Speaker 4
If I could double click on T-6, is the $140 million to $160 million range still appropriate, or should we be closer to $160 million now given the raised guide?
Speaker 2
Think a little bit higher than $160 million. The team did a wonderful job transitioning that in the first quarter, and we are assuming a slightly higher ops tempo as we work through everything. We said there would be an inherent lag to get to a full run rate. That is going. The team went IOC in Q1. We are closer to the $175 million to $180 million type of number for the year on that program. I could not be prouder of the team.
Speaker 4
That is great to hear. I appreciate all the context.
Operator
The next question is from Analyst with Noble Capital. Please go ahead.
Speaker 5
Good afternoon. Congrats on the quarter. From the Middle East to INDOPACOM—Asia revenues were pretty flat year over year. What are you expecting there for the rest of the year? Are you seeing any interest, maybe exercises—normally they are odd year—but a little more color on what is going on in the INDOPACOM region?
Speaker 2
With the budget we are seeing, the work our team has done in INDOPACOM to help our customer understand where they might want help is paying off. Presence is everything. The fact that we have presence, understand the mission requirements, and are working shoulder to shoulder with the customer to align with their priorities is paying off. I am excited about the INDOPACOM region. Our team being there means everything.
Speaker 5
On the back half, you said it should accelerate. Last quarter you said this year should be more of a 50/50 first half versus second half. Are you changing that, or was that something different?
You are exactly right. We are going to be about 50/50 first half/second half from a revenue standpoint. You saw some of that play out with the strength in Q1. We are standing by what we said previously—same type of profile this year—which, as you point out, is a little different than what we have seen historically.
Speaker 5
SG&A expenses were a little higher than expected. Is there anything unusual in there?
We had some nonrecurring costs related to potential growth opportunities that the business undertook in the first quarter. That is why you saw a spike in SG&A.
Operator
The next question is from Peter J. Arment with Baird. Please go ahead.
Speaker 6
Good afternoon, Jeremy, Shawn, Mike. Nice results. When we see an operational tempo increase by the U.S. military, how quickly does that impact your operations? Is there much of a historical lag effect?
Speaker 2
It is a good question. Our mission support team does a really good job reacting and responding in near real time. There is a bit of a lag, but not as much as you might think. For example, supporting the Air Force in Israel was days, not weeks or months. In INDOPACOM, the ability to get assets on the ground and deliver capability was weeks. We are very responsive and scrappy, capable of responding quickly to requirements.
Speaker 6
A quick one for Shawn: time and materials as the contract mix was up quite a bit this quarter—is this a one-off, or will we see more of this going forward?
In the prepared remarks, I mentioned a discrete national security customer we are supporting. That activity set is time and materials. That is what drove the change.
Speaker 6
Will it repeat?
Yes. As part of the increase in our guide, this activity set will continue throughout the year. Of the $150 million raise at the midpoint, about $70 million to $80 million is associated with this activity. Important to note, some of it was contemplated in our prior guide, and there has been an extension and continuation. What we have reflected in the guide is what we are under contract to perform.
Speaker 2
Being on the right contract vehicles and having proximity is everything. You are seeing execution of the strategy we put in place.
Operator
The next question is from Tobey O'Brien Sommer with Truist. Please go ahead.
Speaker 7
From a broad perspective, what is the duration of your book-to-bill in terms of number of years?
Typically, our backlog converts over five to seven years. In the quarter, we booked a large award in T-6 that will run for ten years, which is longer than average, but generally it is five to seven years.
Speaker 7
The uptick in the quarter—how would you describe the sources of the remaining portion beyond the national security customer?
Bridging from the prior midpoint: there is between $40 million and $50 million for additional support in the Middle East, about $80 million associated with the national security activities, and T-6 contributes another $20 million to $25 million. Those three activities bridge you to the midpoint of the new guide.
Speaker 7
How big were the professional fees in Q1, and do those continue into Q2?
About $12 million in the first quarter. There will be a little bit in Q2.
Speaker 7
Are those growth opportunities still out there?
We continue to evaluate both organic and inorganic investments. We are focused on growth and delivering returns and value for shareholders. We will update everyone as things progress.
Speaker 7
The “other” customer category was up 105% year over year. Is that primarily driven by the national security customer?
It is mostly that national security customer.
Operator
The next question is from Analyst with RBC Capital. Please go ahead.
Speaker 5
Really nice growth in the quarter. Can you discuss how much of an award the T-6 contributed to bookings, and what the book-to-bill would have been without that award?
T-6 contributed $3.3 billion in the quarter.
Speaker 5
In terms of revenue visibility for the full year, you previously talked about 85% for 2026. With the strong bookings, is there upside?
Revenue under contract we have visibility into is about 94% for 2026, reflecting the notable uptick from where we began the year.
Speaker 2
Bookings in a quarter are interesting, but TTM is where you earn your calories. Given the episodic nature of awards, we look to sustain a 1.4x to 1.5x TTM book-to-bill for the year, which is outstanding.
Speaker 5
On margins, with many contract startups, how should we think about long-term margin opportunity as we get out to, say, 2027?
It is early in 2026. We will talk more in the back half of the year. Many contracts are in early startup stages; margins tend to mature over time, particularly in our aero and modernization sustainment businesses. We feel very good about being positioned to deliver margin expansion in the future.
Operator
The next question is from Trevor Walsh with Citizens. Please go ahead.
Speaker 8
Jeremy, you talked about AI opportunities with an aviation operations use case and great partnerships. Do you have line of sight on specific opportunities with customers for these AI-related efforts, and can they be duplicated? How does the pipeline look?
Speaker 2
We partner with some of the best in the industry, and those partners are core to bids we have on the street and to what we are doing internally. Adoption of AI tools internally is delivering outstanding efficiencies. I was in Orlando for almost two months bidding a job, and the team put our relationships with Google, Amazon, and NVIDIA into that bid to create a differentiated solution for our customer. The customer will benefit. These are enduring relationships, and this is not beta work. We are delivering capability, and I believe this will be the new norm for V2X, Inc.
Speaker 8
You called out COBRA DANE earlier. There was commentary from Space Force about including that into an RFI for modernization of ground-based radar. Does that create any risk, or will you be in that party regardless?
Speaker 2
We are part of the Golden Dome. Being on location and supporting the customer positions us to help the government modernize. I see it as an opportunity, not a risk.
Operator
The next question is from Analyst with Citi. Please go ahead.
Speaker 5
We recently got a request for a $1.5 trillion budget. What opportunities do you see from this, and what are you most excited for? Does this outlook change with a possible blue wave?
Speaker 2
I cannot comment on the political scenario. On the budget, we have looked at it carefully and are helping the customer understand where we can support modernization and mission needs. We are on the ground with them every day. If we modernize systems like COBRA DANE or COBRA KING, we have provided insights on where we can help. We are well positioned because modernization and sustainment are exactly what we do.
Speaker 5
Outlook on possible M&A activity, considering your clear line of sight on leverage?
Speaker 2
We are very disciplined in how we deploy capital, with a focus on shareholder value. We have optionality, and creating shareholder value is top of mind. We will be very disciplined going forward.
Operator
The next question is from Analyst with Morgan Stanley. Please go ahead.
Speaker 5
The administration put out an executive order on maximizing fixed-price contracts. Can you talk about the puts and takes for you? Do you see contracts being converted?
Speaker 2
We welcome the opportunity to do fixed-price work. This market should welcome it. We can create a lot of value for our customer and save them money. We have been discussing this with the government for several years. The executive order is a great fit for the sustainment and modernization market. We will see how it manifests.
Speaker 5
The U.S. business was up 40% year over year to over $800 million in revenue. How much of that was work on Operation Epic Fury?
I would be guessing on the Epic Fury slice. The strength you saw was U.S.-based and largely supporting our national security customer. Year over year, we also had ramp in F-16 avionics lifecycle (ALOT) work and in Warfighter Training Readiness Support, which contributed to the strength—pretty much consistent with what we expected when we started the year.
Operator
The next question is from Sebastian Rivera on for Stifel. Please go ahead.
Speaker 9
Congrats on the strong quarter. Can you flag some of your rapid prototyping capabilities you are most excited about, and how you envision your recent tech partnerships augmenting those capabilities on the ATSP-5?
Speaker 2
We take concept to delivery in a very short time frame. These are programs of need, not programs of record. Our engineers turn concepts into fielded systems quickly, delivering outcomes daily. We are a very scrappy company, and I am proud of what the team delivers. If you ever want to visit Indy, it is remarkable to watch.
Speaker 9
On the budget request, specifically around CUAS—early days, but can you speak to your outlook for Tempest over the next one to three years?
It would be speculation to quantify, but we think of this as a family of systems delivering unique capability, moving from concept to fielded systems very quickly. We have seen excellent growth in that part of the portfolio. We think these are franchise-type programs and capabilities we will deliver to multiple customers across theaters. We will take it one step at a time.
Operator
This concludes our question and answer session. I would like to turn the conference back over to Jeremy C. Wensinger for any closing remarks.
Speaker 2
Thank you so much for joining us. Great first quarter. We appreciate your interest in V2X, Inc. Thank you for the questions, and more importantly, thank you to all of our 16 thousand employees who care for each other every day. Operator, back to you.
Operator
The conference has now concluded. Thank you for attending today's presentation. You may now disconnect.