Operator
Greetings and welcome to NetStreetCorp first quarter 2026 earnings conference call. At this time, all participants are on a listen-only mode. A question and answer session will follow the formal presentation. If anyone should require operator assistance during the conference, please press star zero on your telephone keypad. As a reminder, this conference is being recorded. I would now like to turn the conference over to your host, Mr. Matt Miller. Thank you. You may begin.
Good morning, and thank you for joining us for NetStreet's first quarter 2026 earnings conference call. On today's call, management's remarks and responses to your questions may contain statements considered forward-looking under federal securities law. These statements address matters subject to risk and uncertainties that may cause actual results to differ from those discussed today. For more information on these factors, we encourage you to review our latest Form 10-K and other SEC filings. All forward-looking statements are made as of today's date, and NetStreet assumes no obligation to update them in the future. In addition, certain financial information presented on this call includes non-GAAP financial measures. Please refer to our earnings release and supplemental package for definitions, reconciliations to the most comparable GAAP measures, and an explanation of their usefulness to investors. These materials can be found in the Investor Relations section of the company's website at netstreet.com. Today's call is hosted by NetStreet's CEO, Mark Manheimer, and CFO, Dan Donlan. They will make some prepared remarks, followed by a Q&A session. With that, I'll turn the call over to Mark.
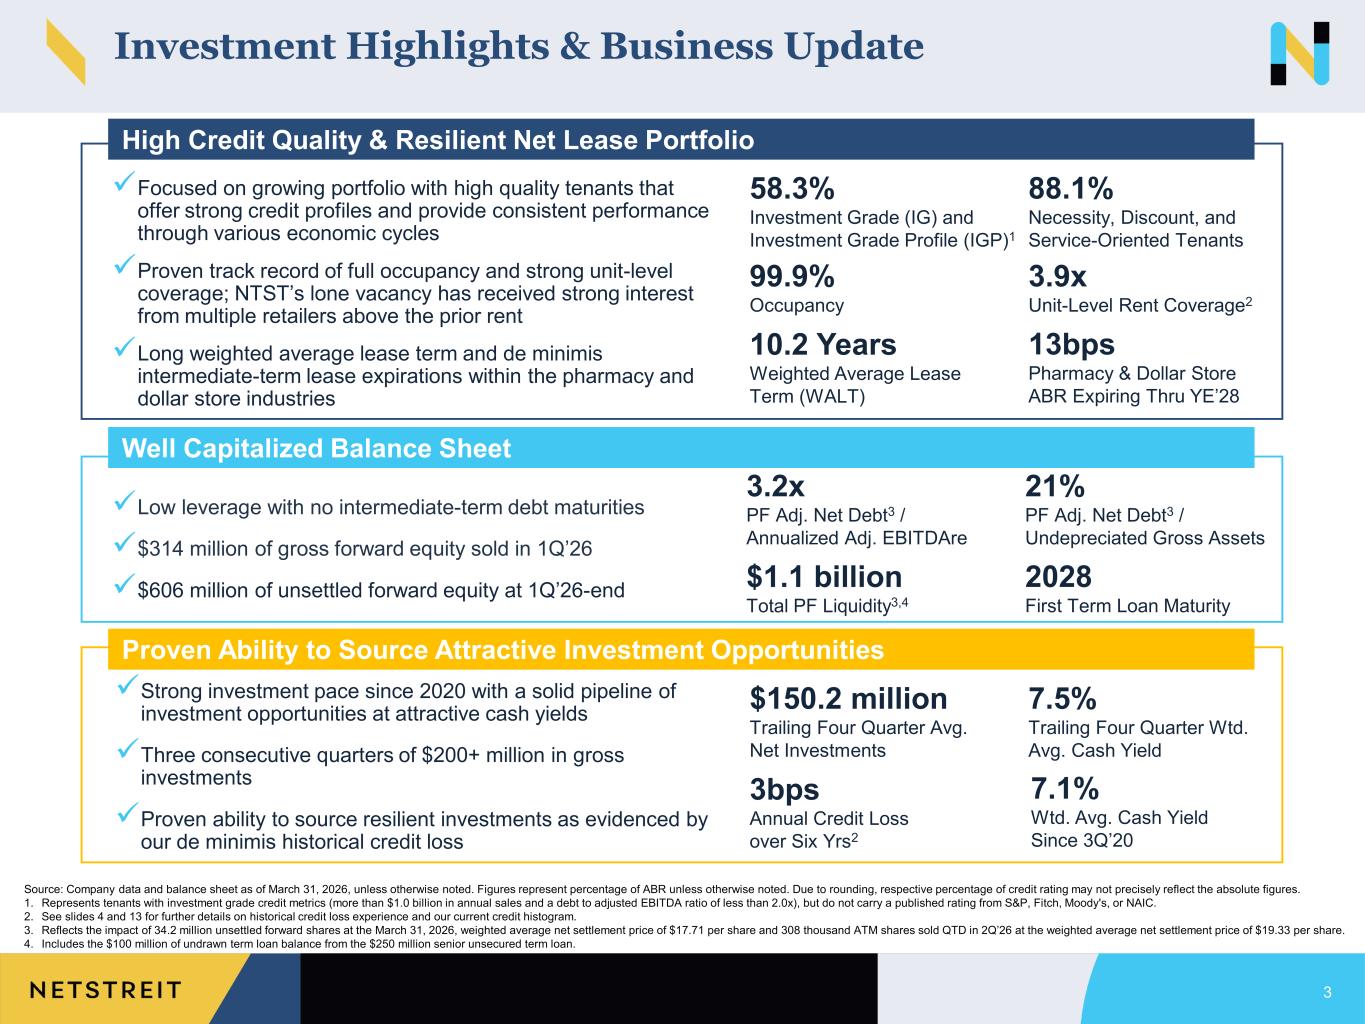
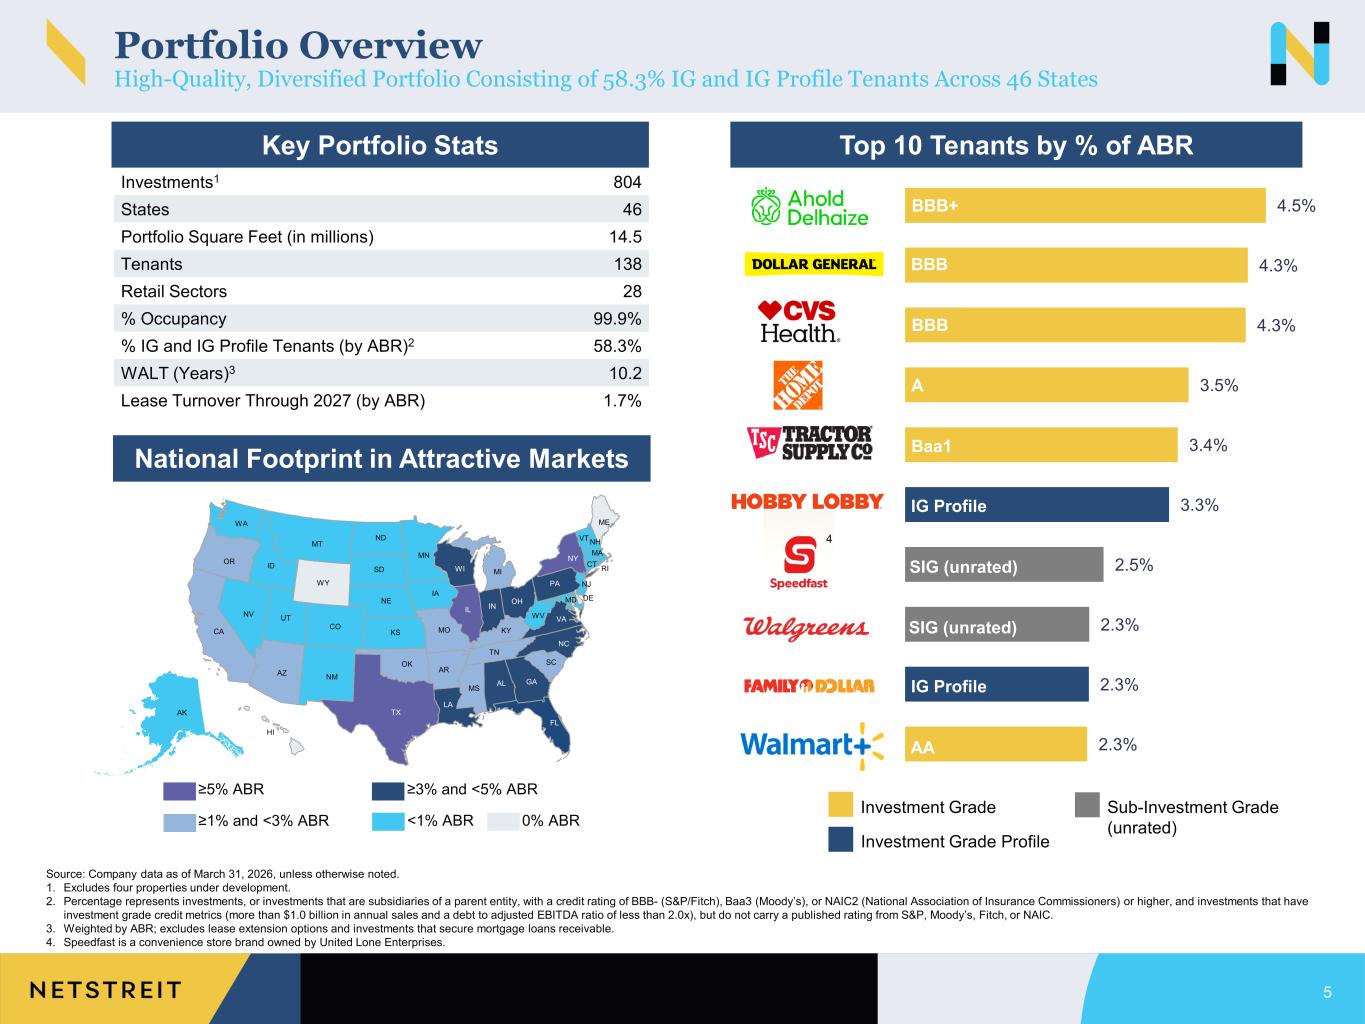
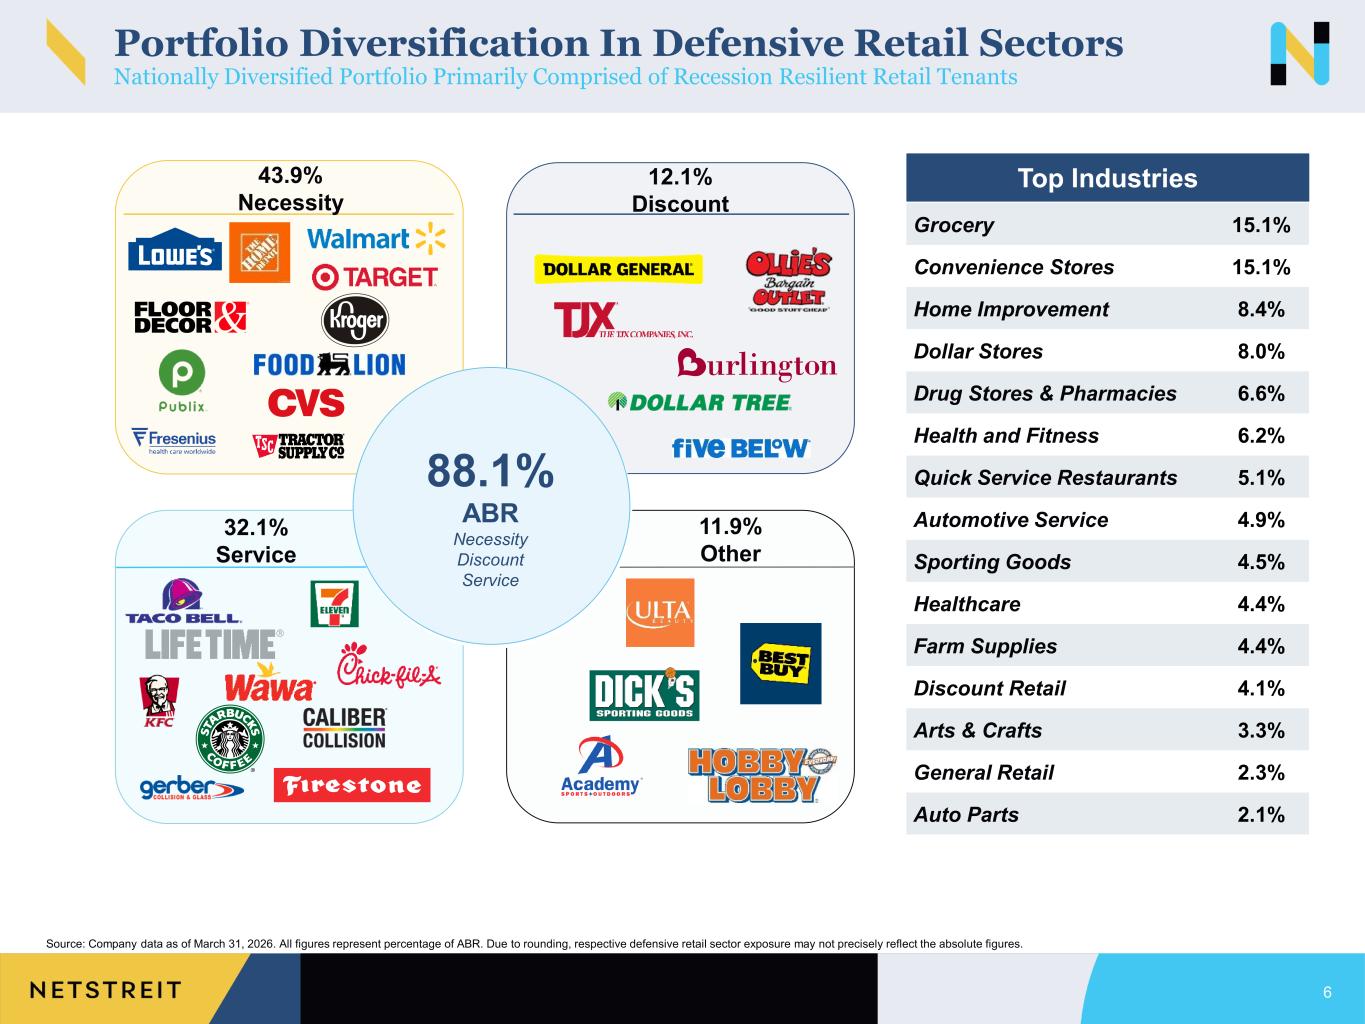
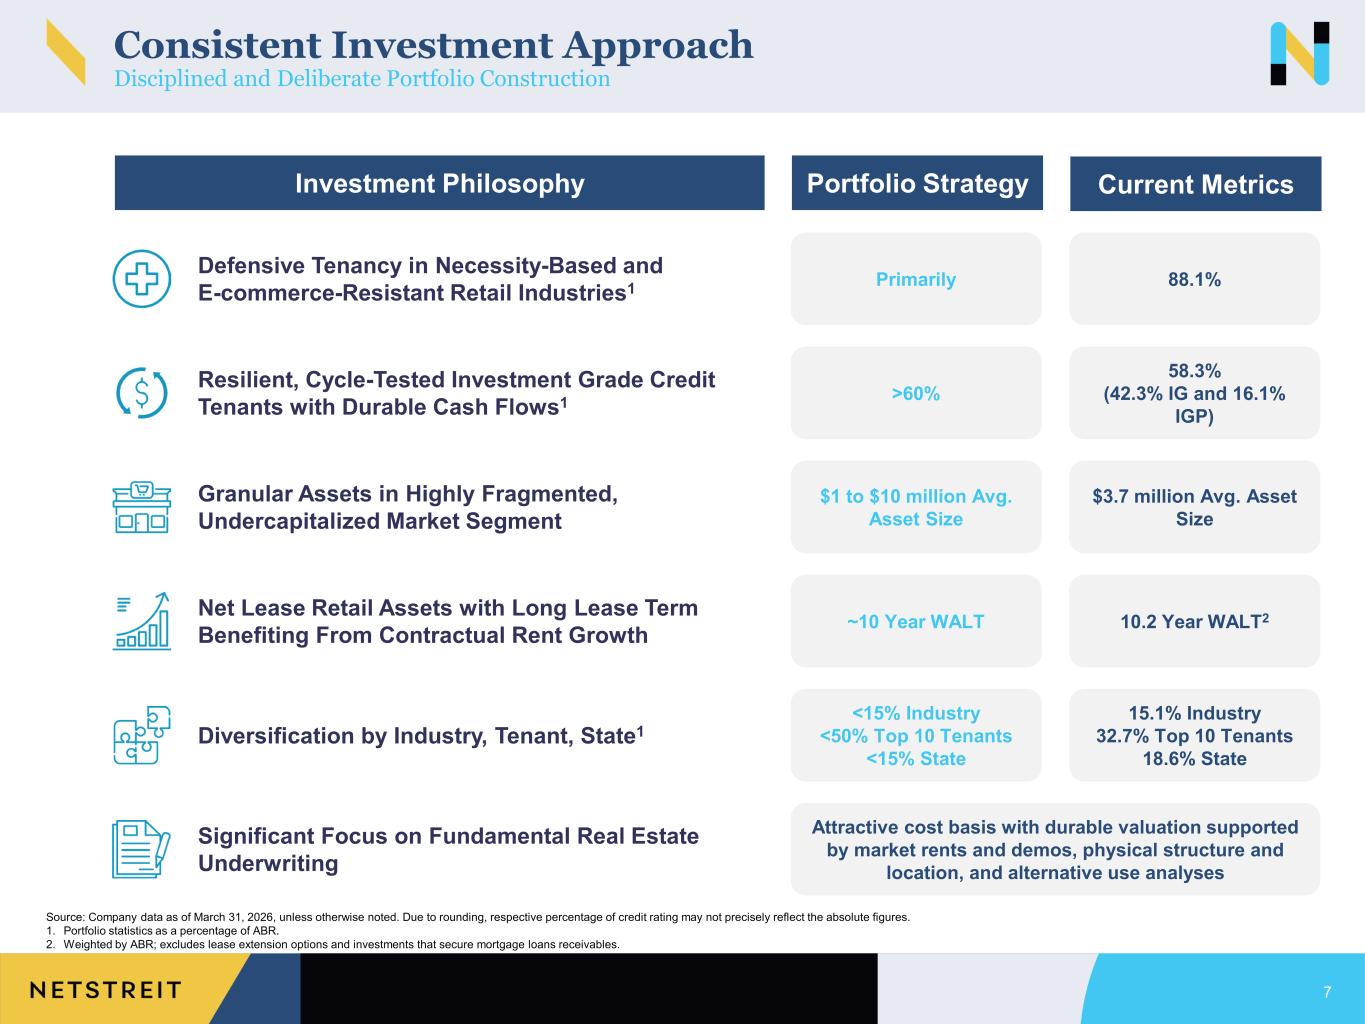
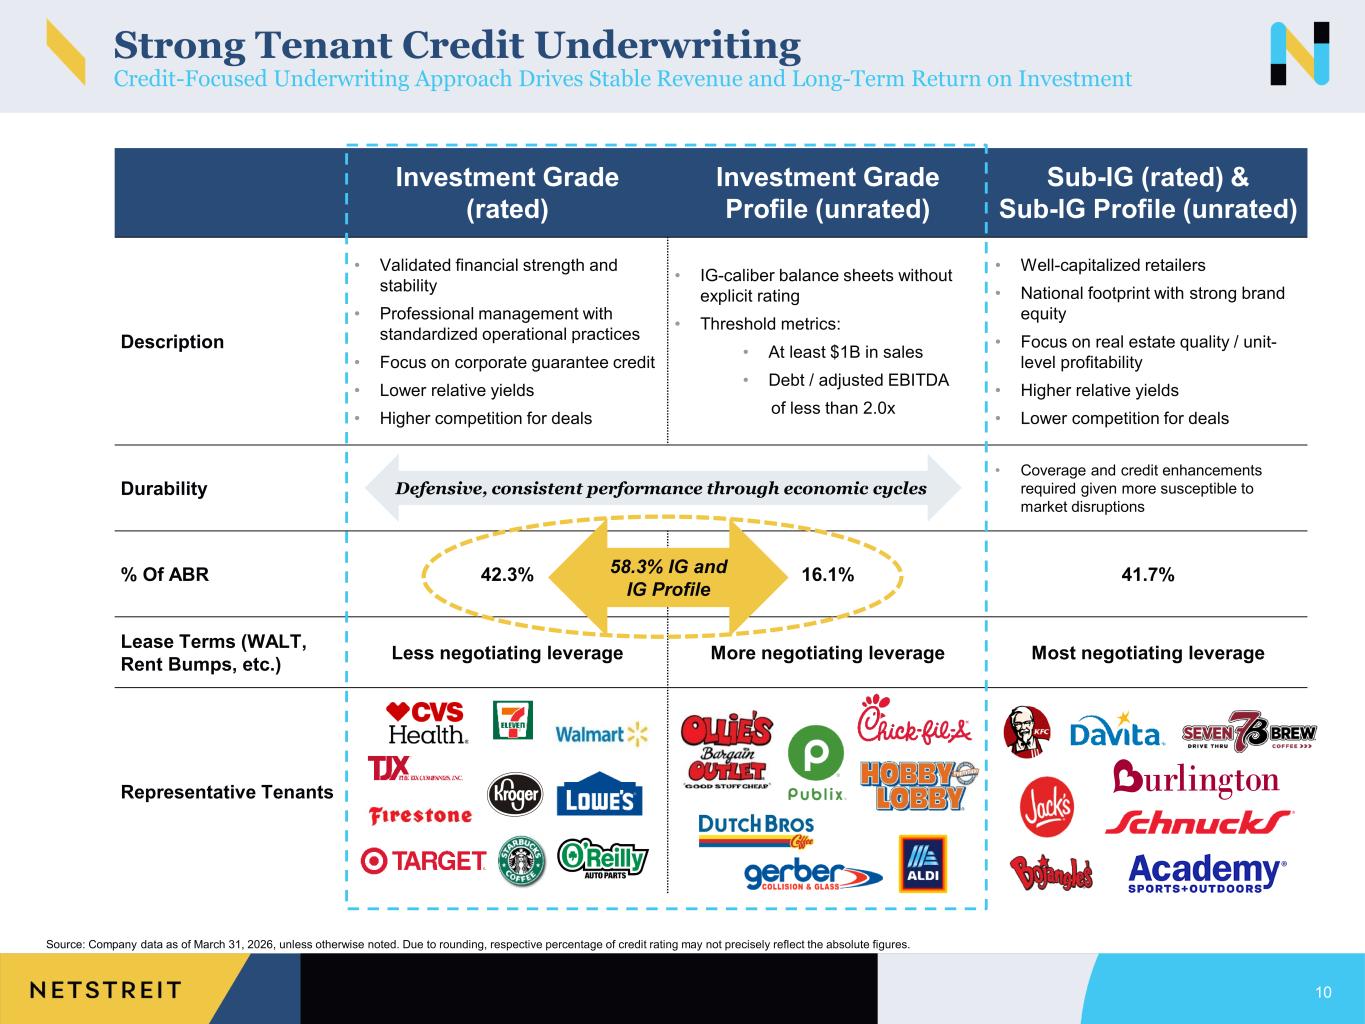
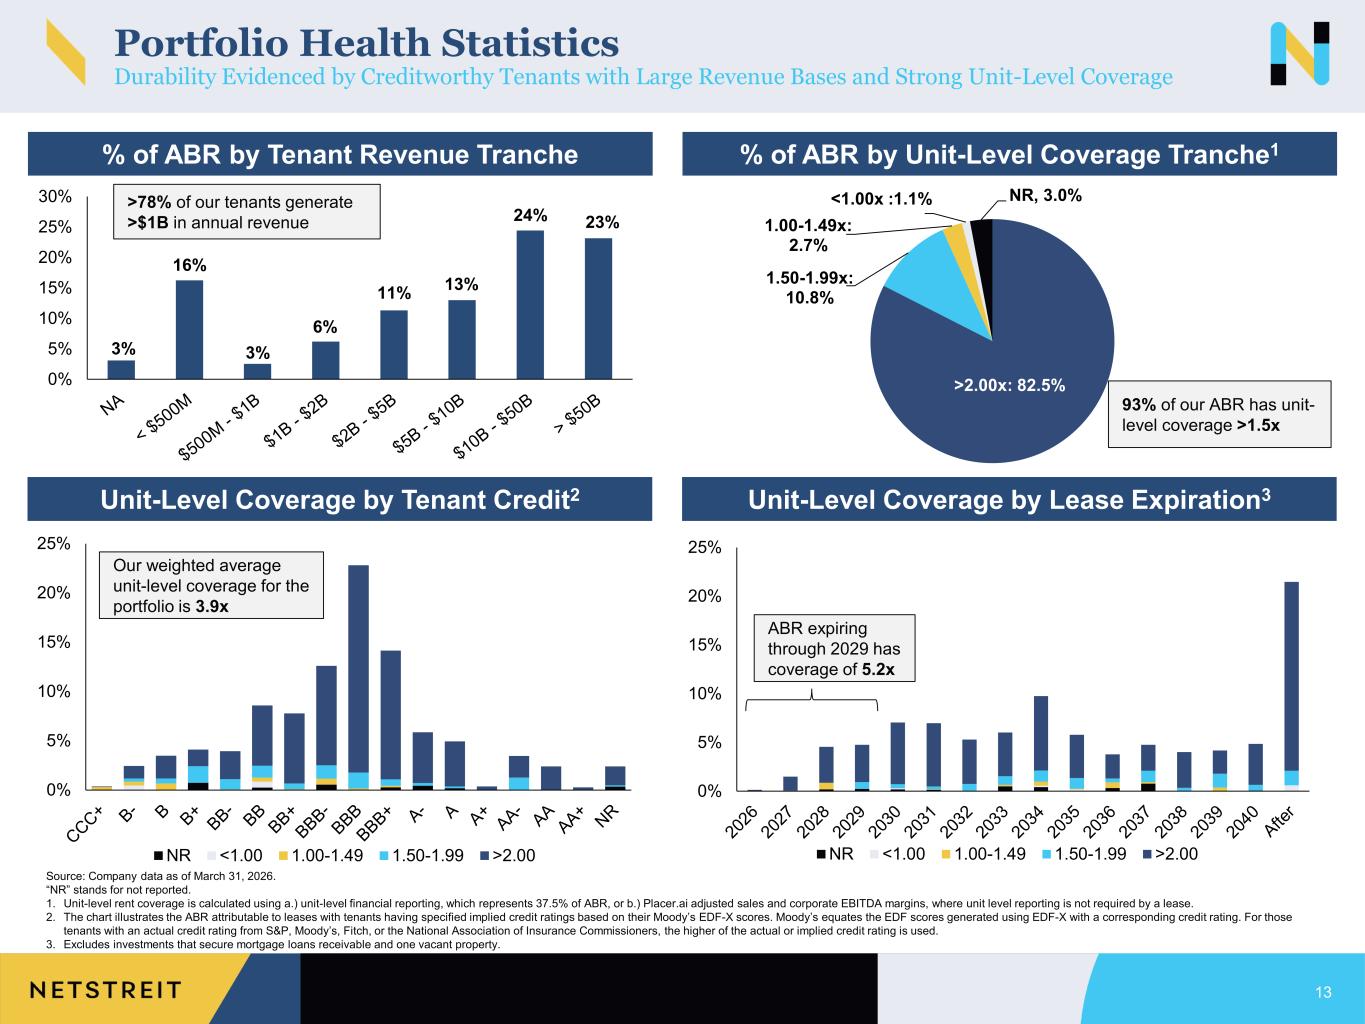
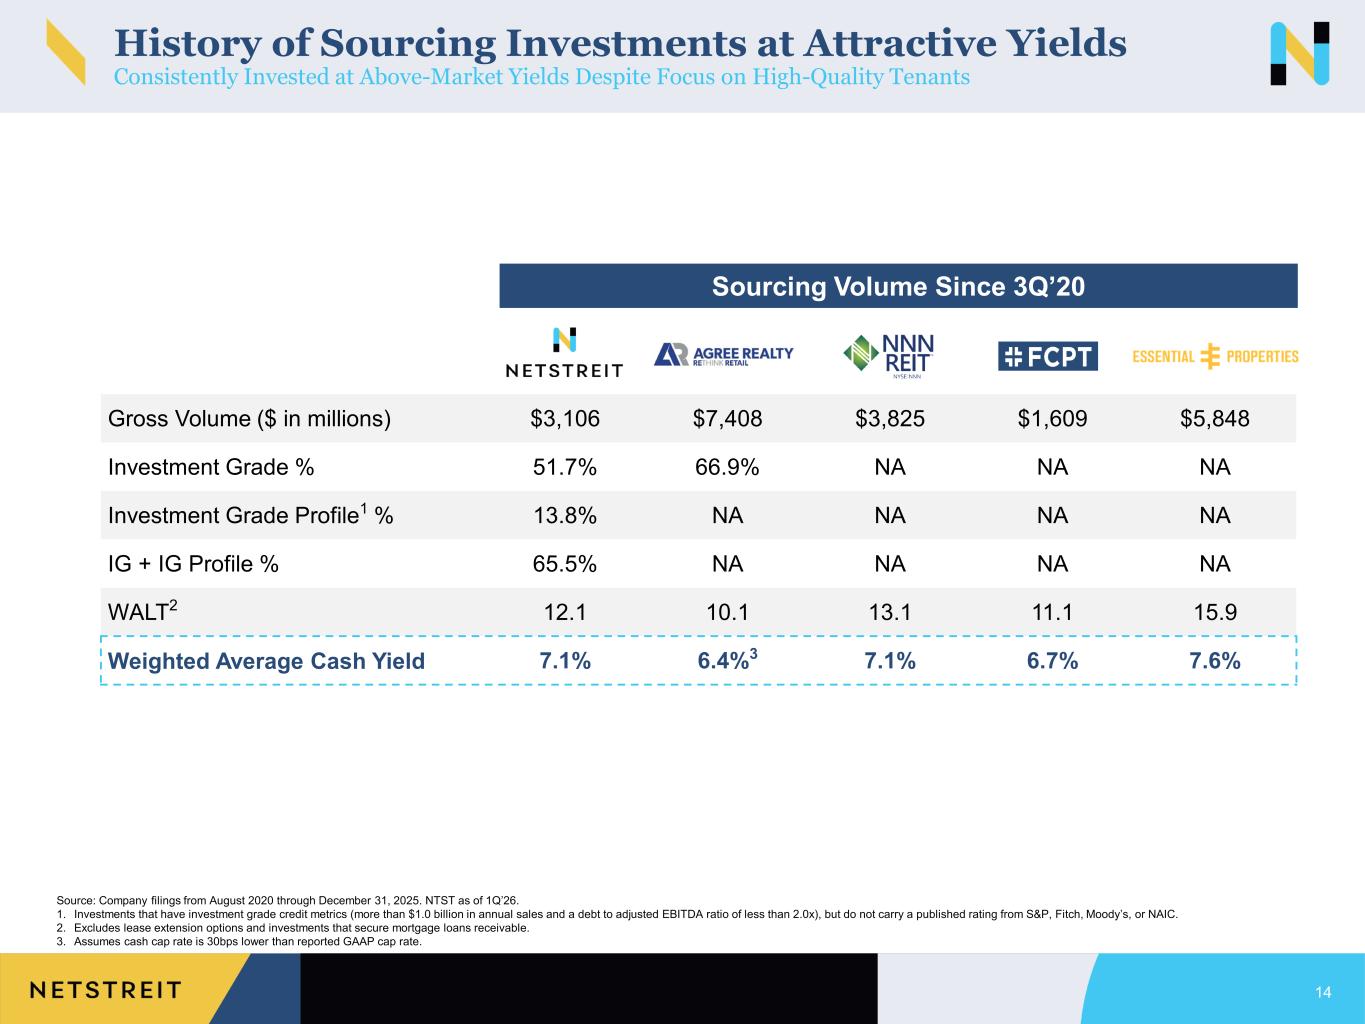
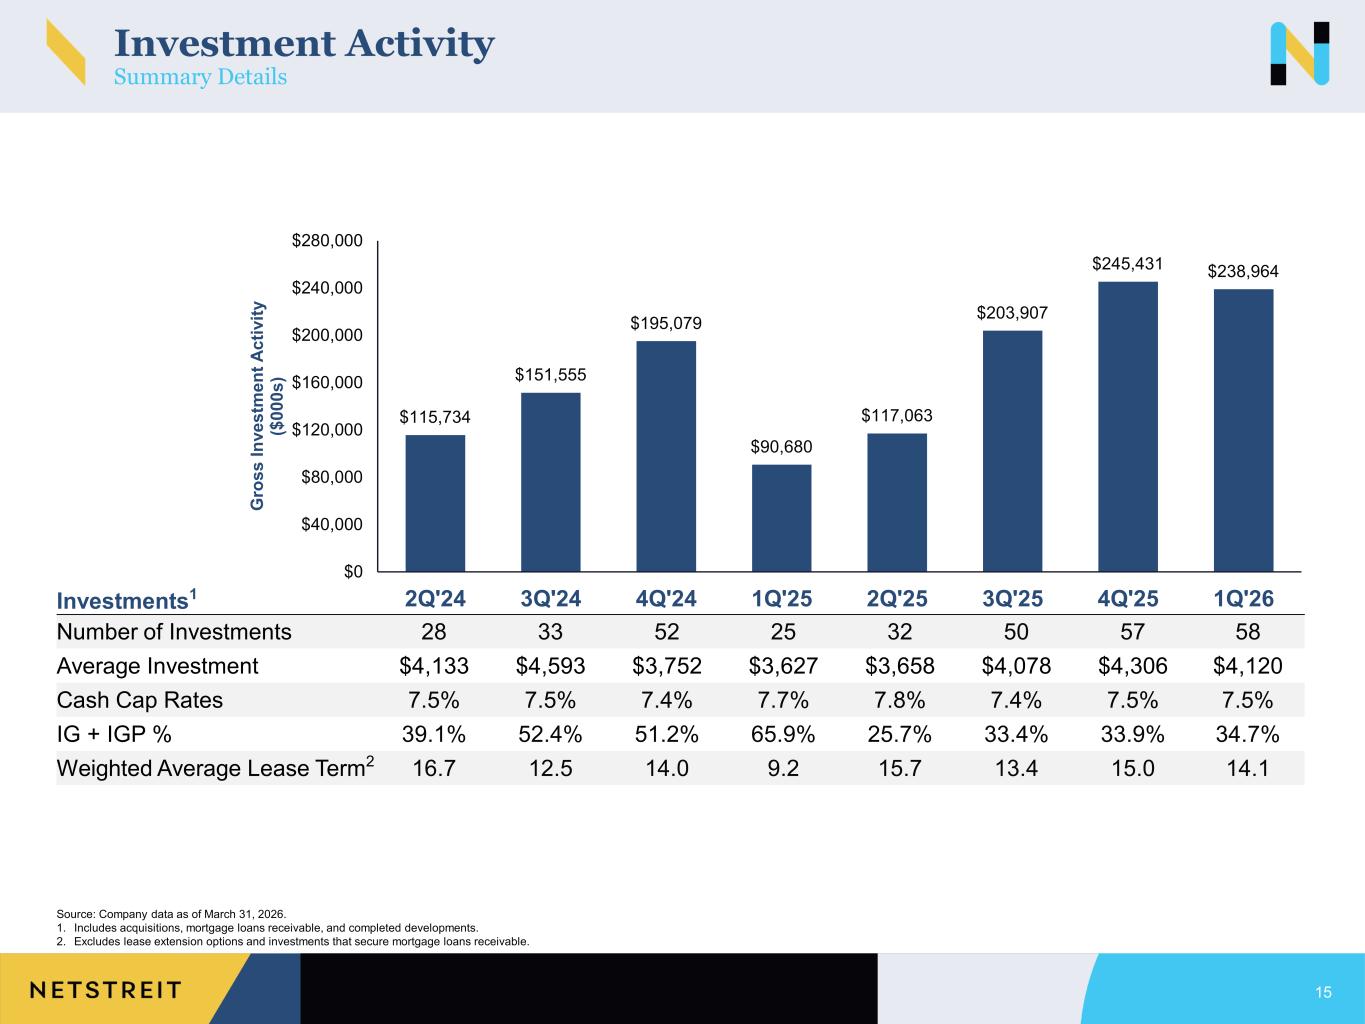
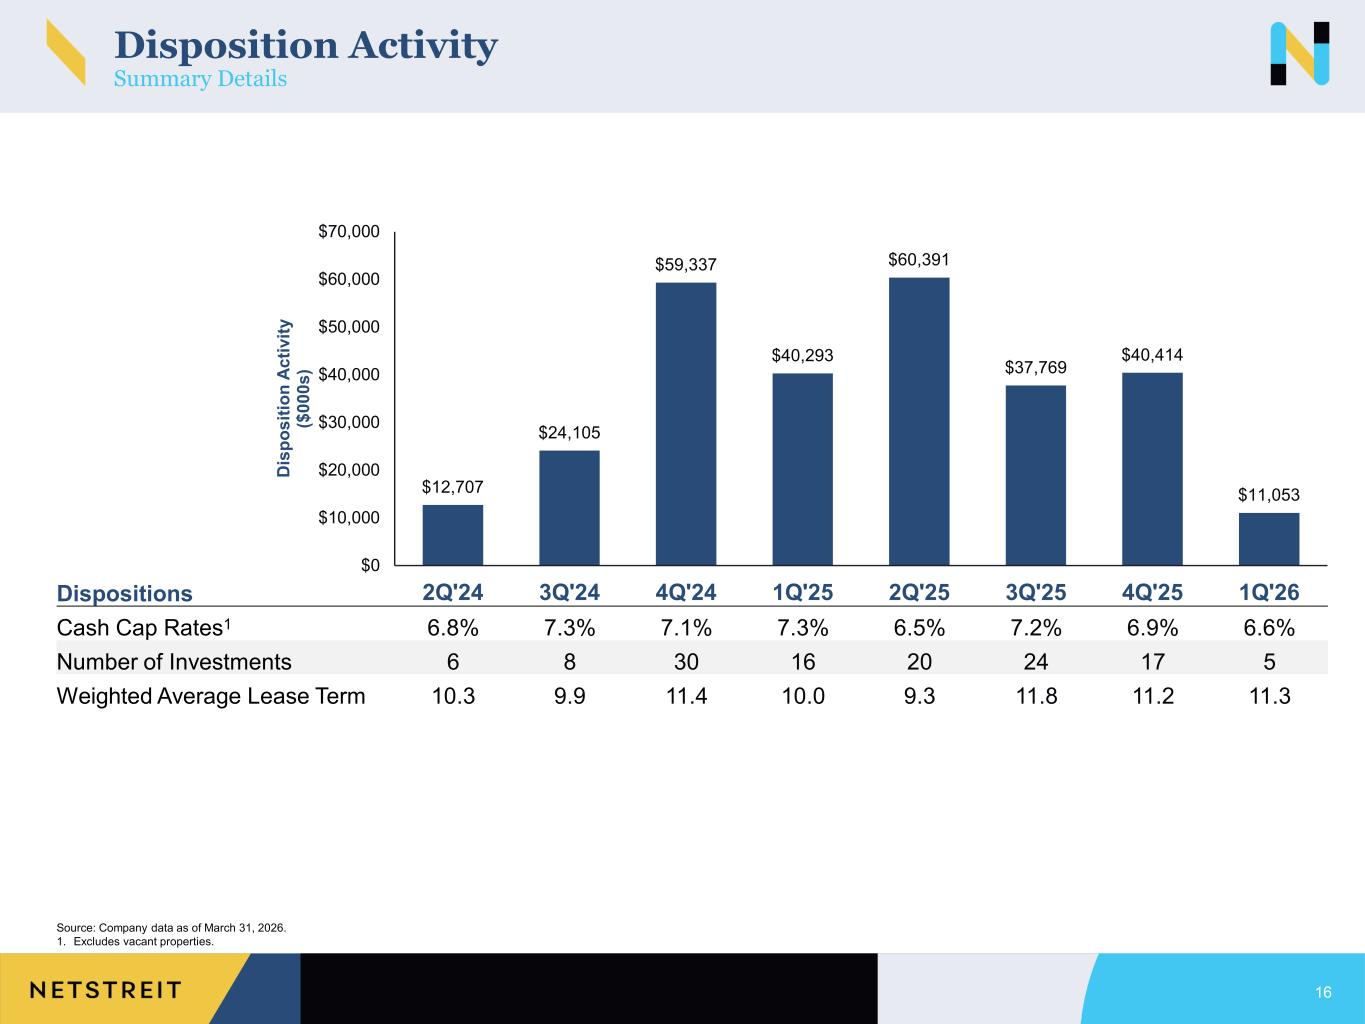
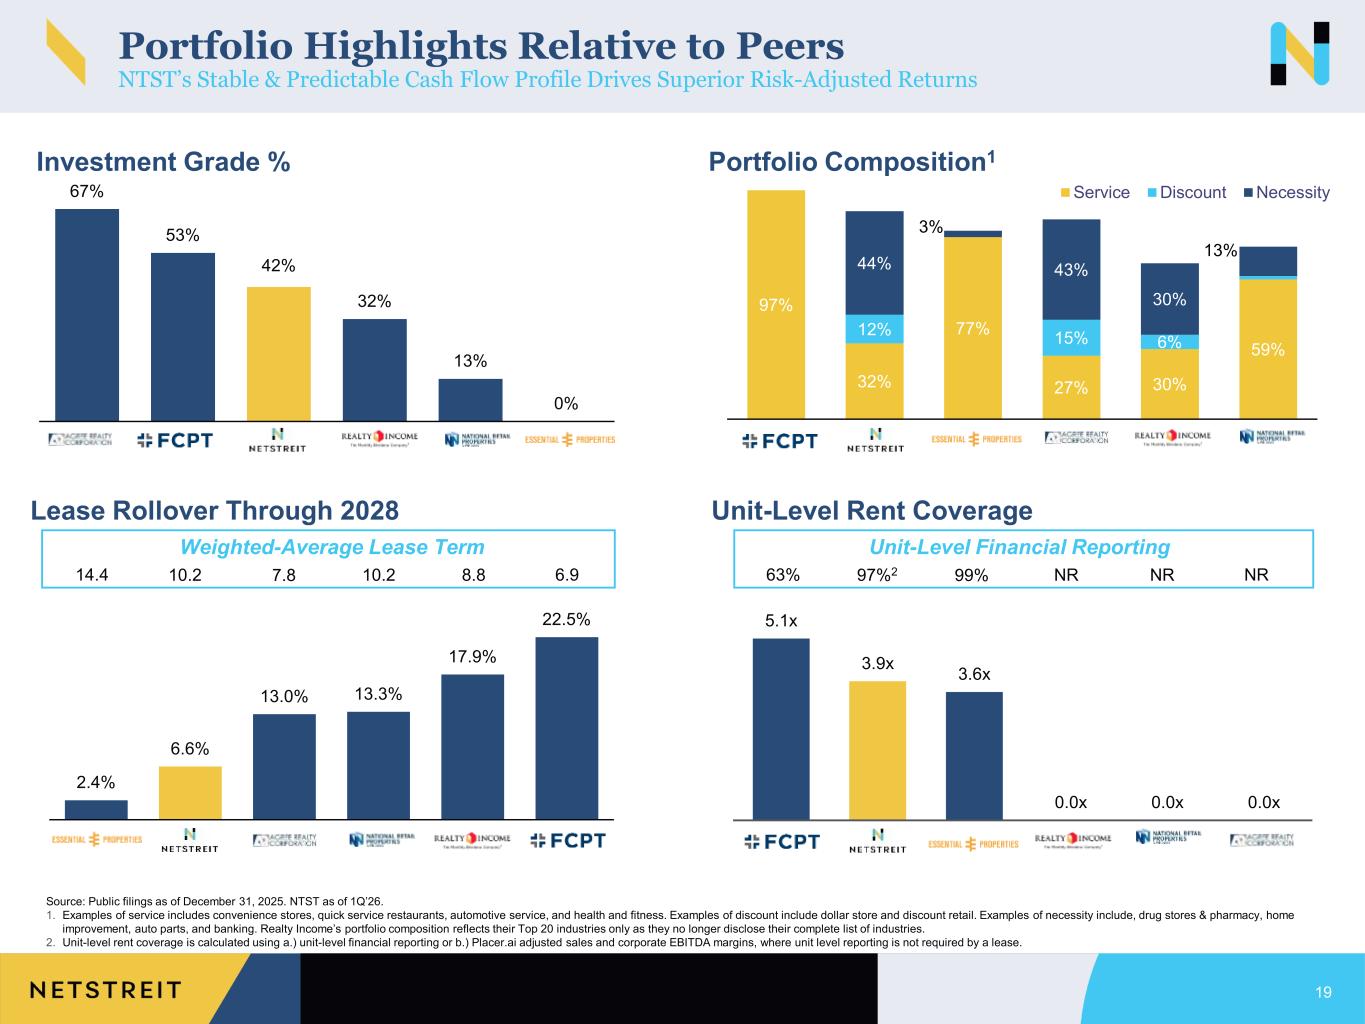
Thank you, Matt, and good morning, everyone. Thank you for joining us today to discuss NetStreet's first quarter 2026 results. I want to begin by thanking our entire team for their outstanding execution and dedication. We carried strong momentum from our record 2025 into the new year, and the organization has hit the ground running. In the first quarter, we saw continued acceleration on the investment front. We closed on $239 million of gross investment activities, driven by well-priced opportunities in our core necessity and service-based sectors, including grocery, convenience store, quick service restaurants, auto service, and other essential retail. These investments were completed at an attractive blended cash yield of 7.5%, with a weighted average lease term of 14.1 years. Complementing this, we executed targeted dispositions that further enhanced portfolio quality, reduced tenant concentrations, and recycled capital into higher quality, longer duration opportunities. This robust start to the year reflects the depth of our sourcing platform and our team's ability to move quickly across a number of smaller transactions while still adhering to our stringent underwriting criteria. While there have been a few new participants enter the net lease business in recent years, something that has happened in each and every cycle, the market remains extremely fragmented and rife with attractive opportunities. Turning to the portfolio, we ended the quarter with 804 properties, leased to 138 tenants across 28 industries in 46 states. Our weighted average remaining lease term increased to 10.2 years, while the percentage of investment grade and investment grade profile tenants remained flat at 58.3 percent of ABR. Unit-level rent coverage across the portfolio remains healthy and ticked up slightly to 3.9 times. Occupancy remained at 99.9 percent, but subsequent to quarter end, our occupancy has returned to 100 percent. In early April, we backfilled our loan vacancy, a former Big Lots location, with A-rated TJ Maxx at a more than 20% increase in rent. While vacancies have been extraordinarily rare in our portfolio, this execution highlights the expertise of our real estate underwriting and asset management teams. On the balance sheet, we continue to maintain a conservative and flexible capital structure. Following the capital raising completed in the quarter, our leverage was an industry-leading 3.2 times. With substantial liquidity under our revolving credit facility and the benefit of previously raised forward equity, we are well positioned to fund accelerated growth without compromising our leverage targets. Given the capital raise during the quarter, as well as the strong momentum in our investment pipeline and attractive opportunities we are seeing, we are increasing our full year 2026 net investment activity guidance to a range of $550 million to $650 million. We are increasing the bottom end of our AFFO per share guidance range to $1.36 to $1.39. In summary, the first quarter represented an excellent start to 2026, highlighted by strong momentum on the acquisitions front and opportunistic capital raising, which largely takes care of our 2026 equity needs. Our differentiated strategy, focused on high-quality real estate, rigorous underwriting, proactive portfolio management, and a low-leverage balance sheet, continues to position NetStreet for sustainable long-term growth and value creation. With that, I'll turn the call over to Dan to review the first quarter financial results in greater detail. We will then be happy to take your questions.
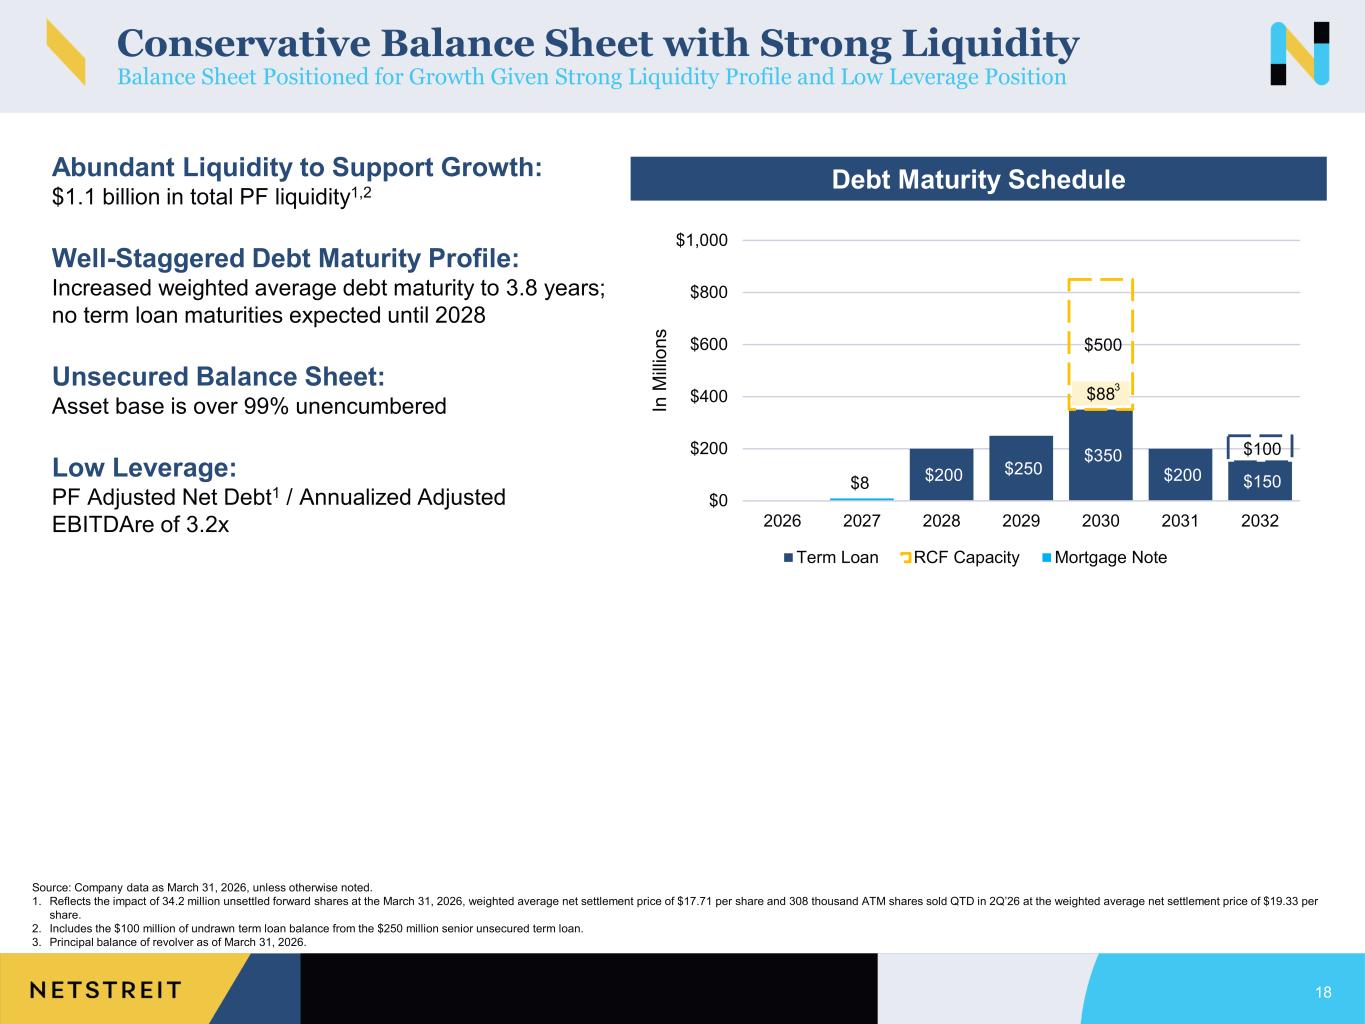
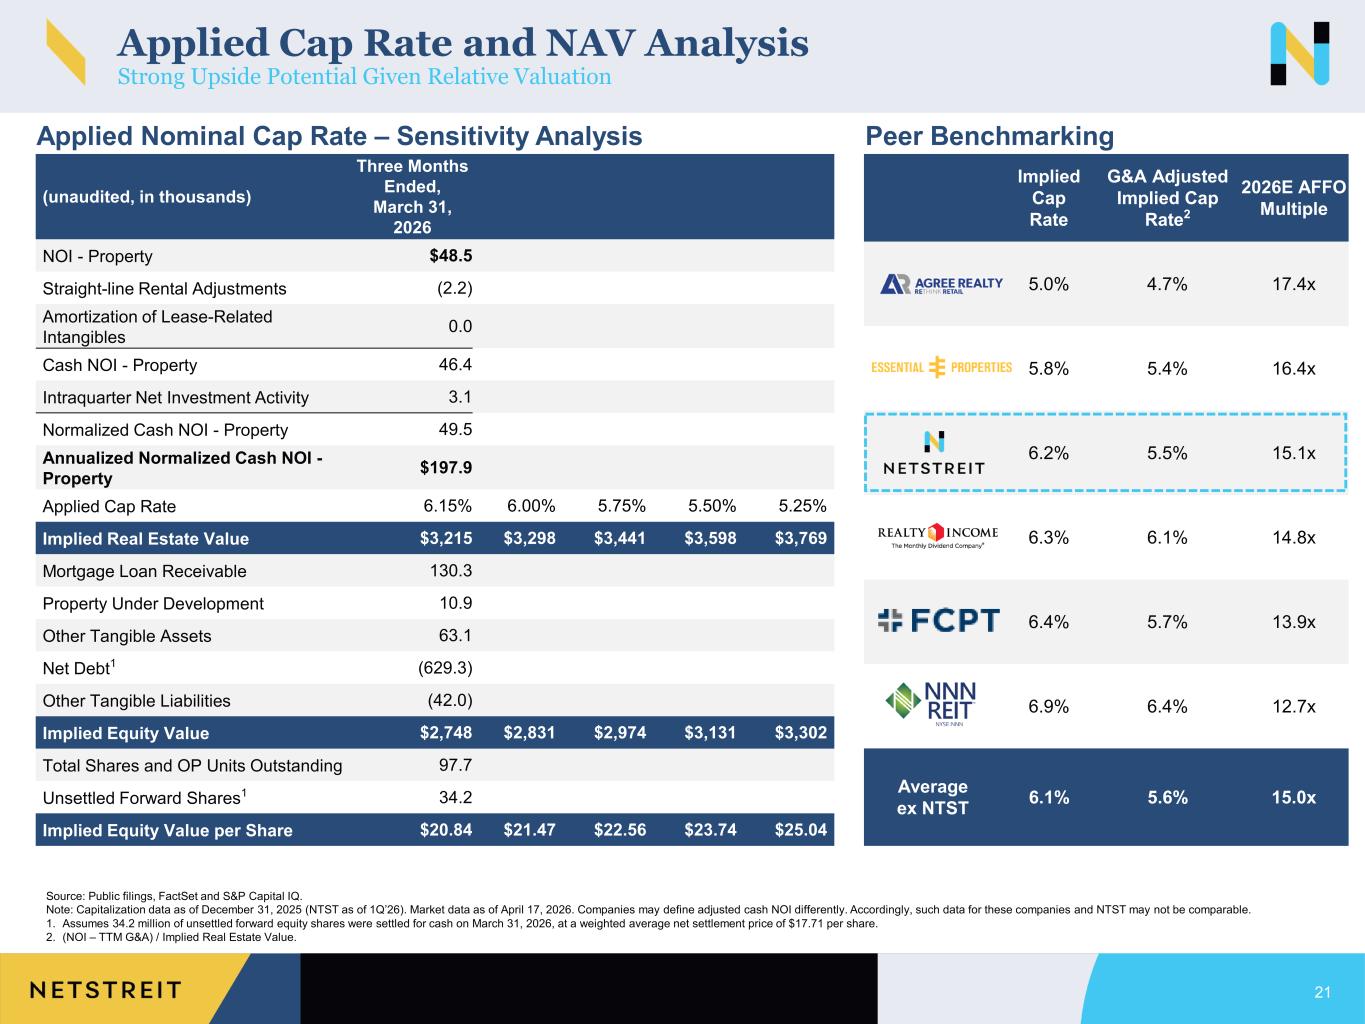
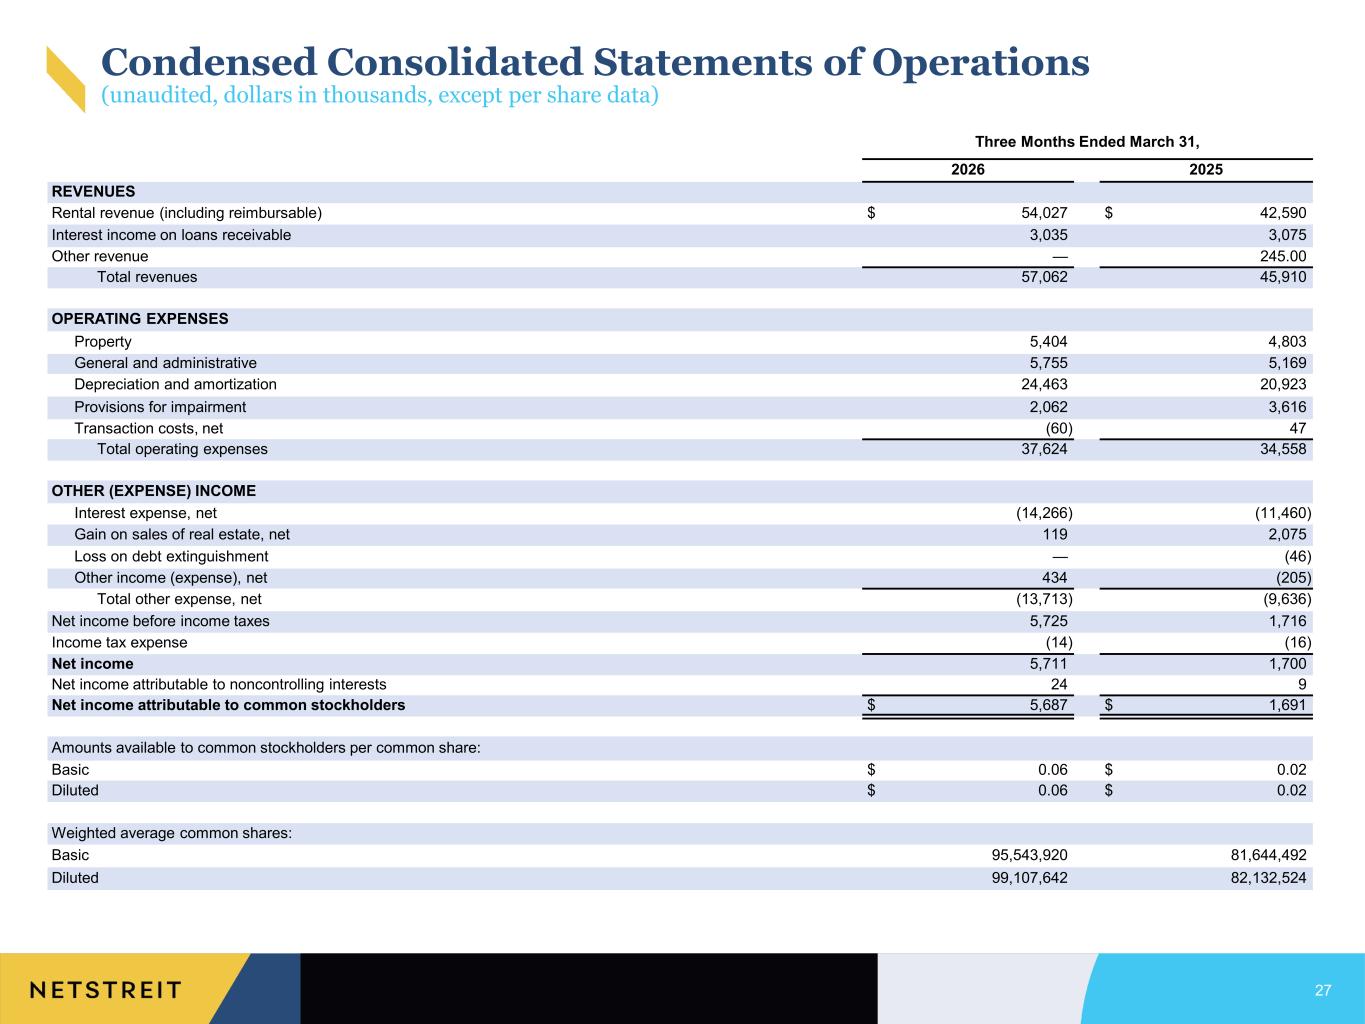
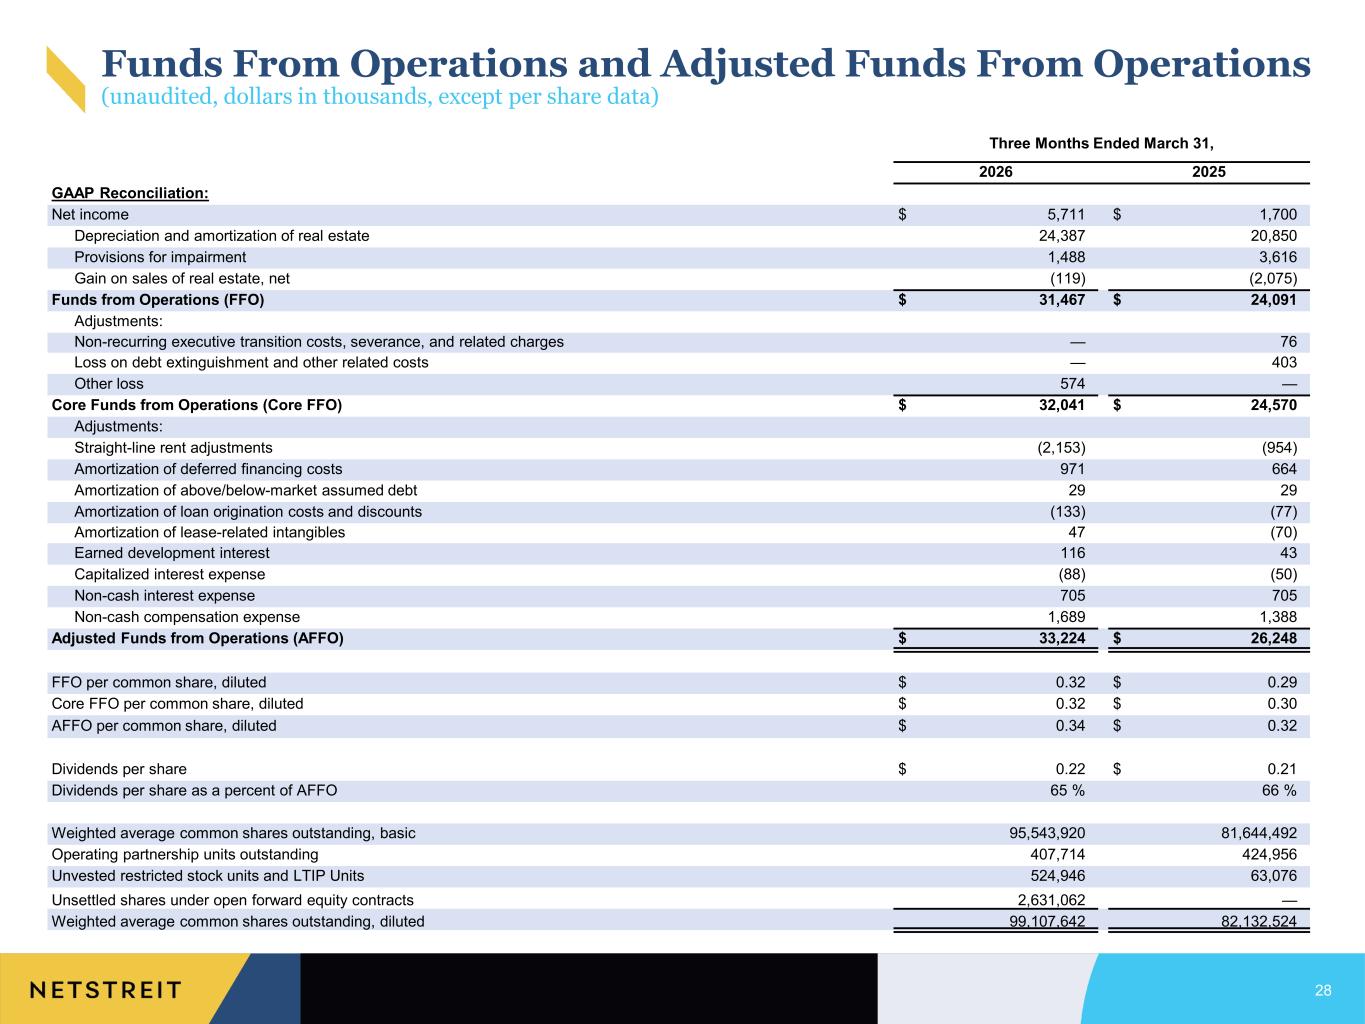
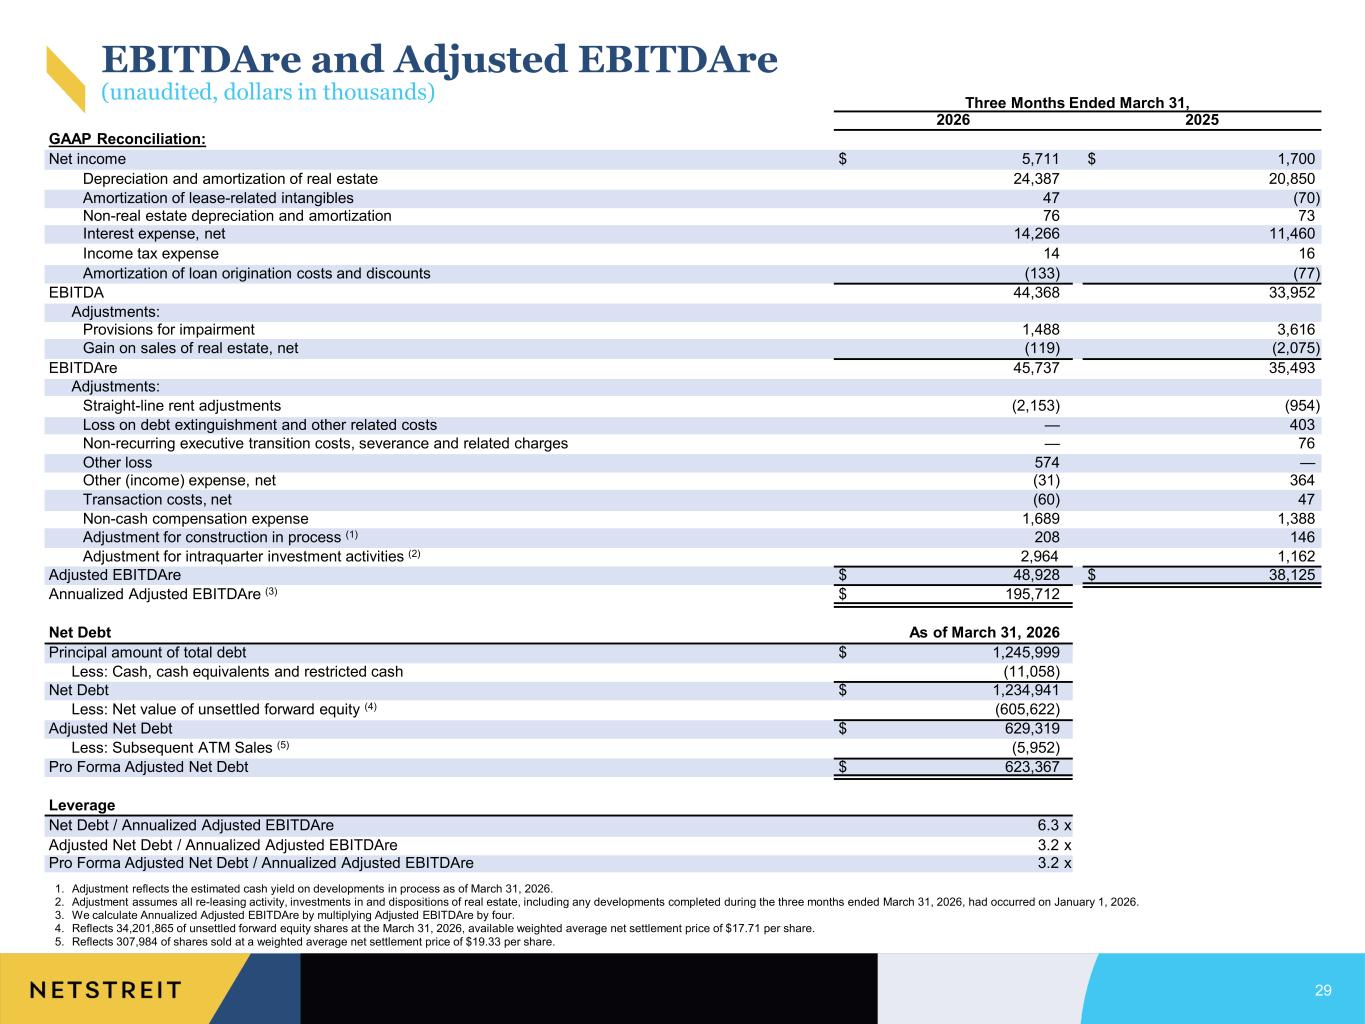
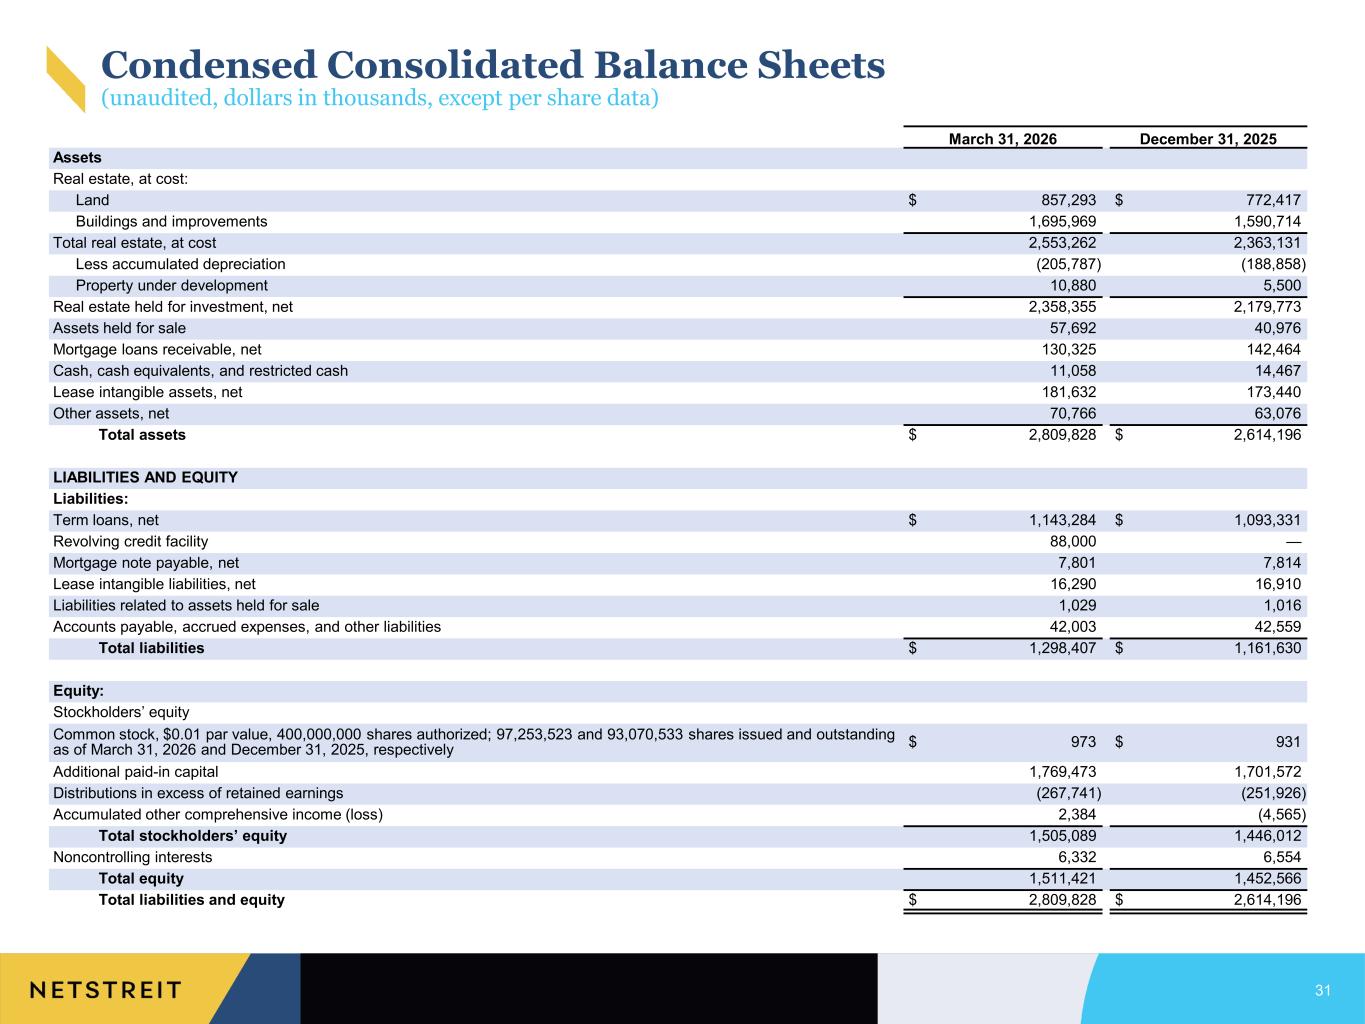
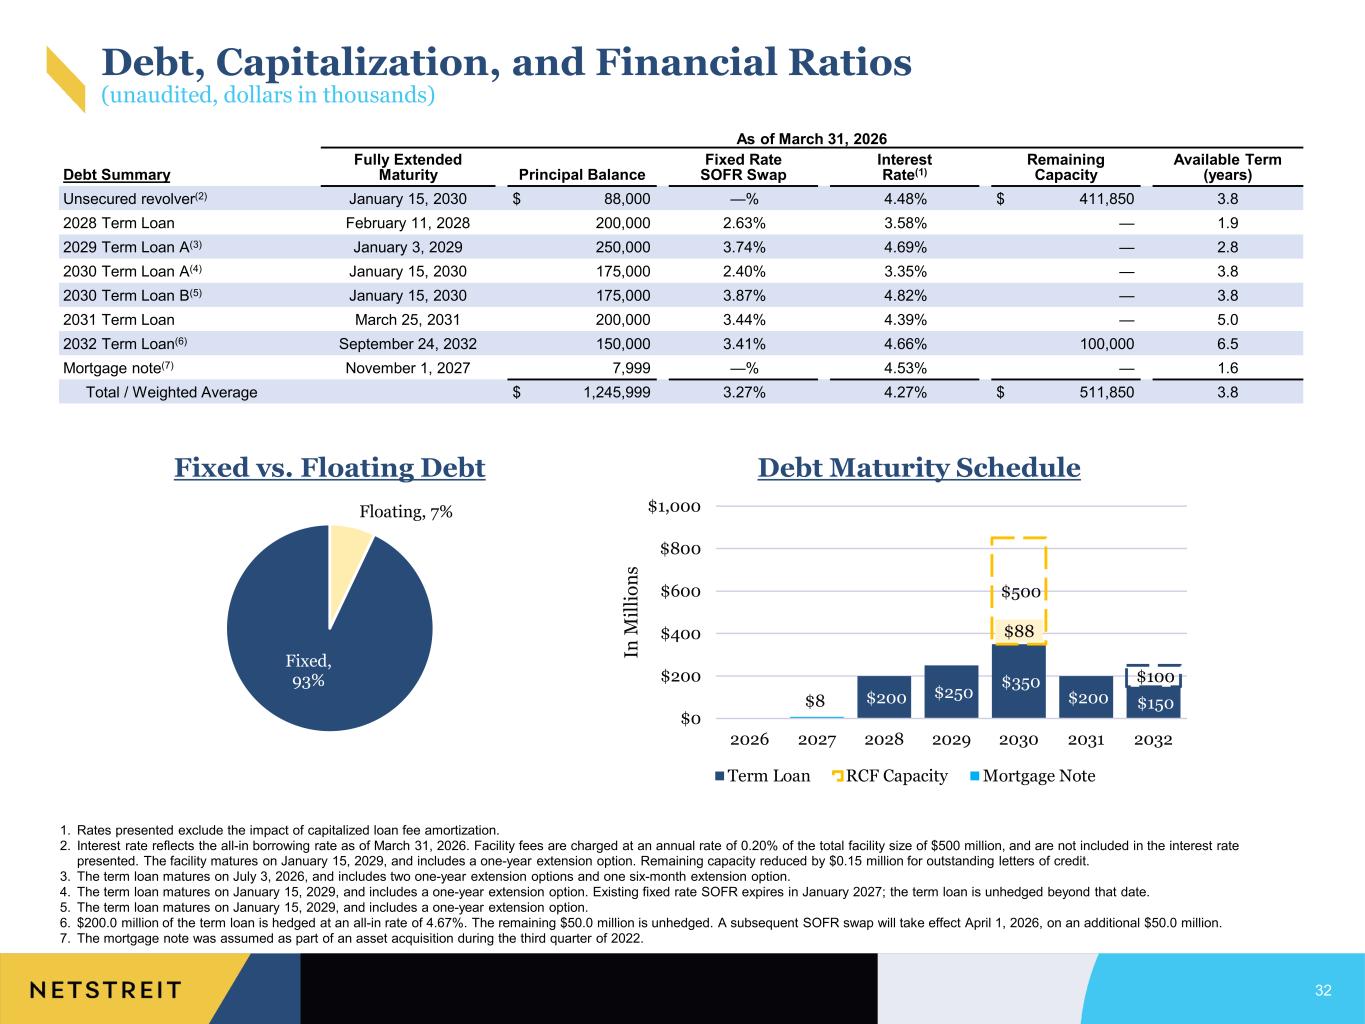
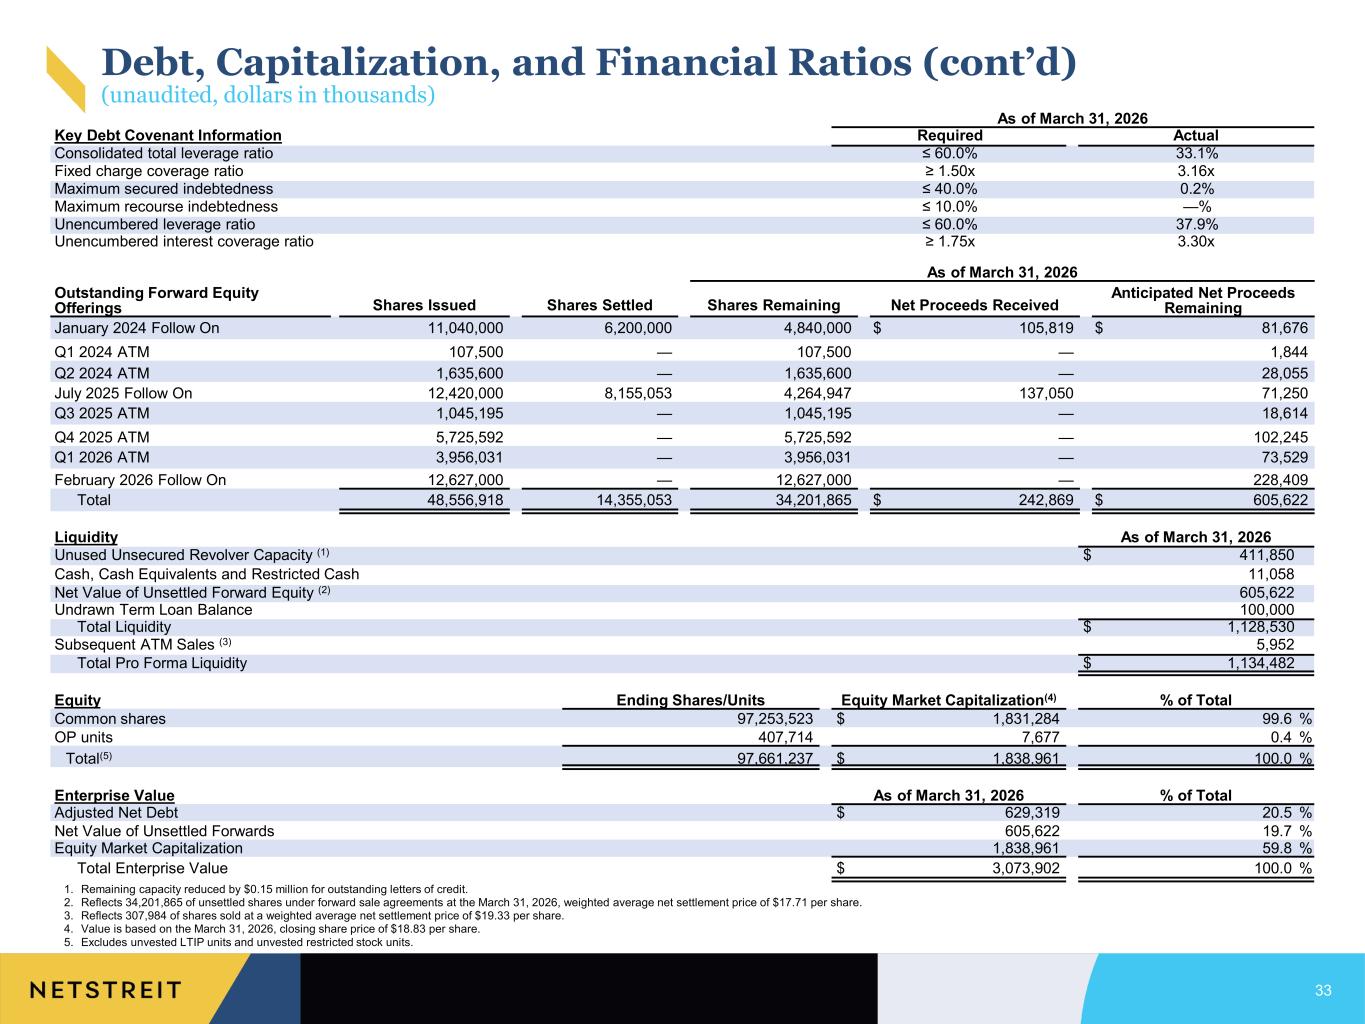
Thank you, Mark. Looking at our first quarter earnings, we reported an income of $5.7 million, or $0.06 per diluted share. Core FFO for the quarter was $32 million, or $0.32 per diluted share, and AFFO was $33.2 million, or $0.34 per diluted share, which was a 6.3% increase over last year. Turning to the expense front, our total recurring G&A in the quarter increased 9.7% year-over-year to $5.8 million, which is mostly the result of increased staffing and further investment in our team. That said, with our total recurring G&A representing 10% of total revenues this quarter versus 11% in the prior year quarter, our G&A continues to rationalize relative to our revenue base. Turning to the capital markets, we completed a 12.6 million share forward equity offering in early February, which raised $230.3 million of net proceeds. This was supplemented by our ATM activity of 4 million shares for $73.8 million of net proceeds. In total, we sold 16.6 million forward shares for $304.1 million of net proceeds in the quarter, which puts us in an excellent position to fund our forecasted net investment activity this year. Turning to the balance sheet, our adjusted net debt, which includes the impact of all forward equity was $629 million. Our weighted average debt maturity is 3.8 years, and our weighted average interest rate was 4.27%. Including the extension options, which can be exercised at our discretion, we have no material debt maturing until February of 2028. In addition, our total liquidity was $1.1 billion at quarter in, which consisted of approximately $11 million of cash on hand, $412 million available on a revolving credit facility, $606 million of unsettled forward equity, and $100 million of undrawn term loan capacity. From a leverage perspective, our adjusted net debt to annualized adjusted EBITDA RE was 3.2 times at quarter end, which remains comfortably below our targeted leverage rates of 4.5 to 5.5 times. Moving on to 2026 guidance, we're increasing the loan under our AFO per share guidance to a new range of $1.36 to $1.39 and increasing our net investment activity guidance to $550 to $650 million. We continue to expect cash G&A to range between $16 and $17 million. In addition, the company's AFFO per share guidance range now includes $0.03 to $0.06 of estimated dilution due to the impact of the company's outstanding forward equity, calculated in accordance with the Treasury stock method. Lastly, on April 16th, the Board declared a quarterly cash dividend of $0.22 per share. The dividend will be payable on June 15th to shareholders of record as of June 1st. With that, operator, you will now open the line for questions.
Operator
Thank you. At this time, we'll be conducting a question and answer session. If you'd like to ask a question, please press star 1 on your telephone keypad. A confirmation tone will indicate your line is in the question queue. You may press star 2 if you'd like to remove your question from the queue. For participants using speaker equipment, it may be necessary to pick up your handsets before pressing the star keys. One moment, please, while we poll for questions.
Our first question comes from Handel St. Just with Mazuho.
Operator
Please proceed with your question.
Hey, guys. Good morning, and congrats on a strong quarter here. Seems like things are clicking on all cylinders here. I guess I was curious about the level of activity in the first quarter. I guess it was close to a record quarter for you guys. But if you think about what it implies for the rest of the year, it seems like there's pretty meaningful slowdown in activity. So maybe some color on what you saw in the first quarter that drove such robust activity and what you're seeing in the pipeline and maybe expectations near term, given what the new guide implies for activity going forward.
Yeah, thanks, Handel. Yeah, I mean, I think obviously it was a very strong quarter, similar to the fourth quarter that we just had. we're just really seeing very attractively priced opportunities that fit our investment criteria, which I think is a credit to the acquisitions team and the underwriting team of, you know, kind of getting all that through the system, you know, pretty quickly. We're seeing a very similar environment right now. Pricing, we expect to remain relatively the same, you know, give or take 10 basis points. And so, you know, we just want to be conservative with, you know, what's going to happen in the back half of the year. We, you know, we certainly feel very comfortable that we can sustain this level of acquisitions, but we want to make sure that we're out ahead of our capital needs.
That's helpful. I guess, is there anything more on the competitive side that you can maybe share? There's been lots of geopolitical macro volatility. I'm curious if you're seeing maybe perhaps some of the private equity players step back a bit here. Your ability to win your fair share of deals seems to not face any, I guess, any headwinds. But I guess I'm curious, you know, that competitive set, what you're seeing from them, and perhaps if you're expecting the landscape near term to be more of the same, or perhaps for maybe just a change in the level of volume or competition near term, given what we're seeing in the macro. Thanks.
Yeah, no, look, I mean, I think it's a credit to the net lease space that they're more more people looking to get in. I think there are a few that have been pretty active. We're not really running into them very often on a one-off basis. But yeah, I mean, I think the competition has really been in the space for a long period of time. You go back to kind of post-financial crisis, you had coal and ARK and the non-traded deploying a ton of capital, even more than what we're even seeing from the private equity world. And there were still plenty of opportunities for the publicly traded REITs that had a reasonable cost of capital to go out and compete. I wouldn't expect that to change. They may look to acquire more than what they've done in the past, but I don't think that's really going to have a huge impact on pricing and really our opportunity set.
That's great, guys. Thank you, and congrats again. Thanks, Andy. Thanks.
Operator
Our next question is from John Kilchowski with Wells Fargo. Your line is now live.
Good morning. Thank you. My first question is on just the Treasury stock method dilution in the quarter. Could you tell us what your expectations are, what's included at the midpoint in terms of expectation of price versus the low end and the high end?
Yeah, I mean, I don't want to go too much into detail. I mean, obviously, we're expecting three to six cents at the midpoint. You know, we're expecting to call it four and a half. I think we've been fairly concerned on the high end even, you know, probably assuming even more than kind of four and a half. So, you know, our expectation is that, you know, we'll kind of drift somewhere into the low 20s and stay there. So to the degree that that doesn't happen, obviously, that would probably be upside relative to what we provided. But, you know, we kind of just stair step up the price per share from kind of where we ended the quarter each and every quarter this year. So, you know, without going into too much detail. But there's a healthy amount of conservatism baked in even to the high end just from a dilution standpoint.
Okay. Thanks, Dan. And then maybe a follow-up to that would just be, what's the strategy to manage those forwards? You know, you have some older data to outstanding forwards. I'm just curious if, you know, your strategy for managing those changes based on the stock price. And then also, how does this impact your growth profile heading into 2027 as you kind of get rid of these and maybe you have a faster churn of your forwards into, you you know, eventually no investments?
Yeah, I mean, the dates really don't matter to us. What matters is what are the lowest price forwards that we have. I mean, there is a 12 month kind of expiration to these, we haven't had an issue extending those. So it's really just taking what the lowest price forwards are and selling those first, because those are the most dilutive. And as far as our plan for this year, we'd like to get done with everything that's still outstanding that we sold in 2024 and 2025. So, and I think you should expect that to occur radically over the course of the year.
And, yeah, you hit on something important there too, John. You know, looking to 2027, you know, we're taking some of that dilution now. So that just makes it more creative when we actually do take down the shares and really allows us to have better growth in 2027 and future years.
Operator
Our next question comes from Greg McGinnis with Scotiabank. Your line is now live.
Hey, good morning. With the G&A guidance maintained, but plenty of liquidity and a good acquisition market, is there any push or need in your mind to increase the size of the acquisitions team, kind of given the success that they've had and the potential for more going forward?
Yeah, that's a good question. You know, I think right now the acquisitions team is really, you know, humming and really bringing in a ton of really attractive opportunities. And really the filter has been pricing and where we're getting the best risk adjusted returns. I don't necessarily think if we bring on, you know, more team, that's going to automatically translate into a lot more volume. But we're always making sure that we have a deep enough bench there. And right now, I think the team, you know, not only gets along great and, you know, fits in very well with our culture, but they're bringing in, you know, plenty of opportunities for us to be able to hit our growth goals and beyond.
And then just looking at, on the disposition side, healthy 6.6% cash yield on those, anything specific in there that you can talk about or the types of tenants or assets that you're looking to, that you either sold in Q1 or that you're looking to sell later this year?
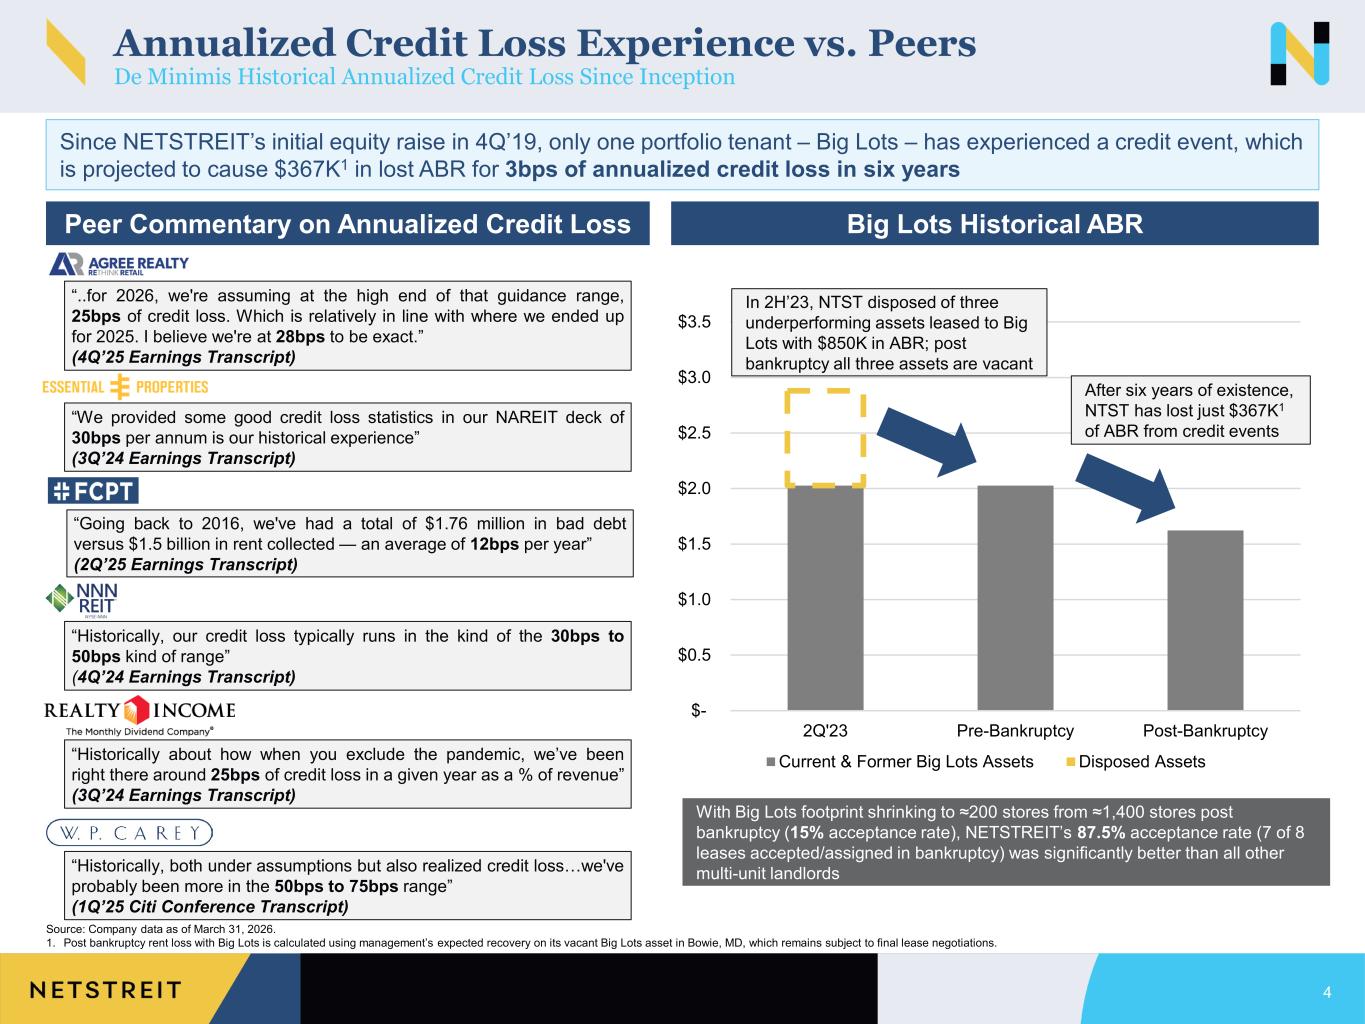
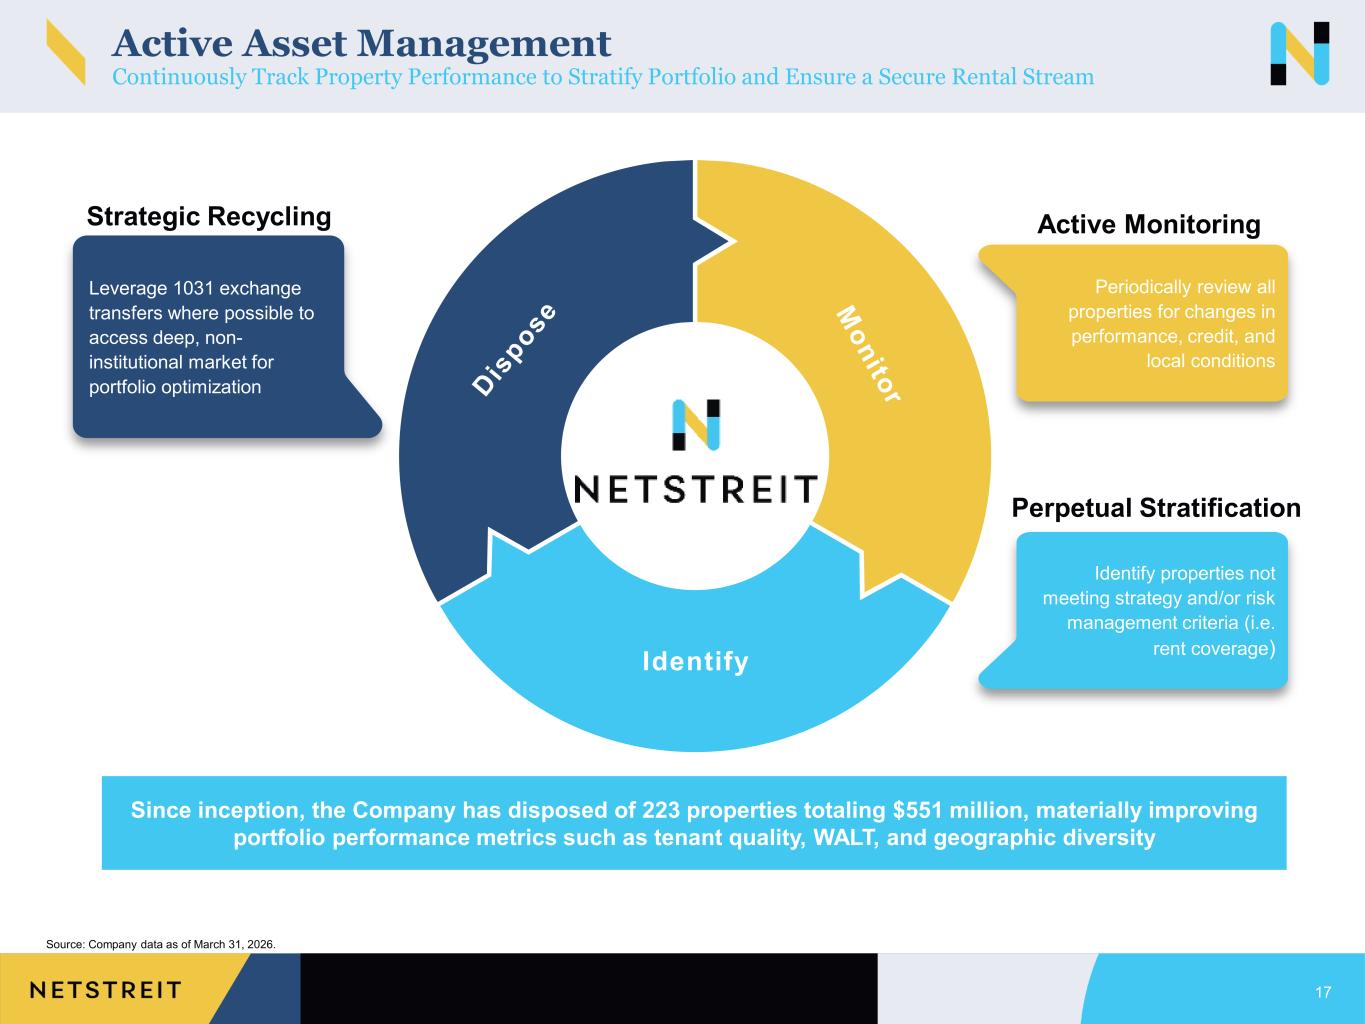
Yeah, I mean, I think the difference between this year and last year is going to be, you know, you're going to see certainly fewer dispositions. And, you know, we're always open to selling any asset in the portfolio of someone who's willing to pay us an aggressive cap rate. But it's really going to center around less so on the tenant concentrations, although you'll see, you know, a couple here and there with some pharmacies and maybe, you know, a couple of dollar stores here and there. But it's really going to be more focused on where we're seeing some potential deterioration, whether, you know, whether it be corporate credit or unit level performance. And, you know, we'd like to try to get way out ahead of that. And, you know, I think we've been successful doing that, getting out ahead of some risks, you know, well before they start reaching headlines and really start to get more difficult to sell, which is why our, you know, credit loss stats, you know, are what they are.
Okay. Thanks, Mark. Thanks, Greg.
Operator
Our next question is from Michael Goldsmith. with UBS. Your line is now live.
Good morning. Thanks all for taking my questions. Investment volume was robust in the first quarter and you took up the acquisition guidance pretty materially and you have the pre-funding. So I guess, you know, what are the factors that would limit, you know, your acquisitions kind of going forward? They kind of, you know, you stepped on the, you know, fourth quarter was strong, first quarter was equally strong. Like, you know, or should we expect you to kind of continue to step on the gas, or what would it kind of hold you back in any way?
Yeah, sure. So it's a good question. You know, we've got, you know, visibility going out 60, 90 days. If you get beyond that, it's hard to predict, you know, not only what the opportunity set's going to look like, but also what, you know, what the acquisition environment looks like and, you know, what opportunities are, what the pricing is. And obviously, you know, with the war going on and, you know, a lot of geopolitical, you know, risks out there, We didn't want to get too far over our skis and predict what that's going to look like. But, yeah, I mean, I think that's something that we're likely to revisit. If the market remains the same and our cost of capital remains the same, then I think there's no reason why we can't keep this clip going forward for several quarters.
And just to follow up, you were able to continue to acquire quite a bit, but at a similar cap rate. So, and I think you mentioned earlier in the prepared remarks, you were happy with the opportunities and the risk reward on what you're buying. So, can you just talk a little bit about the pricing environment, what you're seeing, and what would need to happen for it to change and turn less favorable?
Yeah, sure. So, I mean, I think the number one thing that could, you know, make it a little bit less favorable also has an offset where our debt would get cheaper. But I think if interest rates come down, then you may see cap rates come down along with it. I don't really foresee there being much of a slowdown in the opportunity set. You know, you had you go back to 2021, you know, where, you know, the five year was under one percent all the way up until the end of the year there. That, you know, allowed a lot of people to kind of enter the space, kind of small family offices that got very aggressive, put five year debt on on a lot of those acquisitions that they made. That's coming due at higher interest rates. And so we're starting to see some of those people that maybe don't want to refinance and are looking to sell some smaller portfolios. I think that's going to certainly continue for the rest of the year because you've really had that really cheap debt through 2021. You put five years on that, it really gets us through the end of 2026 and into 2027. So hard to predict there being much of a slowdown in opportunity set, but interest rates can certainly drive some cap rates down. but we just don't really see that happening, you know, too much here in the short term.
Thank you very much. Good luck in the second quarter.
Operator
Our next question comes from Jay Kornrich with Cantor Fitzgerald. Your line is now live.
Hey, thanks. Good morning. I wanted to ask about the tenant credit and the watch list, you know, recognizing it's only been a couple months since the last quarter's earnings, but has there been any change just to the watch list or how you're thinking about bad debt based into guidance at this point?
Yeah, no. We don't see much of a change. In fact, I think if you look at the histograms that we provide in the investor presentation on slide 13 there, you've seen some improvement really across the board with unit level performance as well as corporate performances has improved a little bit. But look, we have a few assets under one times coverage. I believe there's three assets that kind of fit that category and three or four that, you know, are triple C plus on an implied rating basis. So those are ones that we're paying attention to. But in each of those situations, we feel like we'll have a pretty good outcome. So I really don't, you know, see much in terms of impacting AFFO for the next several years.
Okay, thanks for that. And then if I could just follow up on the question related to the dilution from the treasury stock method accounting, I guess, you know, should we be expecting that that number to come down throughout the year as you settle forward equity, or as you're maybe, going to be employing future capital markets activity is kind of that four and a half cents range, more of a sticky number to expect going forward.
Yeah, I mean, it's difficult to answer the question because I don't know where the stock price is going to go. But I think, you know, what you'd expect us to model is, you know, the stock price rising throughout the year. And so even though you're settling more shares and therefore be less dilution from those shares, Whereas the dilution stays about even because the stock price is going higher throughout the year. So, you know, that's how you should think about it. It's certainly going to be higher. We're certainly modeling higher than what it was in the first quarter. Our average stock price in the quarter was 1926. So as we sit here today, it's been in the 19s and 20s or higher 19s and 20s. So, you know, what the what the midpoint assumes is kind of, you know, you're staying in and around the kind of the 20 to 21 dollar level. And, you know, that probably equates to anywhere from four to five million shares every quarter until you get out to next year.
OK, that's helpful. Thank you. It's it for me.
Operator
Our next question comes from Shmeed's Rose with Citi. Your line is now live.
Hi, thanks. I just want to ask a little bit more about what you're seeing kind of in the opportunity set. it looked like you leaned into convenience stores a little more in the quarter. I know you've talked in the past about QSRs and maybe some more fitness and just wondering where those kind of line up on your interest level right now and kind of any pricing changes around those categories.
Yeah, sure. Yeah, I mean, we did buy more convenience stores in the quarter. I think that's probably not going to be the case as much in the second quarter. I think what we're going to be buying is going to be maybe a little bit more diversified than what we typically have bought in the past. There were just a lot, you know, we did a lot of sale lease packs, you know, just under half of what we bought in the first quarter were sale lease packs, and a lot of that were, you know, convenience store, you know, more regional operators buying smaller operators, which is kind of our favorite type of sale lease pack, because you're seeing a fixed charge coverage ratio typically go up after those acquisitions versus, you know, financing. And so, you know, those were some attractive opportunities. Right now, we're seeing maybe a little bit of a different, you know, opportunity set in that there's some more diversified, you know, pools of assets that we're in that, you know, that we have under contract and, you know, are looking forward to adding to the portfolio. But yeah, the convenience store space is certainly one that we like. The fitness, you know, you know, business is another one that we like as long as we're dealing with, you know, some of the more sophisticated operators that provide unit level coverage and get very comfortable that they have enough members at those locations to generate, you know, strong enough rent coverage in the future. And, you know, We were able to source a decent amount of those in the fourth quarter and the first quarter, maybe a little bit less so in the second quarter. And then quick service restaurants is always an area that we like. Just sometimes the pricing can get pretty aggressive there. So it can be a little bit tricky to get our hands on, but we did buy a handful of Starbucks in the quarter that were really strong on Placer and are doing very well. So it's always a little bit of a mix, and each quarter is a little bit different. But I think I'd expect the second quarter to be a little bit more diversified. okay um and then you know we noticed that family dollar was i guess upgraded to an investment grade profile from some investment grade and we're just wondering what drove that yeah i mean it was really uh that they were willing to allow us to put that out there uh they are a private company now and so we are subject to to ndas we can't just share everybody's financial statements and financial condition and so we got them to agree to allow us to uh you know they've always been an investment grade profile ever since they spun out, but now we're able to share that with the public.
Operator
Our next question comes from Wes Galladay with Baird. Your line is now live.
Hey, good morning, everyone. I just have a few housekeeping questions for you. For the TJ Maxx lease that you signed, has that tenant commenced rent paying as of this moment?
They have not. They have some work that they need to do. Within the store, it's a relocation store for them and so we have about a year before they actually start paying rent okay and we did notice a few loans were extended but they were just for a very short period can you kind of give us a an idea what's going on in the visibility on them being repaid yeah sure so you know I think you're probably specifically talking about Speedway and that is you know an ongoing negotiation where that will get extended much further. We may end up acquiring some of the assets, kind of TBD a little bit, but it should have a very positive outcome for us.
Okay, thank you very much.
Operator
Our next question comes from Eric Borden with BMO Capital Markets. Your line is now live.
Hey, thanks. Good morning. As you continue to lean into IG profile and non-IG investments, you know, they do tend to have better escalators than true IG. Do you have internal growth target for these assets? And, you know, how should we be thinking about the longer term internal growth for the overall portfolio?
Well, you're right. I mean, we try to negotiate, you know, any time that we can to try to get better at better escalators. And so, and I have a little bit more leverage, you know, more specifically when you're doing a sale lease back and you're writing the lease and that a lot of the, you know, sub-investment grade or IGP opportunities that we're doing are in those categories. So, you know, we try to get 2% annual is what we shoot for. I think we're probably on a blended basis going to be kind of probably more in the one and a quarter. It's probably a good thing to model for future acquisitions. And that'll continue to bring up our average escalators in the portfolio.
And then could you just quantify what's assumed in guidance for bad debt? At the midpoint, we're looking, you know, in and around kind of 50 basis points. Great. Thank you.
Operator
Our next question comes from Michael Gorman with BTIG. Your line is now live.
Yeah, thanks. Good morning. If we could just go back to the forward equity for a minute. Obviously, you've been pretty strong and opportunistic there with kind of more than 600 million outstanding, but just back of the envelope is kind of 18 months worth of acquisition volume at a pretty conservative leverage level. What's the target there for you to keep a runway? Is it that 18-month target, or how should we think about that going forward?
Yeah, I mean, as we think about it, our leverage range, targeted leverage range is kind of 4.5 to 5.5. That's where we feel comfortable running the balance sheet. We could complete the 650 at the high end of our guidance and still be at 4.5. And so I think, you know, we'll be, you know, optionistic with the ATM where we where we think it makes sense. And, you know, to the degree that, you know, we continue to see opportunities at the same clip we saw in the first quarter. You should expect us to, you know, access that market when appropriate. But, you know, I think your assessment of kind of our runway is fair. But, you know, we want to stay on our front foot and make sure we're never in a position where, you know, we have to raise equity.
OK, that's helpful. Makes sense. And then, Mark, maybe just thinking about the loan book again, with some of the, let's call the volatility in the private credit space, are you seeing more opportunities maybe on the loan book side of the portfolio to expand that? And if so, how are you thinking about that in terms of the investment pipeline?
Yeah, no, it's a good question. And the answer is no. I mean, really, we're looking at, you know, providing, you know, developers with capital and kind of, you know, some acquisition capital here and there, you know, for some people like we did on Speedway. We're not lending directly to, you know, to tenants, and, you know, I think we'll likely avoid that as best we can. And so I don't think we'd be competing with any of them, and I would not expect that to have any impact on what we're doing. And in fact, I think the opportunity set on the loan side is probably not quite as good as what it was maybe a couple of years ago. And so I would expect us to do maybe fewer loans on a go-forward basis.
That's very helpful. And then maybe last one for me, because it's come up a few times. Obviously, C-stores are important, an important exposure in a space that you like. But it's also one that's going through an evolution in kind of form and how operators are thinking about it. I think 7-Eleven announced about 650 closures last week. Can you maybe just remind us how you think about underwriting the space, both in terms of the existing portfolio and new acquisitions in terms of kind of KPIs, formats, just how you think about that as a sector?
Yeah, sure. And I think that the 7-Eleven News is, you know, they're a very old company. They have a lot of, you know, very old, smaller stores that they're, you know, doing away We don't own any of those. But we're constantly looking at kind of a few different factors as it relates to C-Source. What is the gallonage that they're generating? Is that going up, going down? We've seen pretty consistent levels across the portfolio in the C-Source space. In fact, it's gone up a little bit. And then how is the inside sales doing? So they're really kind of two separate revenue drivers, making sure that they're getting enough volume and the margins are staying the same. And so seeing, you know, pretty consistent, you know, performance across our convenience store, you know, operators. But, you know, look, I mean, when we, you know, I think two or three years ago, we had 21 7-Elevens. Now we have 13 because we're constantly looking at, you know, which ones are doing well, which ones aren't. And the ones that aren't aren't going to stay in our portfolio, you know, until the end of the lease. And so, you know, we have, you know, I think nine and a half years of weighted average lease term on our 7-Elevens. None of them below eight and a half years. So I feel pretty strong that we've got a lot of time to deal with that. But that being said, we've got locations that are generating positive cash flow and aren't, we don't think, are related to the news that came out around 7-Eleven. But, yeah, I mean, I think there is certainly a move towards, you know, a larger format. You know, we're kind of seeing that across the board. But really, it comes down to the fundamentals that haven't changed over the past 25 years. And that's having strong inside sales, having strong gallonage, and being able to push price and not get squeezed on margins. And if you're able to do that, you're going to be successful for a long time in the convenience store space. Great.
Operator
Thanks, Michael. Our next question is from Linda Tsai with Jefferies. Your line is now live.
Thank you. Just given more volatility year-to-date in the 10-year, As you look across your key tenant categories, C-stores, grocers, home improvement, dollar stores, have you seen cap rates shift more so in any of these categories?
They've been pretty consistent. So we really haven't seen much of a change. In fact, I think we've been at 7.5 on going to cap rate with very similar mix of tenants. I think the tenant mix will probably change a little bit, be a little bit more diversified in the second quarter, but I'd expect a very similar pricing. But we haven't really seen much movement, if any, across the board.
Thanks. And then more of a big picture question, your AFFO per share CAGR has been high single digit since 2021. How do you think about the CAGR of AFFO per share over the next several years?
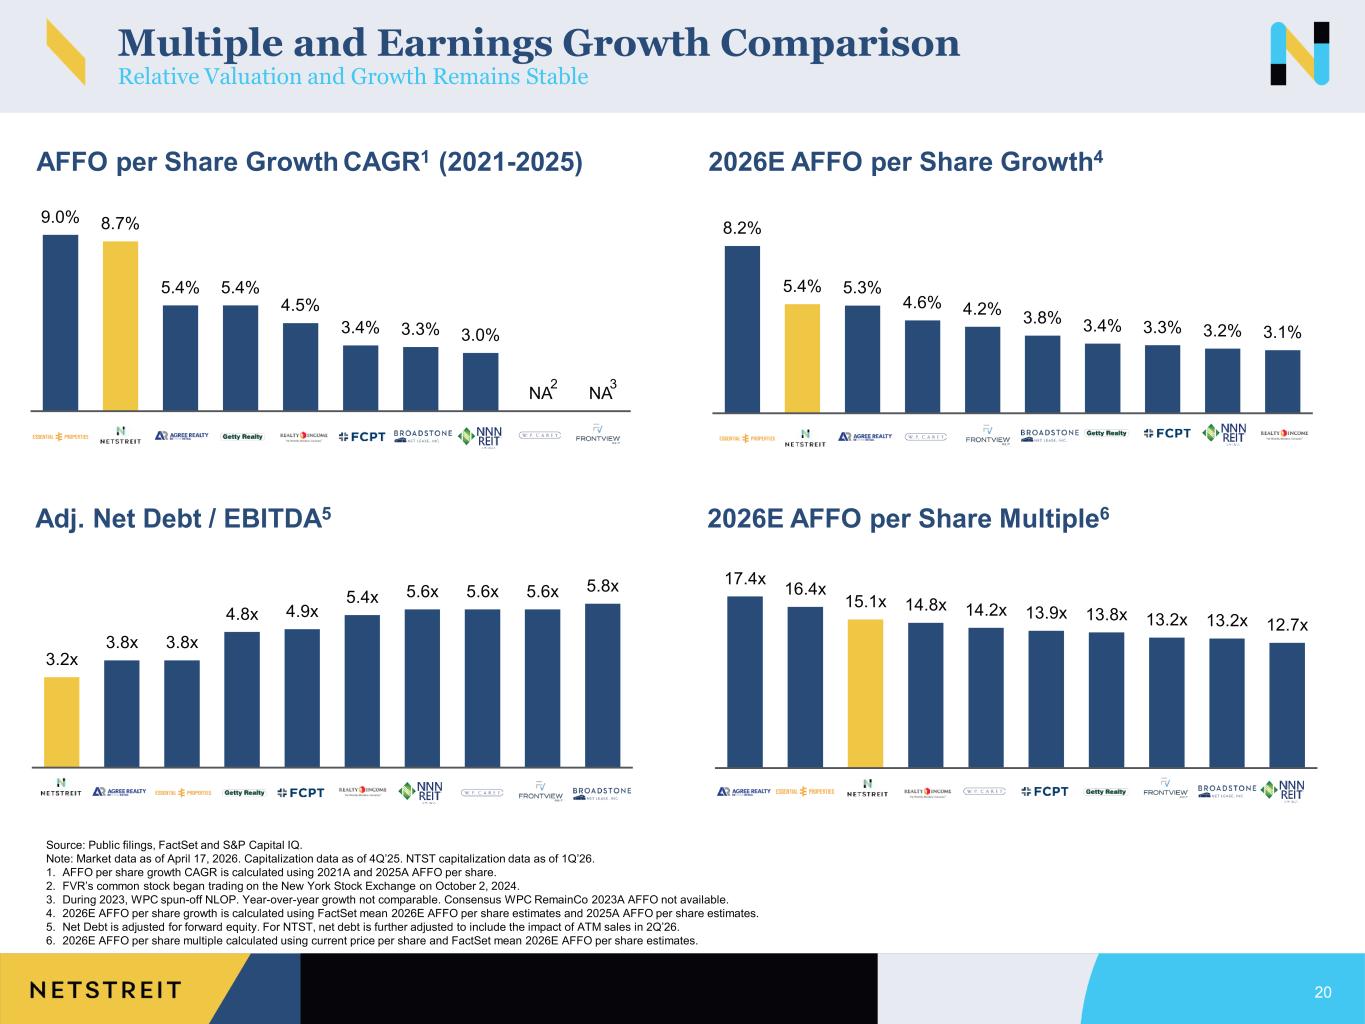
Yeah, I mean, Linda, we'd like to maintain that level. I mean, obviously, this year at the high end, it's 5.3%, you know, year-over-year growth. And I think, you know, consensus assumes even higher growth next year. I think to the degree that we can maintain spreads where they are today in the kind of, you know, 190 basis points range, I certainly think we can, you know, be north of, you know, kind of where we are this year. But I mean, it just remains to be seen, you know, where the stock price goes and where debt is. But I think the one thing that, or one of the many things that I feel confidence in is our team's ability to underwrite assets and get them into the portfolio in an expeditious manner. So, you know, I certainly think it's, if the cost of capital is there, the runway for us to be able to, you know, compound earnings is there for sure.
Operator
Our next question comes from Yana Gallin with Bank of America. Your line is now live.
Thank you. Good morning and congrats on the strong start to the year. There are lots of questions on C-stores, but I was wondering if you could remind us on kind of how you're thinking about the grocery category now that it's above 15%, and could we see further growth there?
Yeah, that's a good question, Jana. We've seen really a lot of great opportunities in the grocery space with some strong performing stores with great credit and good lease terms. We expect that to continue. There's really not as much in the second quarter, so a little bit difficult to predict. I don't think we'd let anything get to 20%, and so I think 15 is kind of nudging up against, you know, where we're comfortable, and, you know, we don't really want to let things get too far above that, but if there's a great opportunity, we don't want to be colluded from being able to move forward, but I would expect that kind of 15, 16 percent range to be pretty consistent with grocery. It just happens to be an industry that we like a lot, and I think the same can be said for convenience stores.
Thank you, and then maybe just an update on the development projects. You know, it's currently a small part of the business with four underway, But can you remind us of yields there? And would you be willing to kind of increase exposure to development if that's what some retailers prefer?
Yeah, I mean, certainly if retailers, you know, prefer that route and that's our best way to get the best risk adjusted returns, then that is something that we would be more aggressive on. Right now, we feel like we're picking up like 25 basis points. And, you know, it just happens to be some tenants that we really want to put in the portfolio. But, you know, you're really just not getting paid enough for the risk in our mind to get really aggressive on developments right now. You know, if you were picking up 50, 75, 100 basis points, then it would be, you know, a lot more interesting to us. But, you know, the pricing just isn't there. People are willing to pay up in the, you know, in single tenant net lease retail for the most part. The development projects are pretty short. So, you know, they don't demand that much of a premium. And so we're able to get, you know, similar opportunities outside of the development area and just put them on the balance sheet right away. And that's right now what we're looking to do. You know, we've had quarters where, you know, we've had, you know, almost half of what we're doing has been development. Right now it's about 10% of what we're doing. So it's a little bit less. But if that's the change, our acquisition team is pretty skilled at being able to move very quickly and start adding those into the pipeline. We just don't see that happening anytime soon.
Operator
Our next question comes from you, Paul Rana, with KeyBank Capital Markets. Your line is now live.
Great. Thank you. Mark, I appreciate the color you've already provided on investment pace for the rest of the year. But given we were almost through April and you probably have a good sense on May as well, I just want to get your sense on the pace of investments for 2Q.
Yeah, second quarter looks strong. So I don't think you're going to see too much difference in the second quarter. We'll see what closes. We're looking at some opportunities that we have under our control that may close in June, may close in July. We'll see. We're kind of getting closer to being done with sourcing for the quarter. But, yeah, we like the pipeline, the quality, and the pricing. And at least for the second quarter, I think you're going to expect a pretty similar quarter to the first.
Okay, great. That was helpful. And then just overall, you know, dispositions for real life this quarter, and you've talked about this being the case in the prior calls, but is this a pace that we should be expecting for the remainder of the year as well?
I think so. I mean, you know, every now and then there's an opportunity where someone comes to you and they want to pay something aggressive or, you know, take some risk off your hands. And if that were to happen, you know, we certainly move quickly on that as well. But I think – and in general, you may see a quarter here or there that might be a little bit heavier, a little bit light. But I think in general, yeah, you can expect a pretty similar pace.
Operator
Our next question comes from Daniel Guglielmo from Capital One Securities. Your line is now live.
Hi, everyone. Thank you for taking my questions. And following up on the escalator question from earlier, as the portfolio mix starts to move from larger tenants to adding some smaller growth-year tenants, are there differences in how you all manage a smaller tenant that's maybe less visible to the public versus a large tenant that's a public filer and very visible?
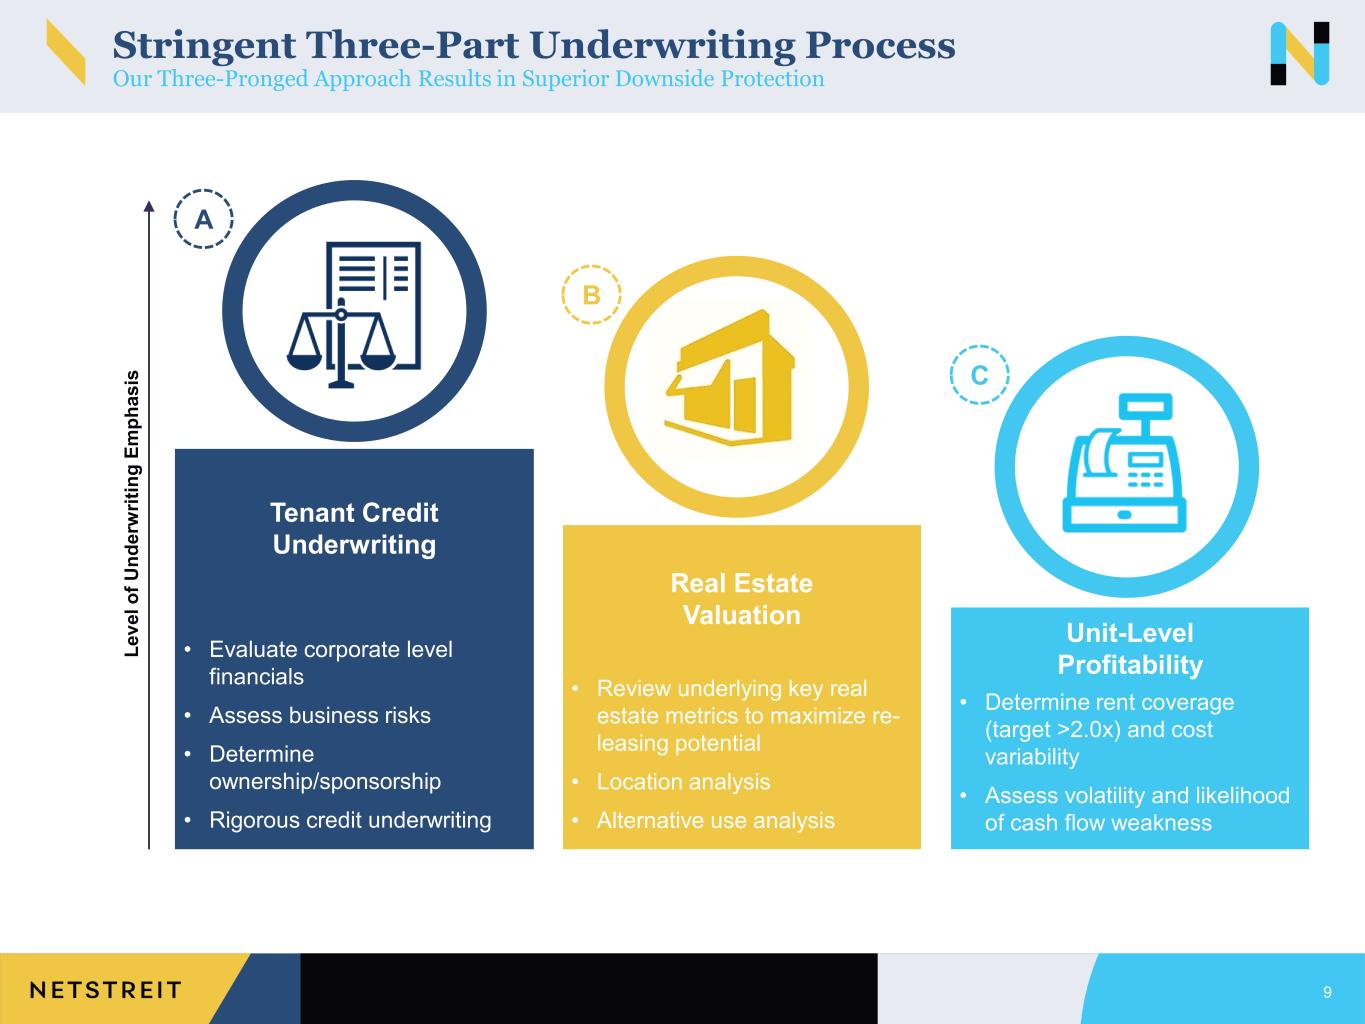
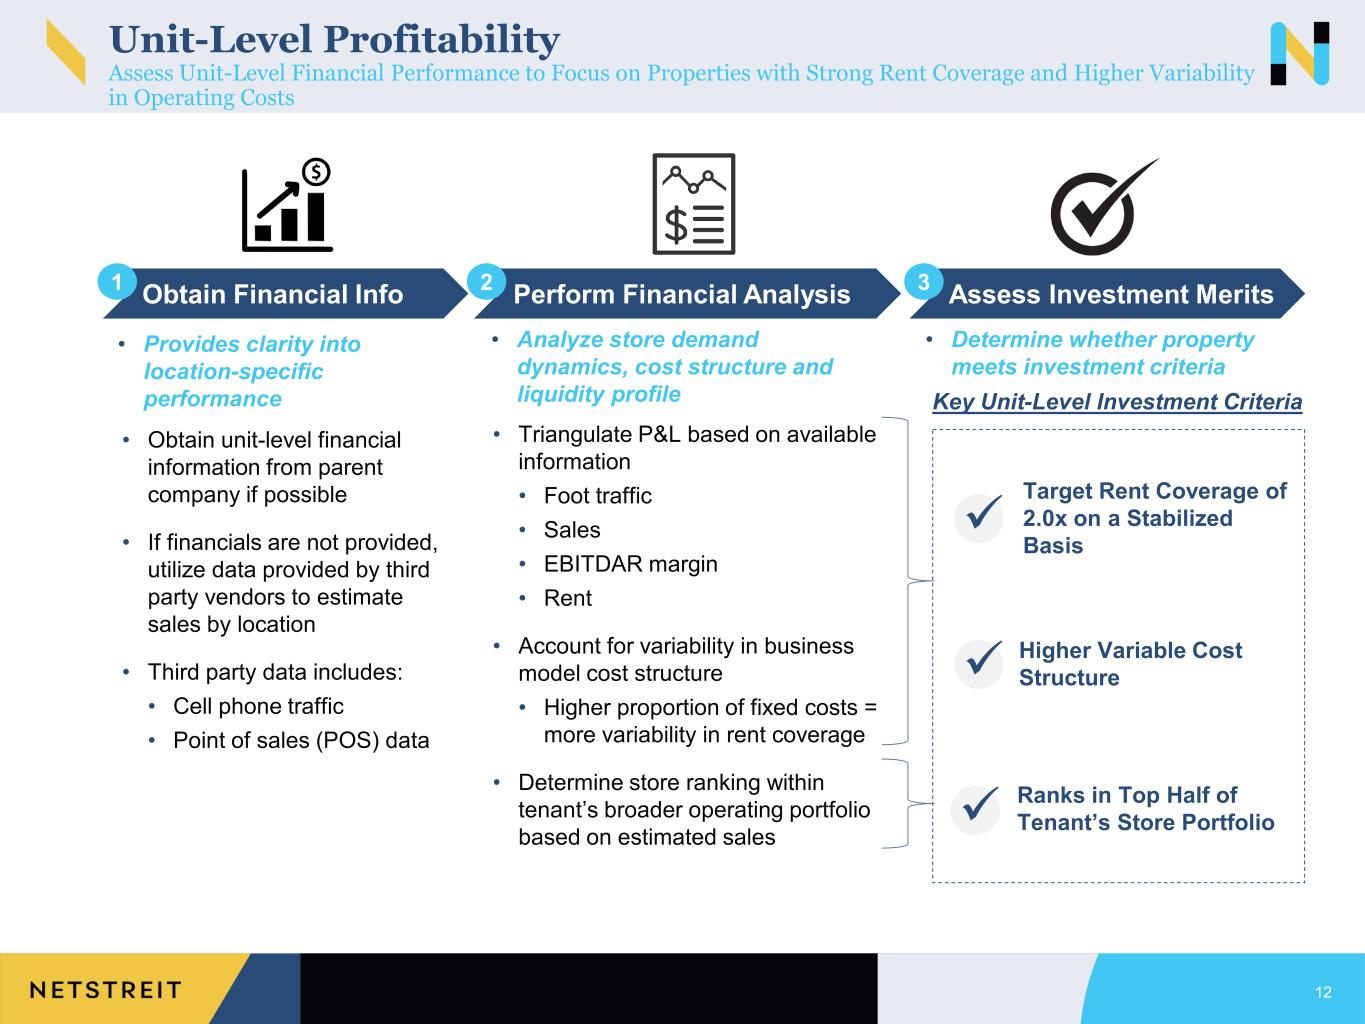
Yeah, I don't think there's much difference in terms of how we manage it. You know, certainly I think we don't want to let any concentrations get very high. with some of the public tenants, just because you subject yourself to some headline risk that isn't real risk as it relates to our portfolio. But we're doing the same things across the board on every tenant. We're tracking the corporate financial performance. Obviously, you probably have a little bit less cushion with the smaller tenants than you do with some of the larger investment grade tenants, but also tracking foot traffic and the unilevel performance. And we've been pretty aggressive and we want to be proactive and not reactive on the asset management front when we start to see some potential issues. And I think if we continue to do that over time, you're just going to continue to see very low credit loss stats.
Appreciate that. And then with private credit seemingly less available this year than it was last year, are you seeing more smaller operators start to search for capital funding elsewhere, like by a sale lease back? Or is it too early to see something that like that flow through to your transaction market?
Yeah, we had not seen that. I'd be surprised if we see a ton of that. You know, the private credit guys were kind of not only focused on retail, they're kind of all, you know, lending to software companies, a lot of different, that's got a lot of headlines in a lot of different industries that are, you know, maybe a little bit less real estate heavy. So I don't think it's going to have a huge impact one way or the other, and we have not seen any impact to date.
Operator
We have reached the end of the question and answer session. I'd now like to turn the call back over to Mark Manheimer for closing comments.
Well, thank you all for joining us this morning. Good luck to the rest of the earnings season, and we look forward to seeing you at upcoming conferences. Appreciate the time.
Operator
This concludes today's conference. You may disconnect your lines at this time. and we thank you for your participation.