Operator
Good day, and thank you for standing by. Welcome to the Prague Holdings Q4 Earnings Conference Call. At this time, all participants are in a listen-only mode. After the speaker's presentation, there will be a question and answer session. To ask a question during the session, you will need to press star 11 on your telephone. You will then hear an automated message advising that your hand is raised. To withdraw your question, please press star 11 again. Please be advised that today's conference is being recorded. I would now like to hand the conference over to your first speaker today, John Ball, Vice President of Investor Relations. Please go ahead.
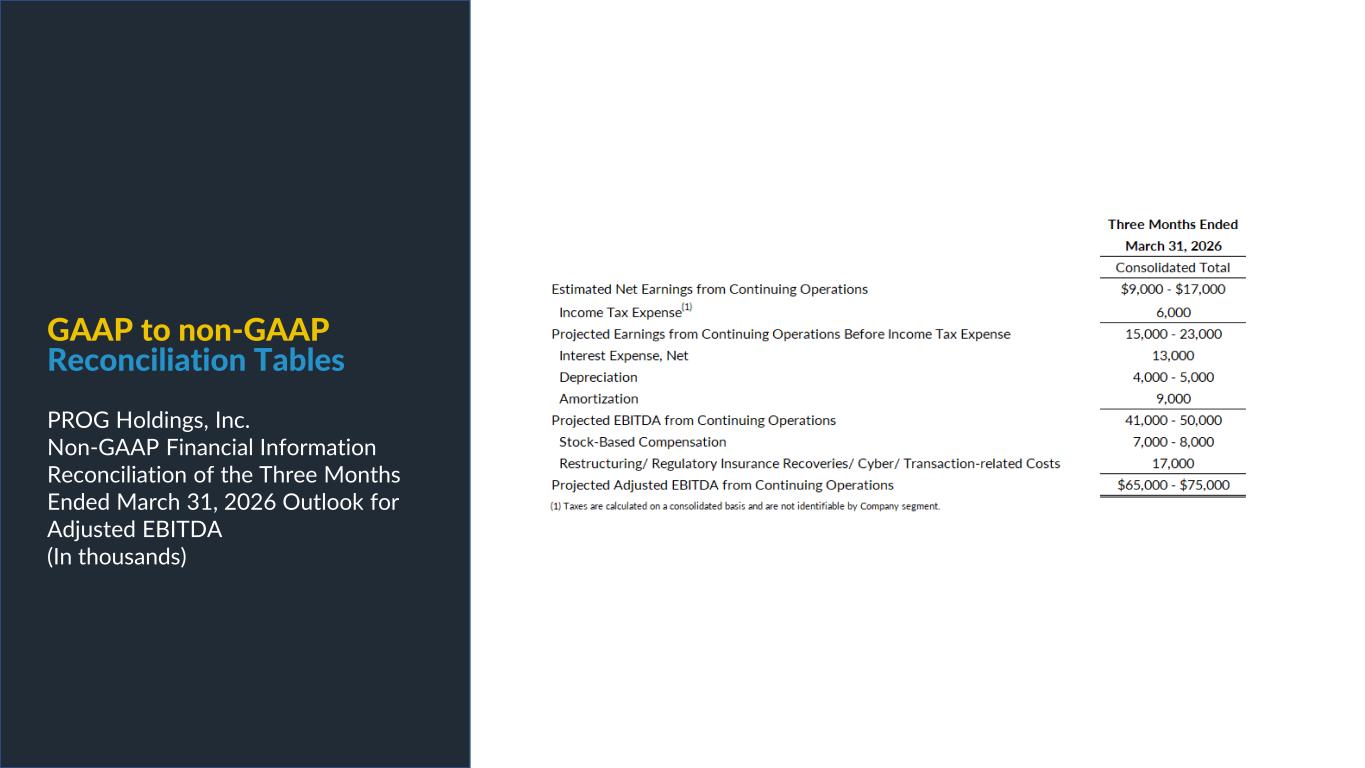
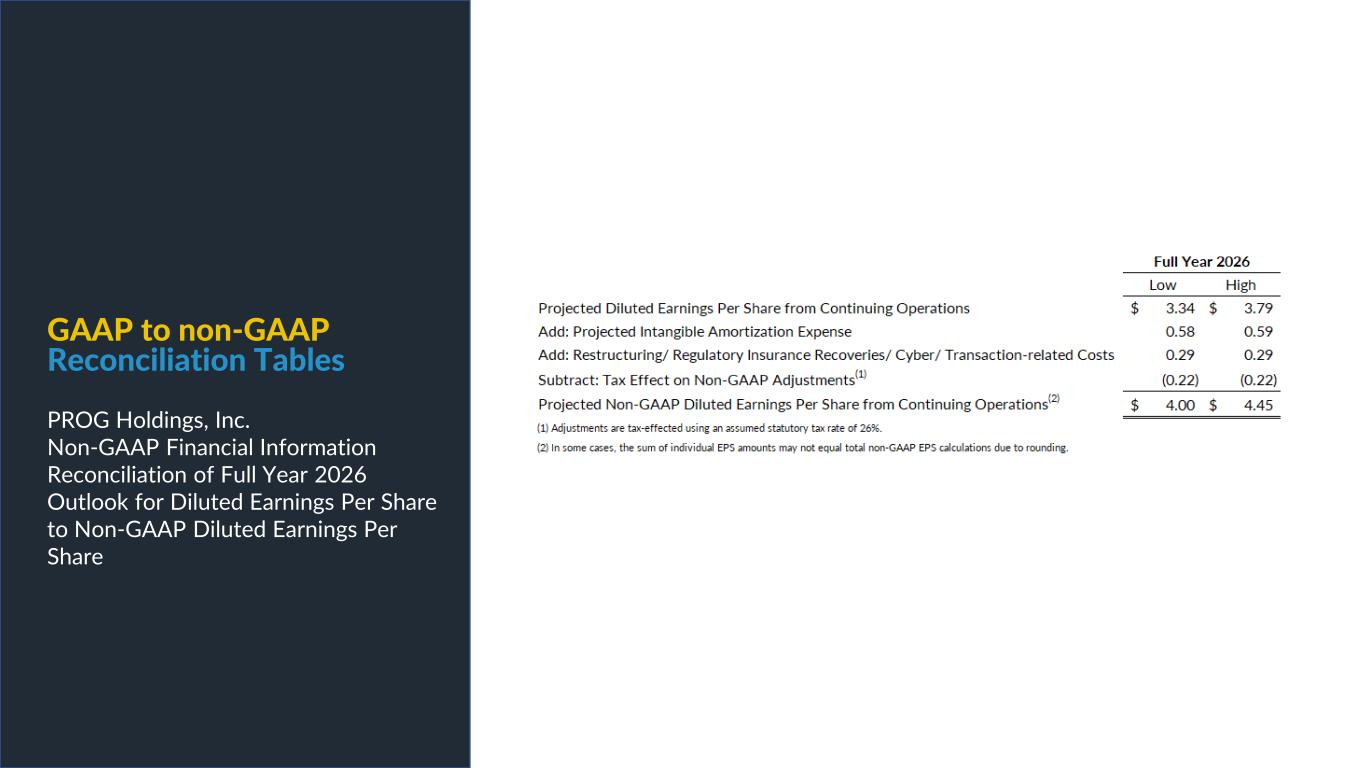
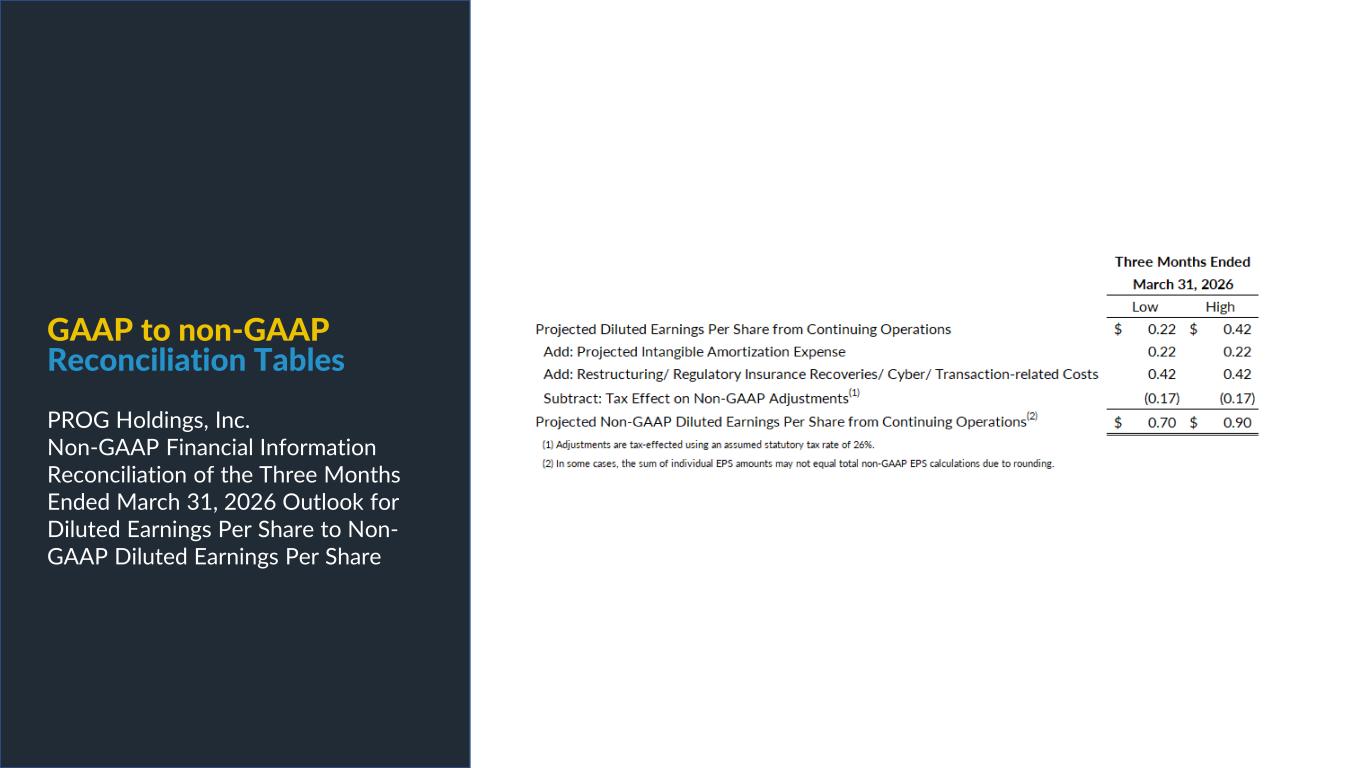
Thank you, and good morning, everyone. Welcome to the Prague Holdings fourth quarter 2025 earnings call. Joining me this morning are Steve Michaels, Prague Holdings President and Chief Executive Officer, and Brian Garner, our Chief Financial Officer. Many of you have already seen a copy of our earnings release issued this morning, which is available on our Investor Relations website, investor.progholdings.com. During this call, certain statements we make will be forward-looking, including comments regarding our 2026 full-year outlook and our outlook for the first quarter of 2026. Listeners are cautioned not to place undue emphasis on forward-looking statements we make today, all of which are subject to risks and uncertainties which could cause actual results that differ materially from those contained in the forward-looking statements. We undertake no obligation to update any such statements. On today's call, we will be referring to certain non-GAAP financial measures, including adjusted EBITDA and non-GAAP EPS, which have been adjusted for certain items which may affect the comparability of our performance with other companies. These non-GAAP measures are detailed in the reconciliation tables included with our earnings release. The company believes that these non-GAAP financial measures provide meaningful insight into the company's operational performance and cash flows and provide these measures to investors to help facilitate comparisons of operating results with prior periods and to assist them in understanding the company's ongoing operational performance. In addition, I encourage you to participate in our Investor Day meeting being held at the New York Stock Exchange and webcast live on Tuesday morning, March 10th, at 8.30 a.m. Eastern Time. Please reach out to me at john.baugh at progholdings.com for details on how to participate. With that, I would like to turn the call over to Steve Michaels, Prog Holdings President and Chief Executive Officer.
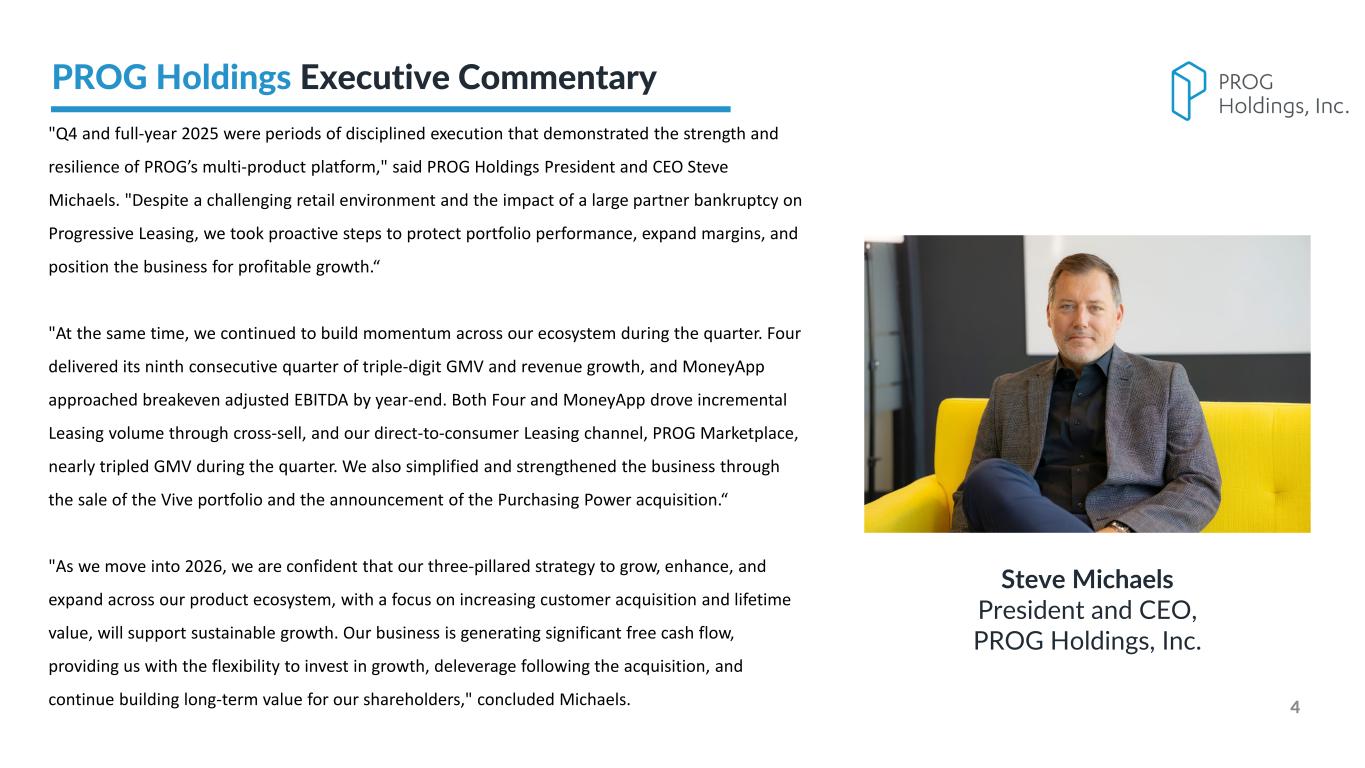
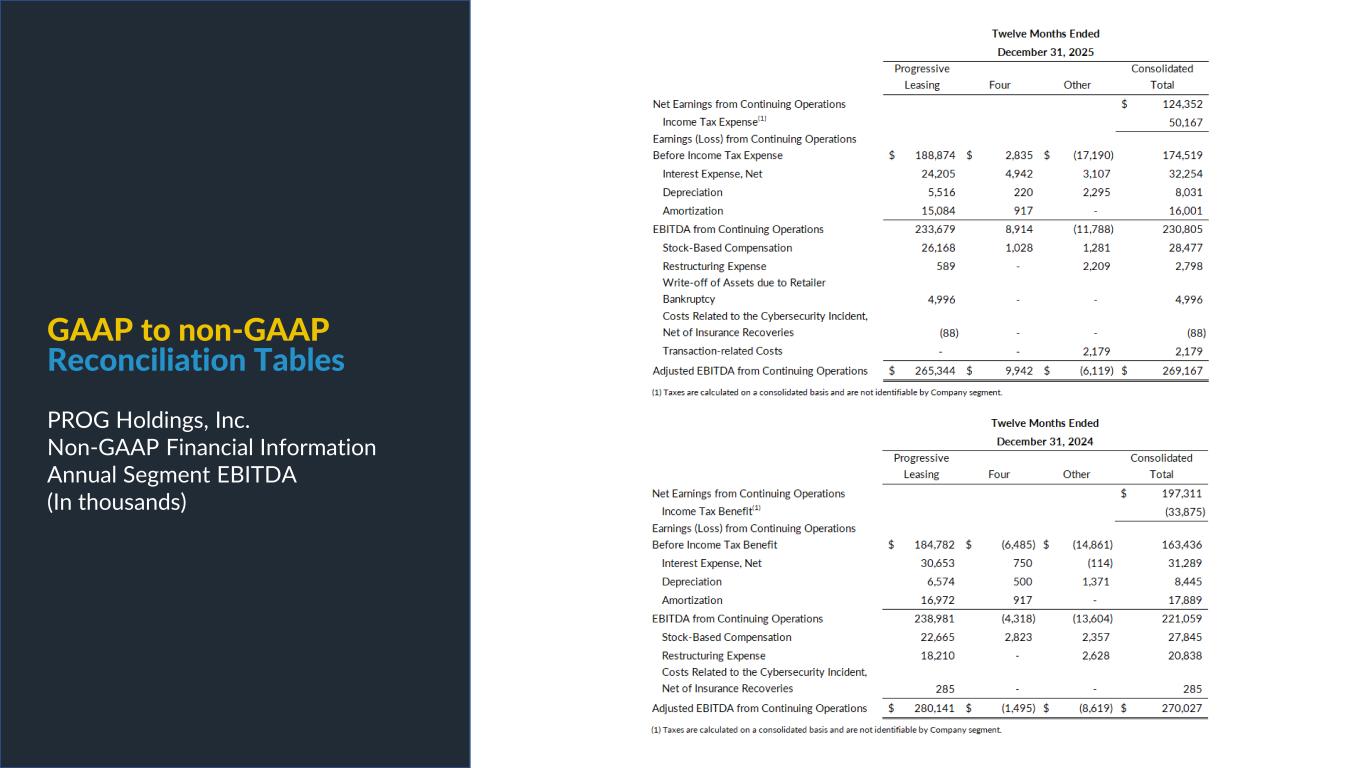
Thanks, John. Good morning, everyone, and thank you for joining us as we review our fourth quarter and full year 2025 results, which met or exceeded the outlook we provided in late October. I'll start with a high-level view of the year, provide some context around the environment we operated in, and then talk about how our strategy and execution position us as we move into 2026. 2025 was a year that required balance, discipline, and focus. The retail and consumer environment remained challenging, particularly in the categories we serve, and we navigated meaningful disruption following the bankruptcy of a large retail partner. At the same time, we took deliberate action to tighten decisioning in our progressive leasing business to protect portfolio performance. Those dynamics weighed on leasing GMV, which was down 8.6% year-over-year. Adjusting for the big lots bankruptcy and the intentional tightening, underlying GMV in 2025 grew in the mid-single digits, reflecting operational execution and healthy demand across other areas of the business. We gained balance of share with key partners, ramped new partner activity, expanded e-commerce penetration, and built momentum at Prague Marketplace, our direct-to-consumer motion. While leasing faced some headwinds, we saw important tailwinds at our Buy Now, Pay Later platform for technologies. Four delivered triple-digit GMV and revenue growth throughout the year. Four continues to scale organically with strong consumer engagement and improving unit economics, and it is playing an increasingly important role in our ecosystem. We also made meaningful progress in cross-selling our products. Money App, our direct-to-consumer mobile cash advance business and four drove approximately 45 million of incremental leasing gmv in 2025 up from 23 million in 2024 as customers who engage with these products increasingly opted into leasing when it was the right fit this cross product engagement is a central element of our long-term strategy and an important offset to macro pressure in any single product alongside this execution during 2025 we took a strategic step to sharpen our focus by selling our VIVE portfolio, a decision that aligns with our long-term priorities around capital efficiency. VIVE is reflected in discontinued operations at year-end, and this transaction allows us to redeploy capital toward opportunities with stronger strategic alignment and return potential. In January 2026, we completed the acquisition of Purchasing Power, expanding our offerings into a differentiated channel and adding a complementary growth platform that aligns with their long-term strategy. So, while 2025 presented real challenges, it was also a year where our diversified platform mattered. We leaned into the areas of the business with momentum, strengthened portfolio health in leasing, accelerated our strategy, and took deliberate actions to position Prague for sustainable, profitable growth. Before I address consolidated full-year results, I want to take a step back and introduce how we are increasingly thinking about growth through the lens of consolidated GMV, rather than viewing GMV solely through the progressive leasing segment. As our ecosystem expands, GMV is being generated across multiple products, most notably leasing and for today, with purchasing power becoming part of that picture as we move into 2026. Looking at GMV on a consolidated basis provides a more complete view of customer engagement, transaction volume, and the overall scale of commerce flowing through the prog platform importantly as leasing for and purchasing power each represent distinct reportable segments for external reporting we will continue to provide gmv results at the segment level to maintain transparency and comparability over time we believe this broader view of gmv will become increasingly relevant in understanding how customers engage with prog across multiple entry points and how that engagement ultimately drives long-term value creation for the full year 2025 consolidated gmv which includes progressive leasing and four grew 12.1 percent supported by four's triple digit growth at approximately 144 percent turning back to progressive leasing for a moment the intentional tightening to tightening to protect portfolio performance achieved the intended benefit full year write-offs remained within our annual targeted range of six to eight percent and gross margin expanded year-over-year as portfolio yield improved this reflects the effectiveness of our dynamic decisioning models and our willingness to make proactive data-driven trade-offs at a consolidated level adjusted EBITDA from continuing operations for 2025 was 269 million dollars which beat the high end of the outlook we provided in October was essentially flat to last year and importantly landed within the original adjusted EBITDA range we guided to back in February 2025 despite the volatility and disruption we navigated during the year. Non-GAAP diluted EPS from continuing operations at $3.51 beat both the October outlook and the original guidance we provided in February. Together, these results reflect a year where we balance near-term pressure with long-term value creation and generate strong free cash flow to reinvest in the business and return capital to shareholders. Moving to strategy, as our business has evolved, so has the way we think about our three strategic pillars, grow, enhance, and expand. While the pillars themselves remain the foundation of our strategy, the way we execute against them is increasingly shaped by our multi-product platform. Rather than viewing leasing for money app and purchasing power as stand-along products, we operate the business as a connected platform, where growth, customer experience, and product innovation reinforce one another. This ecosystem-first mindset is becoming a meaningful accelerant across all three pillars. Under our grow pillar, our focus is on expanding the company by strengthening our industry-leading partnerships and scaling our direct consumer channels, with growth accelerated by customer engagement across our products. In 2025 at Progressive Leasing, we grew balance of share with some existing retail partners by deepening integrations and executing joint initiatives across marketing, digital, and in-store workflows. even in a soft retail environment these efforts allowed us to capture incremental gmv within existing doors by improving application flow waterfall execution and conversion across channels direct-to-consumer was another key growth driver prog marketplace expanded meaningfully in 2025 delivering approximately 82 million in gmv nearly doubling year-over-year and exceeding our previously communicated target. Additionally, our e-commerce channel scaled, with e-commerce GMV reaching an all-time high of approximately 30% of total progressive leasing GMV in the fourth quarter of 2025, and 23% for the full year, compared to 17% in 2024, reflecting the shift towards digital engagement and the strength of our omnitannel strategy. Marketing is central to this pillar, and our approach has evolved. In 2025, we expanded partner marketing programs with retailers while also scaling cross-product marketing using shared customer data and insights to engage customers more intelligently. A clear example of this is the previously mentioned $45 million of leasing GMV generated through marketing to for and money app customers during the year, which on a standalone basis would rank as a top 10 retailer within the Prog leasing platform, underscoring the power of a connected approach. Under the enhanced pillar, our priority is delivering an industry-leading consumer experience, one that is simple, efficient, and intuitive across every interaction. In 2025, we made meaningful progress improving how customers interact with Prog through digital channels. We expanded self-service capabilities within our mobile app, allowing customers to manage accounts, make payments, and engage with our products more seamlessly. A critical enabler of these improvements has been our work to eliminate and consolidate technical debt. In 2025, we continued modernizing core platforms. This work is not always visible externally, but it is foundational. For example, we have improved the scalability of our backend systems through an ERP implementation, optimized our usage of cloud-based resources, and enabled faster product iteration, delivering more consistent experiences, and better use of customer and decisioning data. Additionally, our innovation team at Prague Labs is at the forefront of customer experience through the use of AI. As we look back on 2025, I want to highlight how AI has moved from an area of experimentation to one of real impact across the business. This was a year where AI became embedded into several aspects of how Prague operates, not as a separate initiative, but as a set of capabilities directly supporting growth, efficiency, and execution. The focus was simple. Apply AI where it improves speed, decision quality, and outcomes for customers, retailers, and our teams. In 2025, we embedded AI across operations and customer engagement. Piper Plus, our internal AI assistant, resolved over 18,000 inquiries with more than half handled on first interaction, improving efficiency and reducing friction. Our AI-enabled flexible lease engine improved decision speed by approximately 75% and lifted marketplace conversion, while AI-driven marketing delivered stronger returns and lower acquisition costs, all supported by robust governance and human oversight. Equally important, in 2026, we are focused on enabling our people. More than 600 knowledge workers have access to secure AI tools for everyday use and the development of digital agent employees. We're not building AI for specialists. We're making it accessible across the organization. Our focus is on scaling these capabilities, including the deployment of more autonomous digital agents to drive productivity, quality, and function-level efficiency. We view this as a continuation of the same strategy, disciplined execution, practical application, and long-term value creation, using AI as a lever to make Prague faster, smarter, and more scalable. Enhancing the experience is not just about usability. It's about trust, repeat engagement, and creating relationships that extend beyond a single transaction. Under our expand pillar, we are focused on growing our offerings through new product innovation and added capabilities. In 2025, refinement of our decisioning posture was a clear example of this approach. We tightened approvals where necessary to protect portfolio health while simultaneously progressing on capabilities with improved data and analytics to match customers with the right product, whether that was leasing, for, or money out. This allows us to preserve access responsibly by improving overall outcomes. Four scaled rapidly, delivering approximately 132% revenue growth in Q4 and 170% for the year. Q4 was the ninth consecutive quarter of triple-digit GMV in revenue growth, and engagement trends remained strong throughout the year, with average purchase frequency of approximately five transactions per quarter and more than 164% growth in active shoppers year-over-year. New shoppers grew approximately 168% year-over-year, representing a healthy leading indicator of platform expansion. Additionally, our 4-plus subscription model is a key driver, staying consistent with over 80% of GMV coming from active subscribers. Ford's take rate of approximately 10%, defined as revenue generated as percentage of GMV over the trailing 12-month period, is an indicator of monetization efficiency. From a profitability standpoint, Ford generated adjusted EBITDA of $9.9 million in 2025, representing a 13.5% margin on revenue. MoneyApp approached breakeven adjusted EBITDA as it exited the year, reflecting improving standalone economics, while also driving incremental leasing volume through cross-sell. With profitability improving, we can increasingly focus on scaling the product responsibly to drive greater customer engagement and generate incremental value for prod. Finally, the sale of the Vibe portfolio in early Q4 2025 was a strategic realignment of capital and not an exit from serving our customers. We freed up resources to reinvest in products with better strategic fit and return potential. Looking ahead, purchasing power further extends this pillar, expanding reach into a differentiated channel and customer base. The business aligns with our long-term vision of delivering flexible, inclusive financial solutions while improving customer lifetime value across the platform. As purchasing power integrates into the Prague ecosystem, we see opportunities to drive cross-product engagement, leverage shared data and decisioning capabilities, and enhance partner value. What ties, grow, enhance, and expand together is the ecosystem. Growth is enhanced because products feed one another. Experience is better because systems and data are being unified. Innovation is more impactful because access is deliberate and connected. This is how we are building a more resilient, scalable prog, one that we believe can perform across cycles to create long-term value for customers, partners, and shareholders. While Brian will provide more detail on our 2026 outlook, I'd like to share our perspective on the macroeconomic backdrop as we enter the year. As we look ahead to 2026, we plan for an operating environment that remains challenging, particularly for the consumer segments that our products serve. While the rate of inflation has moderated, elevated prices for essential goods and services continue to pressure discretionary income. Big-ticket retail categories, such as furniture and appliances, remain under pressure. And in our leasing segment, we begin the year with a smaller lease portfolio, down 9.4% year-over-year, which creates revenue headwinds. That said, we also see offsets. Higher expected tax refunds in 2026 should provide incremental liquidity and near-term support for demand and repayment behavior. Our pipeline with large retail brands and employers remains active. Frog Marketplace and our direct-to-consumer channels, including four, continue to scale, expanding customer reach and long-term strategic optionality. Importantly, we begin 2026 with a leaner cost structure following SG&A reductions in the leasing business, preserving our ability to invest in high ROI initiatives while improving downside protection and operating leverage. The realities of this operating environment are reflected in our 2026 planning assumptions. However, our strategy is clear. We will reinvest in the business following our three-pillared strategy to grow, enhance, and expand, with an emphasis on our multi-product offering. We believe this approach, spanning leasing, for money app, and purchasing power, positions Prog to serve customers more holistically, improve lifetime value, and deliver sustainable, profitable growth over time. From a capital allocation perspective, our priorities remain consistent with what we've previously outlined, which is investing in the business, pursuing targeted M&A opportunities, and returning capital to shareholders through share repurchases and dividends. In the near term, we will focus on prioritizing debt reduction as we work toward our long-term net leverage ratio of one and a half to two times. Before I close, I'd like to welcome Lee Wright to the Prague Leadership Team as President of Purchasing Power. Lee brings more than three decades of leadership experience across retail and consumer finance, including his most recent position as CEO of The Vitamin Shop. He has deep expertise in credit, collections, and capital markets. Lee's operating discipline and experience scaling consumer finance platforms make him well-suited to lead Purchasing Power's next phase of growth for Prague. We're excited to have him on the team as we integrate the business and unlock its long-term potential. In summary, 2025 was a year of discipline and progress. We navigated disruption, made deliberate trade-offs to protect portfolio health, delivered strong margin performance, executed a strategic divestiture, announced an acquisition, and delivered exceptional growth in four. We entered 2026 with a resilient foundation, clear focus, and growing momentum across our ecosystem. I'm proud of our team's execution as we strive to create long-term value for our customers, partners, and shareholders. With that, I'll turn the call over to Brian for more detail on the Q4 financial results in 2026 outlook.
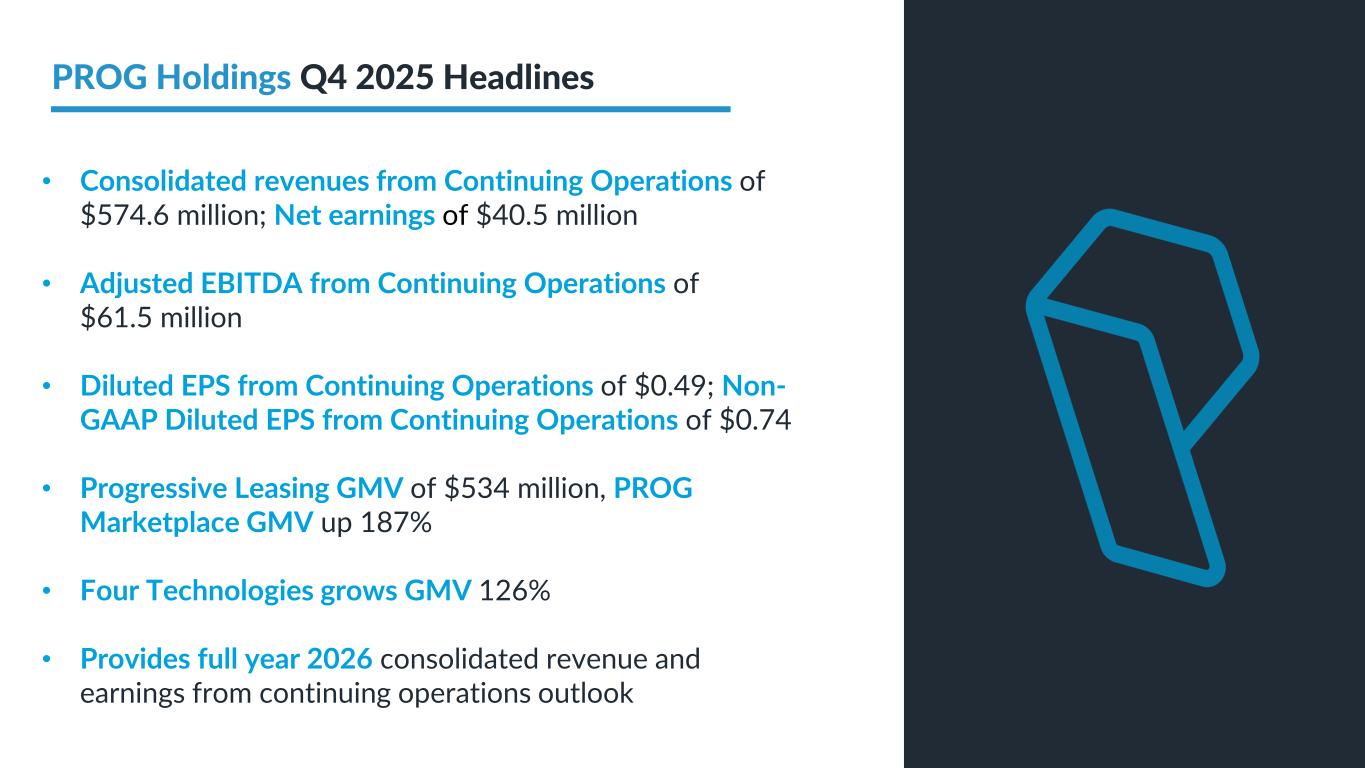
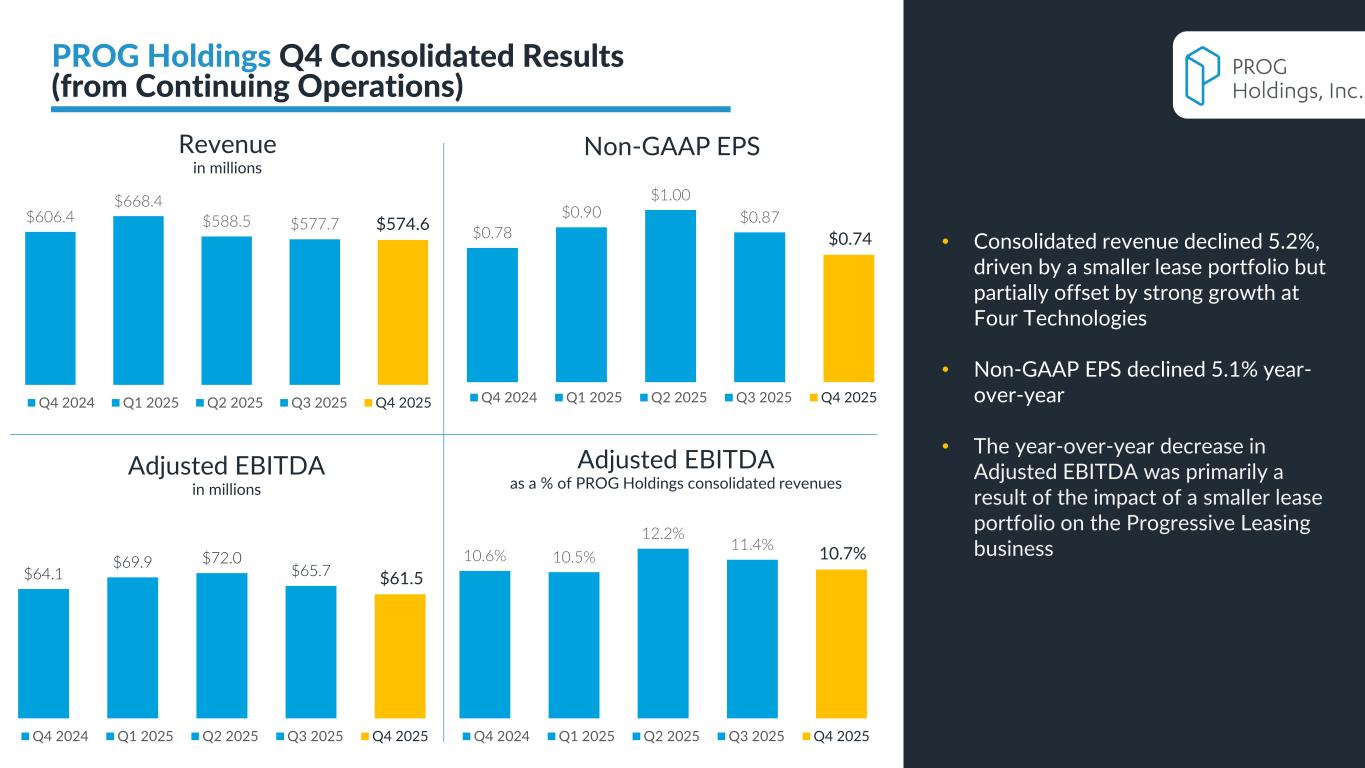
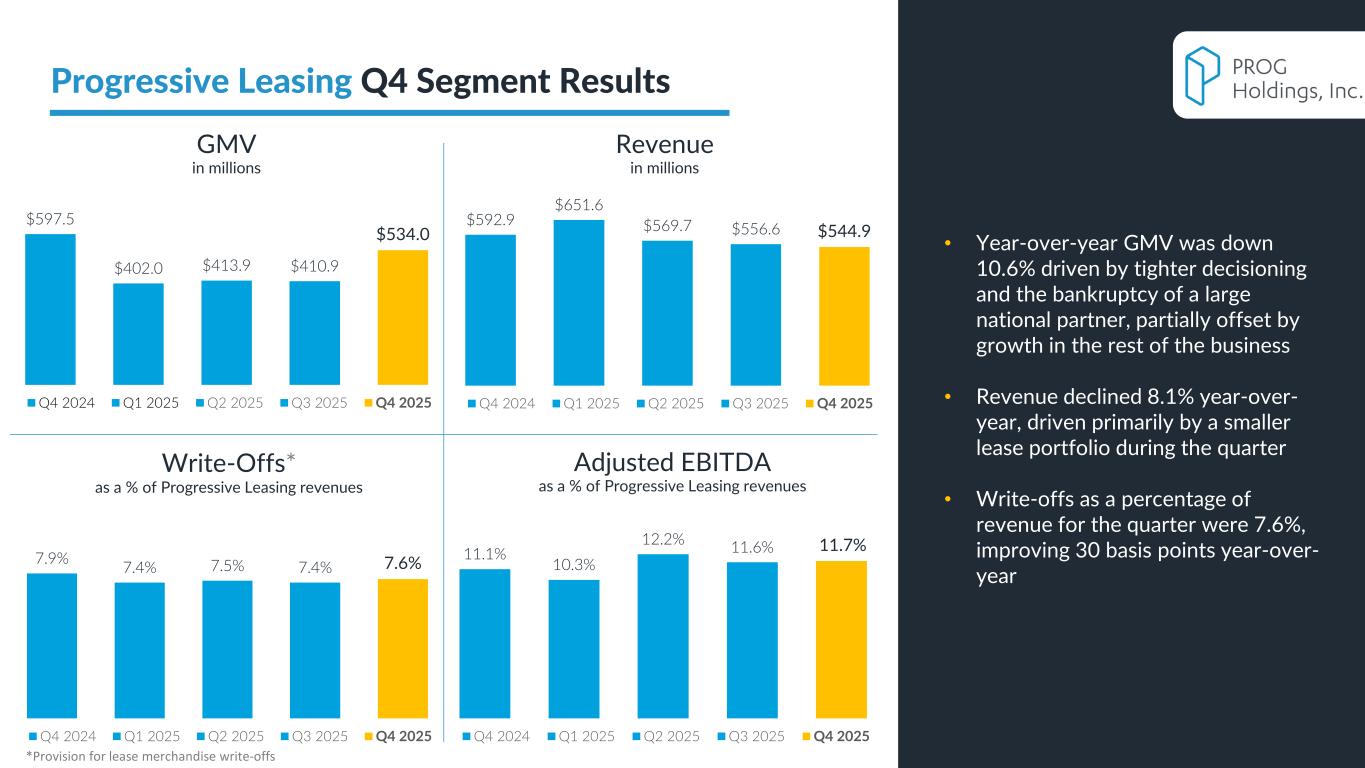
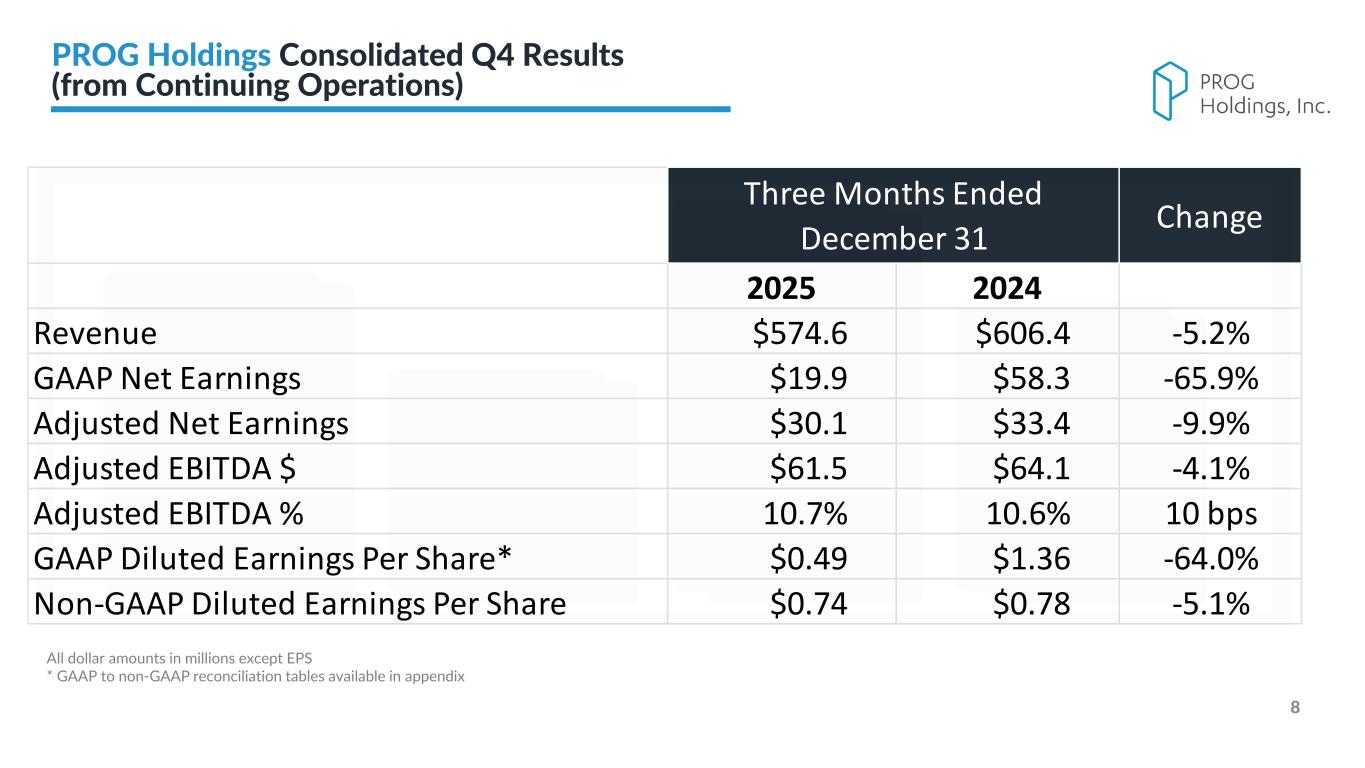
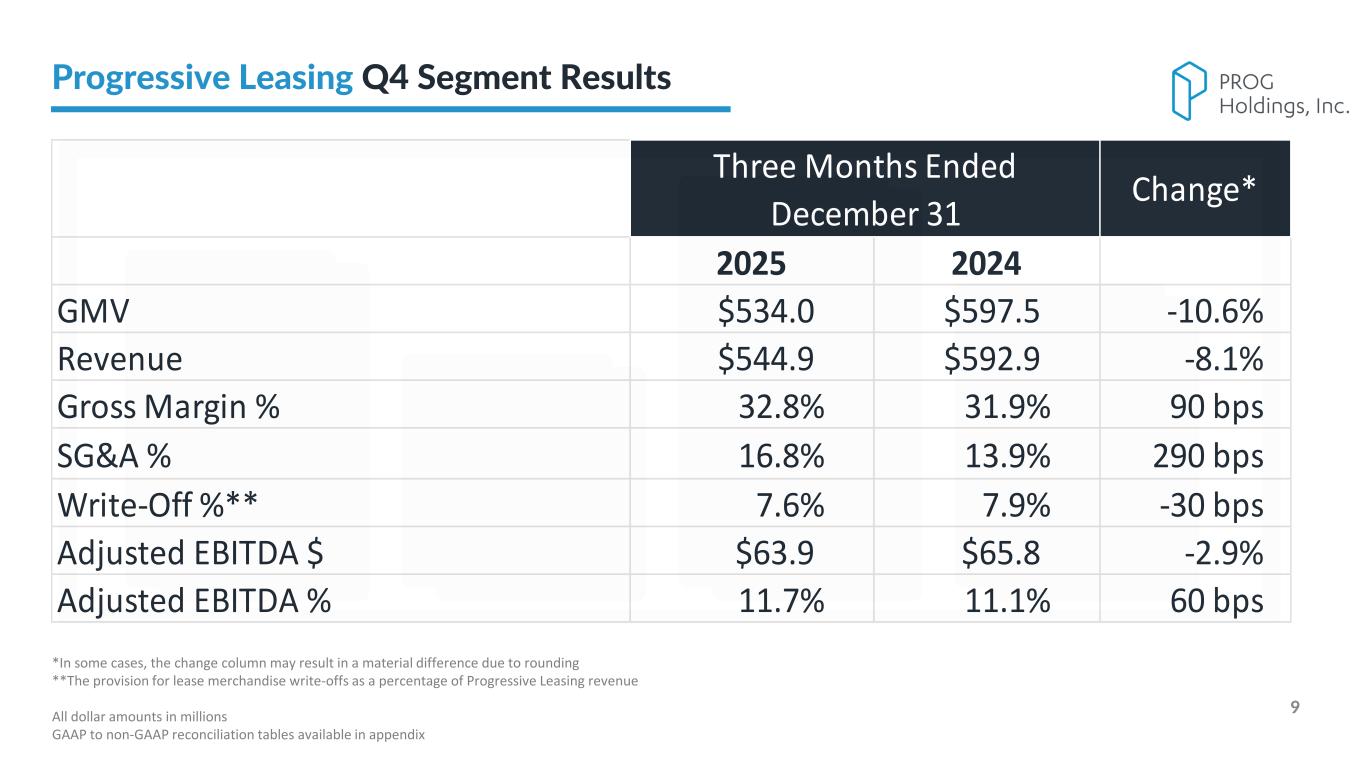
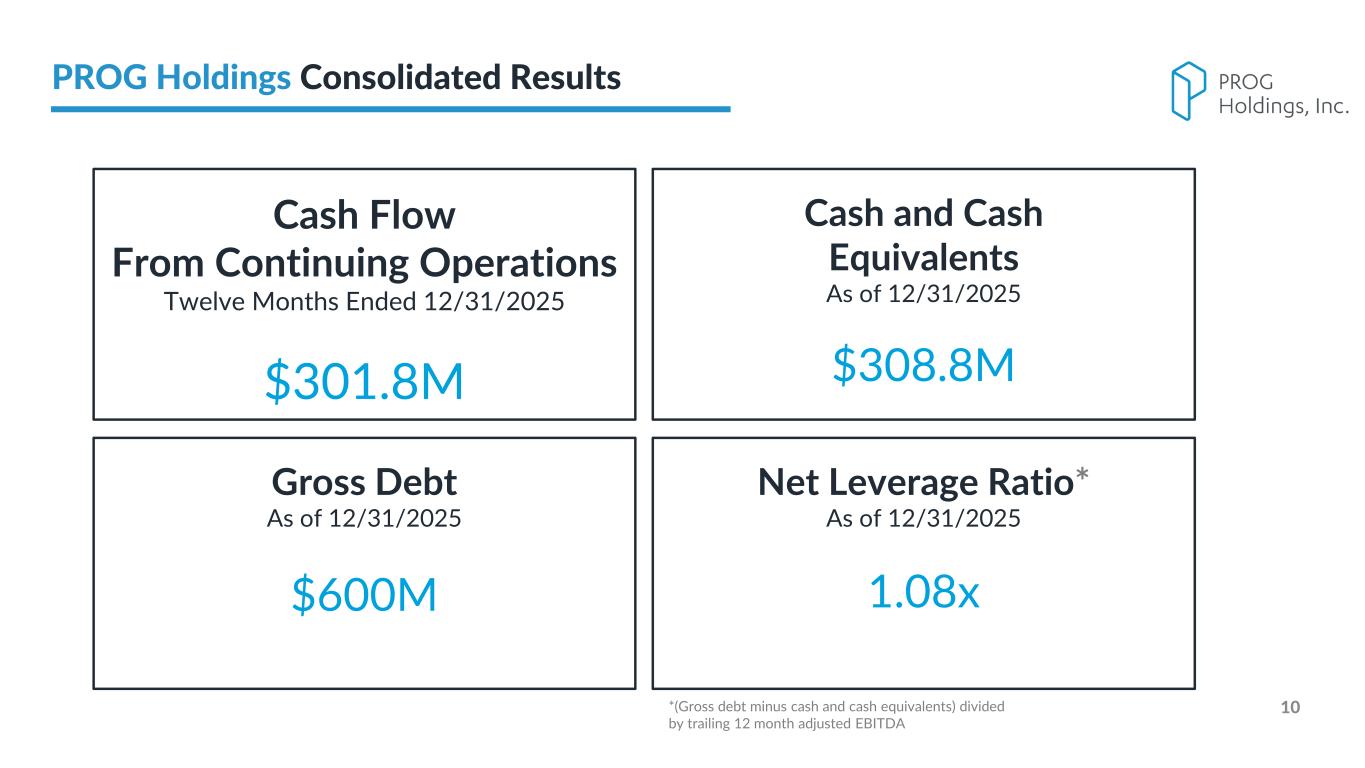
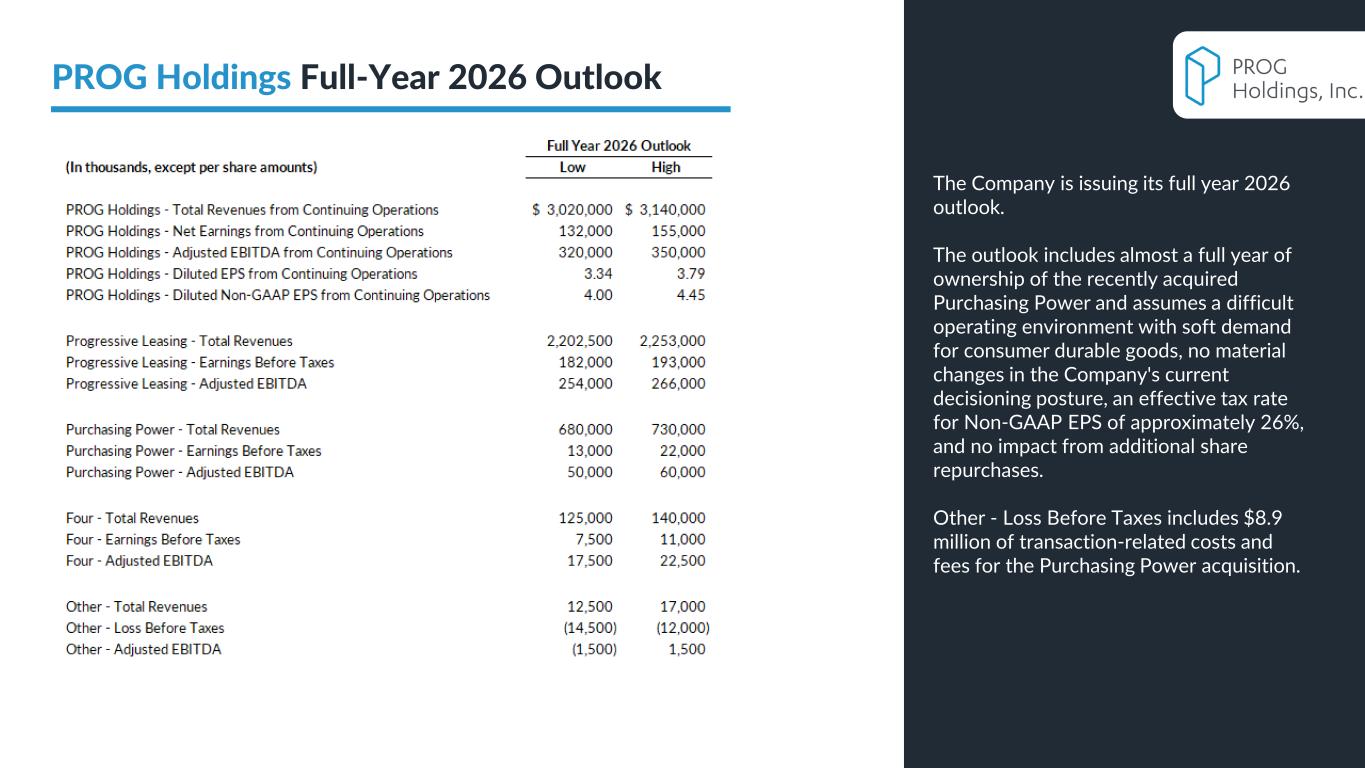
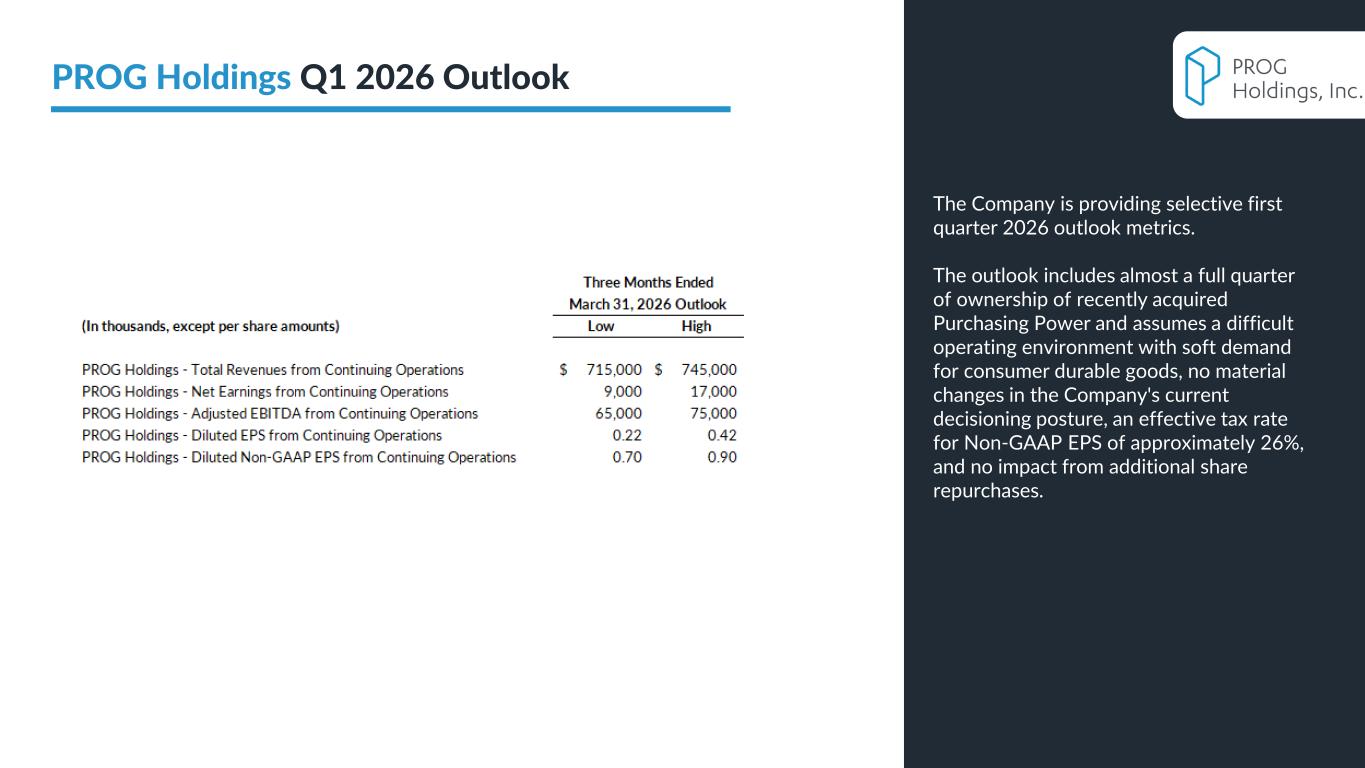
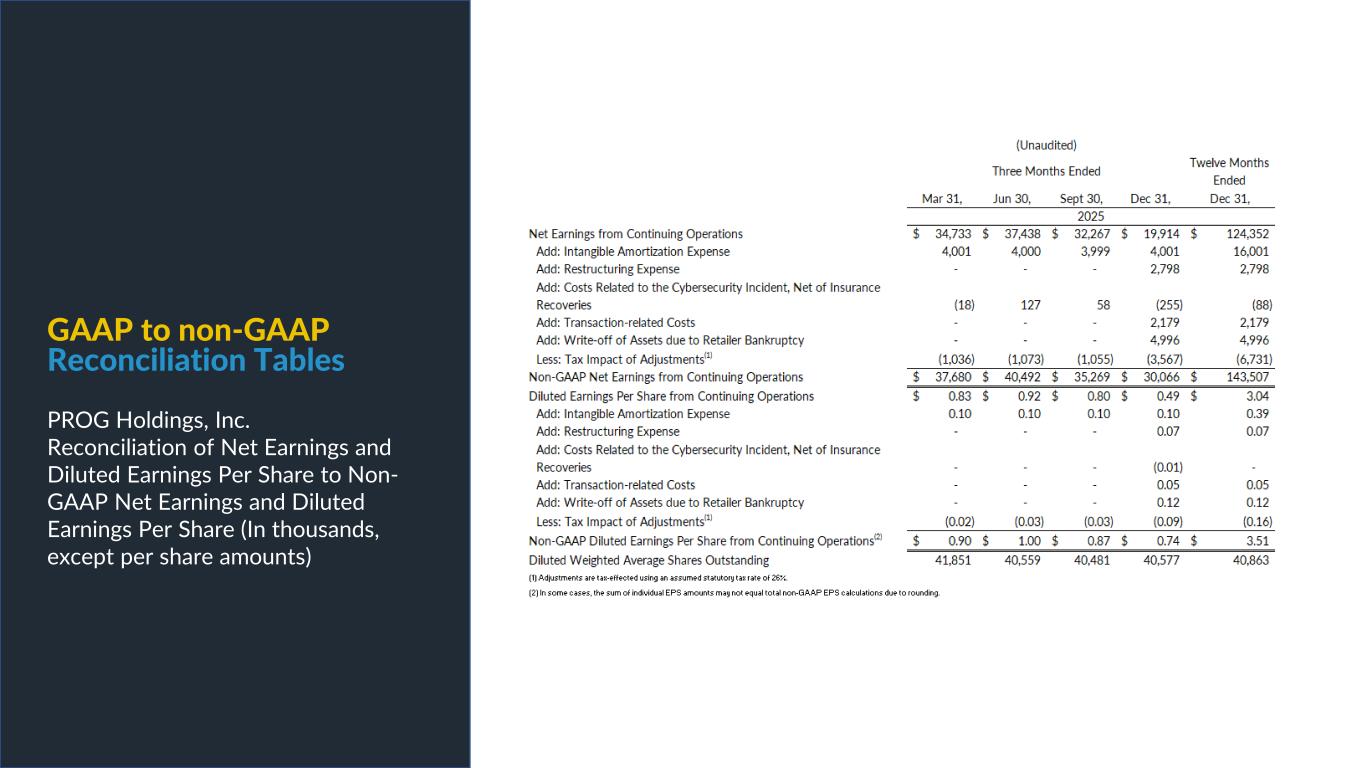
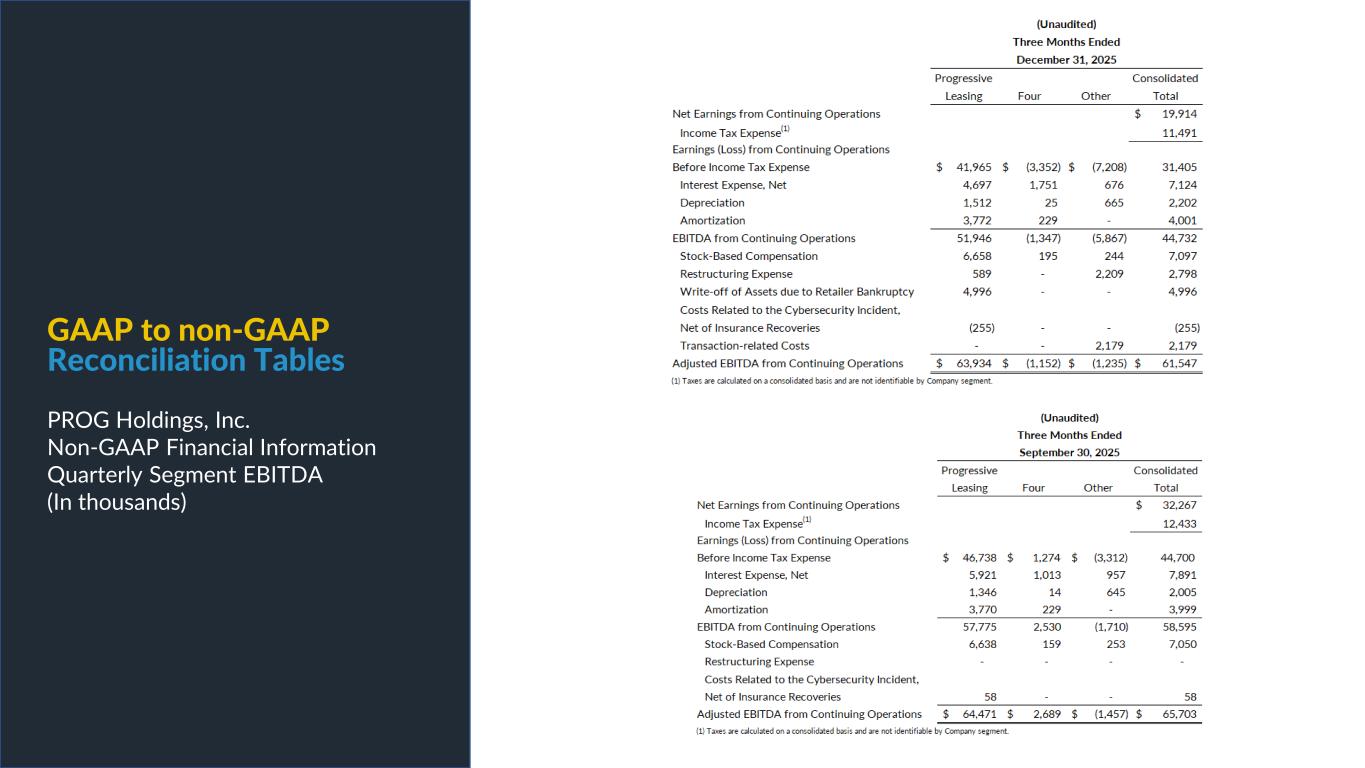
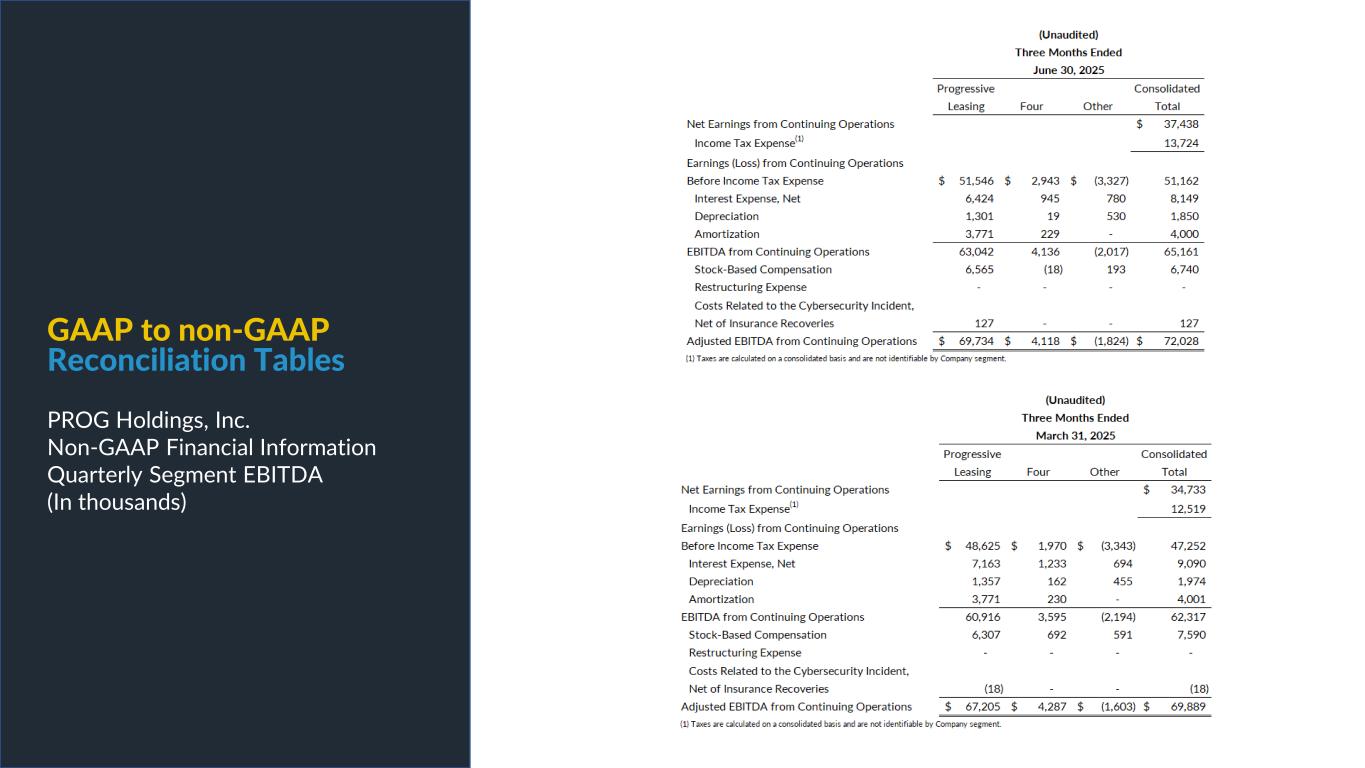
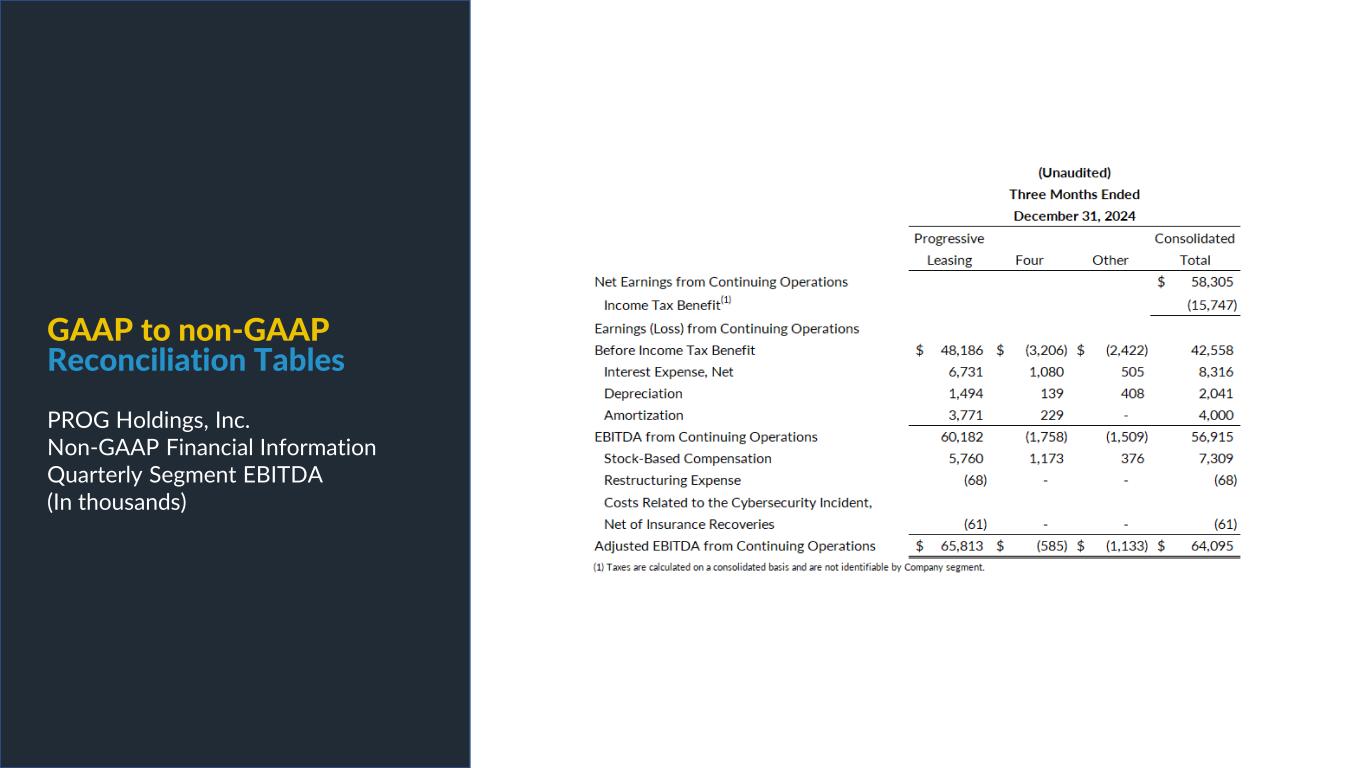
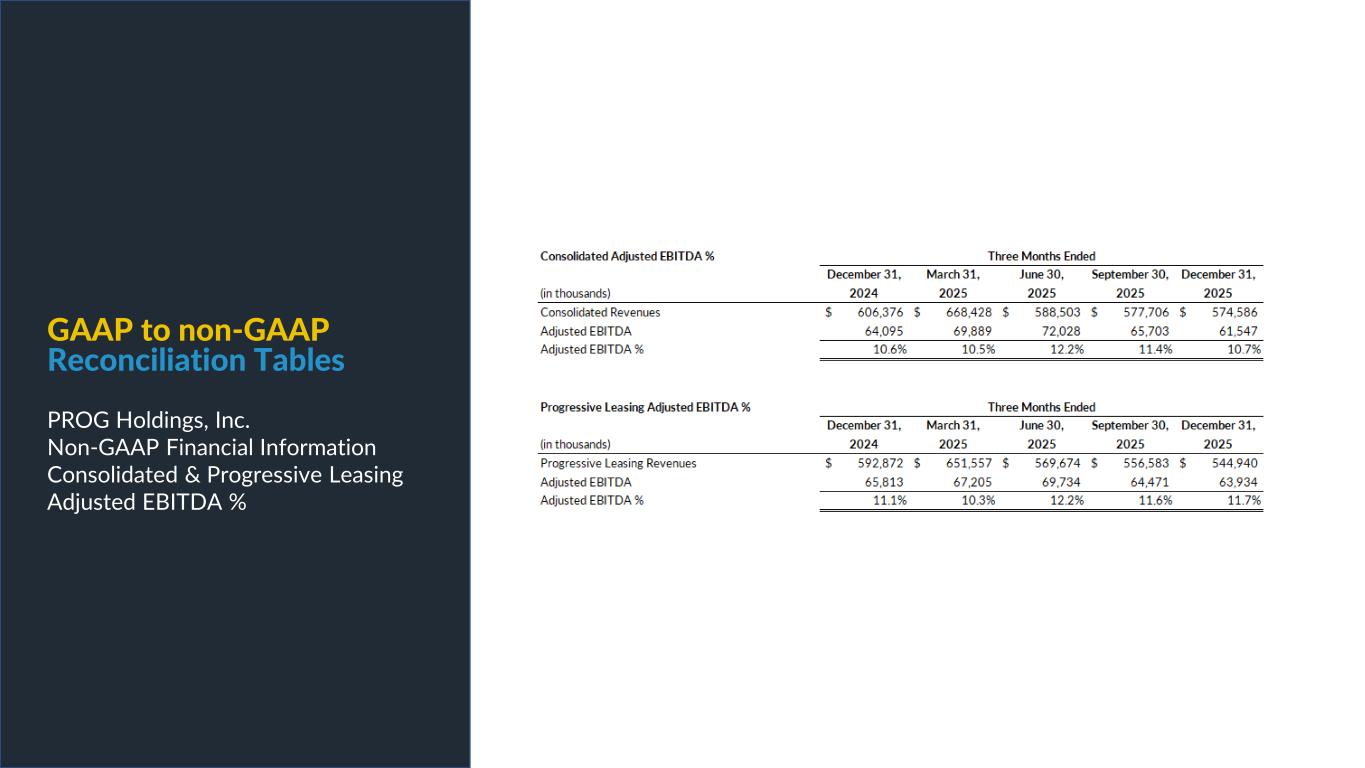
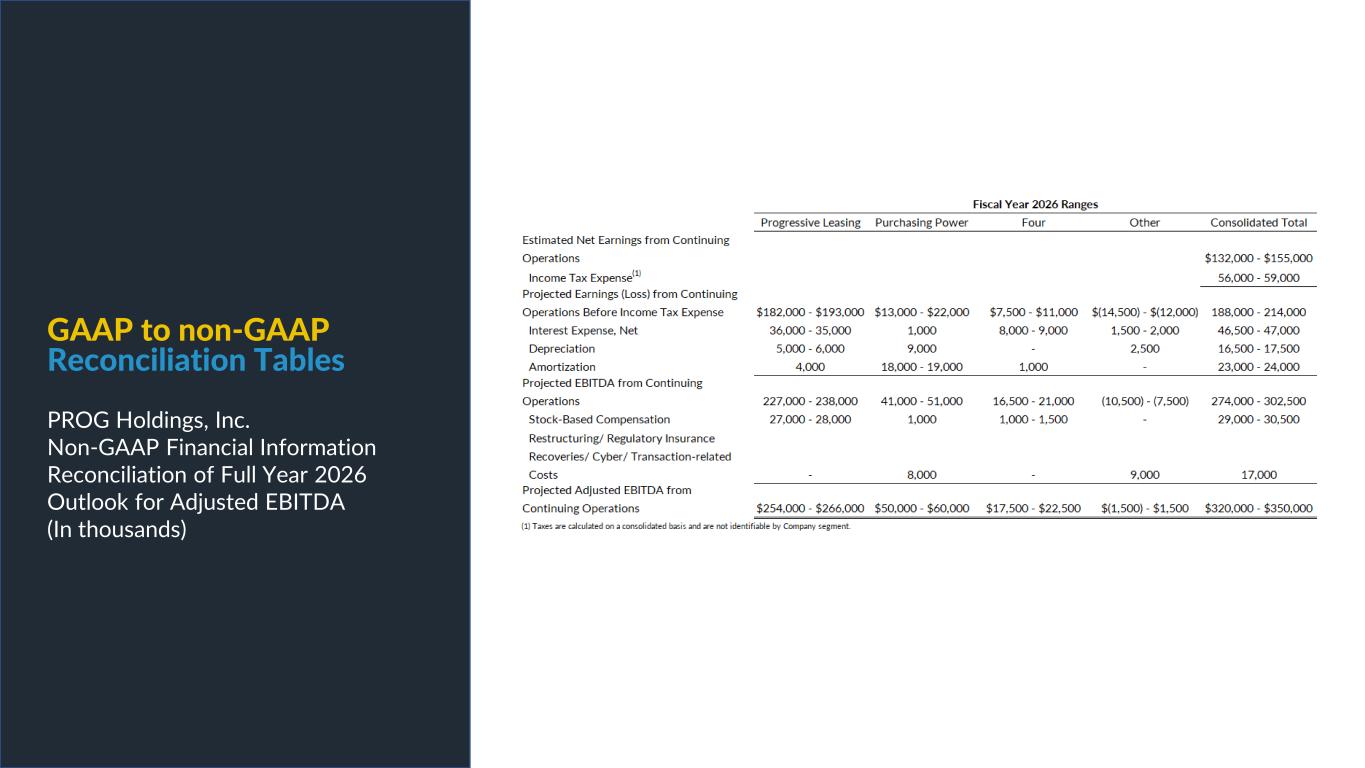
Brian? Thanks, Steve, and good morning, everyone. Before I get into the financial details, I want to echo Steve's comments and acknowledge the team's execution in 2025. Delivering essentially flat adjusted EBITDA for the year and within the original outlook range of $260 to $280 million provided in February reflects disciplined management of the factors within our control alongside ongoing investment in the long-term earnings power of the business. I'll start with a summary of the fourth quarter results, then cover consolidated performance for the year, discuss the balance sheet and capital allocation, and finish with a few comments on our 2026 outlook. As a reminder, VIVE, which we sold in October, is reflected as discontinued operations in both the fourth quarter and full year results. We are pleased to highlight that for continuing operations, Q4 consolidated revenues were within our outlook range provided in October, and our adjusted EBITDA of $61.5 million, along with a non-GAAP EPS of 74 cents, exceeded the high end of this outlook. Our fourth quarter results were consistent with the trends we saw throughout 2025, disciplined portfolio management and leasing, and execution across our diversified platform with triple-digit growth of four technologies. Despite GMV and revenue headwinds in our leasing segment we delivered margin expansion through healthy portfolio performance partially offset by investment in growth in strategic growth initiatives beginning with the progressive leasing segment fourth quarter gmv declined 10.6 percent year over year driven primarily by two factors the impact of the big lots bankruptcy and our intentional tightening actions excluding approximately 40 million associated with big lots and 30 million related to decisioning underlying gmv grew one percent year over year despite ongoing pressure on our consumer digital channels continued to be a bright spot with prog marketplace gmv increasing 187 percent year over year reinforcing the value of our investments in direct consumer and omni-channel capabilities progressive leasing's q4 revenue of 545 million declined 8.1 percent year over year reflecting the smaller portfolio throughout the quarter despite this headwind gross margin expanded approximately 90 basis points driven by higher portfolio yield and a greater proportion of customers remaining in their leases longer provision for lease merchandise write-offs was 7.6 percent of revenue in the fourth quarter an improvement from last year and within our targeted annual range of 68 percent for the full year write-offs were seven and a half percent reflecting our visibility and expertise that informed our tightening actions and disciplined portfolio management. Progressive Leasing's SG&A was $91.4 million, or 16.8% of revenue in the quarter. The year-over-year increase was primarily driven by approximately $5 million of one-time costs related to a partner bankruptcy and incremental investments in technology and infrastructure to support future growth. Adjusted EBITDA for the Progressive Leasing segment at $63.9 million declined modestly, reflecting the impact of a smaller portfolio, partially offset by margin expansion of 90 basis points, driven by higher portfolio yield and the sale of aged receivables. Q4 adjusted EBITDA margin for progressivation came in at 11.7% and 11.4% for the year, which is within our 11 to 13% annual margin target. Turning to our other businesses, Ford delivered another quarter of triple digit GMV in revenue growth. While Ford reported an expected adjusted EBITDA loss of $1.2 million in the fourth quarter due to seasonal dynamics and upfront provisioning for holiday originations, performance for the full year was strong. In 2025, Ford generated approximately 736 million of GMV, representing 144% growth year-over-year, and delivered approximately 10 million of adjusted EBITDA, a meaningful improvement from a loss in 2024. These results reflect improved unit economics, disciplined underwriting, and increased scale across the platform. MoneyApp also performed in line with expectations, reaching approximately adjusted EBITDA neutral performance for the quarter and playing an increasingly important role as an engagement and cross-sell engine. MoneyApp drove significant incremental leasing GMV in 2025, reinforcing the value of our ecosystem approach. At the consolidated level, fourth quarter revenues from continued operations declined 5.2% year-over-year to $574.6 million, reflecting the smaller leasing portfolio, partially offset by triple-digit growth at four. Consolidated gross margins improved 284 basis points to 36.3%, driven by margin expansion and progressive leasing and a shift towards higher margin for revenue. Consolidated SG&As from continuing operations for the quarter increased to 19% of revenue, reflecting investments in technology and the previously mentioned one-time partner-related costs. Consolidated Adjusted EBITDA declined 4% year-over-year to $61.5 million, or 10.7% of revenue, as lower leasing profitability weighed on consolidated results. For the full year, Consolidated Adjusted EBITDA from continuing operations totaled approximately $269 million, or 11.2% of revenue, and non-GAAP diluted EPS was $3.51, both exceeding the high end of our outlook we provided in October. Turning to the balance sheet, we ended 2025 with $308.8 million of cash and total available liquidity of approximately $659 million, including our revolving credit facility. Net leverage at December 31st of 2025 was 1.1 times trailing 12 months adjusted EBITDA. As previously disclosed, following the acquisition of purchasing power on January 2nd of 26, net leverage increased to approximately two and a half times. Importantly, these leverage metrics exclude the non-recourse ABS debt used to fund purchasing powers operations. In 2025, we generated healthy operating cash flow and returned capital to shareholders through dividends and share repurchases. We repurchased approximately 1.8 million shares at an average price of $28.20 and paid dividends totaling $0.52 per share for the year. We did not repurchase shares in the second half of 2025 due to advanced discussions related to the divestiture of the VIVE Portfolio and Purchasing Power Acquisition. Our capital allocation priorities remain unchanged, investing in the high return growth initiatives, pursuing strategic M&A opportunities, and returning excess capital to shareholders. Near term, our focus is on integration and execution following the Purchasing Power Acquisition, alongside meaningful progress towards bringing net leverage back into our long-term target range of one and a half to two times. This target excludes non-recourse ABS debt used to fund purchasing power operations. Let me now touch on some key aspects of our 2026 outlook as outlined in this morning's earnings press release. For progressive leasing, both first quarter and full year 2026 results will be influenced by the 9.4% lower gross leased asset balance entering the year, which will pressure revenue, particularly in the first half of 2026. As the year progresses, we expect revenue trends to improve as portfolio growth resumes and the benefits of our strategic initiatives compound. Progressive leasing's portfolio performance is expected to remain within targeted yields as we actively manage decisioning dynamics. We anticipate modest gross margin expansion driven by higher yield trends exiting the back half of 2025, and we expect leased merchandise write-offs to deliver another year of consistent performance within our targeted annual range of 68%. We expect Progressive Leasing to SG&A to remain flat to 2025 as a percentage of revenue and EBITDA margins to expand, reflecting our deliberate effort to align expenses with the revenue trajectory while continuing to prioritize high-return initiatives. Our approach remains disciplined, eliminating unnecessary costs and managing spend through a portfolio lens to optimize return on investment. Turning to our other segments, Purchasing Power is expected to contribute $680 to $730 million of revenue and $50 to $60 million of adjusted EBITDA for the full year. While we typically do not provide quarterly outlook for operating segments, Purchasing Power is new to our portfolio, and we think it's important to highlight the seasonal dynamics of this e-commerce business. Historically, Q1 is the lowest revenue earnings quarter of the year, and as such, we expect Purchasing Power's first quarter to be roughly break-even on an adjusted EBITDA basis. For the balance of the year, it follows similar trends as holiday-centric retailers, with fourth quarter contributing the most revenue and earnings. We expect for technologies to deliver another year of significant revenue growth alongside expanding adjusted EBITDA margin as the platform continues to scale. Turning to 2026, consolidated outlook for continuing operations, we expect revenues to be in the range of $3 billion to $3.1 billion, adjusted EBITDA in the range of $320 million to $350 million, and non-GAAP EPS in the range of $4 and $4.45. This outlook assumes a difficult operating environment with soft demand for consumer durable goods, no material changes in the company's decisioning posture, an effective tax rate for non-GAAP EPS of approximately 26%, no material increases in the unemployment rate for our consumer, and no impact from additional share repurchases. In closing, 2025 demonstrated the resilience for our business model and the benefits of disciplined execution. Despite meaningful headwinds, we protected portfolio performance, invested for the future, strengthened our ecosystem, and improved the long-term earnings power of the company. As we enter 2026, we remain confident in our ability to navigate a challenging environment while continuing to build long-term shareholder value. I'll now turn the call back over to the operator for questions. Operator?
Operator
Certainly. As a reminder, to ask a question, please press star one one on your telephone and wait for your name to be announced. To withdraw your question, please press star one one again. Please stand by while we compile our Q&A roster. And our first question will be coming from Kyle Joseph of Stevens. Your line is open.
Hey, good morning, guys. Thanks for taking my questions. A lot of a lot of positive things going on. And, yeah, welcome back – or welcome, Lee. But, yeah, I wanted to dig in on purchasing power a little bit. Obviously, you know, that's one of the businesses we're least familiar with. But just give us a sense for how you expect that segment to perform, maybe versus 25. Appreciate the color you gave on seasonality. But kind of how you're thinking about that business in terms of growth versus 25. and then, you know, what sort of levels of synergies you expect in 26 and, you know, if there's any incremental juice to squeeze beyond that. Thanks.
Yeah, good morning, Kyle. Yeah, we're excited about purchasing power. Obviously, we closed it here 45 days or so ago. The outlook that we provided this morning was consistent with what we gave when we did the announcement back on December 1st, I think it was the date, That revenue outlook implies a low double-digit revenue growth for the business, and so we'll continue to push on that and hope that the combination in the Prague ecosystem can help to drive that growth and hopefully beyond. On the earnings front, on the adjusted EBITDA front, you know, we're looking at a kind of 7-ish, 7-8% adjusted EBITDA margin. Just a reminder that adjusted EBITDA is burdened by the interest expense from the ABS transactions or the ABS facilities. And, you know, we look for opportunities to expand that EBITDA margin over time. We believe that we can get it into kind of the low double-digit range similar to leasing, but that's not a 26 commentary, probably not even a 27. It depends on how successful we are at growing the business because scale is really the way that we're going to drive the EBITDA margin. There's also some efficiencies and some opportunities from a synergy standpoint by being part of Prague from a data and tech and other shared services type stuff. But we really are looking to grow the business and take advantage of the revenue synergies, which we didn't really include in 2026's outlook because, you know, you have to capture them first. But there's, we believe, tons of opportunity across the retail partners that we serve, the employer clients that happen to be retailers that Purchasing Power serves, as well as cross-marketing different products within the Purchasing Power system. So we're excited about the opportunity. We're hitting the ground running and moving as fast as we can. It's not going to be straight up and to the right, as it never is with integrating and acquisitions. but we're excited about what we can accomplish there.
Great. Really helpful. And then shifting to the credit for the outlook, I know you guys talked about, at least on leasing, you know, remaining within your kind of your goalposts in terms of loss expectations. But, you know, just walk us through some of the puts and takes. Obviously, you know, macro isn't perfect by any means. You know, you guys tightened underwriting there. A lot of headlines about, you know, elevated tax refunds. And I think, you know, historically we focused on leasing. I think if you could give us kind of your sense for credit outlook by product, given some of the other contributions, particularly for and purchasing power, I think that'd be helpful.
Yeah, I can start. And, Steve, anything you want to add? Good morning, Kyle. Yeah, I think just starting with progressive leasing and what's baked into our view for 26 from a credit perspective. So we're encouraged by what we're seeing thus far in terms of the outcome of our tightening efforts a year ago. And we have not had the need or seen the data reason to tighten substantially or make more significant moves. So I like where we're sitting. I like what we saw here in Q4 with a 7.6% write-off for leasing. That's improved from a year-over-year perspective about 30 basis points. And I think as we're watching these early indicators, whether it's news on the student loan front or pressure on the subprime consumer more broadly, we're watching, as you see in auto delinquencies and elsewhere, those are all data inputs that we're actively managing. And we're feeling comfortable about our current decisioning posture, but we will continue to watch it. I think just kind of stepping through to four, you know, you have observed kind of, you know, I just want to draw your attention to and maybe everyone's attention to some additional details on four that are provided here as we've reported out as a separately as a segment for four for all of 2025. And you can, there's additional details from the K that will be forthcoming here this morning. But here in the earnings release as well, you're able to see kind of the provision that is attributed directly to four, and you can see their performance there. You know, the biggest driver for four under CECL accounting and the short-term duration of their instruments. Really what's going to be driving that is growth to a large degree, particularly in Q4 as they accelerate. And that's what you see in the tables that we've provided. There's kind of a Q4 buildup of the other provision. I think what is implied in our guidance, and this is very directly tied to the credit picture, is we're expecting improvement in overall EBITDA margins for four. The midpoint of our guidance is just over 15% for four, and that's up from about 13.5% in 2025. And so that's going to come with scale. Scale is going to drive that. Efficiency is going to drive that. But the credit performance side is as we get smarter with decision, smarter with underwriting. So I don't want to commit to a specific number with four. We haven't given guidance on that. I would just say that that team has been finding ways to drive margin expansion and will maintain credit discipline along the way with four in order to hit our targets here. And so we're moving EBITDA margin the right way at four, and the credit picture is obviously part of that formula. And then purchasing power, there is not, you know, we have not provided any details on the LOMAS provision around purchasing power. That's kind of a short-term situation here. Middle of next month, you're going to see some required disclosures that we need to make around the historical financials of purchasing power. um and you'll you'll see kind of 2020 uh for audited financials uh pro pro for a year to date as 9 30 you're going to see some some information so you'll be able to get a a better picture of kind of um how their pnl is built up but obviously we're reported on q4 so we don't have any other financials rolled up to here but i would just say that that's that's a controllable dynamic for us we and we are from at a starting point we feel there is a tremendous amount of opportunity for us to overlay our expertise we we feel that we've developed over the years uh to that business and and leverage um leverage our knowledge around this consumer and and how best to serve them and so i'm i think there's plenty upside on on that front is what but I would say on the family.
Thanks, Brian. Really helpful. Last one for me, and I can get back in the queue. I was going to, you know, given where we are in the air, going to ask the obligatory pipeline question, and I'm still curious to hear your perspective there, but I also want to ask about kind of the evolution of the sales process now that you guys have so many different products available.
Yeah, Kyle, maybe I'll let somebody else ask the pipeline question, But, I mean, you're talking about the biz dev, the pipeline with the different products. Yeah, I mean, we're incorporating For and Money App into our discussions as it relates to our existing relationships. And we expect, as we move forward, Purchasing Power will have additional products on its voluntary benefits platform. that will help with landing new employer clients as well. So it continues to evolve as our overall ecosystem strategy, and we'll certainly talk more about that at the Investor Day.
Great. Thanks for taking all my questions.
Operator
And our next question will be from Harold Grosch of B. Raleigh Securities. Harold, your line is open.
Hey, guys. Thanks for all the information and detail. I wanted to ask about purchasing power and the ABS transactions they do that are embedded in the cost. I was like, how long has purchasing power been an ABS issuer, and what kind of interest rates are they charged? I mean, what's their cost of capital for those transactions historically, Ben, and what do you think you can do embedded in you with a larger company?
They've been in the market for, I'll say, many years. i don't know the exact number of years but they're a seasoned issuer um we are actually in the market right now uh to uh replace a an expiring facility the 2024 a facility um and uh you know uh we expect that uh we can improve on those economics but we can't commit to anything until until the deal is close.
Okay. And in the BNPL segment, you know, the growth is just, you know, best in class. Maybe you could just give us qualitatively, you know, basically growing 2x, even the next closest peer, maybe from a smaller base, but maybe you could share with us your thoughts on qualitatively, quantitatively, how this growth has been outstanding, and any commentary on losses and merchants that you're having success with. Thanks.
Yeah, and kudos to the team. They're doing an awesome job, and I don't want to take anything away from the team, but I would point to what you said, which is kind of, it's from a smaller base, but we do, we're very, very excited about uh about the ability to acquire customers both organically and then through a paid uh paid marketing motion um and we saw very uh strong acceptance if you will of the product in the back half and expect that to continue in 2026 um our four plus subscription services is why wide acceptance and actually exceeding our expectations as it relates to active subscribers You know, it does have churn like all subscription providers do, but it's below our expert, you know, below what we had forecast. And we basically executed through the holiday season with a higher base, which helped for us to outperform our internal forecast for the quarter. You know, we're having – it's a direct consumer model, right? So it's not really based on merchant traffic in their checkout card. It's flowing through the 4 app, which has great user reviews, star ratings. It's highly ranked in the app store, depending on where we are in the market from a paid marketing standpoint. And we're really seeing a nice balance of customer acquisition, repeat usage, and broadening that platform. So, you know, when the law of big numbers kicks in, I do expect that the growth rate will decelerate, but it'll decelerate from a very high level, to your point. And we put out some guidance this year that implies a growth rate, and that team is highly motivated to even beat those growth rates, and will do it in a disciplined way. We are continuing to tweak and optimize the underwriting, but there's some seasonal dynamics to that where you do take on some more risk in fourth quarter, but that is still a high ROI action because you turn many of those new customers into de-risked repeat customers, and it helps to drive GMV as the rest of the year goes on. So, you know, we look forward to continuing to update you on the progress, and we expect the progress to be impressive throughout 26 and beyond. Excellent. Thank you.
Operator
And our next question will be coming from Brad Thomas of KeyBank Capital Markets. Your line is open, Brad.
Good morning. Thanks for taking the question. A lot of exciting things happening over there to ask about. but I maybe wanted to start with GMV if I could, and I think if I've tracked the numbers right, you said the underlying business X to tightening and big lots was up about 1%. I think that was a little softer than where you had been tracking in recent quarters. Just curious if there was any color on how things were trending, you know, by category or with partners or anything else that you'd seen here in the quarter.
Yeah, Brad, thanks. And yeah, as it relates to leasing GMV for the quarter, I would say that it was a little softer than our internal expectations. And, you know, it's always difficult to forecast GMV on the third week of October before the holiday season kicks in. But what we saw is really weakness in kind of late October and the first three weeks of November. And it's difficult to pinpoint it exactly, but the one kind of um data point that was out there was this government shutdown and it just seemed like there was maybe a little bit of hesitation on behalf of the consumers to to enter into the new deals and take on new originations and and that's not a commentary on on us having much exposure in the leasing business to government employees because we don't and to the extent we do it's mostly military and we're not even aware that they were impacted from a pay standpoint It just seemed to have kind of like a negative headline effect on trading, because what we saw is the Black Friday to Cyber Monday period was actually okay, and we had a decent, actually a nice rebound in December and had the best performance of the quarter, and actually best performance for a month in quite a while for 2025. So there was – the quarter came in a little bit below where we expected, and that was the cadence of it. It was a week-ish October, a week-ish first three weeks in November, and then a rebound into the holidays and into through Christmas.
That's really helpful, Steve. And as we think about GMV for 2026, a bright spot will be that, you know, Big Lutz headwinds start to get out of the system as we go through the first half. But I know you've had at least one other retail partner that's gone bankrupt. Can you help us maybe size how much of a headwind that will be?
Yeah, thanks. Yeah, so as we sit here, you know, in this first quarter, we expect by the end of February we will have kind of lapped both the Big Lots GMV headwind as well as the decisioning tightening that we kind of reported on all last year. And so it's our expectation that as we get into a clean quarter kind of in Q2, we'll see improving GMV trends. We're not going to be talking about that other – we're not going to have a repeat of 25 where every quarter we're talking about. the headwind related to the bankruptcy of that other partner because we're just going to execute against it and cover it up with hopefully growth elsewhere. So, you know, we look forward to getting into some calm waters, lapping those two discrete items that we talked about all of 25, and delivering some improving results, certainly in the first half, and then, you know, better than that in the second half.
I appreciate that, Collette. maybe moving on to cash flow. I apologize if I missed it. I know you guys are usually a very capital light business, but any color on where CapEx may be now that you own purchasing power, and particularly as we consider the impact of the one big beautiful bill, how are you thinking about free cash flow for this year considering the EBITDA guidance?
Yeah, I can start. Yeah, I think we're feeling good about the cash flow dynamic. You mentioned the one big beautiful bill that's um the impact of that uh that bill had about a call a 25 million dollar impact in terms of uh incremental uh cash impact in 25 and we expect you know we talked about nine nine figures so right around called 100 million dollars um in 26 and so the the cash generation there is is certainly positive as i as i just kind of think about the you know what i expect in in 26 is kind of work down the cash flow statement i think the progressive leasing segment is going to do what what it's really always done which is generate a lot of cash that gives a lot of optionality um and growth rates will will impact that but i think as you kind of you know look at what historical cash flow from operations has been um you know largely that's generated by the progressive leasing segment and i think um you know those are those are you know will stay within a reasonable range of what we've generated historically um kind of at these um projected growth levels and i think you know so so the questions are what do you do with that cash flow like steve mentioned um we're we're going to emphasize uh delevering uh our our balance sheet so we came out of the purchase power acquisition with uh about two and a half times excluding non-recourse debt we've got a we've got an emphasis on on paying down uh that debt and And I think, you know, it's not a stretch to say we'll be kind of approaching that two times turn pretty quickly here this year. So I think there's an emphasis on that. And then you look at, you know, what we're doing with cash flow from investing. You see the channel of cash flow into new loans at four, and we are pleased to send as much their way as we're able to originate with discipline. And so if we were to use up a meaningful portion of that cash flow from progressive leasing and channel it to four, I think that means we're doing the right things over there. And so there could be some cash usage there at four. And that purchasing power is largely going to, you know, they have optionality around their ABS facilities. And I think we'll kind of, you know, reassess and look to optimize where it makes sense, how we're utilizing cash versus leaning on the ABS. but the ABS picture will continue to be a meaningful part of how they're financing their business. And they have a strong cash flow profile as well.
So that's why I'd say just kind of if you're thinking through the gives and takes in cash, the net-net is we're going to have more than we need here this year to run the business, invest in new businesses, and also make other decisions. and our next question will be coming from bobby griffin of raymond james your line is open bobby good morning this is alessandra jimenez on for bobby thank you for taking our questions i first wanted to follow up on kyle's earlier question what do you think is the largest synergy opportunity within the purchasing power segment and what do you expect to benefit the pnl over kind of the early integration period versus a multi-year opportunity yeah I
mean the largest opportunity is to accelerate the growth rate of the business we've got a great even before we before we bought them they have a great install base of client partners but we believe we can help get better penetration into the existing eligibles which are you know basically they are the employer partners uh employees as well as add new new partners to the uh to the platform um and uh and also uh help with the direct consumer uh channel the what they call the ppc select or the ppc direct so um there's lots of scale opportunities that's the largest opportunity and that's what we're going to be driving at the same time just like we always do we're going to look for opportunities on the cost side and improvements in the data side and on the collection side. And we certainly underwrote some of that in our diligence process, but the growth side is where the most exciting synergies are.
And understand it's still early in kind of the tax return season, but are there any reads on how the tax returns are progressing so far this year no it's really early i mean uh there was one report from the irs last week that many people warned to just kind of ignore uh but um we expect next week and potentially that first week of march to be when all the uh all the action happens so we're uh we're standing by as well okay perfect thank you so much and best of luck here in 2026. thank you And our next question will be coming from Anthony Chacumba of Loop Capital Markets.
Operator
Your line is open.
Good morning. Thanks for taking my question. So my first question, this $5 billion write-off of assets due to retail bankruptcy, what exactly did that consist of? Was that like money that they owed you, or is that like, yeah, if you can just give a little color on that.
Yeah, I mean, sometimes, not in every case, but in some cases, when you initiate a new retail partnership that is a multi-year exclusivity, there's either an upfront payment or a prepayment of some type of rebate or something, and then, obviously, if that chain goes into liquidation, then you're not going to be able to generate any business from that chain anymore, and you have to take the unamortized portion of those economics through the P&L.
Got it. Okay. And then just in terms of the higher income tax refunds, my assumption would be that your expectation would be that would lead to a higher degree of early lease buyouts, 90-day buyouts. Is that a reasonable assumption in terms of what your expectation is?
Yeah, I mean, history would say that that is what could happen and has happened in previous tax seasons. So early, but also outside of early buyouts, it also helps with just regular repayment behavior and kind of some healing of the portfolio and some demand signals, hopefully. But increased liquidity in the customer's hands generally turn into some payoffs, which healthy for the portfolio also we have observed in previous years when when the the payments were delayed that it actually had a behavioral impact on the consumer and there weren't quite as many buyouts as we might have expected but we'll have to see what happens over the next three weeks or so and our next question will be coming from home dwind of td cohen your line is open Thank you and good morning.
Thanks for taking my questions. So I want to ask about the EPS guide. Looks like it's very, very strong. So you're guiding to almost 20% growth in EPS. But I understand that the product leasing business is kind of shrinking in 26. So can you talk about that mix of improvement and profitability between, you know, purchasing power coming in and maybe, you know, the improvement that you are seeing in four? So I guess that's where the improvement in profitability comes from.
Yeah, I think, I mean, you could look at the segment outlook that we gave. And the leasing business is pretty flat on an adjusted EBITDA basis. I mean, it depends on what point you pick in the guide. And then four is up and a smaller adjusted EBITDA loss and other. And then purchasing power, we've said we believe it's a double-digit accretive acquisition for 2026. So I think those are kind of the building blocks to the EPS guide.
And maybe I want to ask again on the tax refund season, because I think over the past, maybe three or four years, there were years when, you know, you guys kind of saw the Goldilocks environment, right, where people have the money, but they kind of stay in the lease for longer. And when they're very flush with cash and then, you know, they kind of pay down and that kind of crush the gross margin. So, I mean, I guess, I mean, how should we think about it this year? Because we're seeing average refund actually up 10% based on the earliest data. So, how should we think about which direction it's going? Thank you.
Yeah, I mean, that's, you know, we have, we don't know, right? We'll see how the customer behaves. Like I mentioned earlier, we have observed in the past that when refunds are delayed several weeks, that we see less 90-day buyout activity. We're not predicting, you know, Goldilocks, which was kind of a repeat of 2023 maybe, where people just stayed in the leases longer. We are seeing people stay in leases longer, but we don't think tax refunds are necessarily going to be a driver of that. and it really depends on how the there's a lot of reports on what the average size or the size of the average refund is and how that slices and dices between kind of someone making 40 to 100,000 versus someone over 100,000 which generally isn't our customer not always but generally isn't so we'll see uh if that 10 percent if it's if it stays at 10 percent higher I don't think it'll change behavior all that much if it comes in at 30 percent higher uh then I think it could potentially cause some more 90-day buyouts, which would have an impact on gross margin.
Operator
And our next question will be coming from Una San of Jefferies. Your line is open.
Hello. Thank you for taking my questions. You mentioned a switch to or switch in how you view the business to consolidated GMV in addition to colors around the segment GMV. Could you expand a little more on that and how would that change how you or we should think about the drivers of the business, seasonality, momentum, segment contribution, anything will be helpful.
Yeah, I mean, I think the statement that we believe that with for and leasing and now purchasing power kind of all having uh the equivalent of gmv we believe that a consolidated gmv is a more holistic way to measure the the amount of commerce going through the product platform it doesn't change the fact that we're going to be tracking leasing gmv and tracking forward gmv um because all gmv is not created equal um and they and they have different paths they have different uh conversion into revenue and different paths through the p l um and so it it while we think it's a a useful metric that we will be talking about um you shouldn't and we will not get away from tracking the individual segment uh gmv results um and i think that you know the the fact when we give revenue guide for each individual um uh segment implied in that is an expectation around GMV. So it's not a departure, it's just a click up on the kind of global view and we think it's helpful.
Thank you. And my next question is on expense cadence throughout 2026. Is there any cadence or investment throughout the year that we should think about and how would that impact segment margin dynamics, especially for where the margin is right now versus where the guide is. Thank you.
Yeah. So, if I just go segment by segment, on the progressive leasing side, I think we indicated that our expense cadence or our expense overall will be consistent with last year in terms of percentage of revenue. There's not much in the way of lumpiness along those lines and there's variable costs tied to revenue and so as revenue is you know seasonal so will those some of those so those costs but but there's not um you know a significant bullet at any point in time to put on your radar i think the the same case with with four there's there's always uh there was continued investment but nothing that jumps out as significant i think the biggest margin drivers there, again, are going to be, obviously, optimization and growing EBITDA margin over the course of the year, just as they get more efficient and better able to manage the portfolio. And then nothing really to point out at purchasing power. Obviously, there's, you know, anytime you acquire a private company and you're going through getting them ready to be public. There might be some front end costs. So maybe there's a little bit more of a front way to slightly, but nothing that I would say materially you should factor in.
Operator
And our next question will be coming from Vincent Kaintick of BTIG. Your line is open, Vincent.
Hey, good morning. Thanks for taking my question. I wanted to follow up sort of on the um the seasonality discussion again on in terms of the guidance um you know strong full year 2026 guidance first quarter guidance is a little bit more mixed someone sort of wondering um so you just gave the expenses that's really helpful you know how should we think about the revenue side and the inflection through the year um i think you've already provided purchasing power has that seasonality which you discussed in terms of revenues uh for four should we kind of be expecting this continued acceleration as you've been experiencing? And then for the leasing business, so you talked about your lapping both the loss of the partner as well as tightening underwriting in February. Is there sort of any way to kind of get a sense of what underlying GMB would have been without that? I know you said without big lots, it would have been 1% higher, but I'm sort of thinking like how does the cadence look like from second quarter onwards? Thank you.
Yeah. I mean, I'll try and help you there. I mean, you talked about purchasing power. With it being new to the platform, we want to give that quarterly color. And so it's roughly kind of break even in Q1. And then, obviously, we're guiding to 50 to 60. And Q4, it's a holiday-centric retailer. So Q4 will be the strongest quarter from a revenue and earnings standpoint. um four has seasonal dynamics as well q1 will be a strong profitability quarter because of the uh revenue and fees generated off of the really high gmv from december that got provisioned in december and hasn't had a chance to to generate the revenues uh as much yet um we'll continue to at our growth rates that we're projecting you know we'll uh we'll have another big fourth quarter next year, or this year, sorry. And we'll see if it, like last year, it caused us to swing to a loss, although a small loss, but a loss in Q4 from an adjusted EBITDA standpoint. We'll see what happens this year based on scale and other factors. But Q1 is a strong earnings quarter for that business. I mean, leasing is starting, I would say more so from versus the GMV front. it's starting at a 9.4 percent smaller portfolio than it had at the beginning of the year due to the GMV from 2025. So from a revenue standpoint and an earnings standpoint, there's a kind of an uphill climb there that, you know, in the first half that hopefully gets better in the second half. From a GMV perspective, we, you know, we are lapping those two discrete items, and hopefully those are behind us. Well, those will be behind us here at the end of February, and so we'll see some improvements in GMV performance as we get out of the first quarter, into the second quarter, into the back half. So I guess that's the color we can provide on the quarterly version of the annual guides.
Okay, that's helpful. Thank you. And last one for me. So we talked tax refunds a little bit already, but maybe if you could talk about just broadly what your expectations are for tax refunds and what's built into the guidance. Thank you.
Yeah, similar to what I said, I mean, you know, there's lots of reports that they're going to be 30% higher this year. I'm not positive that our customer base is going to see that type of a percentage increase because of some of the things that are available in that tax bill are not available to our customer at their income level. However, we do expect it to be higher. And so somewhere between probably 10% and 30%. And if that's the case, we'll see an inflow of cash, which is always good. Hopefully, we'll see some demand signals on the GMV front. And it remains to be seen just what the GMV, I'm sorry, the 90-day buyout activity will be. So we have some estimates that it's a little more active tax season than the past, which I think is reasonable based on the fact that we think the liquidity position will be higher.
Operator
And I would now like to turn the conference back to Steve for closing remarks.
Thank you, everyone. I appreciate you bearing with us here as we went a little long. But, you know, we're proud of the year, the 2025 that we delivered and excited about our plans for 26. I want to take an opportunity to, again, welcome the Purchasing Power team to Prague. We're excited to be working with you and to unlock the potential of that great business. But also to thank all of our team members for their continued hard work and commitment to serving our customers and retail and employer partners. I'd like to reiterate John's invitation for you to participate in our upcoming Investor Day on March 10th. We have a great presentation lined up and look forward to laying out the PROG story in more detail. And I look forward to y'all hearing from a broader part of the leadership team as opposed to just Brian and I. So please reach out to John on how to participate in that Investor Day. We appreciate your time, and we look forward to updating you on our progress at the Investor Day and after Q1 in April. Thank you.
Operator
And this concludes today's program. Thank you for participating. You may now disconnect.