Good morning from Stagwell's office in Miami. Welcome to Stagwell's Third Quarter 2025 Earnings Webcast. My name is Ben Allanson, and I lead the Investor Relations function here at Stagwell. With me today are Mark Penn, Stagwell's Chairman and Chief Executive Officer; and Ryan Greene, Stagwell's Chief Financial Officer. Mark will provide a business update before Ryan shares a financial review. After the prepared remarks, we will open the floor for Q&A. You are welcome to submit questions through the chat function. Before we begin, I'd like to remind you that the following remarks include forward-looking statements and non-GAAP financial data. Forward-looking statements about the company, including those related to earnings guidance, are subject to uncertainties and risk factors addressed in our earnings release, slide presentation and the company's SEC filings. Please refer to our website, stagwellglobal.com/investors for an investor presentation and additional resources. This morning's press release and slide deck provide definitions, explanations and reconciliations of non-GAAP financial data. And with that, I'd like to turn the call over to our Chairman and CEO, Mark Penn.
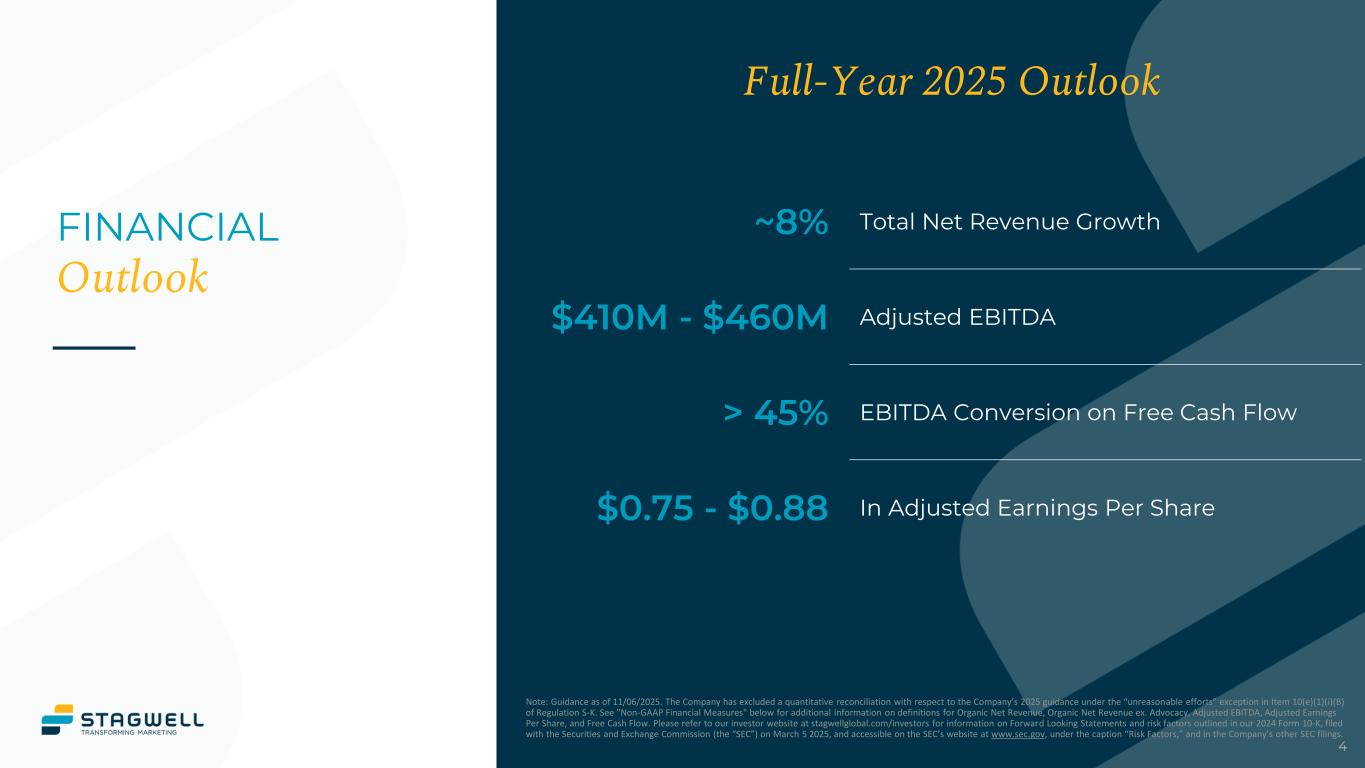
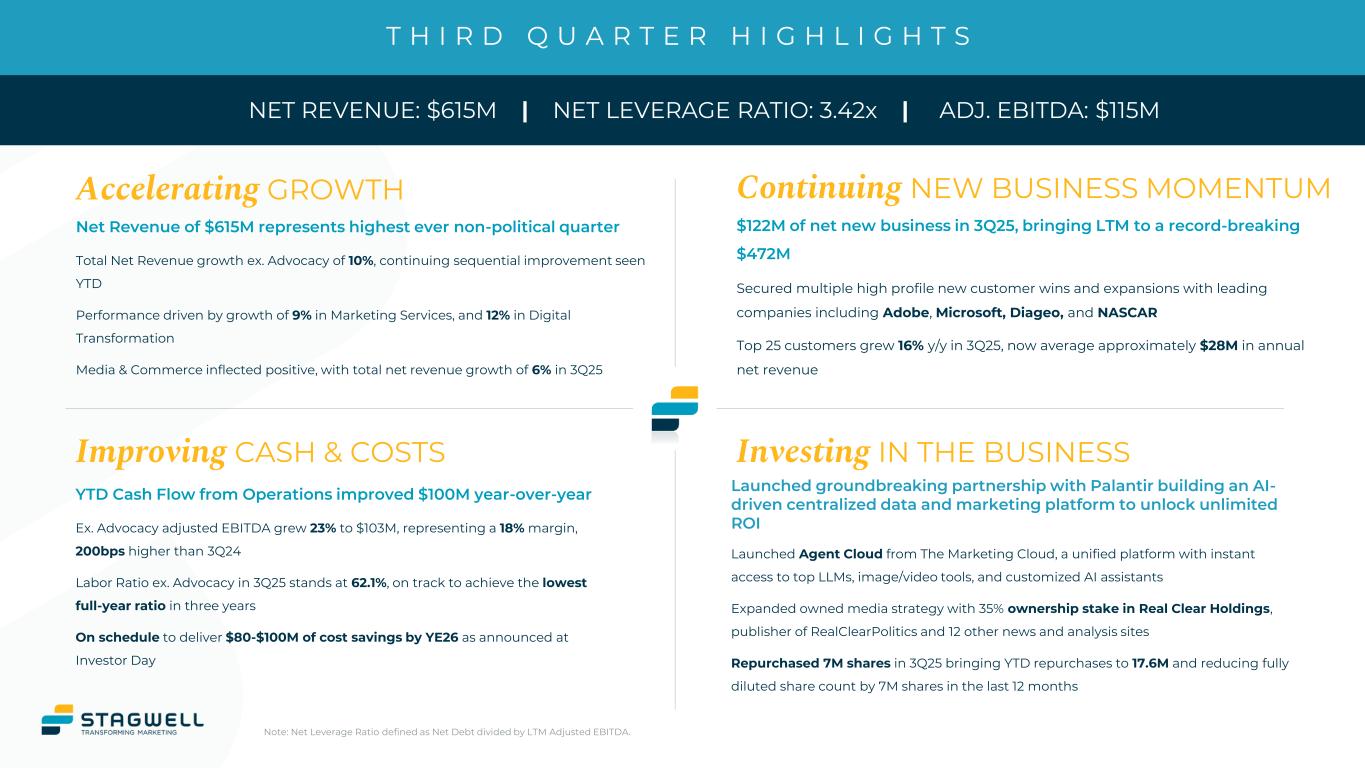
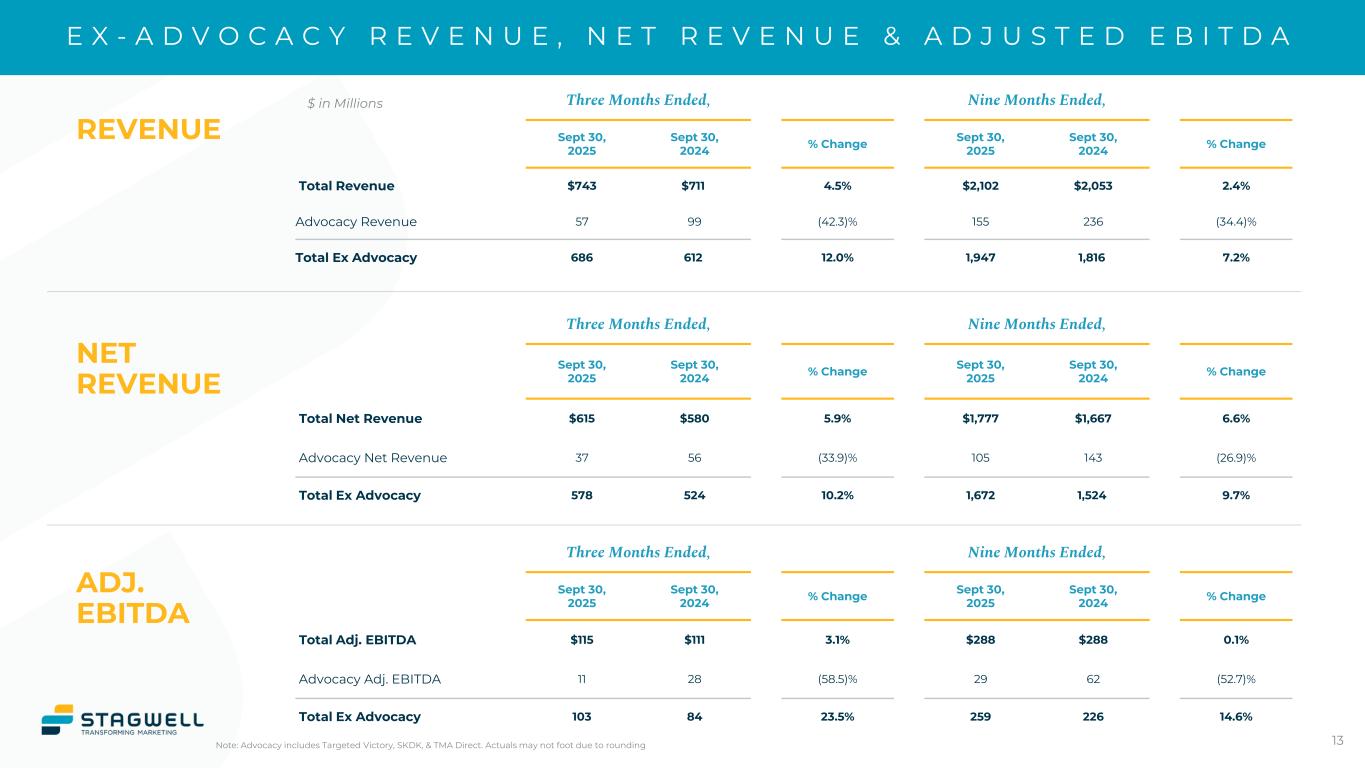
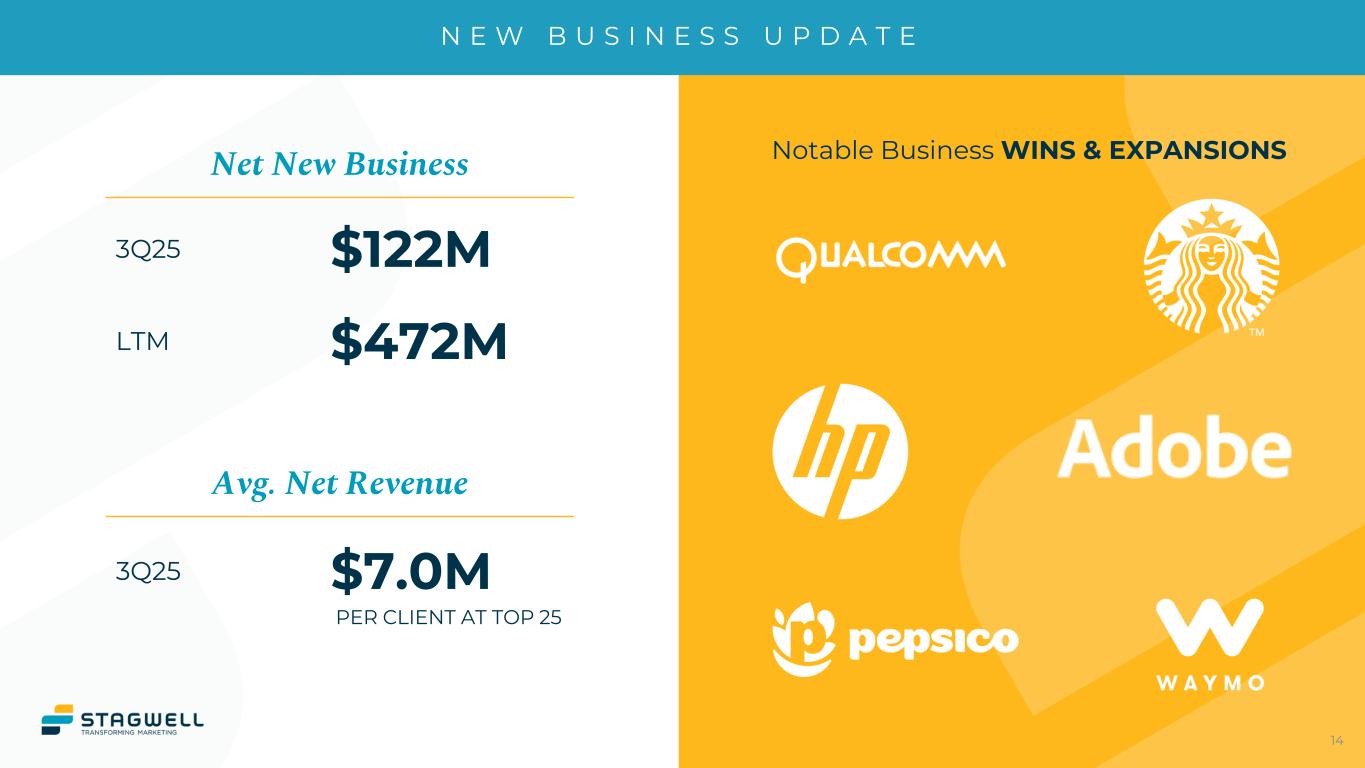
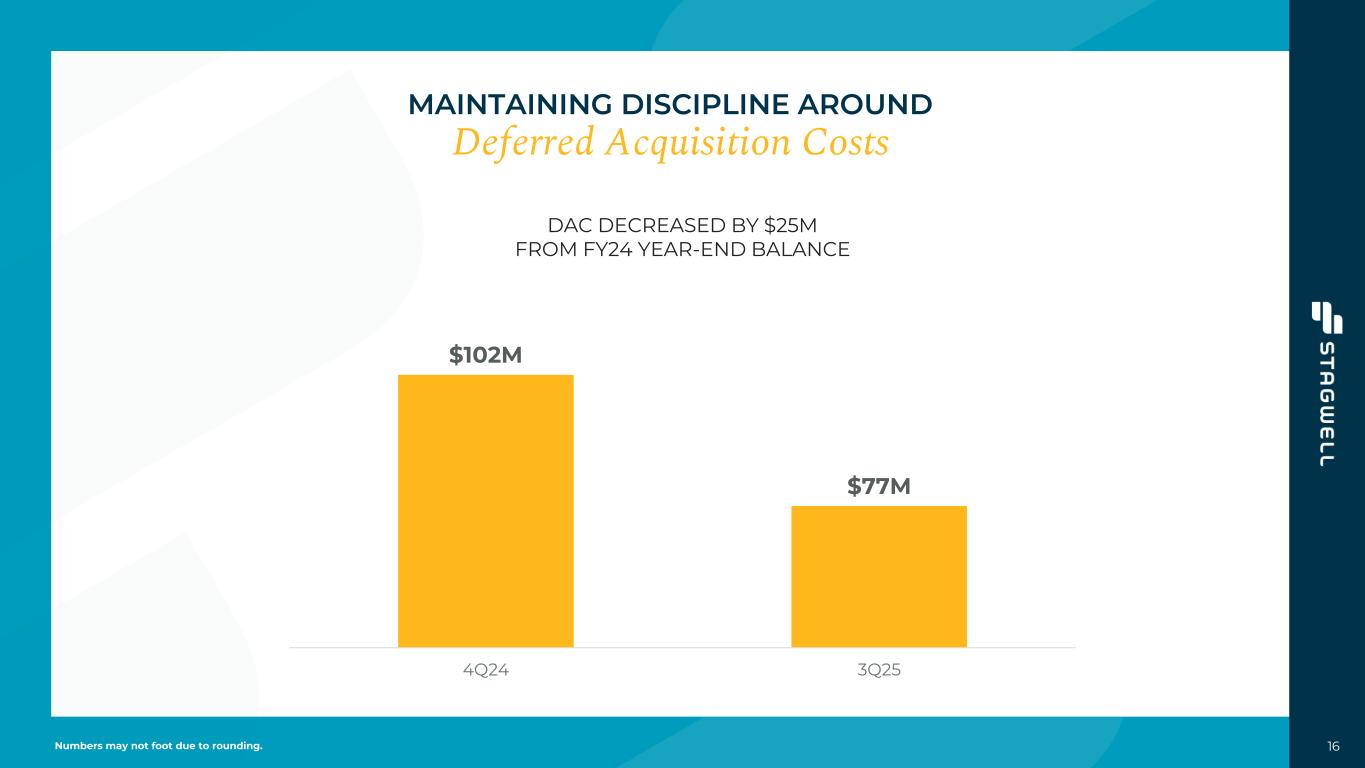
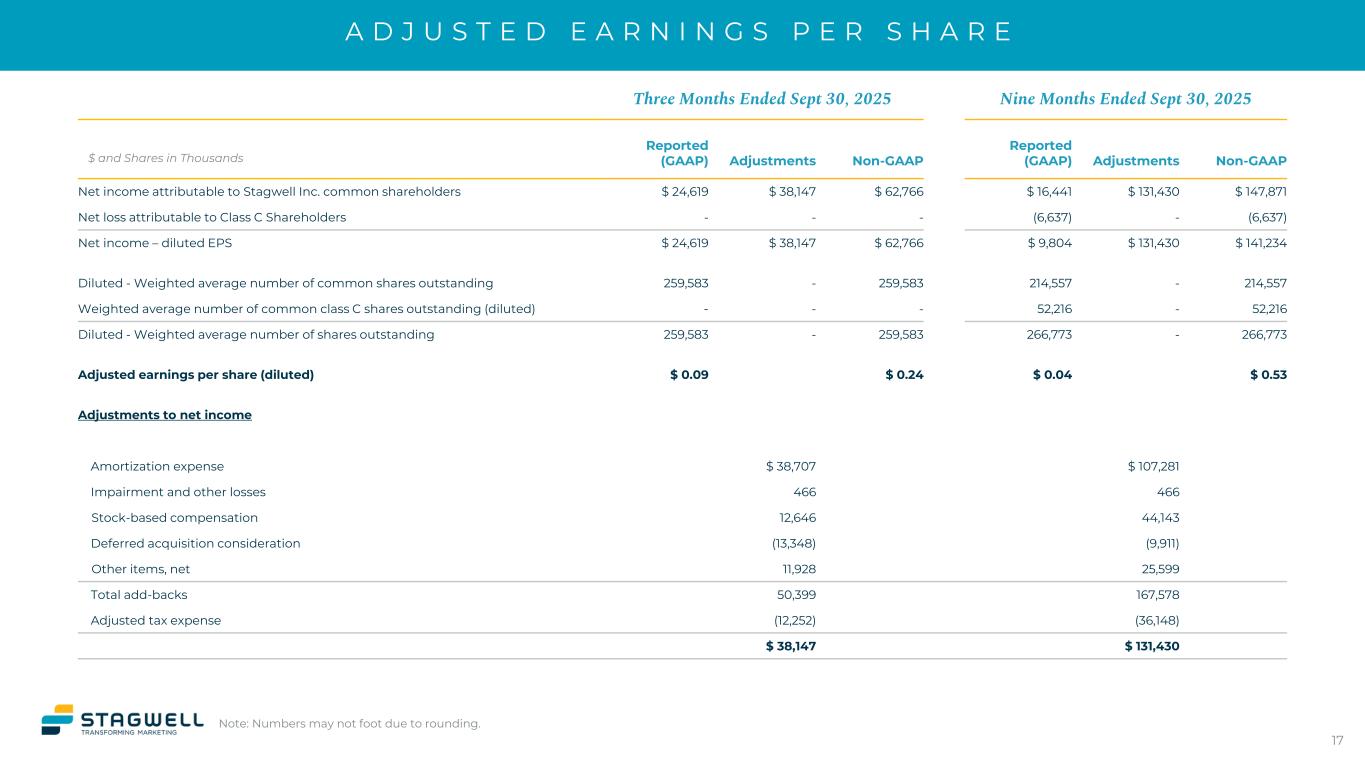
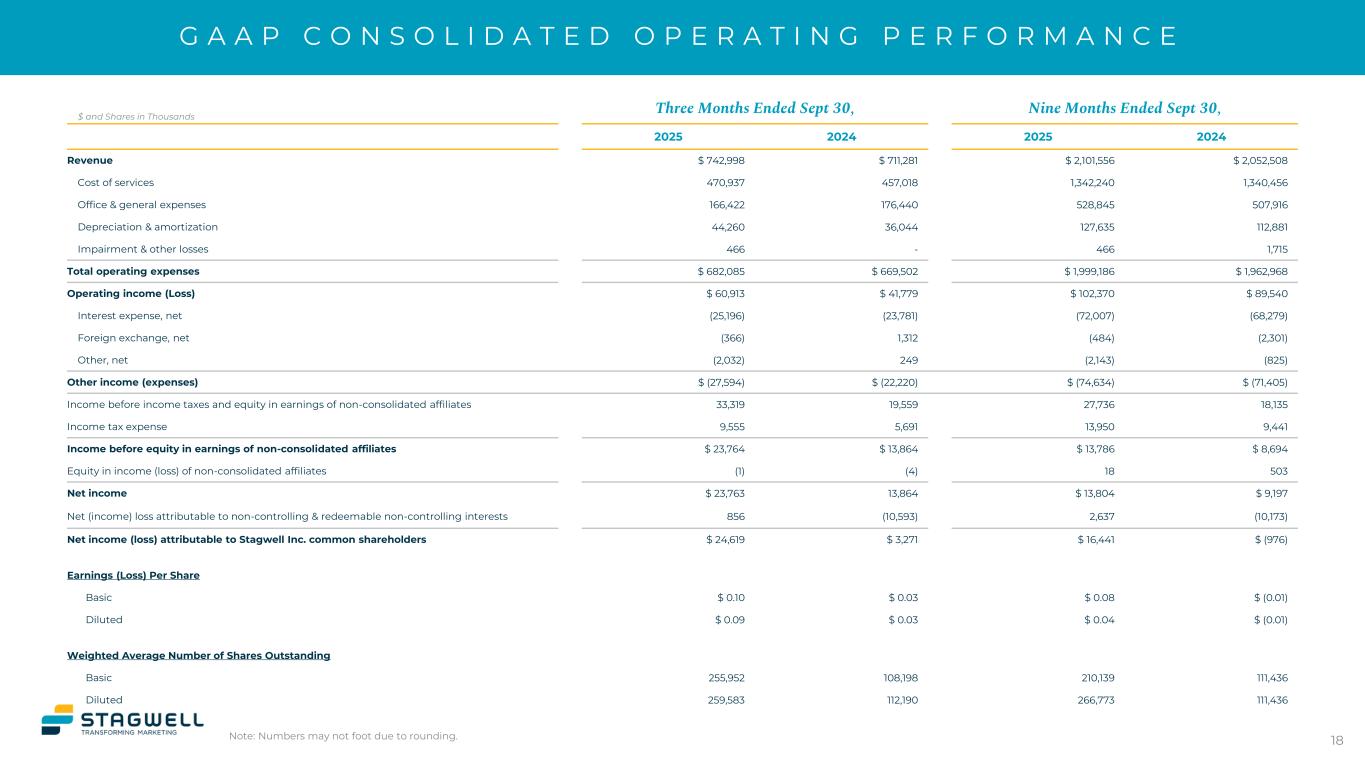
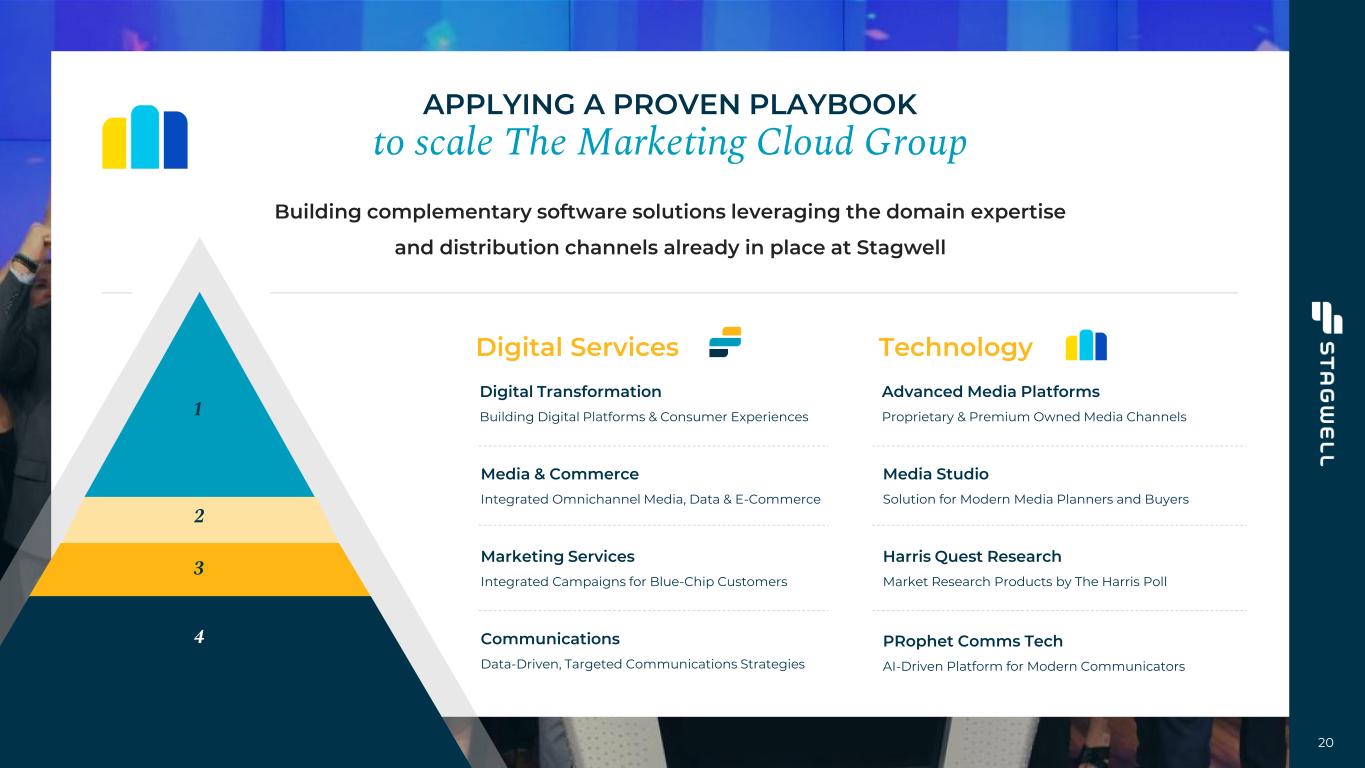
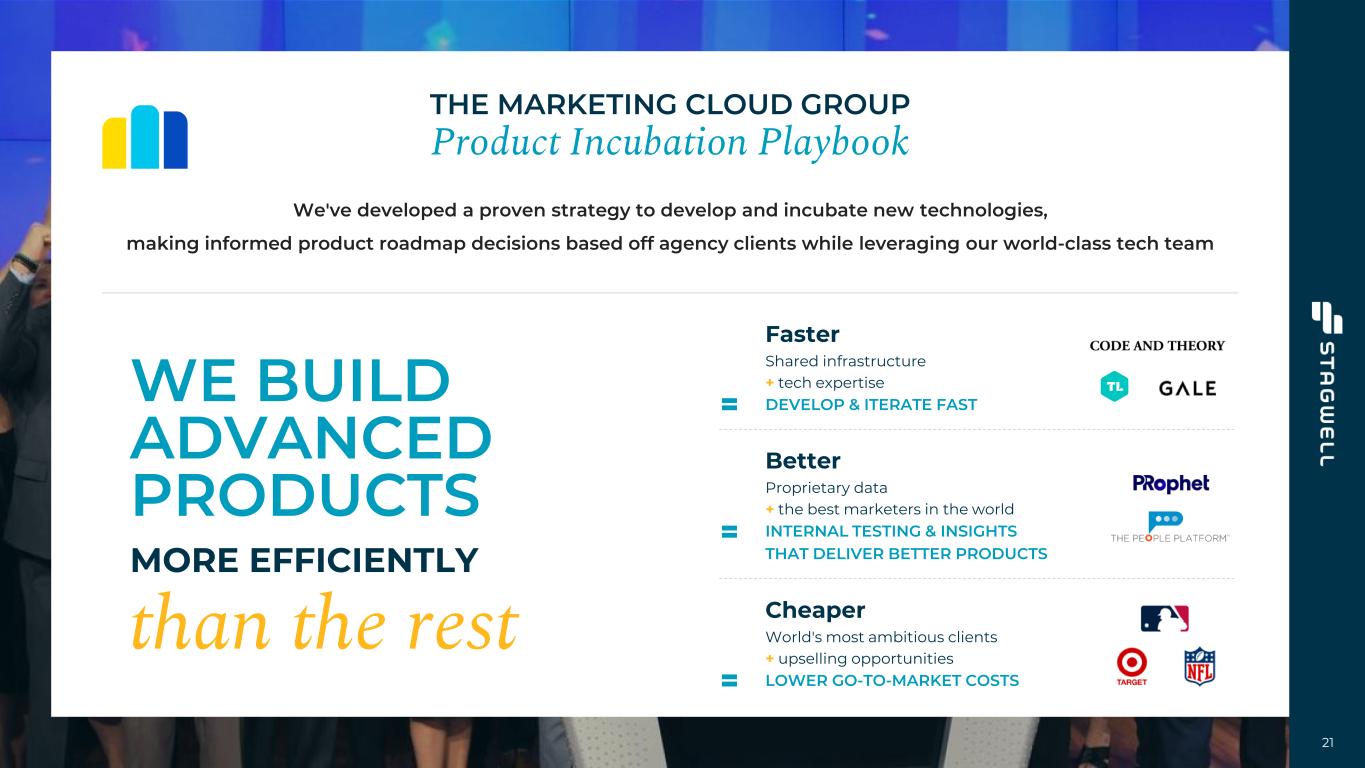
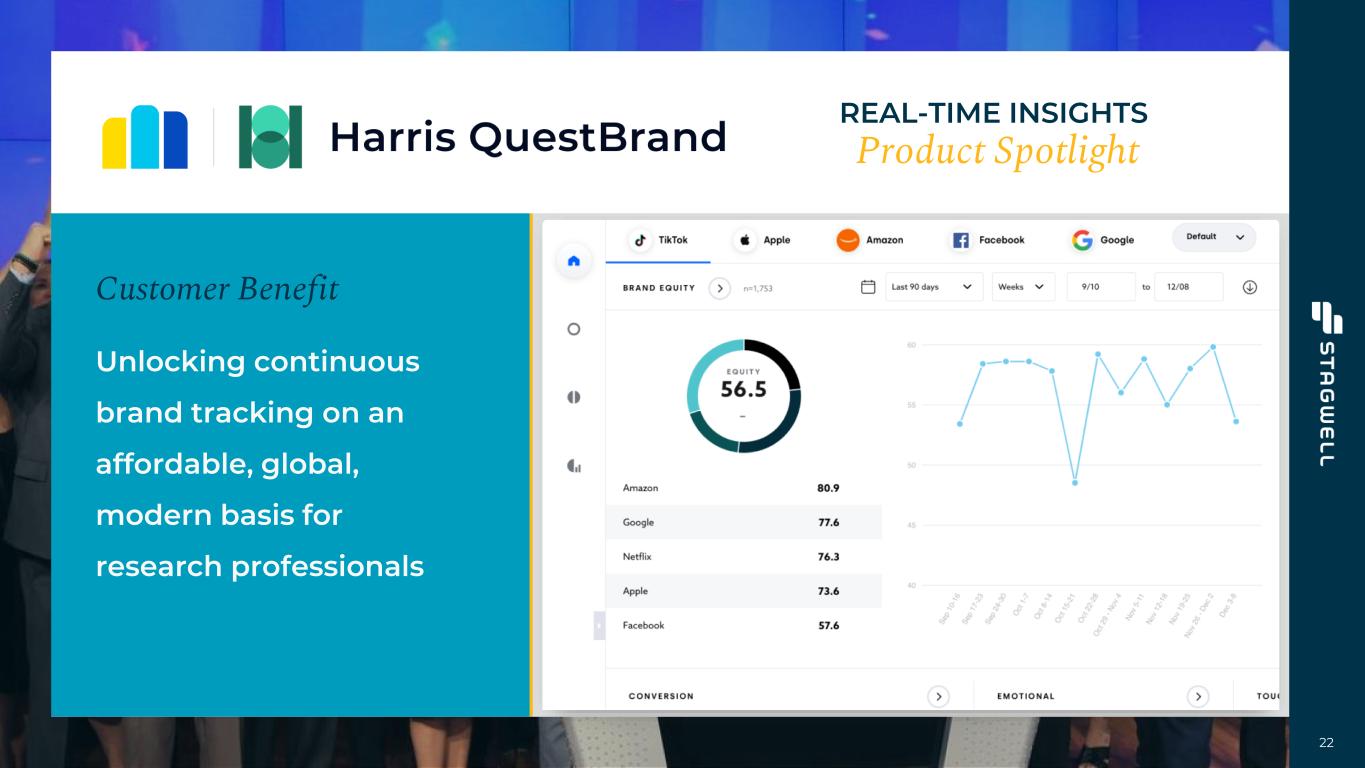
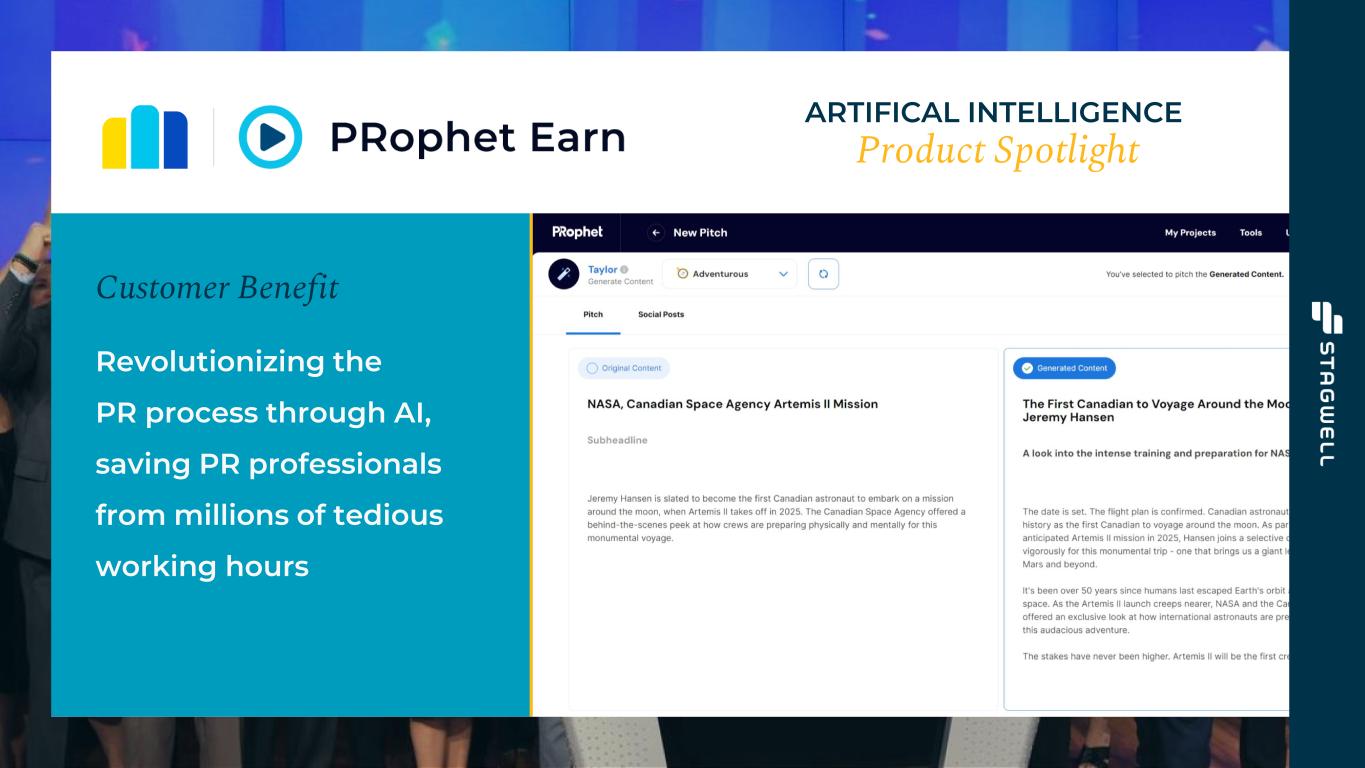
Thank you, Ben. In an industry undergoing major transformation, there are winners and there are losers. This quarter, coming on top of consistent sequential and year-over-year growth in our non-advocacy net revenue, we're clearly positioned as one of the winners. And today's game-changing Palantir announcement is another example of that. The overall revenue number of $743 million and net revenue of $615 million reflect 12% and 10% increases over last year. On a 2-year stack basis, our organic growth was 8.4%, a meaningful acceleration over the first 2 quarters, which both came in at about 1%. We expect this figure to be in double digits in the fourth quarter. Our ex advocacy EBITDA jumped 23% year-over-year to $103 million, and our ex advocacy margin of 18% is the highest we have achieved in 2 years. Ryan will talk more about the cost reduction efforts that are clearly working there. Our adjusted earnings per share of $0.24 is up 9% from the third quarter last year, and our year-to-date cash flow from operations increased by $100 million. Our LTM net new business increased to a record $472 million and top client relationships continue to expand significantly. A top 25 client is now an average $28 million relationship. Our current pipeline of $0.5 billion remains at its highest levels. Marketing Services total net revenue grew 9% and digital transformation increased by 12%. Organic growth in our key segments was strong as well, Marketing Services grew 6.5% organically overall and 9% in the U.S. market. Digital Transformation grew at 7% organically and 7% organically in the U.S. While many of the competitors in the industry are shrinking and shredding operations, we are growing and meeting the demands of the new world of AI. Investors ask, given all these trends, why is organic growth not even higher? The answer is our client base is undergoing significant transformation. Our bigger clients are getting bigger, while our smaller clients of $500,000 and under are turning over. This shift towards achieving larger scale customer relationships, when complete, will result in higher and more consistent growth. We're putting in additional awards for client retention and expansion. We are aiming to cut client shrinkage by 5 points next year and can meaningfully improve organic growth. Another factor is a slowdown in the communications vertical, reflecting industry-wide issues in that segment. We expect the trends in advocacy companies to reverse themselves next year in what promises to be a banner political year. We are also doubling the size of our new business team to cover all major sectors and geographies and to extend the efforts with government contracts and additional technology services. Our CMO, Ryan Linder, a leader in the industry, is spearheading this effort to take advantage of our growing market position. In terms of our strategy, we have made a major pivot from M&A to technology development this year in response to the reality of AI. It's a technology that touches everything. And as a former Microsoft Chief Strategy Officer, I have put together a top-tier team with John Kahan, formerly at Microsoft and IBM, Slavi Samardzija from Omnicom, working with Mansoor Basha, Raman and the entire Code and Theory team headed by Dan Gardner and Mr. Treff. Nothing is more important in this industry today than being a leader in AI. We are in an ideal position as a newer technology-first company at our size to adopt technology as we grow compared to some of the behemoths in the industry who have massive legacy assets and have proven hard to transform. As part of the objective of leading in AI, this morning we announced the partnership with Palantir to build a groundbreaking industry-first audience platform that unlocks new ROI for corporate marketers. This platform is the holy grail of marketing finally brought to life. Building our proprietary algorithms and data on top of the Palantir foundry, we'll be able to offer clients access to a first-of-its-kind central hub for marketing and targeting designed to activate AI-enabled decision-making and support a wide range of use cases, such as audience creation, creative development and testing, and campaign management. The platform is AI-based to enable large companies to access tens of millions of records of marketing and sales data and to create agents that will then implement complex marketing processes and campaigns. Demos of the products are available upon request. In addition to adopting it internally, we will sell it as a stand-alone platform that companies can use to monitor and enhance their marketing efforts and adopt highly personalized marketing strategies down to the retail outlet and the individual customer. This is a new business line for Stagwell and working together with Palantir, the goal is a significant one, creating products to generate potentially hundreds of millions of dollars in new revenue. We are also partnering with Adobe on the content management piece of our new products. The first client peaks of this emerging technology have been favorable. We've developed an MVP over the last 5 months and expect to have advanced versions in the market within months, and demos will be available for qualified clients. In addition, The Marketing Cloud segment, which now reflects our suite of SaaS products, saw excellent net revenue growth of 138% in the quarter, led once again by outstanding organic growth of 57% in our Harris insights suite of research products and strong contributions from recent acquisitions. Adjusted EBITDA margin in The Marketing Cloud was negative 4%, a significant improvement over the negative 30% margin posted in the same period last year. We're on track to deliver positive adjusted EBITDA in late 2026. As previously mentioned, a key potential strategy here will be to spin off The Marketing Cloud at a certain point if its full value is not recognized internally. As part of this pivot, we also invested about $35 million this quarter, continuing to strengthen our tech capabilities, including investing in The Marketing Cloud, building out the machine, the operating system for all our agencies, and rolling out the Stagwell content supply chain internally built on top of the Adobe stack. This investment enabled The Marketing Cloud to launch Agent Cloud just 2 weeks ago. This unified platform gives brands instant access to multiple LLMs, image, video tools, and custom AI agent creation all in one place, setting teams up for fully agentic workflows. Another part of our strategy is to expand our owned media properties so that we can offer our clients great low-cost opportunities for ROI. We just announced the acquisition of a 35% stake in Real Clear Holdings, which we've now expanded to 37.5%, publisher of RealClearPolitics and 12 other news and analysis sites. This is on top of our travel publications and programmatic B2B media we own and operate. We have now launched the Stagwell Media Platform to bring our principal media to the market. At our current multiple, there's no investment we can find better than our own shares, given our growth, cash flow, and technology development. So, a major use of capital this year was buying our own shares, and we repurchased $90 million worth of shares to date. The basic share count now is 252 million, down 4% from last year. As part of the technology pivot, we did not acquire the planned $100 million of new revenue this year, but only about $65 million, but we've had increased organic growth in our core business and improved margins. We expect a strong finish as fourth quarters are typically our strongest, and we expect to be within the specified ranges on all metrics. As for guidance for the close of the year, we're reiterating the outlook of approximately 8% total net revenue growth, $410 million to $460 million in adjusted EBITDA, $0.75 to $0.88 in adjusted EPS, and 45% free cash flow conversion. Looking into next year, we believe that our strength is building. Our core services are showing strong expanding pipelines and organic growth. Our media business is being bolstered by the development of new technology engines that will be deployed to foster even more growth here. The Marketing Cloud is turning a corner, and the new partnership with Palantir will yield new products. On top of this, we expect a huge political season, and the cash demands of deferred acquisition payments next year are close to zero. Along with lower interest rates and the advantages of the new tax bill, these developments will free up considerable cash above the 45% level. We'll continue to evaluate the best ways to enhance shareholder value as it becomes clearer to the marketplace that we are one of the winners able to meet the challenge of transformative technology and be a leader in its deployment. Thank you very much. Let me turn it over to Ryan.
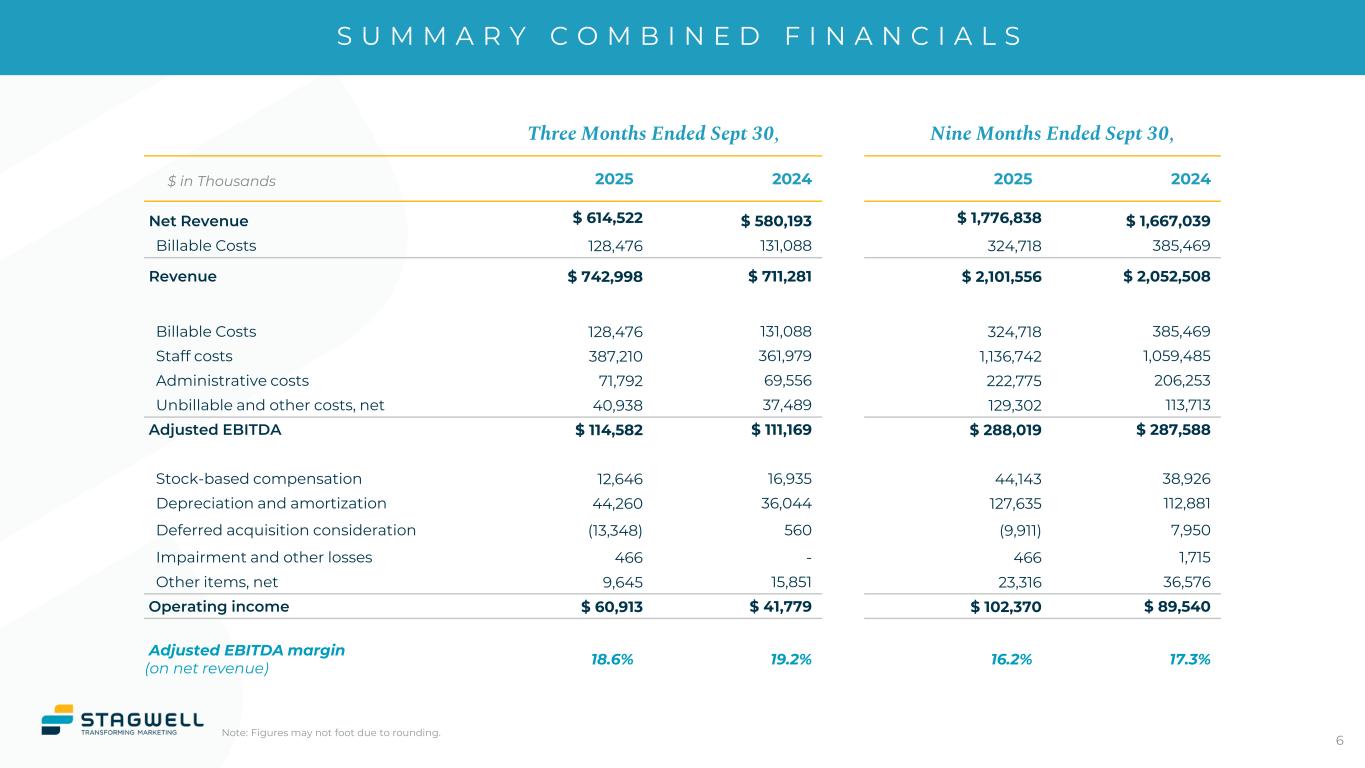
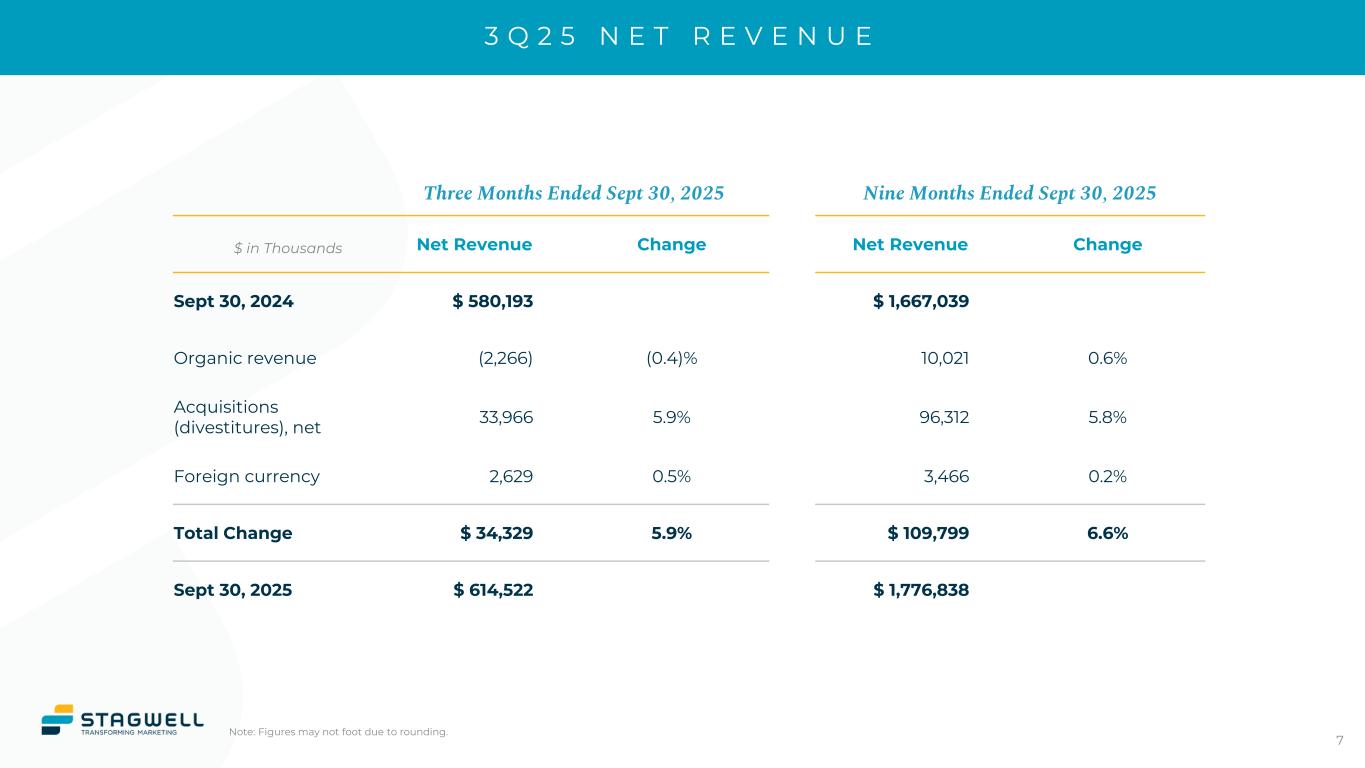
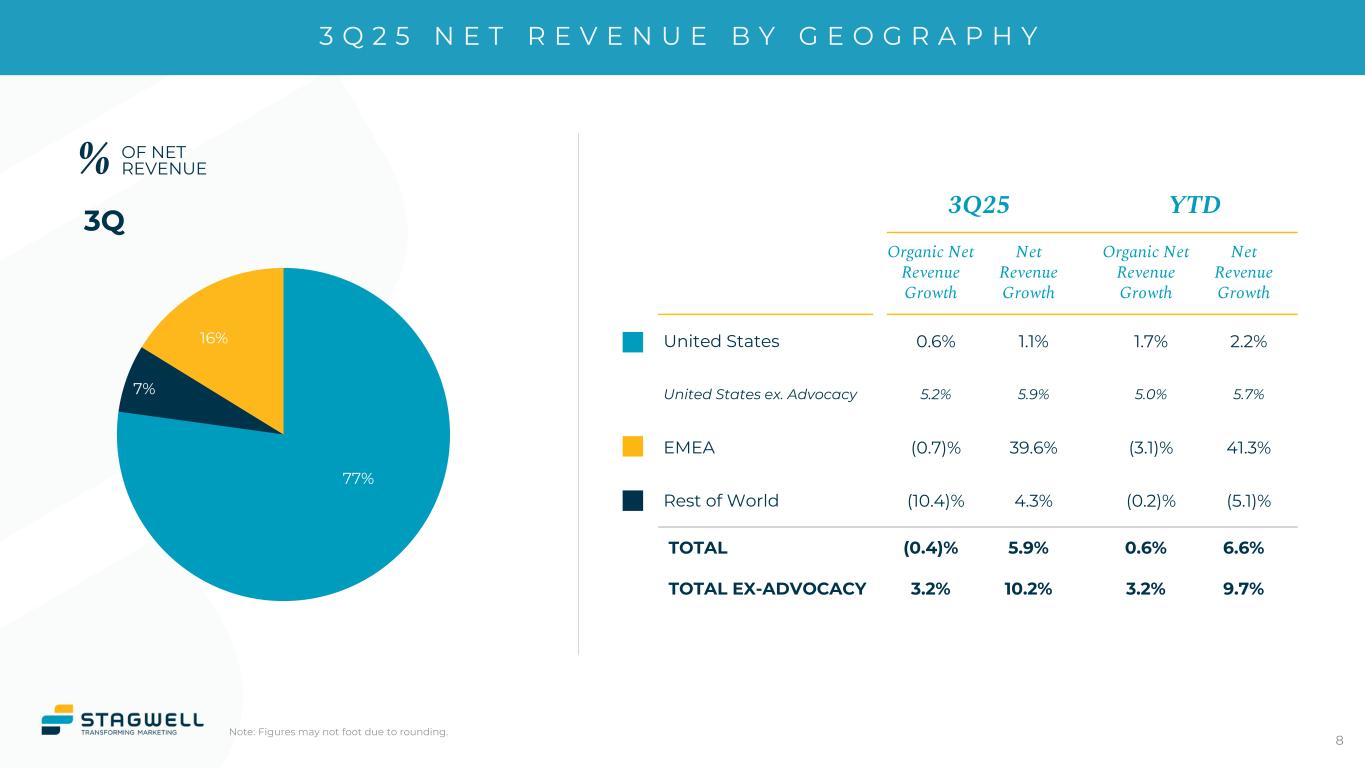
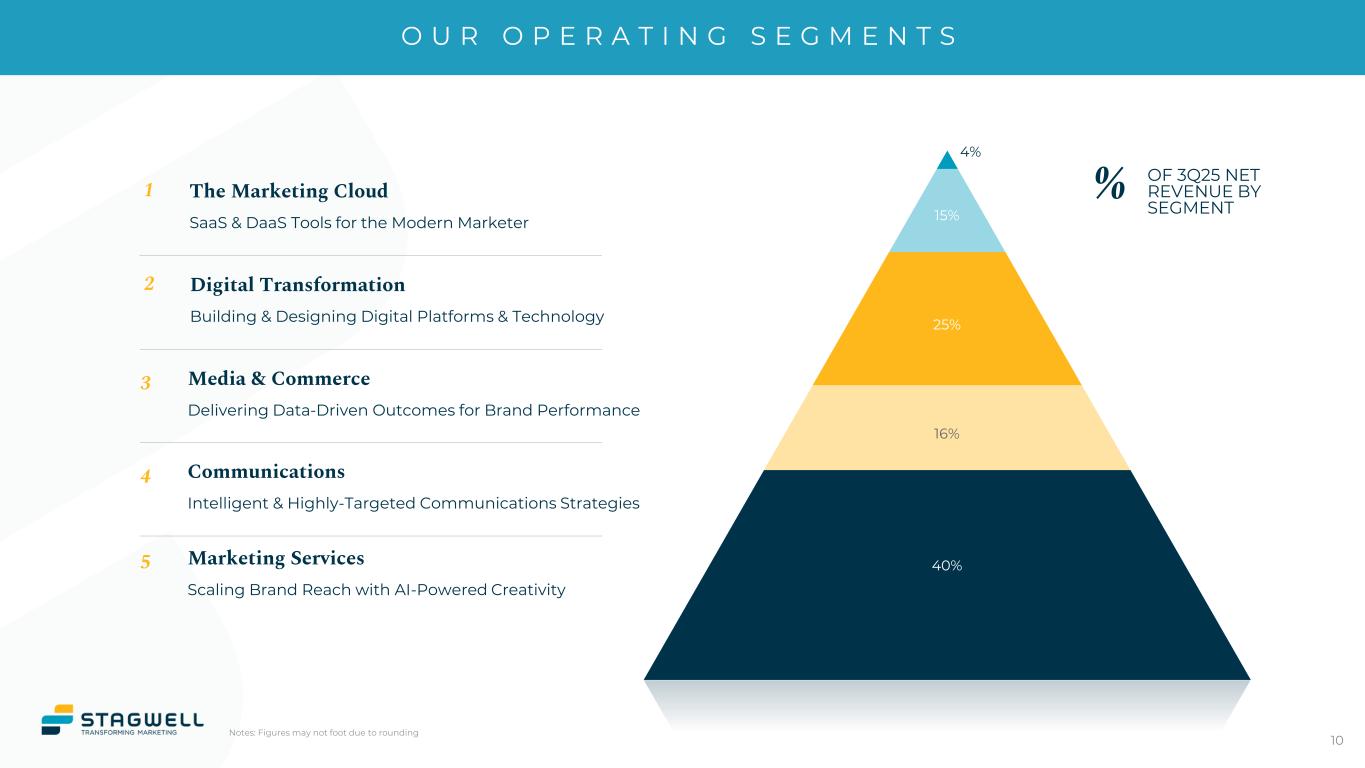
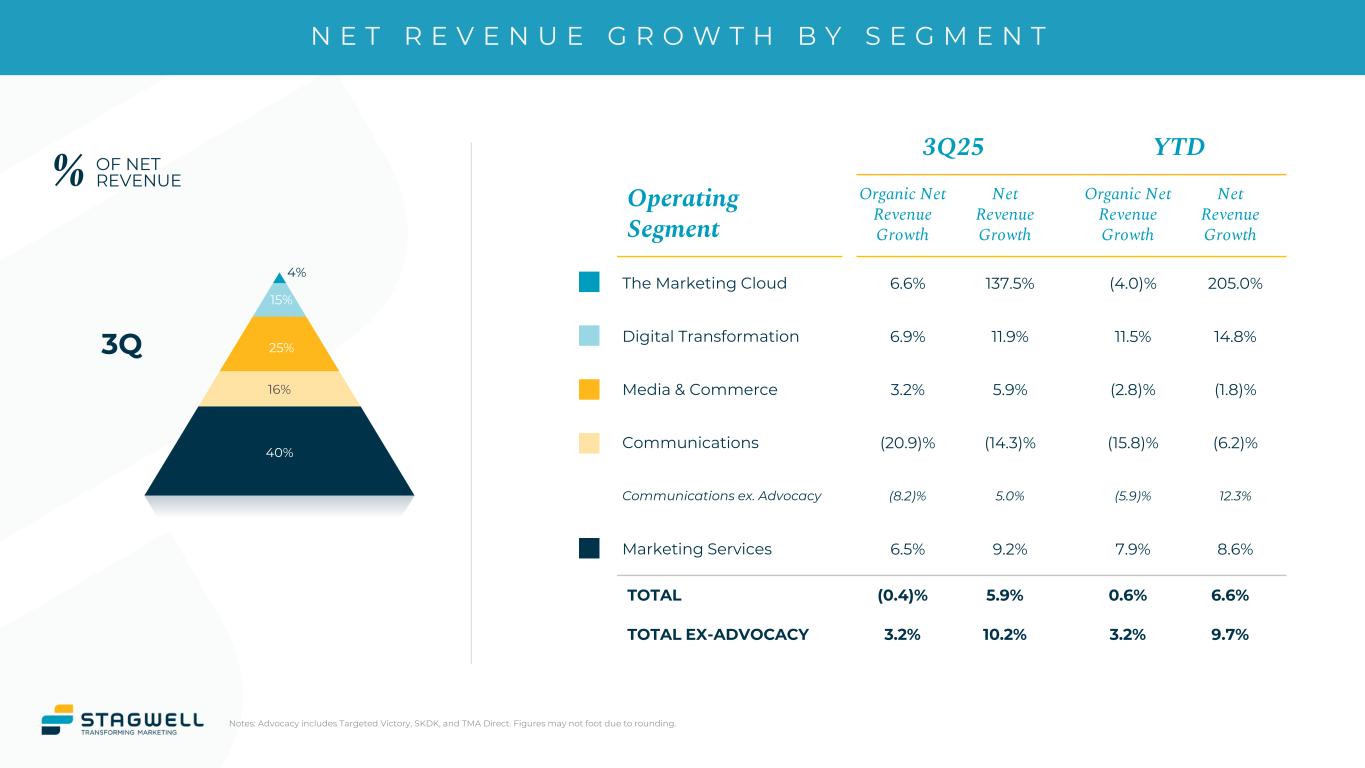
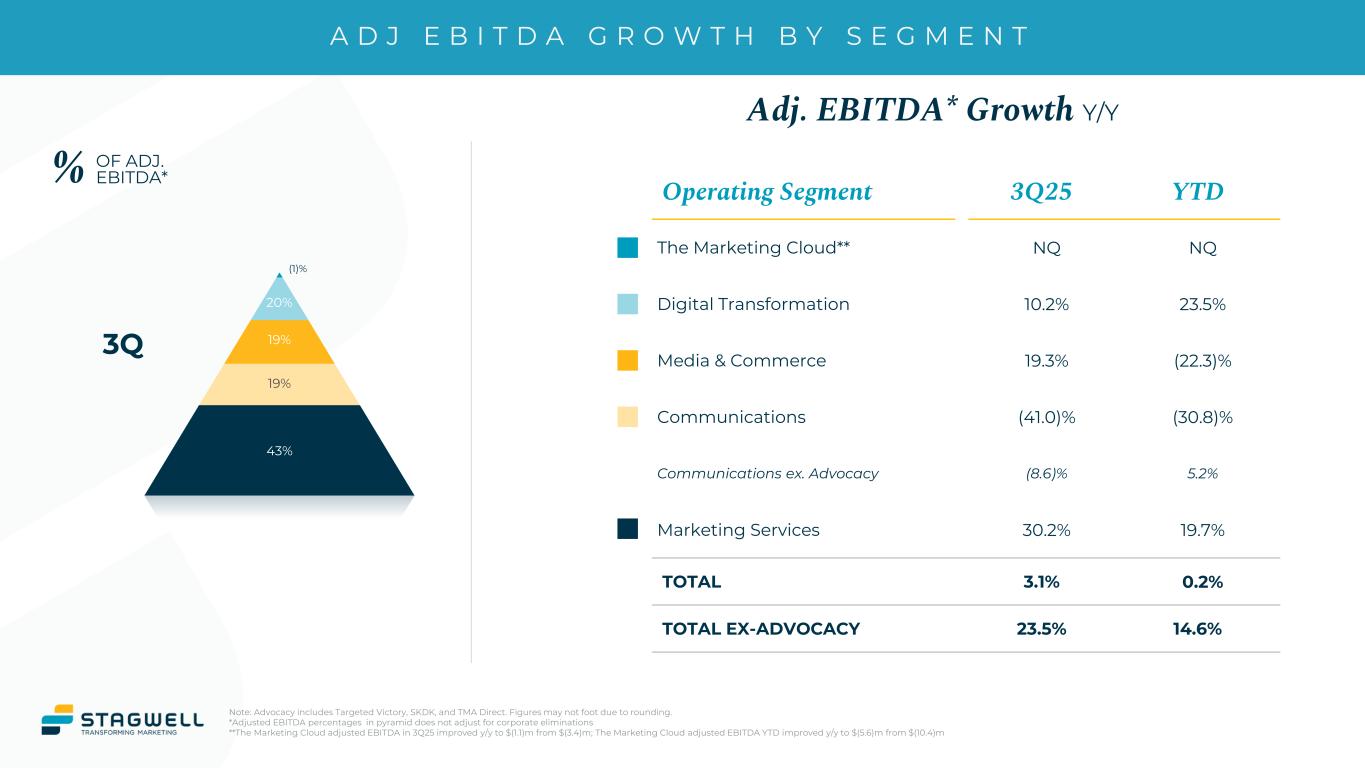
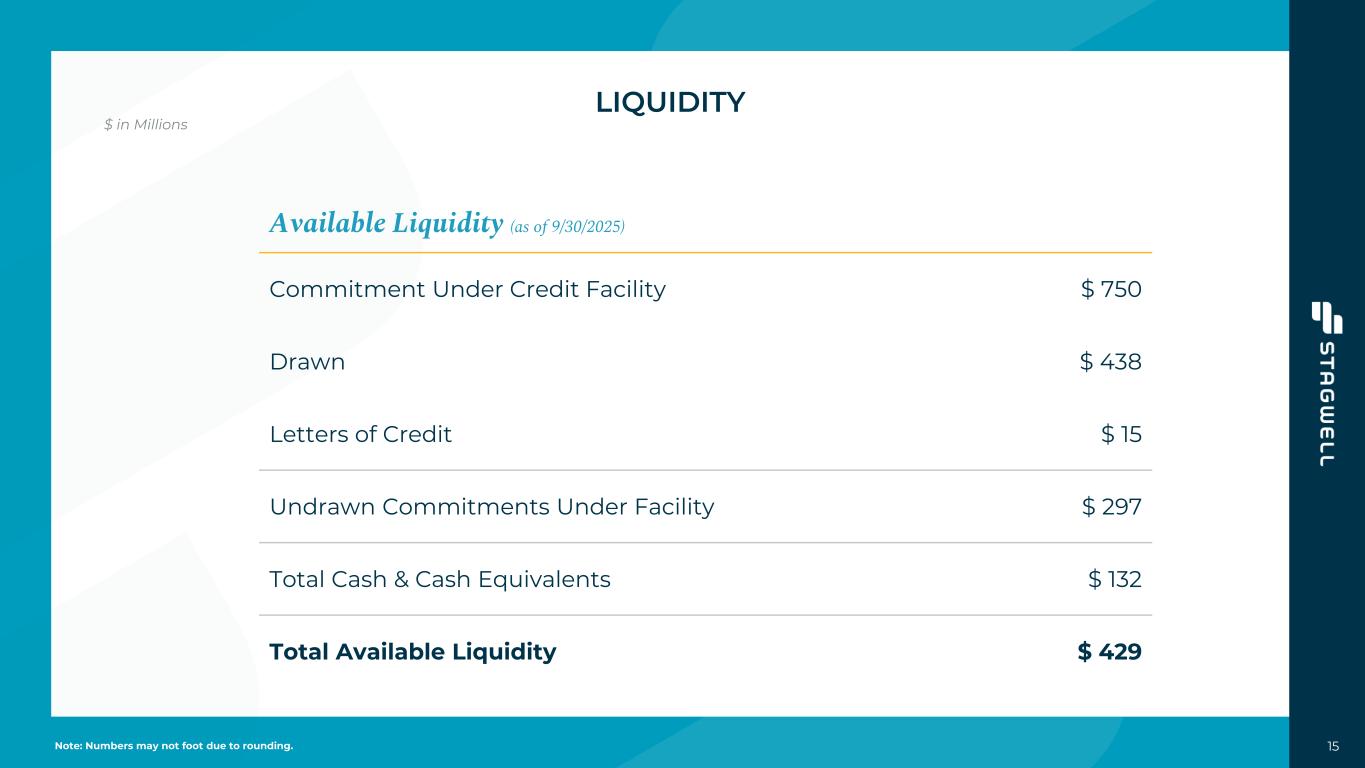
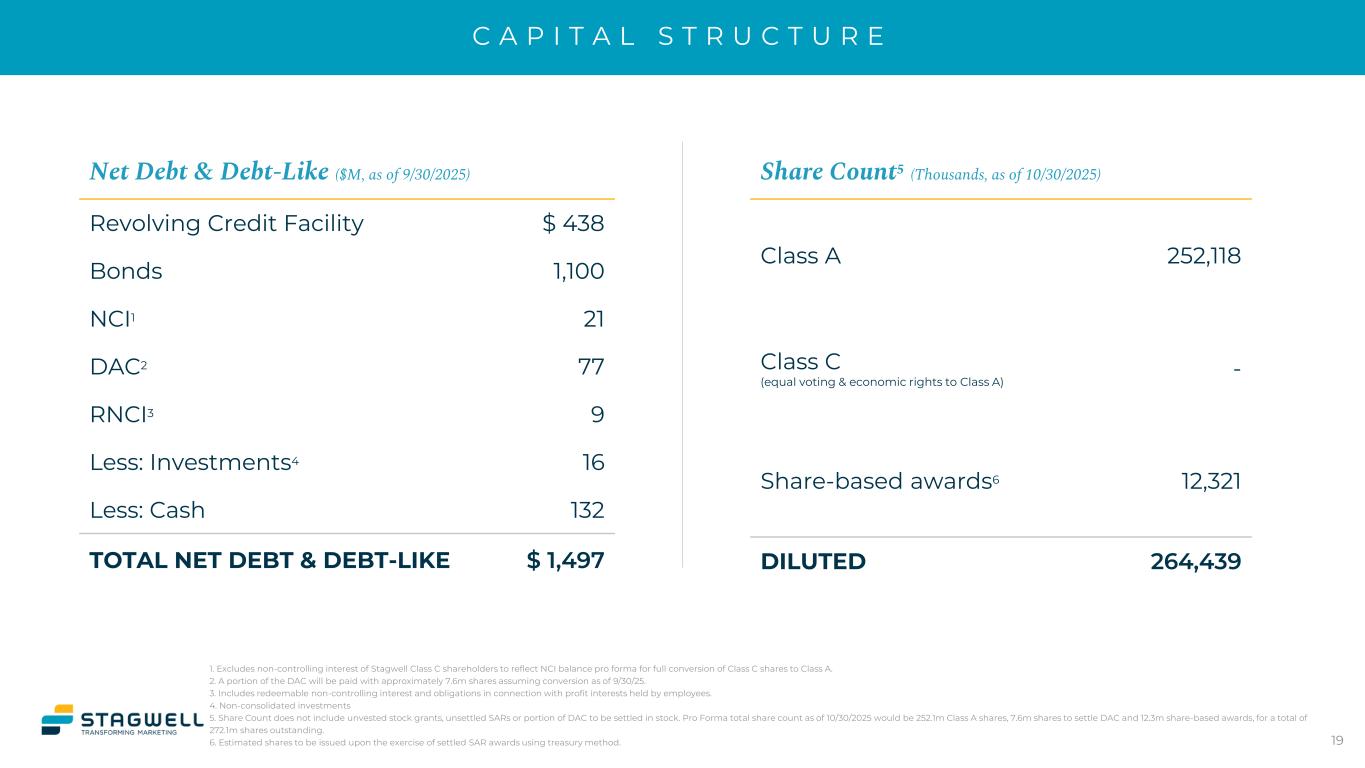
Thanks, Mark. Today, I'll walk you through key reporting changes and an overview of our financial performance. This quarter, we adopted a new structure with 5 segments: Marketing Services, Media and Commerce, Digital Transformation, Communication, and The Marketing Cloud, designed to simplify reporting and improve transparency. The advocacy adjustments are now limited to a single segment, Communications, simplifying disclosures. Please refer to the revised earnings presentation and investor supplement posted on the Investor Relations section of our website for a restatement of prior period results and contribution percentages under the new framework. We also redefined our organic growth calculation. Revenue from acquisitions is now considered inorganic 12 months post close. This approach mirrors a leading competitor and provides a clearer view of Stagwell's driven performance. Now turning to our results. In Q3, we generated $743 million of revenue. Net revenue was $615 million, up 5.9% year-over-year. Reported organic growth was down 0.4%, but when adjusted for advocacy, organic growth was 3.2%, with nearly all segments achieving higher levels. Net revenue, excluding advocacy, has accelerated throughout the year, 9.1% in Q1, 9.9% in Q2, and 10.2% in Q3. Adjusted EBITDA was $115 million, up 3% year-over-year, even without the higher gains from cyclical political work. Adjusted EBITDA margin on net revenue was 18.6%. Adjusted net income was $63 million, up 6%. Despite the advocacy pullback, adjusted EPS for the quarter increased 9% to $0.24. Looking at our geographical performance, the U.S. remained our largest market and key growth driver. Net revenue rose 1.1% year-over-year. Excluding advocacy, total growth was 5.9%, with organic growth of 5.2%. International total net revenue grew 25.9%, led by EMEA with a 39.6% increase. Let's take a closer look at how our operating segments contributed to overall performance. Starting with The Marketing Cloud. This segment grew 9.2% year-over-year to $246 million in net revenue. Adjusted EBITDA was $57 million with a margin of 23%. Strength in brand strategy, performance creative, and research reflects steady demand across a diverse client base. Next, digital transformation delivered $95 million in net revenue, representing growth of 11.9%. Adjusted EBITDA was $26 million, with a margin of 27.1%. Demand continues to build around AI, experience design, and platform enablement, especially among enterprise clients. Media and Commerce contributed $154 million. Growth of 5.9% was driven by multichannel and performance media campaigns across Europe, the U.S., and Latin America. Assembly, a leading media agency delivered 20% growth, a 14-point sequential improvement, driving stronger overall performance. Adjusted EBITDA for this segment was $25 million, a margin of 16%. Communications generated $97 million in net revenue, including $37 million in advocacy work. Excluding advocacy, PR results were softer, reflecting broader industry headwinds due to elongated pitch cycles and slower client decisions. Despite these headwinds, we maintained cost discipline to protect margin. Adjusted EBITDA was $25 million, a 26% margin. The Marketing Cloud contributed $27 million, growing 138%. This segment now includes only our suite of SaaS and DaaS products. Growth was driven by continued adoption of proprietary software platforms and analytics solutions, including 50% in organic growth at the research platform Quest, along with contributions from M&A. Adjusted EBITDA was a loss of $1.1 million, reflecting a margin of negative 4.1%. This marks year-over-year improvement of $2.3 million in EBITDA and a 26% margin improvement from negative 30% in the same quarter last year. We remain on track to achieve positive adjusted EBITDA in the second half of 2026. Nearly all segments reported positive organic growth. Excluding Communications, total net revenue for all remaining segments was 11% or 5% organically. Building on that performance, we remain focused on margin execution and expense management. Our priority is driving top-line growth while maintaining cost discipline. With a flexible cost structure, we can respond quickly to changing conditions as seen in our public relations results. This positions us to sustain margin and invest in growth while protecting profitability. Company-wide adjusted EBITDA margin was 18.6%, a sequential improvement of 310 basis points. Compared to Q3 2024, margin declined 60 basis points due to lower advocacy. However, excluding advocacy, margins rose 200 basis points year-over-year, driven both by revenue growth and labor cost controls. Turning to the cost savings initiative announced at our Investor Day, we remain on track to deliver $80 million to $100 million in annualized savings by the end of 2026, with $60 million to $70 million this year. Since announcing this initiative in April, approximately $27 million of savings have already been actioned. One of our principal initiatives is the rollout of the Stagwell content supply chain, a foundational effort transforming how work gets done. It focuses on integrating technology for content creation, streamline workflows that reduce low-value tasks and reduce the reliance on third parties and standardized processes for training to embed lasting change across agencies. Adoption has been strong. Usage of foundational AI tools has more than doubled since Q2. We are already seeing results. On the revenue side, AI-powered content production is helping us win new business in automotive, gaming, retail, and tech. On the margin side, the platform is streamlining workflows and improving efficiencies. Generative AI token usage is up 40% since Q2, showing strong adoption and impact. In addition to margin execution, our approach to cash flow and capital allocation remains a clear lever in driving shareholder value. Cash flow from operations year-to-date was $31 million, up $100 million year-over-year. This reflects sustained benefits from working capital initiatives, including media system rollouts, shared service migrations, and tighter oversight. We've also reached a scale that allowed us to negotiate better terms with certain media partners globally, easing working capital constraints. We view these gains as sustainable and believe this strength is now fully reflected in our current trading multiples. Turning to capital deployment. Year-to-date CapEx totaled $72 million, including $45 million in capitalized software, primarily supporting technology investment in the machine, the Stagwell content supply chain, market research platform and ongoing product development with The Marketing Cloud. Additionally, $26 million was invested in the acquisition of key data assets underpinning our IP platforms, along with necessary technology refreshes and leasehold improvements. We repurchased 7 million shares for $37 million in Q3, bringing our year-to-date repurchases to 17.6 million shares for $90 million. $80 million remains available under our approved plan. Our net leverage stood at 3.4x at quarter end. With Q4 typically our strongest cash period, we continue to target net leverage below 3x by year-end. We ended this quarter with $132 million in cash and maintained strong liquidity, including $312 million available under our revolving credit facility. Looking ahead, we remain focused on generating strong operating cash flow to support strategic initiatives. Our approach has evolved throughout the year, shifting from acquisitions to investing in technologies that position us to lead and grow as the industry evolves. The momentum we've built throughout the third quarter gives us the visibility to reiterate our full year guidance. We expect approximately 8% total net revenue growth, $410 million to $460 million in adjusted EBITDA, $0.75 to $0.88 in adjusted EPS, and free cash flow conversion of approximately 45%. With that, I will turn it back over to Ben for questions.
Thank you, Ryan. There are a lot of questions coming in, many of which are focused on Palantir, which was announced this morning. The first question comes from Laura Martin at Needham. Can you provide some background on Palantir? How did they come about? Additionally, there are several questions regarding the total addressable market and the size.
It really came about from discussions I had with Alex Karp about how we could take the unique targeting and AI capabilities of Palantir and for us to bring our unique experience in the marketing field together. And from those discussions, we set up 2 teams and the 2 teams went for 5 months developing the prototypes, which we began to show clients last month and the agreement to then go ahead and dive all the way in here to create what I consider to be the holy grail of marketing. That combination of data, technology, and AI that will enable clients to say, well, let's run the back-to-school sale now and to have the marketing system bring together the content, data, find the audience and really manage and drive campaigns. And I think this is something that really will take companies—large-scale companies who have tremendous data today but can only use a fraction of it—and really open it up down to the retail customer manager level so they can deploy this technology. So, we're really obviously excited about it, and that's how it came about, and that's how the commitment came about to move forward.
And then maybe a little bit on the TAM and the opportunity set and also kind of a deep dive into what incremental infrastructure investments or CapEx, OpEx might be required to kind of get the partnership up to speed.
Sure. I mean, look, I think the TAM is enormous. I think these are $5 million and $10 million installations. I think this is something that one way or another, every major company is going to have in today's AI-based marketing world. Will some try to develop that on their own or others do utilize our system? Will competitors emerge? We think as we reviewed with a recent potential customer, we said we're clearly ahead of the others out there in the marketplace in terms of being able to really bring together data, AI, and marketing sciences. We're already—we made a pivot this year and said, let's take the acquisition money, let's transfer it over to technology CapEx. AI is really the important new development that transforms marketing. We are the company built to transform marketing, myself with the experience in technology, Code and Theory having 1,500-plus engineers. We have the capabilities, which combined with the incredible teams at Palantir and their ability to bring things also to market. I think that gives us a tremendous opening. So I think that the TAM here is really quite enormous.
And just on timing, a couple of questions about P&L impact when it might start to flow through. Is it a Q4 phenomenon? Is it a 2026 phenomenon? How do you think?
I think it's definitely a 2026 phenomenon. I think that we are moving from MVP. The teams are baking the next versions. I think in an AI world, you talk months, not years. I'm really expecting significant revenue by the end of 2026 for sure.
Great. I just wanted to throw a question to Ryan here because you mentioned the CapEx side of things. Obviously, a little bit of an uptick in CapEx this year. Could you maybe just elaborate on it a little bit more about what drove that?
Sure. I think that underpins Mark's direction, the shift from acquisitions to technology. About $55 million of that is spread across a number of investments ranging from the machine, the Stagwell content supply chain, is in there for content creation, product development within the marketing cloud across a host of products as well as innovations in some of the market research and the underlying data feed that feed all these systems. So, Mark made this direction at the beginning of the year, you're seeing that flow through in the results.
Great. I want to pivot a little bit. I have a question here sort of talking about our media business. And the question is from Steve Cahall at Wells Fargo. It appears that much of the growth in the industry is being captured by some of the larger-scale players. Do you view media as a core function for Stagwell? And if so, do you have a plan to address Stagwell's position within the media ecosystem?
Yes, our plan has very much been to upgrade our capabilities in media based on technology. We're not going to be able to beat these large players on the basis of scale, but we can beat them on the basis of better technology and better use of data and information. And that's exactly where we're going. So we think that as we deploy the combination here of the content supply chain, the machine, and the Palantir holy grail of marketing, that will create a very competitive media offering that will enable us to push that. The second strategy here is really that we are buying media so that we have our principal media is really owned media. We're particularly focusing on the news, politics, and information sector because we think that there are really good buys in media. And the truth is what's happened is viewership of politics and political events is skyrocketing with interest. So we think that's going to be a hugely valuable area that we'll be able to deliver really strong ROI media for clients.
I think part of that is the RealClearPolitics, Real Clear Holdings announcement earlier this quarter. Could you maybe elaborate on that? A question from Barton Crockett just asking some additional color on that at the moment? Why you do it? What is the owned media strategy over there?
Yes. I think exactly we're going to be working with the RealClearPolitics team to create new innovations. I discovered when I was working at Microsoft, when you get near the elections, RealClearPolitics was the #1 search politically related team. And so it will get enormous traffic that we now have a good opportunity both for the midterms and for the presidential election to really work with the RealClearPolitics team, reengineer the sites, and I think tremendously upgrade the monetization of those sites and their effectiveness. So you're seeing unprecedented interest in news and politics. And that's where we can uniquely play against competitors in terms of owned media.
I want to pivot slightly here, just talking a little bit about communications. It's maybe the only area of weakness really within the quarter. Could you maybe talk about what we're seeing within that? How much of that is advocacy related? How much of that is sort of a broader PR-related challenge?
Well, obviously, I think there's a tremendous reduction in advocacy-related work in the communications sector. And I think part of that also gets kicked into kind of issues and other related communications work that sort of gets pushed into next year when it becomes more important. But we did see, if you look at the results of competitors, industry-wide softness in that particular sector. And I think that affected us. I think that will kind of straighten itself out once we go into the advocacy year. What's interesting for us is that there are winners and losers in digital transformation. And while some of the digital transformation companies showed real weakness, our digital transformation efforts, even before the deal we announced today, already showed significant pickup because I think that we, in advance, positioned ourselves well to take advantage of the AI revolution. I've always said we were a services company first and then let's get 4,000 clients first, then let's build those tools and take them to market. That was always the vision of Stagwell.
I want to stay on sort of the advocacy government side of things for just a second. A question from Jason Kreyer, Craig-Hallum. With the government shutdown still ongoing, it's going to impact my flight this evening, but that's okay. Does the government shutdown impact Stagwell's ability to penetrate the government opportunity? And what efforts are being undertaken right now to make sure that we're well positioned maybe when government spending comes back?
Well, we previously established government contracts. So—but we actually have begun to win several of those contracts. You don't see any significant effect either way because they didn't exist before, but we will want the government to reopen because it will enable the signing and moving forward of that. And I would be surprised if this lasts more than another week.
Got you. Pivoting to the Multicloud, obviously, continued strong growth within the research suite of products and things as well. You mentioned that last quarter, you mentioned it this quarter as well, the potential for a spin-off of it. Question from Barton Crockett of Rosenblatt. What kind of performance would be required for that? And what are the criteria that would need to be met for The Marketing Cloud to be spun out?
Well, I think there are several. The first question is, are people looking at Stagwell as the combined services and technology company that it is? If they are, and we see the kind of trading multiples, I wouldn't spin it. If we think that there's greater shareholder value, basically, it has to be at a sustainable level. To me, that means at least $250 million or $300 million of revenue in order to be of substantial margin. And for you to really see in communications, it really has 3 lines of products: Communications, Research, and Media we're targeting. You can see that really the research is the most advanced, and we're seeing real organic growth and adoption of that. And I'm expecting the other main criteria here is that the 3 legs of the stool in the marketplace are showing substantial growth so that investors will be excited about it.
I want to wrap up with one final question. And obviously, a number of management changes recently. I think you touched on a lot of what I'm about to ask within the script as well. But I think it would be great if you could kind of maybe just summarize the current strategy for the business, the pivot that we've talked about, where are we right now? And as we look kind of over the course of the next 12, 18, 24 months, what's the real focus for Stagwell moving forward?
Sure. Look, the vision of Stagwell has always been to get to global full-service down to platform self-service. I understand that this was an industry in transformation and to be a transformer as part of that industry. And I think what you see, particularly in this report, is that global full-service for our top 25 client relationships now averages $28 million. When I came 5 years ago, we would have been lucky for that to be $500,000. We've had tremendous growth in the kinds of clients we serve and the relationships that we have because of the operations we have put together, and I think just the right Goldilocks kind of scale. And I think the second leg of that was always then to have a series of self-service and platform products that could then be sold in based on our experience, knowledge, and connections with thousands of clients. It's far easier to develop software than it is to sell. We have a combination of client streams. We placed $5 billion or $6 billion of media. It may not be as big a scale as others, but it gives us enough scale to really understand how to apply AI technology to substantially improve it. And I think that's the shift in focus. We spent really a decade focused on acquisitions. We're now going to continue to do acquisitions as prudently as makes sense. But I think the primary focus of the company is how we can bring AI technology best to marketing.
Thank you, Mark, and thank you, Ryan. That brings to an end the call for today. Please, if you have any questions, don't hesitate to reach out to the IR team, [email protected], and we'll see you in the new year for our fourth quarter results. Thank you very much.