Operator
Good morning, ladies and gentlemen, and welcome to the FrontView REIT's Q3 2025 Earnings Call. This call is being recorded on Thursday, November 13, 2025. I would now like to turn the conference over to Mr. Pierre Revol, Chief Financial Officer. Please go ahead, sir.
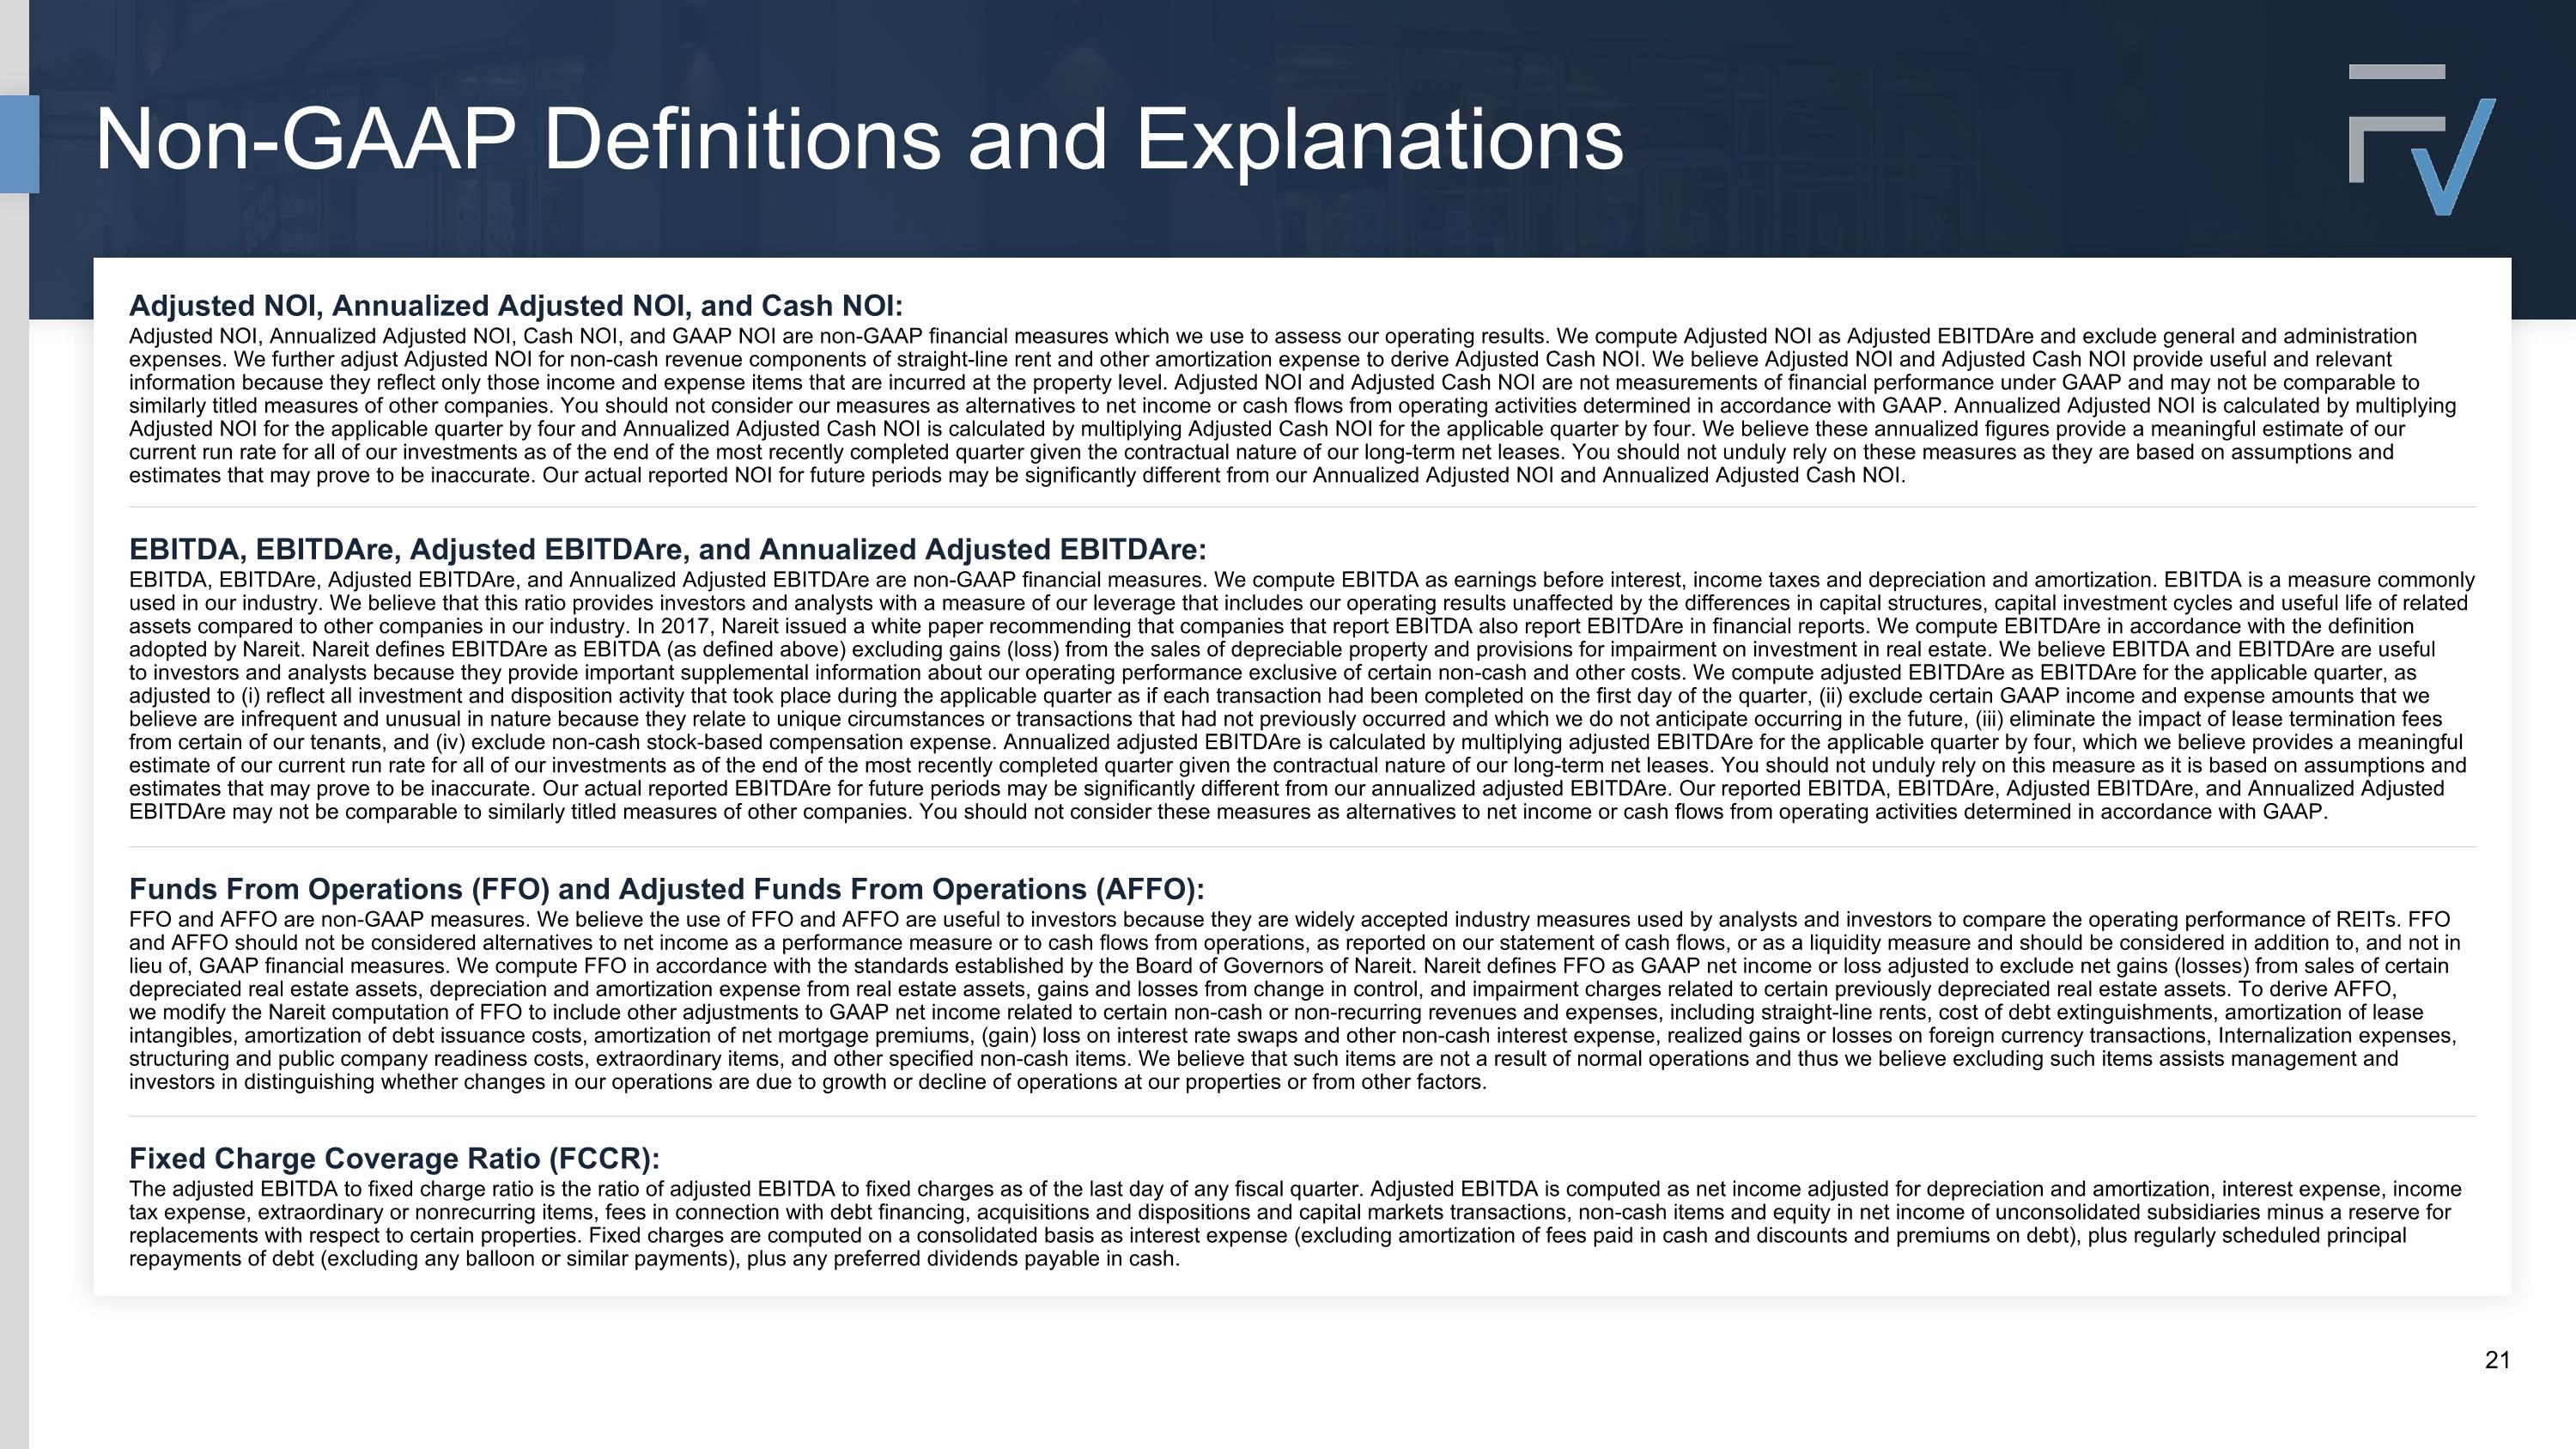
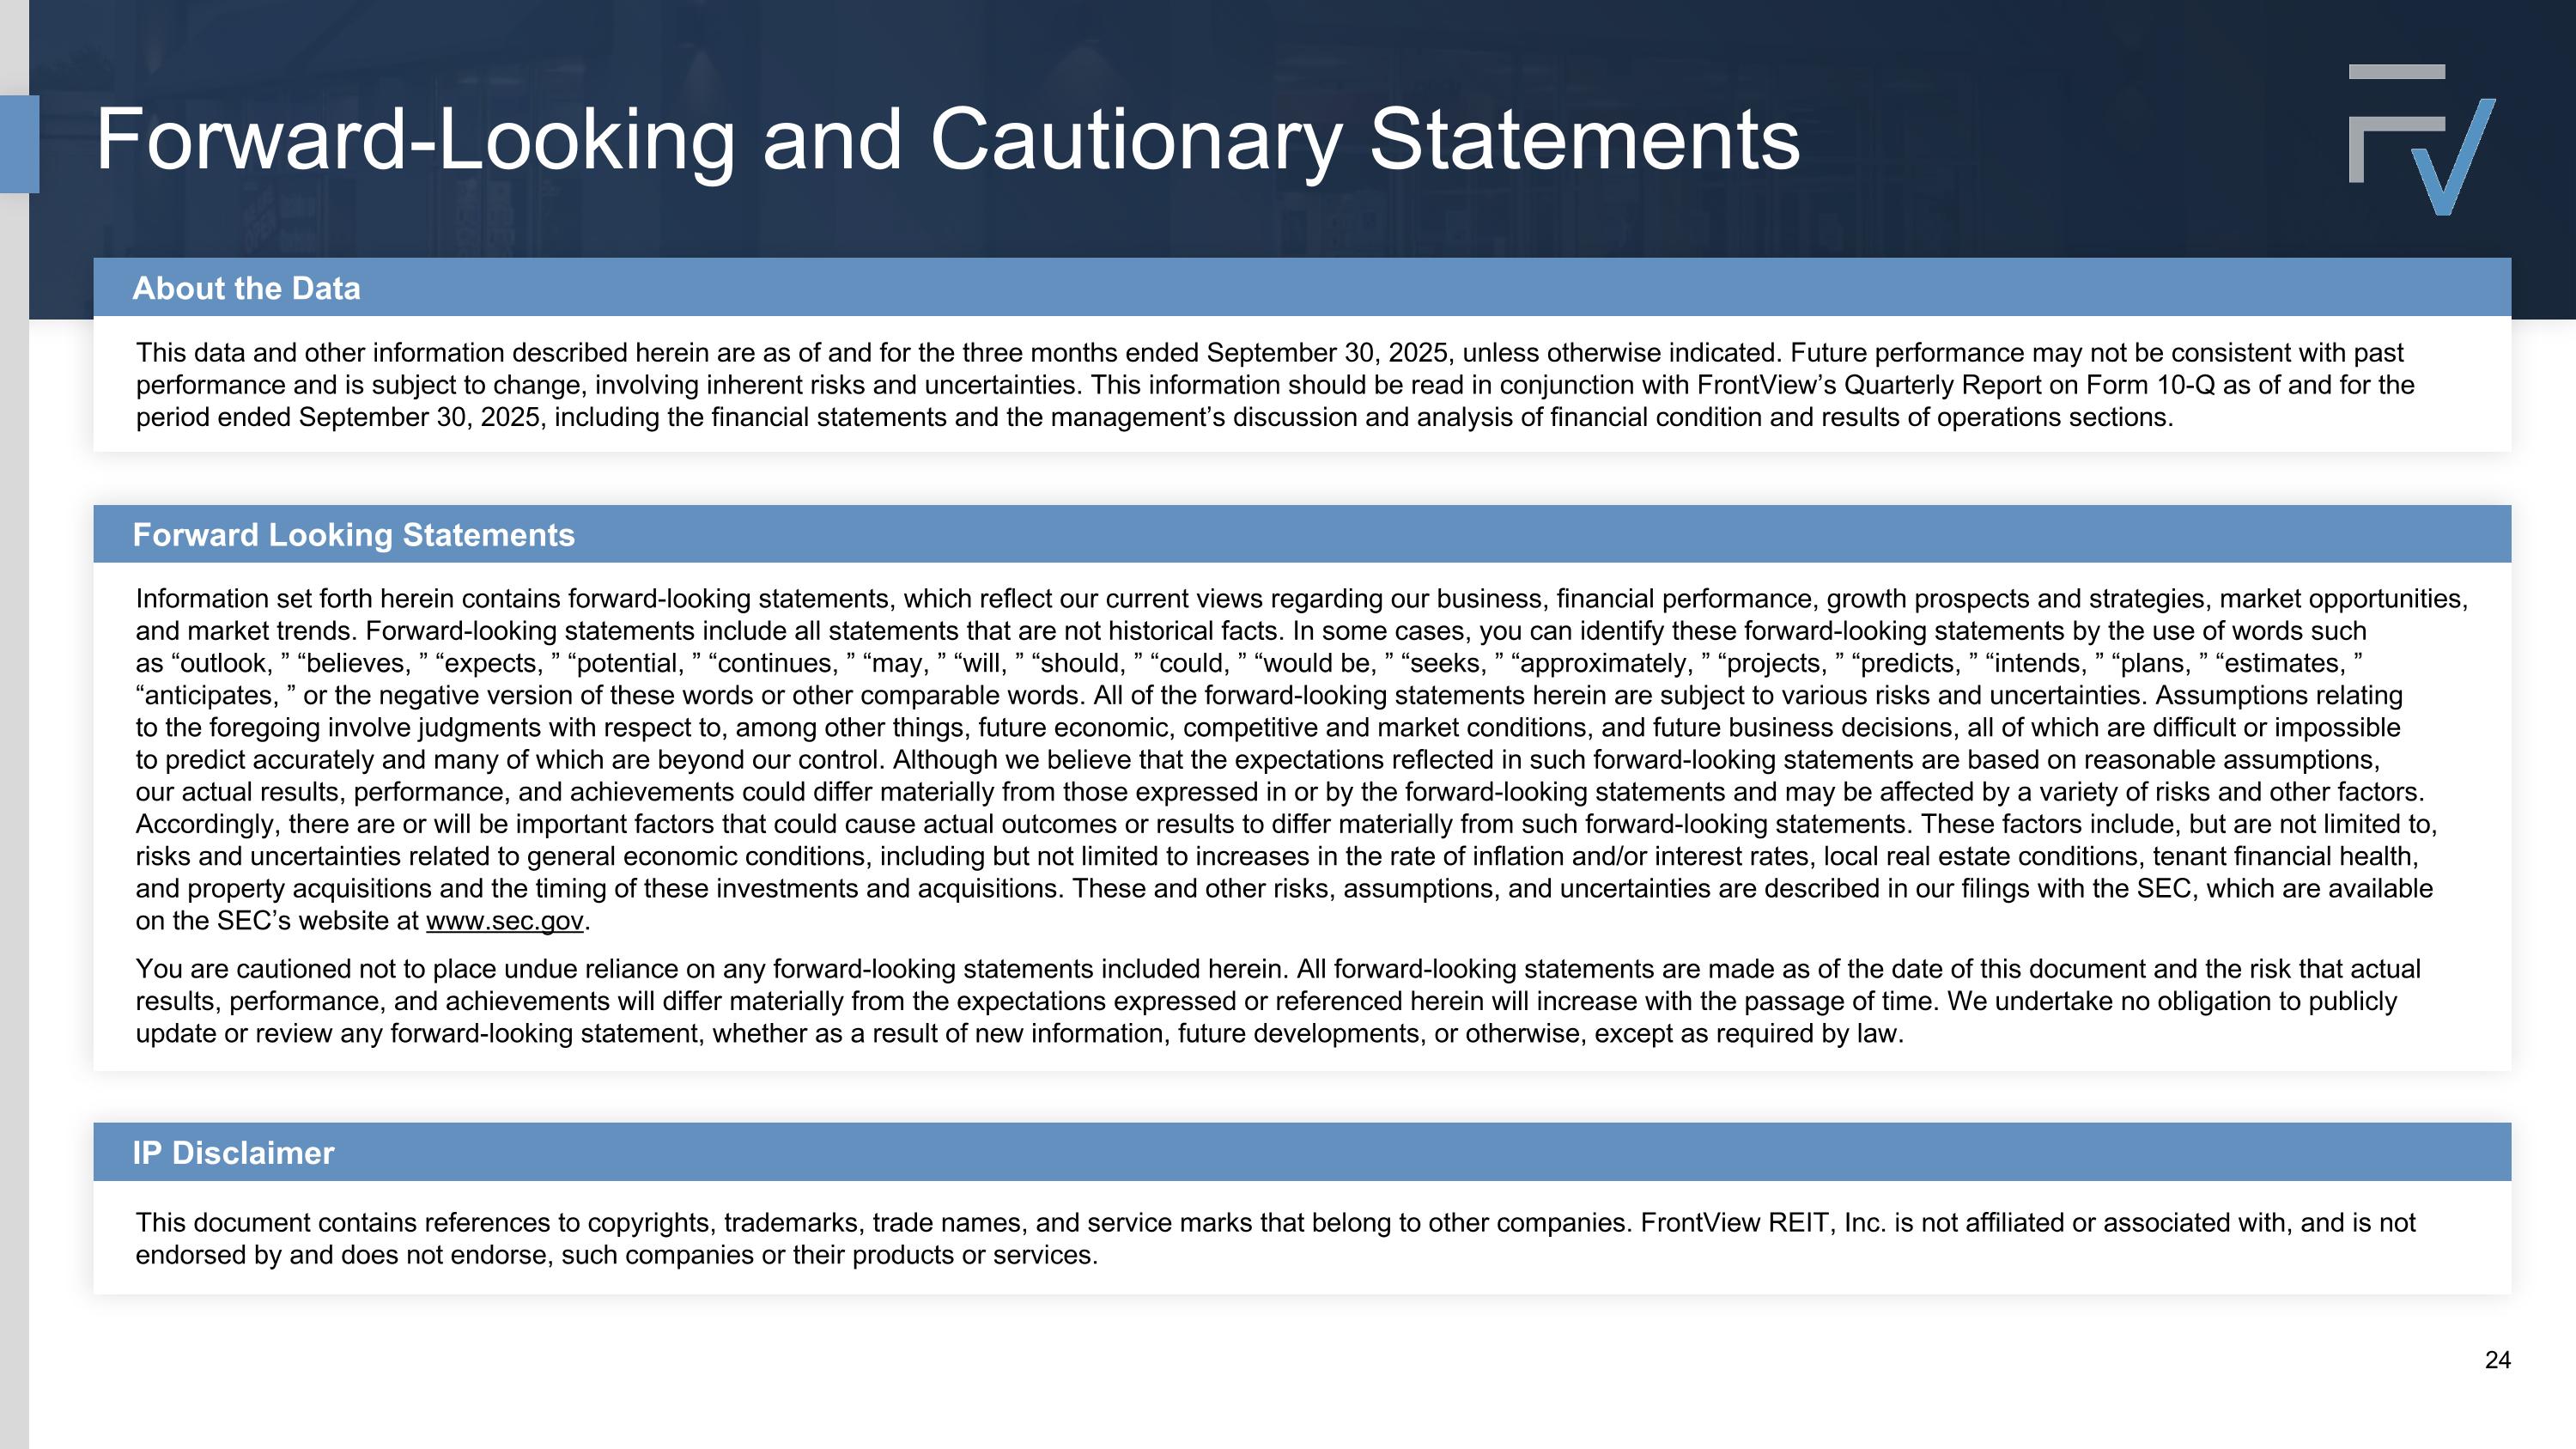
Thank you, operator, and thank you, everyone, for joining us for FrontView's third quarter 2025 earnings call. I will be joined on the call by Steve Preston, Chairman and CEO. Drew Ireland, our Chief Operating Officer, will be available for Q&A. Before we get started, I would like to remind everyone that this presentation contains forward-looking statements. Although we believe these forward-looking statements are based on reasonable assumptions, they are subject to known and unknown risks and uncertainties that can cause actual results to differ materially from those currently anticipated due to a number of factors. I refer you to the safe harbor statement in our most recent filings with the SEC for a detailed discussion of the risk factors relating to these forward-looking statements. This presentation also contains certain non-GAAP financial metrics. Reconciling non-GAAP financial metrics to the most directly comparable GAAP metrics are included in the exhibits furnished to the SEC under Form 8-K, which include our earnings release, supplemental package, and investor presentation. We have also furnished a press release and 8-K for the $75 million delayed-draw convertible preferred equity investment. These materials are available on the Investor Relations page of our company's website. With that, I'm now pleased to introduce Steve Preston. Steve?
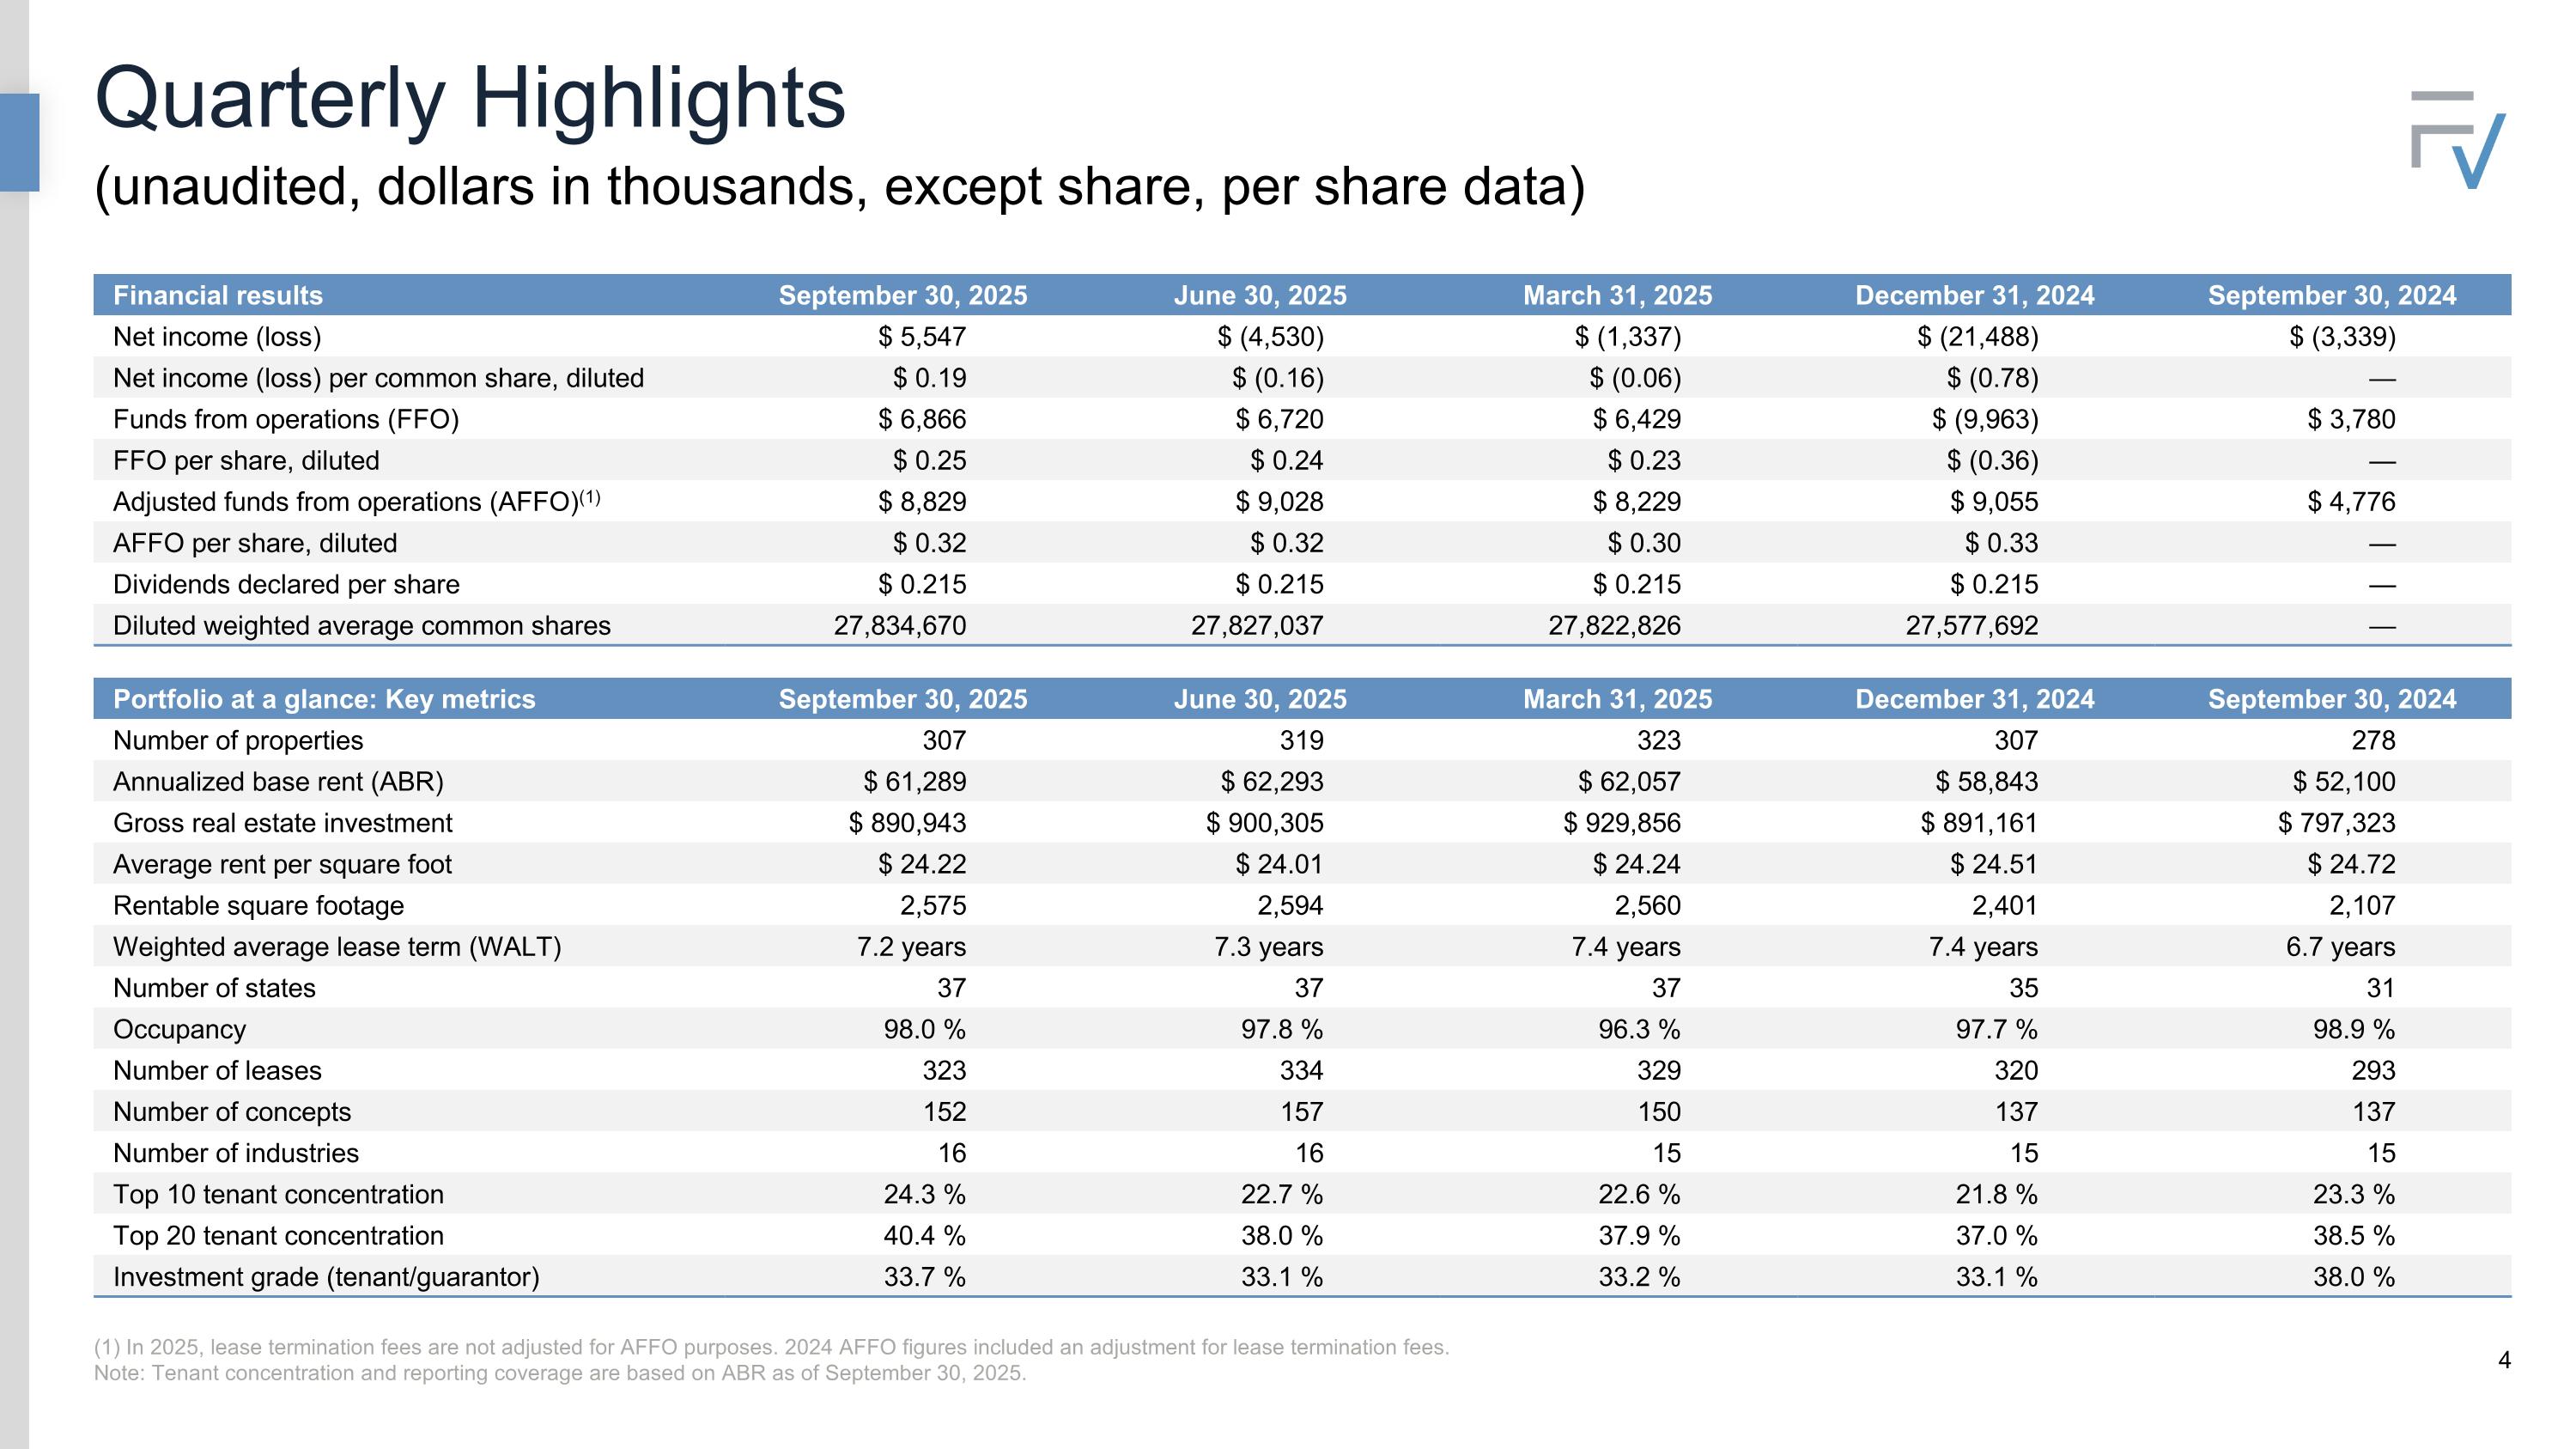
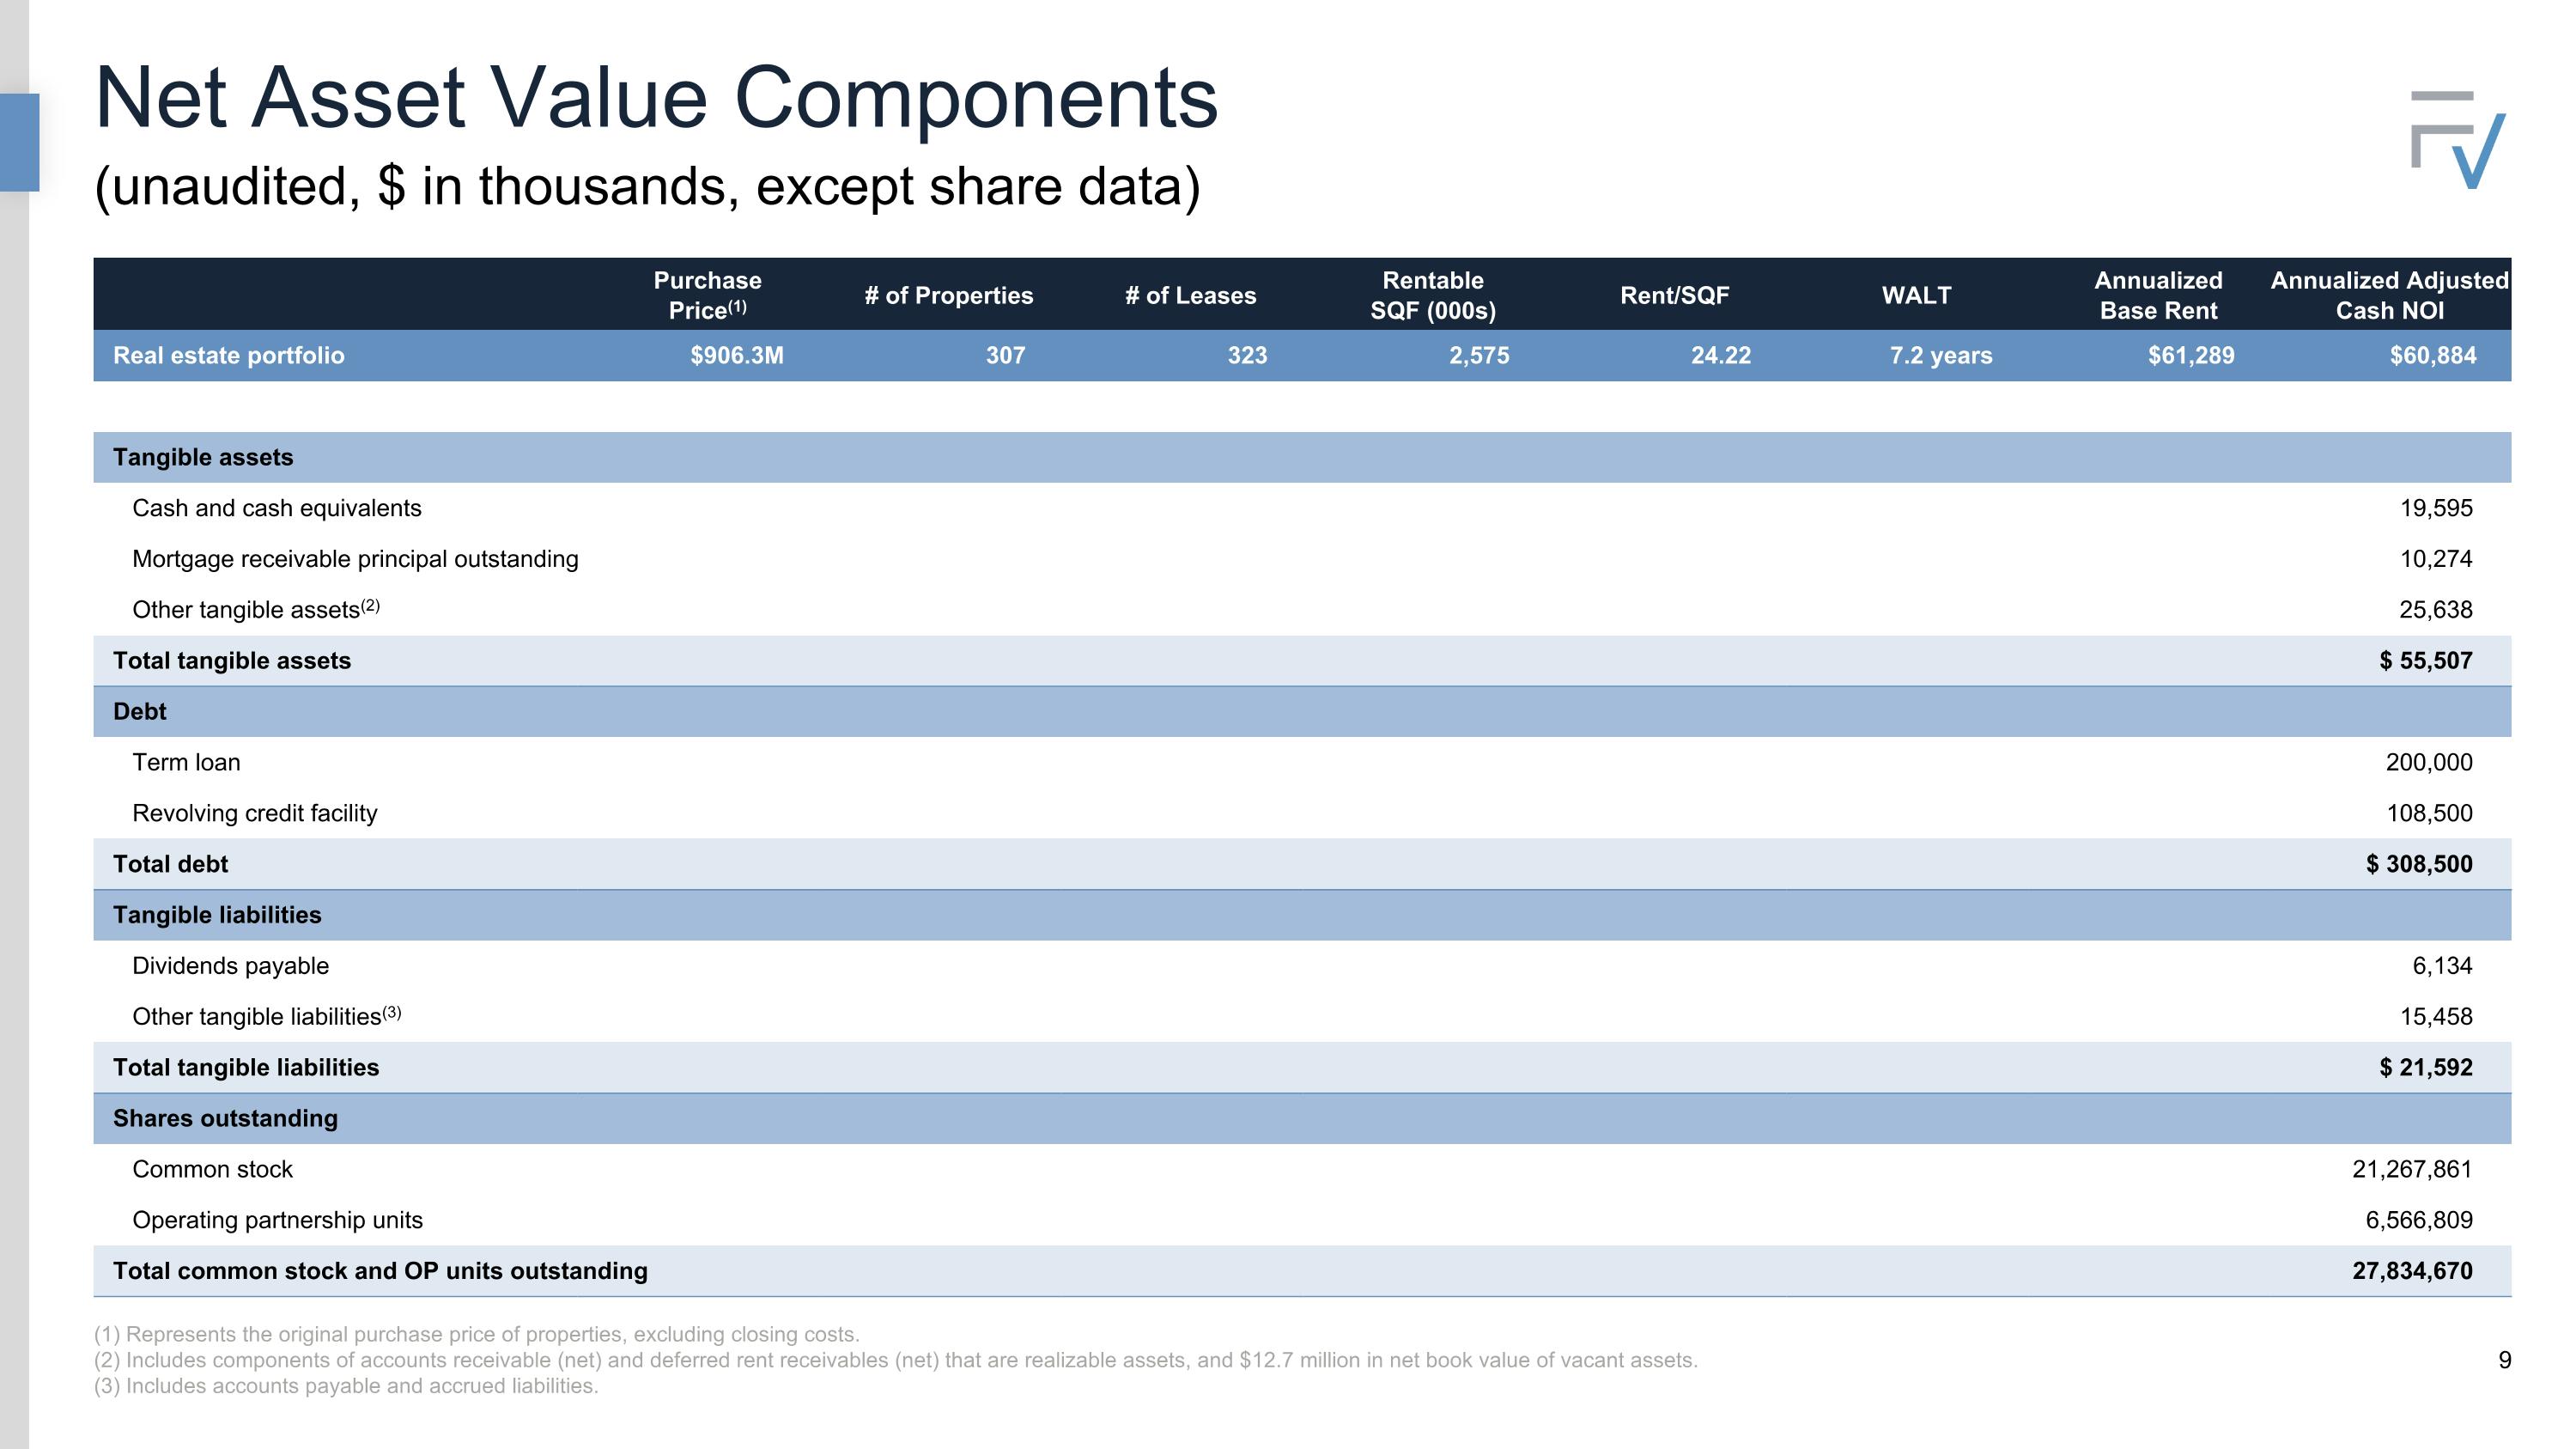
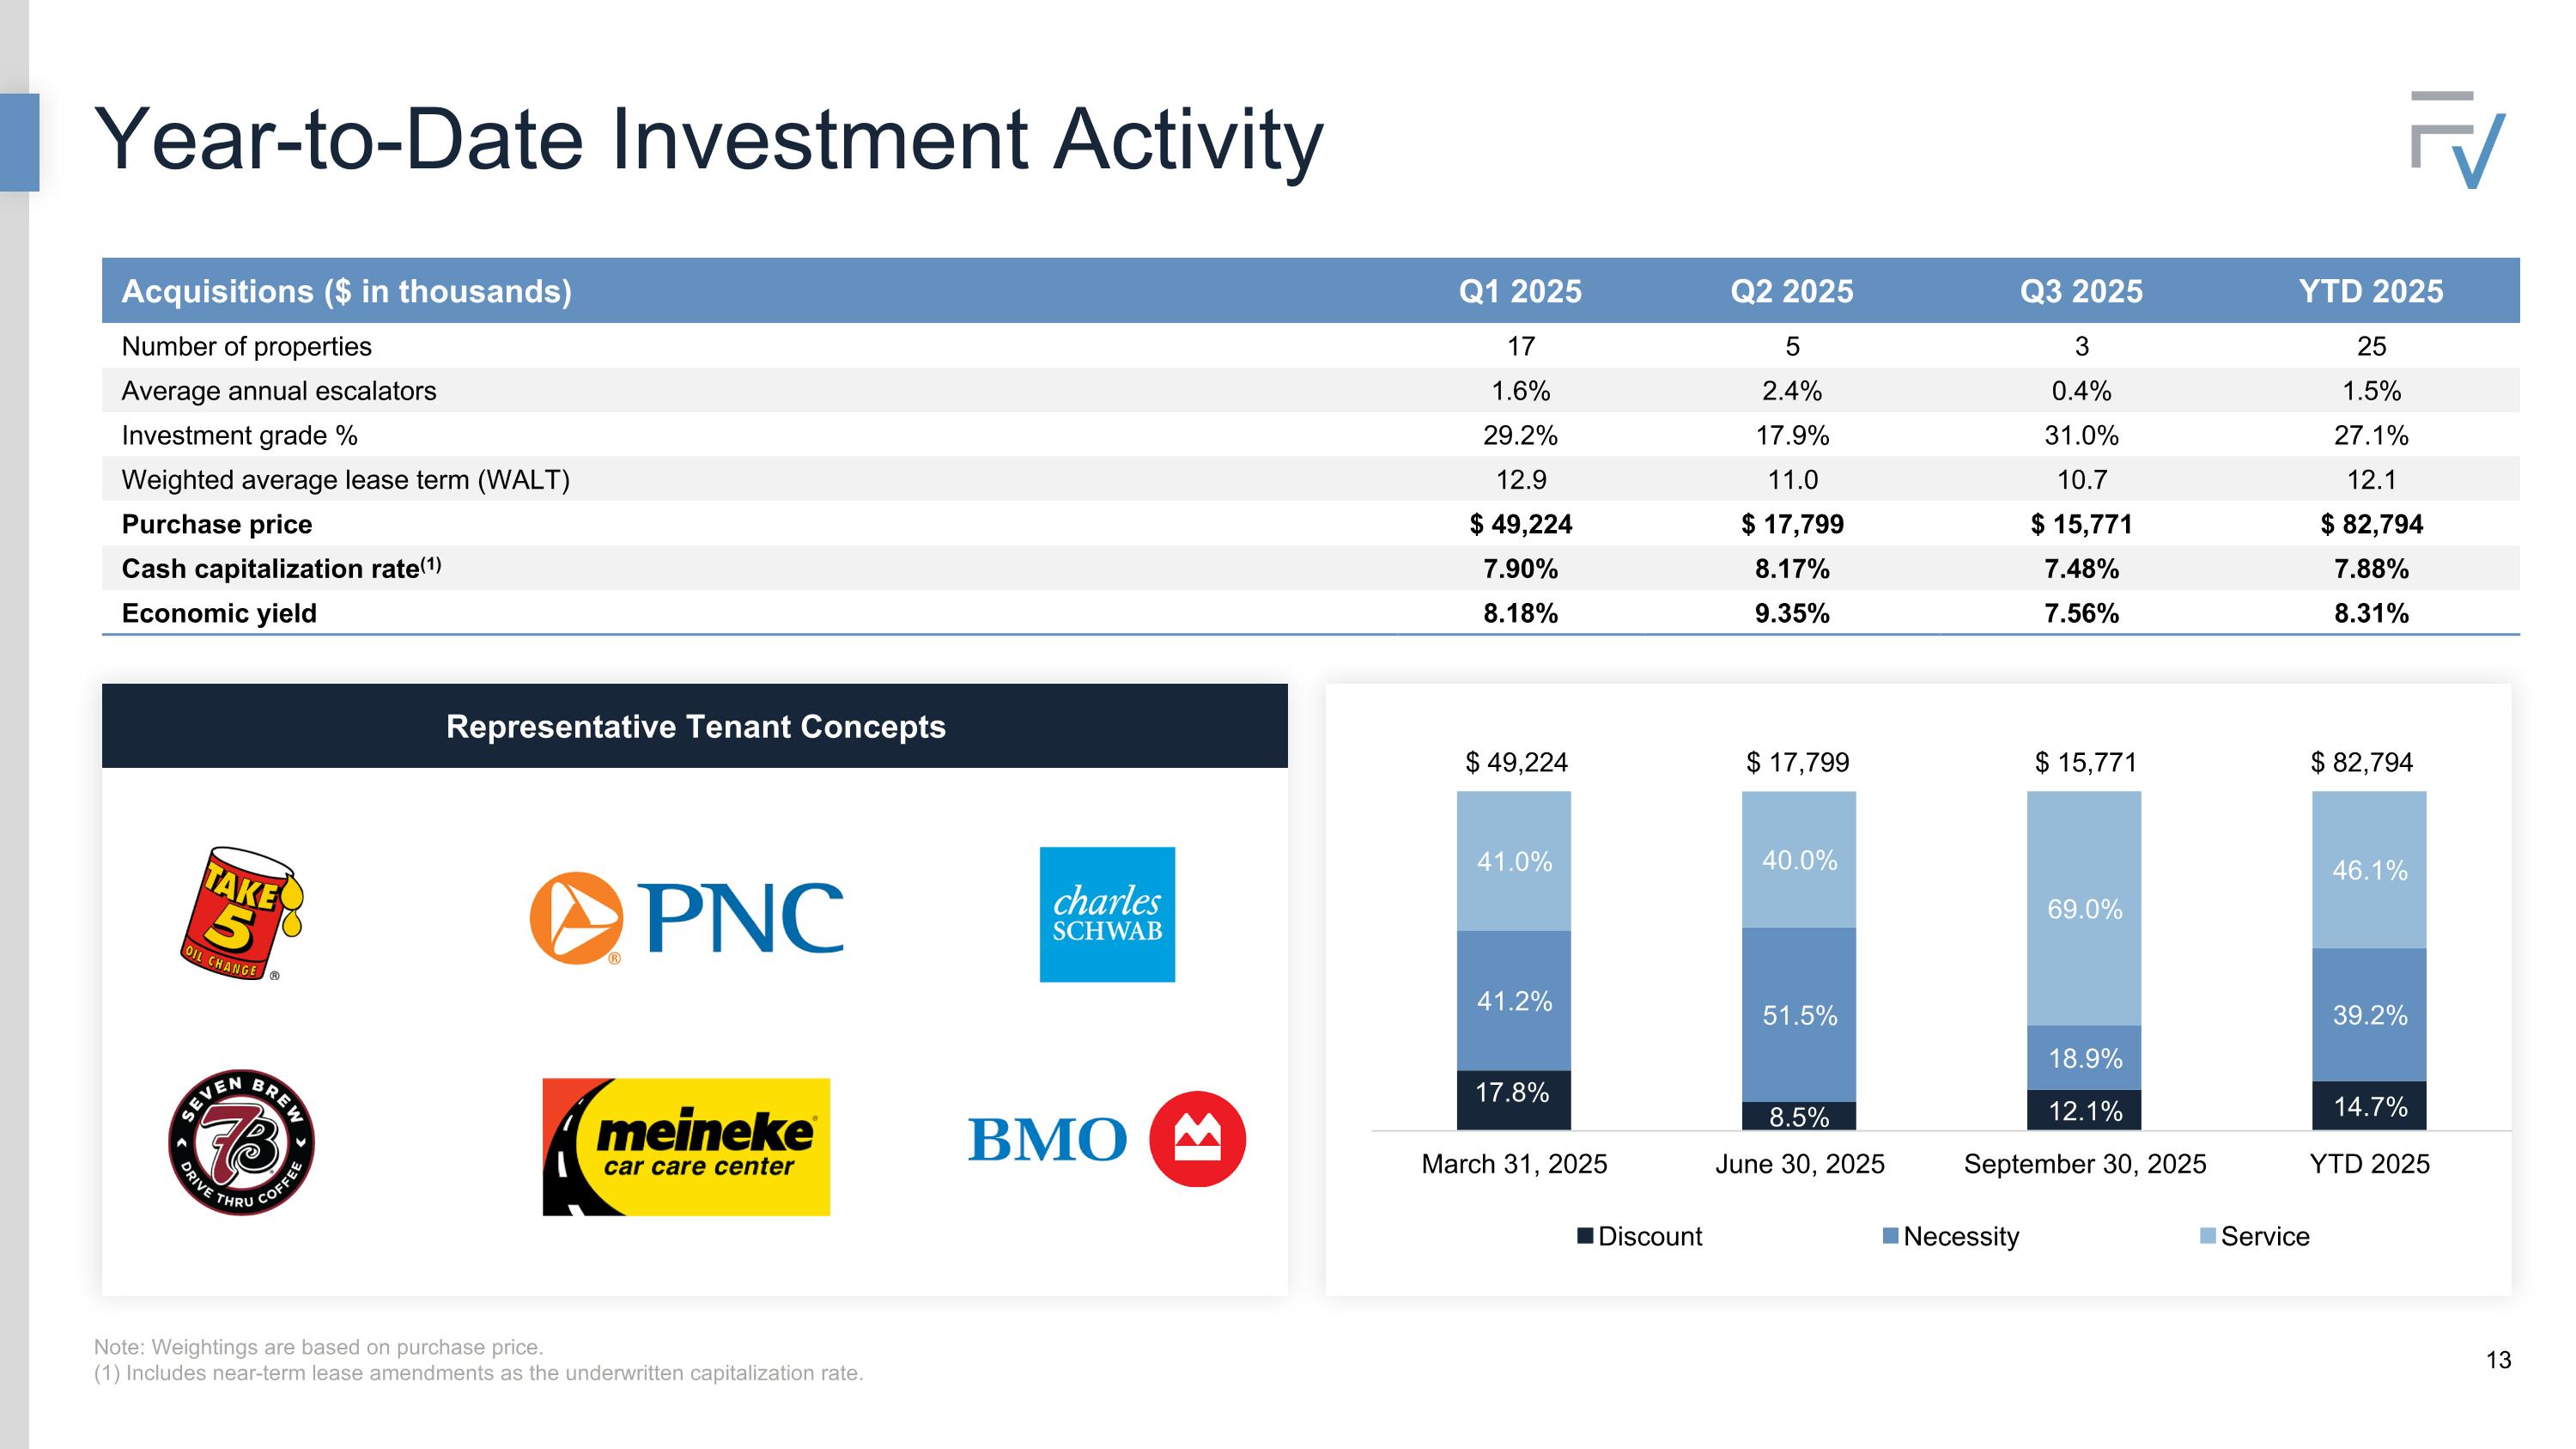
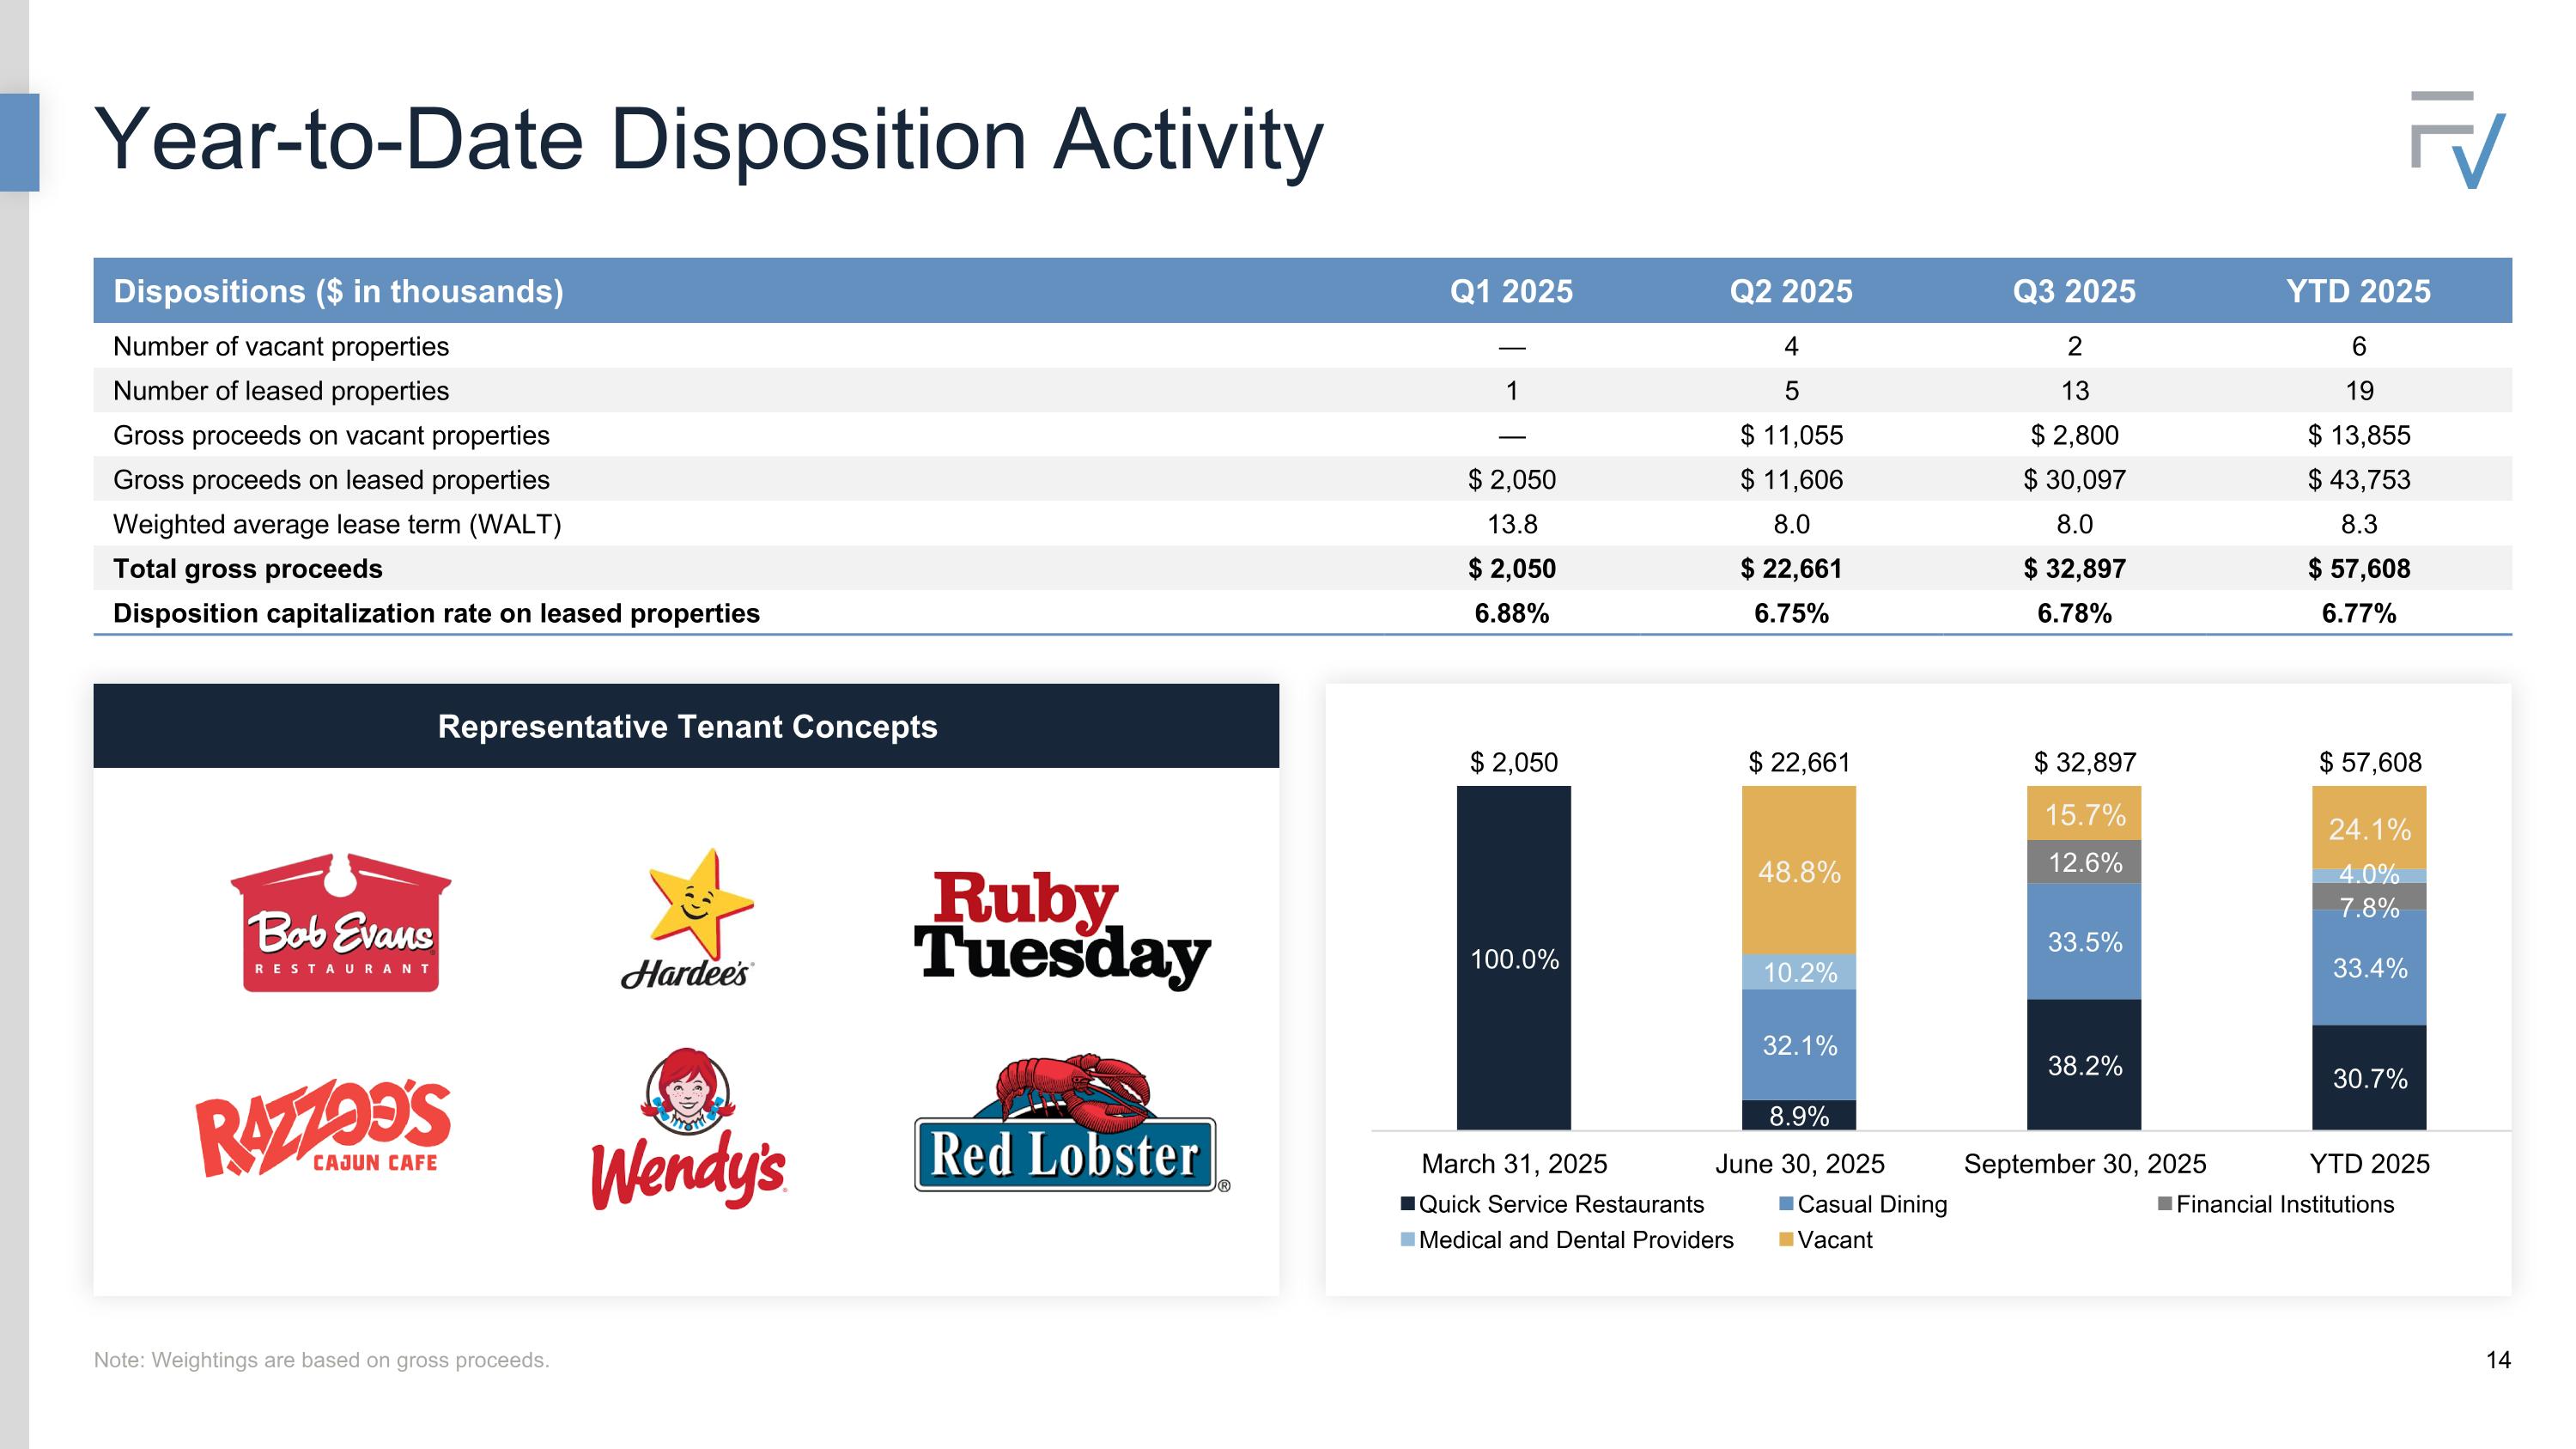
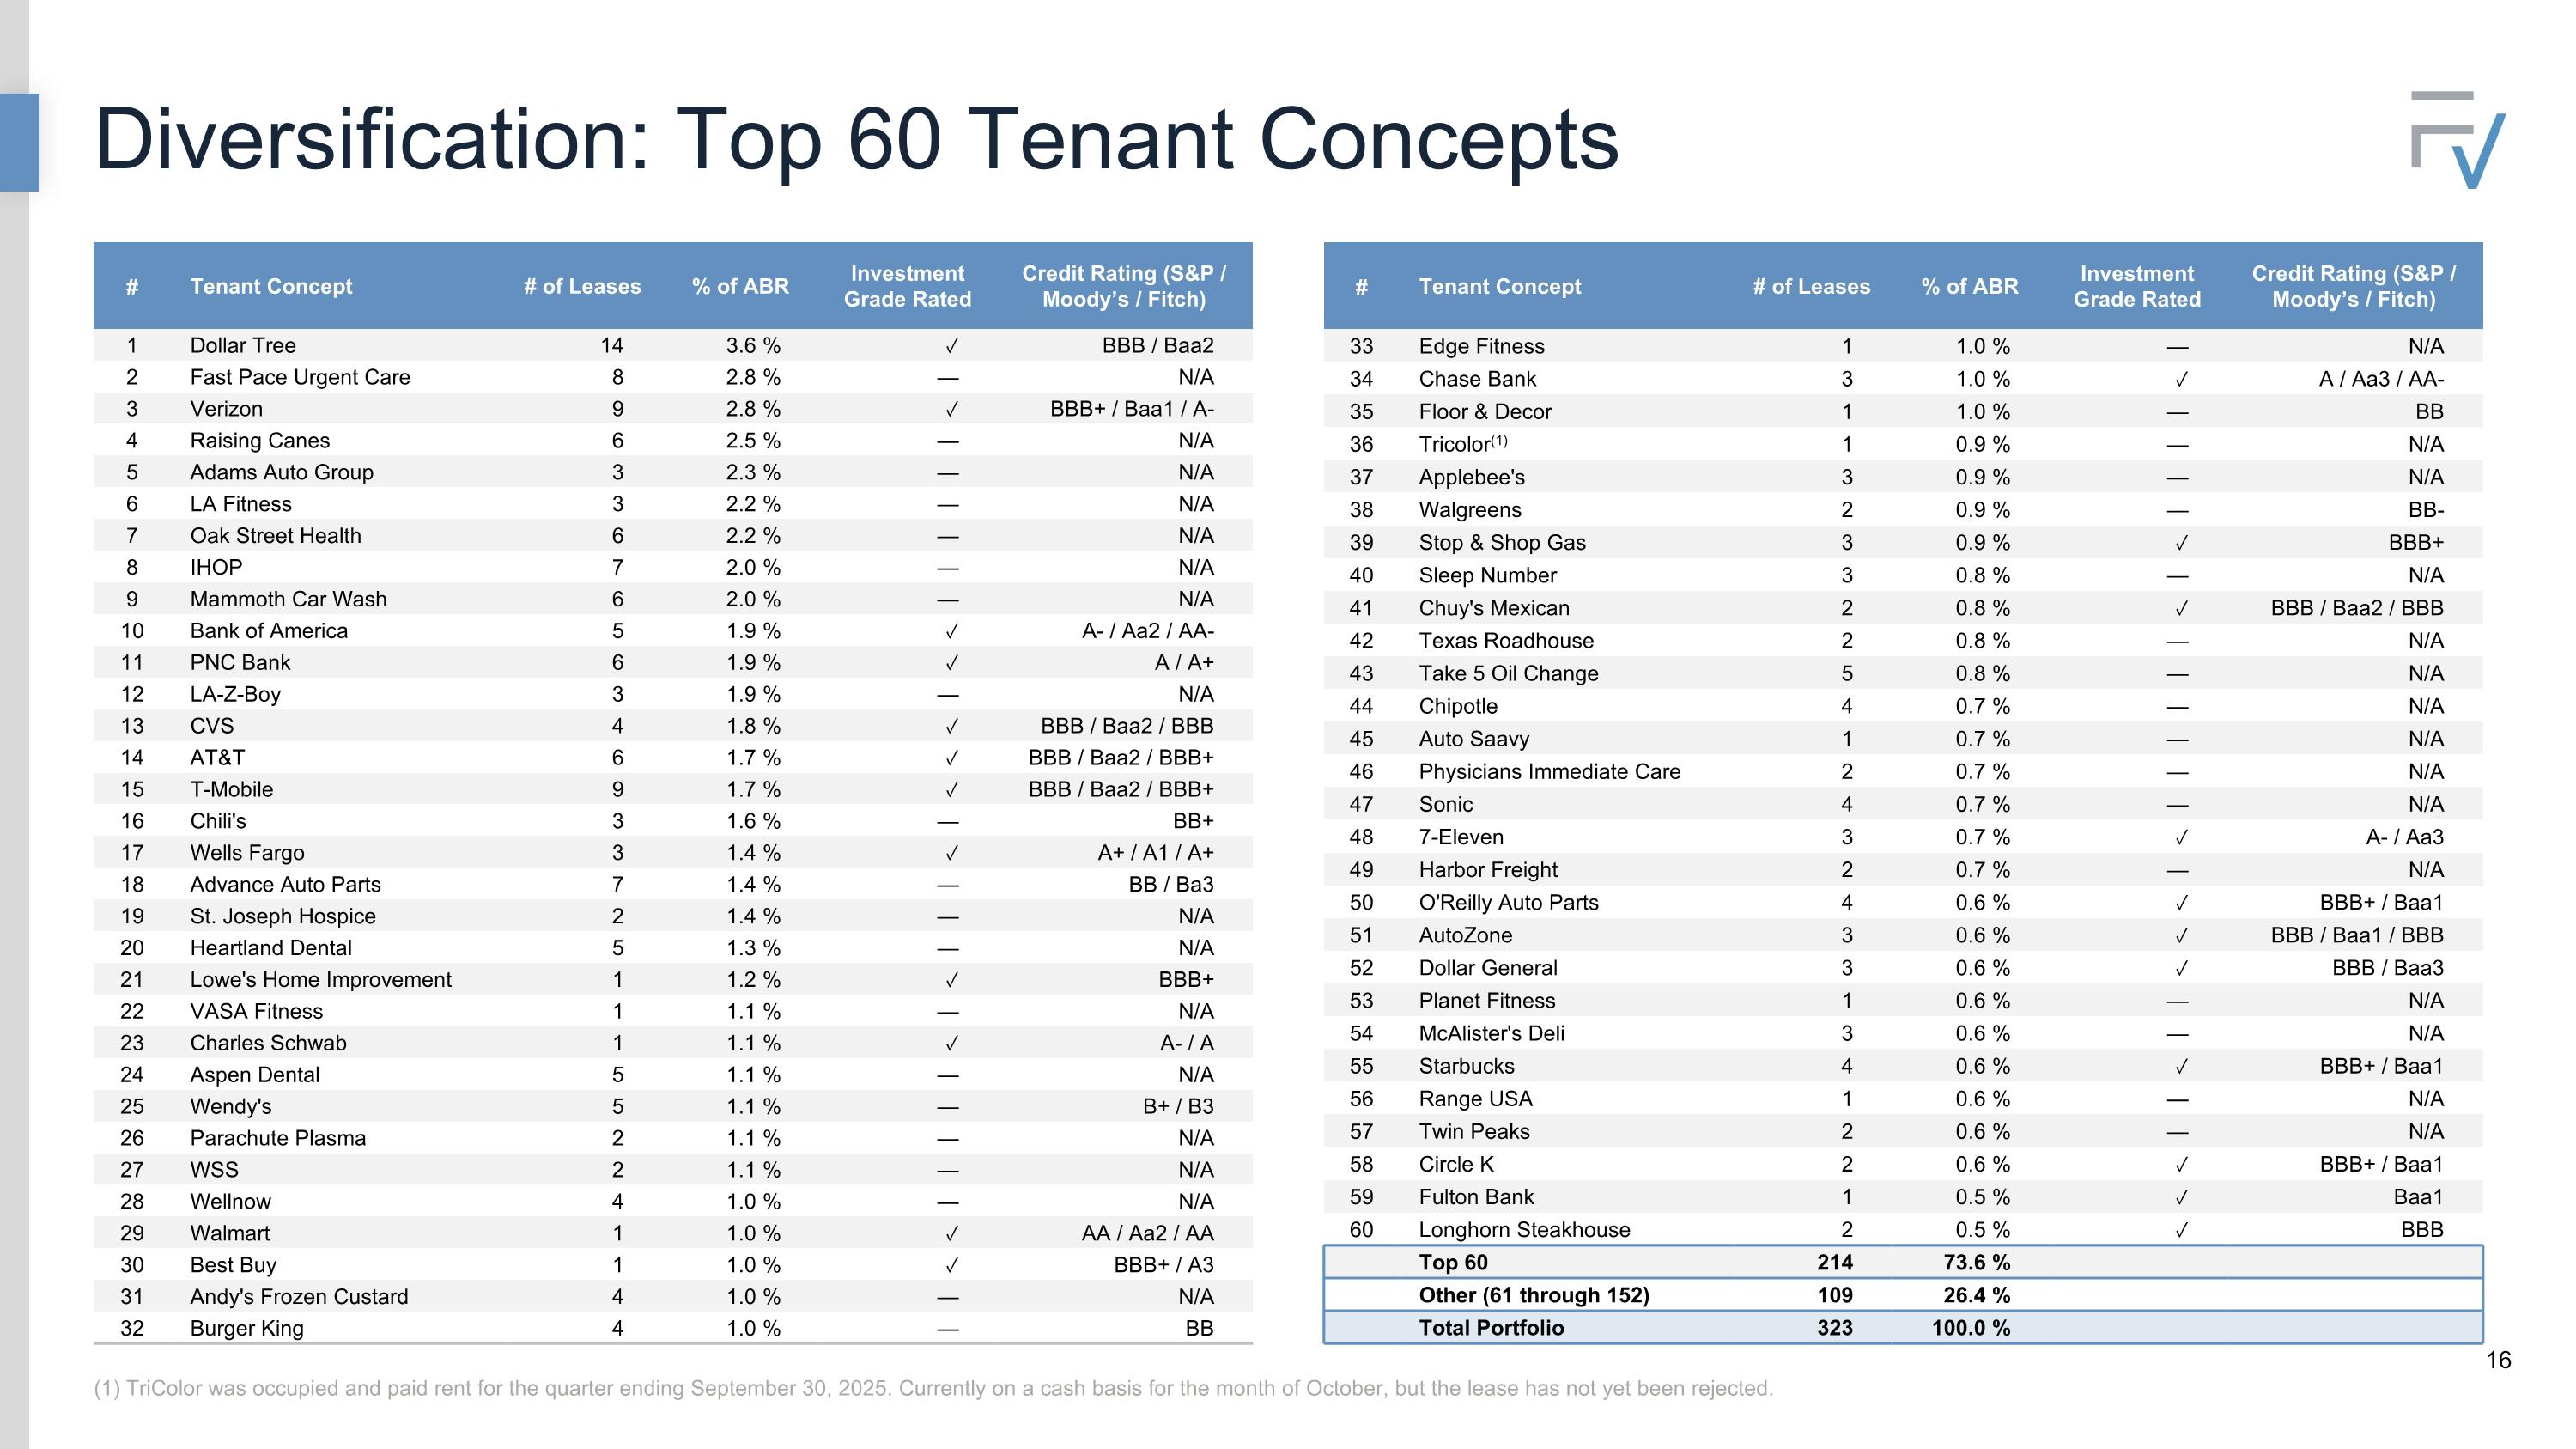
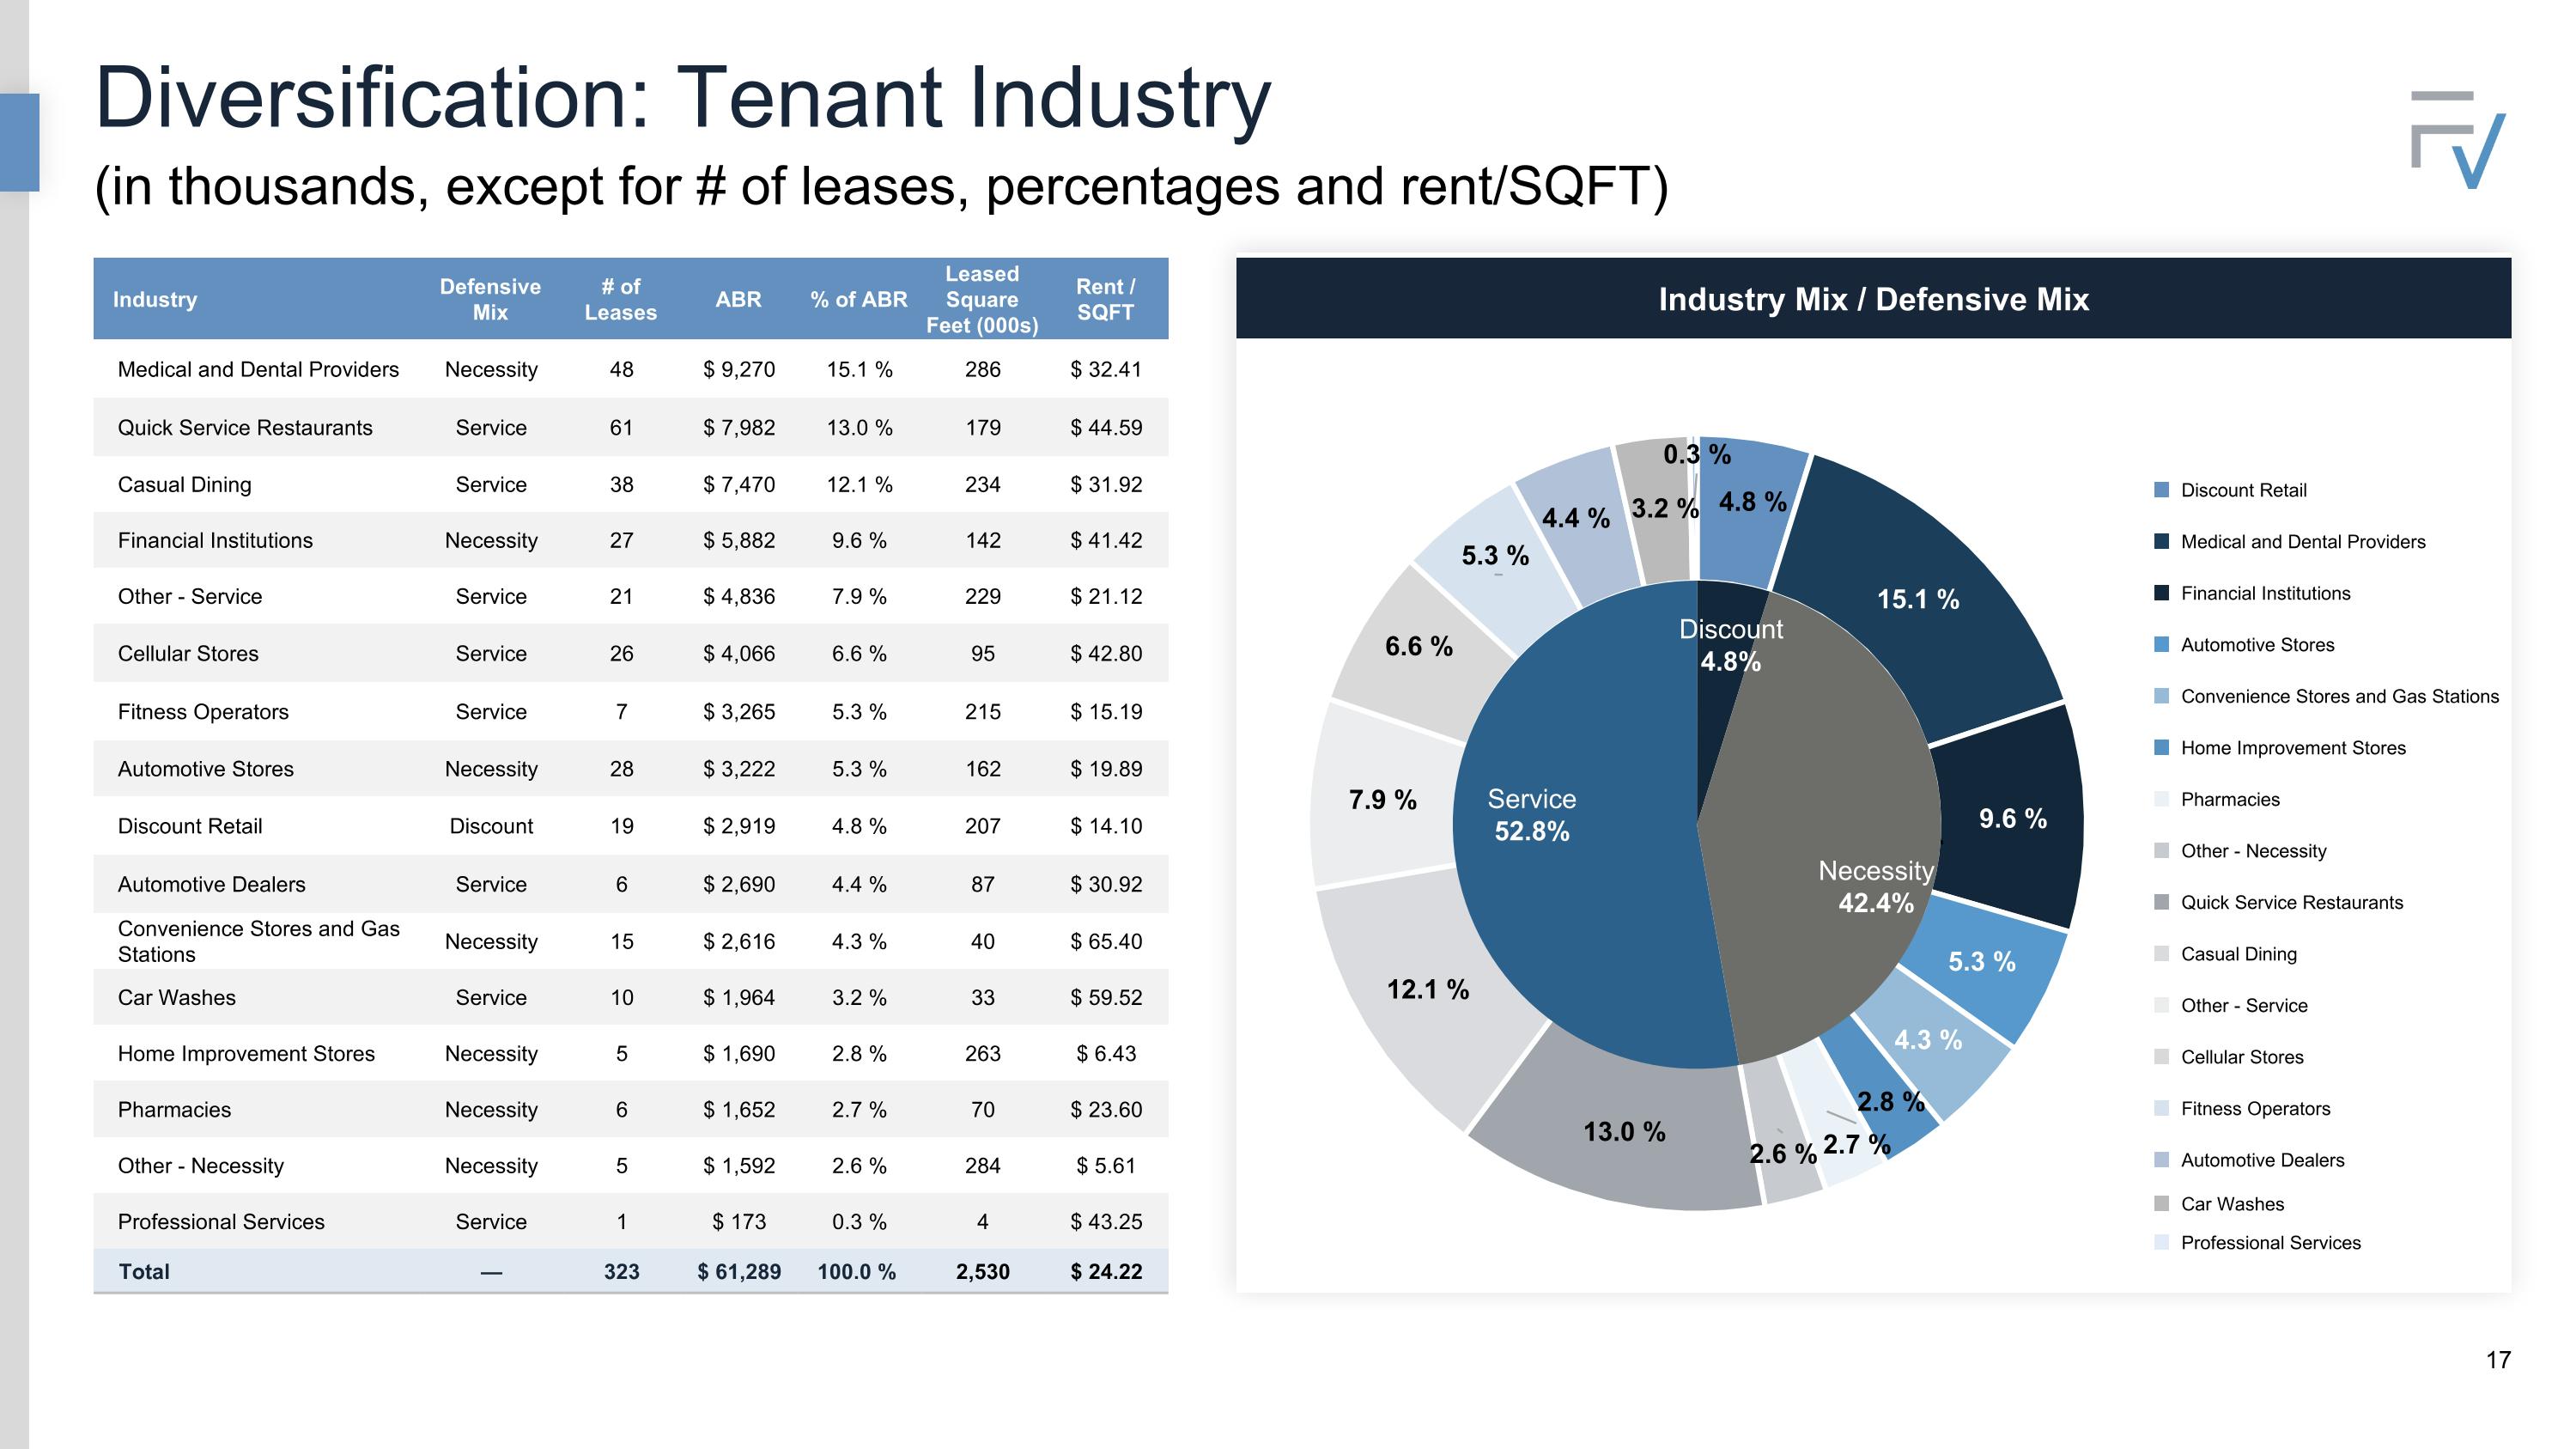
Great. Thank you, Pierre, and good morning, everyone. I'm very pleased to talk about our third quarter today as it marks a powerful, transformative quarter for the company. As a reminder, our portfolio is built around smaller, highly fungible net lease assets, typically located in front of major retail nodes across the country. This real estate positioning gives our tenants visibility, traffic and staying power, which is why we emphasize frontage. The format of these properties makes them easier to recycle, re-tenant, or reposition quickly. And that flexibility is an important part of our strategy. Our tenant base is broad and generally necessity and service-oriented, allowing for consistent demand through the phases of economic cycles. Today we have 323 leases, with the top 10 contributing just 24% of ABR; our top 60 at 74% of ABR; and our largest tenant at only 3.6% of ABR. That diversification is a real strength. Just as important, this approach is unique in the public REIT market as few peers are focused on small format, necessity-driven retail and service tenancies. FrontView has now been public for just over 1 year. Over these last 12 months, we have experienced and worked through a number of circumstances that have made FrontView a stronger company today. To highlight, we have optimized our portfolio. We have an effective C-suite with industry-leading talent. We have been intelligent stewards of capital. We have kept a low-levered balance sheet with ample liquidity. We have demonstrated the value, fungibility and desirability of our frontage assets. We have focused on operational excellence to support increased AFFO per share guidance, all while recycling assets. We have thoroughly revamped our external materials, including our investor presentation, supplemental, and website. We have shown through dispositions that there is currently a significant dislocation in our share price relative to NAV. We have maintained a conservative dividend payout ratio. And finally, we have carefully tailored a perpetual preferred equity investment to have capital in place to accretively grow throughout 2026. I am excited for what lies ahead for FrontView as a public company. During the third quarter, we acquired 3 properties for approximately $15.8 million at an average cap rate of 7.5% with a weighted average remaining lease term of approximately 11 years. From an industry perspective, we continue to add diversification, adding financial, fitness, and discount retail uses. There were several acquisitions planned for the third quarter that shifted into the fourth quarter as reflected in our guidance. The acquisition market remains very open to FrontView with our competitive advantages in tow. So our timing in securing this accretive capital is particularly well-suited to continue to take advantage of our buy-side opportunities within the marketplace. In terms of property dispositions, we sold 15 properties for $32.9 million during the quarter. 13 were occupied properties, generating proceeds of $30.1 million at an average cash cap rate of approximately 6.78%. These properties have an average weighted lease term of 8 years. Our current target dispositions are assets with lower walls and/or less optimal concepts. For example, through our recent dispositions, we have eliminated all portfolio exposure to the following concepts: Ruby Tuesday, Red Lobster, Bob Evans, Red Robin, Freddy's, Denny's, Dairy Queen, Hardee's, Cafe Rio, and Rogers. Although these concepts are household names, national or regional tenants that were rent-paying, we are focused on optimizing the portfolio by disposing of concepts that we think are or could become under pressure in the future. These asset sales demonstrate the continued desirability and liquidity of our real estate assets and highlight the meaningful spread between our stock's implied cap rate of approximately 9% and where our assets are transacting in the market, where our peers' implied cap rates are, both approximately 6.75%. Looking at net investment levels, we were again net sellers this quarter and our debt to annualized adjusted EBITDAre fell to 5.3x with an LTV below 35%, leaving the company's balance sheet profile and liquidity in fantastic shape. Turning to the portfolio. We closed the quarter with occupancy north of 98% and just 6 vacant assets, an improvement from last quarter. We have resolved the 12 previously reported troubled assets with 10 either sold or leased and 1 under contract to sell, with an overall recovery rate of approximately 85% for these 11 assets. Additionally, as has been broadly highlighted in the media, Tricolor's alleged fraud impacted several large financial institutions with losses in the hundreds of millions. We had 1 Tricolor property, and we have already received multiple offers to buy and multiple offers to lease the property. Based on these prospects, we are confident we will have an excellent outcome with minimal downtime and affirmation of our frontage-based strategy. Our assets are located in high-visibility, high-traffic corridors, properties that attract a diverse mix of users. That allows us when necessary to re-tenant, repurpose, or sell efficiently to unlock value. As we've optimized the portfolio, what remains is a higher-quality, better-tenanted portfolio with stronger concepts. As a result, we don't see any material additions to our watchlist at this point. To be clear, we see bad debt in the approximately 50 basis point range for 2026, more in line with historical averages. Simply put, this is what disciplined capital allocation and active portfolio management look like: a stronger, higher-quality platform positioned for sustainable growth, resulting in us raising our earnings guidance for the year. On the capital side, last night, we announced a $75 million convertible preferred equity investment. This is a bespoke instrument that we spent a considerable amount of time negotiating over the last couple of months. Pierre will provide more of the details on specifics. But from a bigger picture strategy standpoint, this security is unique in its simplicity with generally superior terms to that of comparable instruments. One, we anticipate the pref will fund our 2026 net acquisitions. Two, the capital is accretive when deployed. Three, we can draw down capital in tranches over time as we acquire assets, without paying any penalties or expensive carrying costs. Four, the transaction costs are well below market. Five, after 2 years, we have the ability to force-convert the pref to equity at a $17 conversion rate if the shares are trading at a 17.5% premium. Six, the security is open for repayment after 3 years at par. Seven, there are no make-whole provisions. And finally, there are no onerous governance requirements. This capital raise was led by Maewyn Capital Partners and its founder, Charles Fitzgerald. Charles has nearly 3 decades of public markets investing experience, including founding V3 Capital and co-managing REIT portfolios at High Rise and JPMorgan. Charles is joining our Board as part of this investment. Maewyn also owns just under 1 million shares of common stock, roughly 3.4% of the fully diluted shares. That alignment with both common and preferred capital at work, at the level of discipline and capital allocation focus, that should benefit all shareholders. To wrap up, I believe that FrontView is stronger today than at any point since our IPO. We have a portfolio with flexibility, a top-tier management team with deep industry experience, and a balance sheet that positions us for growth. Our goal is straightforward: to continue to build a best-in-class net lease REIT that can grow faster, allocate capital smarter, and maximize shareholder returns. Today's valuation gives investors an opportunity to invest in our company at a price well below today's standalone asset values. And certainly, the valuation does not properly reflect the quality of what we've built or the growth and opportunity ahead. With that, I'll turn the call to Pierre to go through the quarterly numbers and guidance.
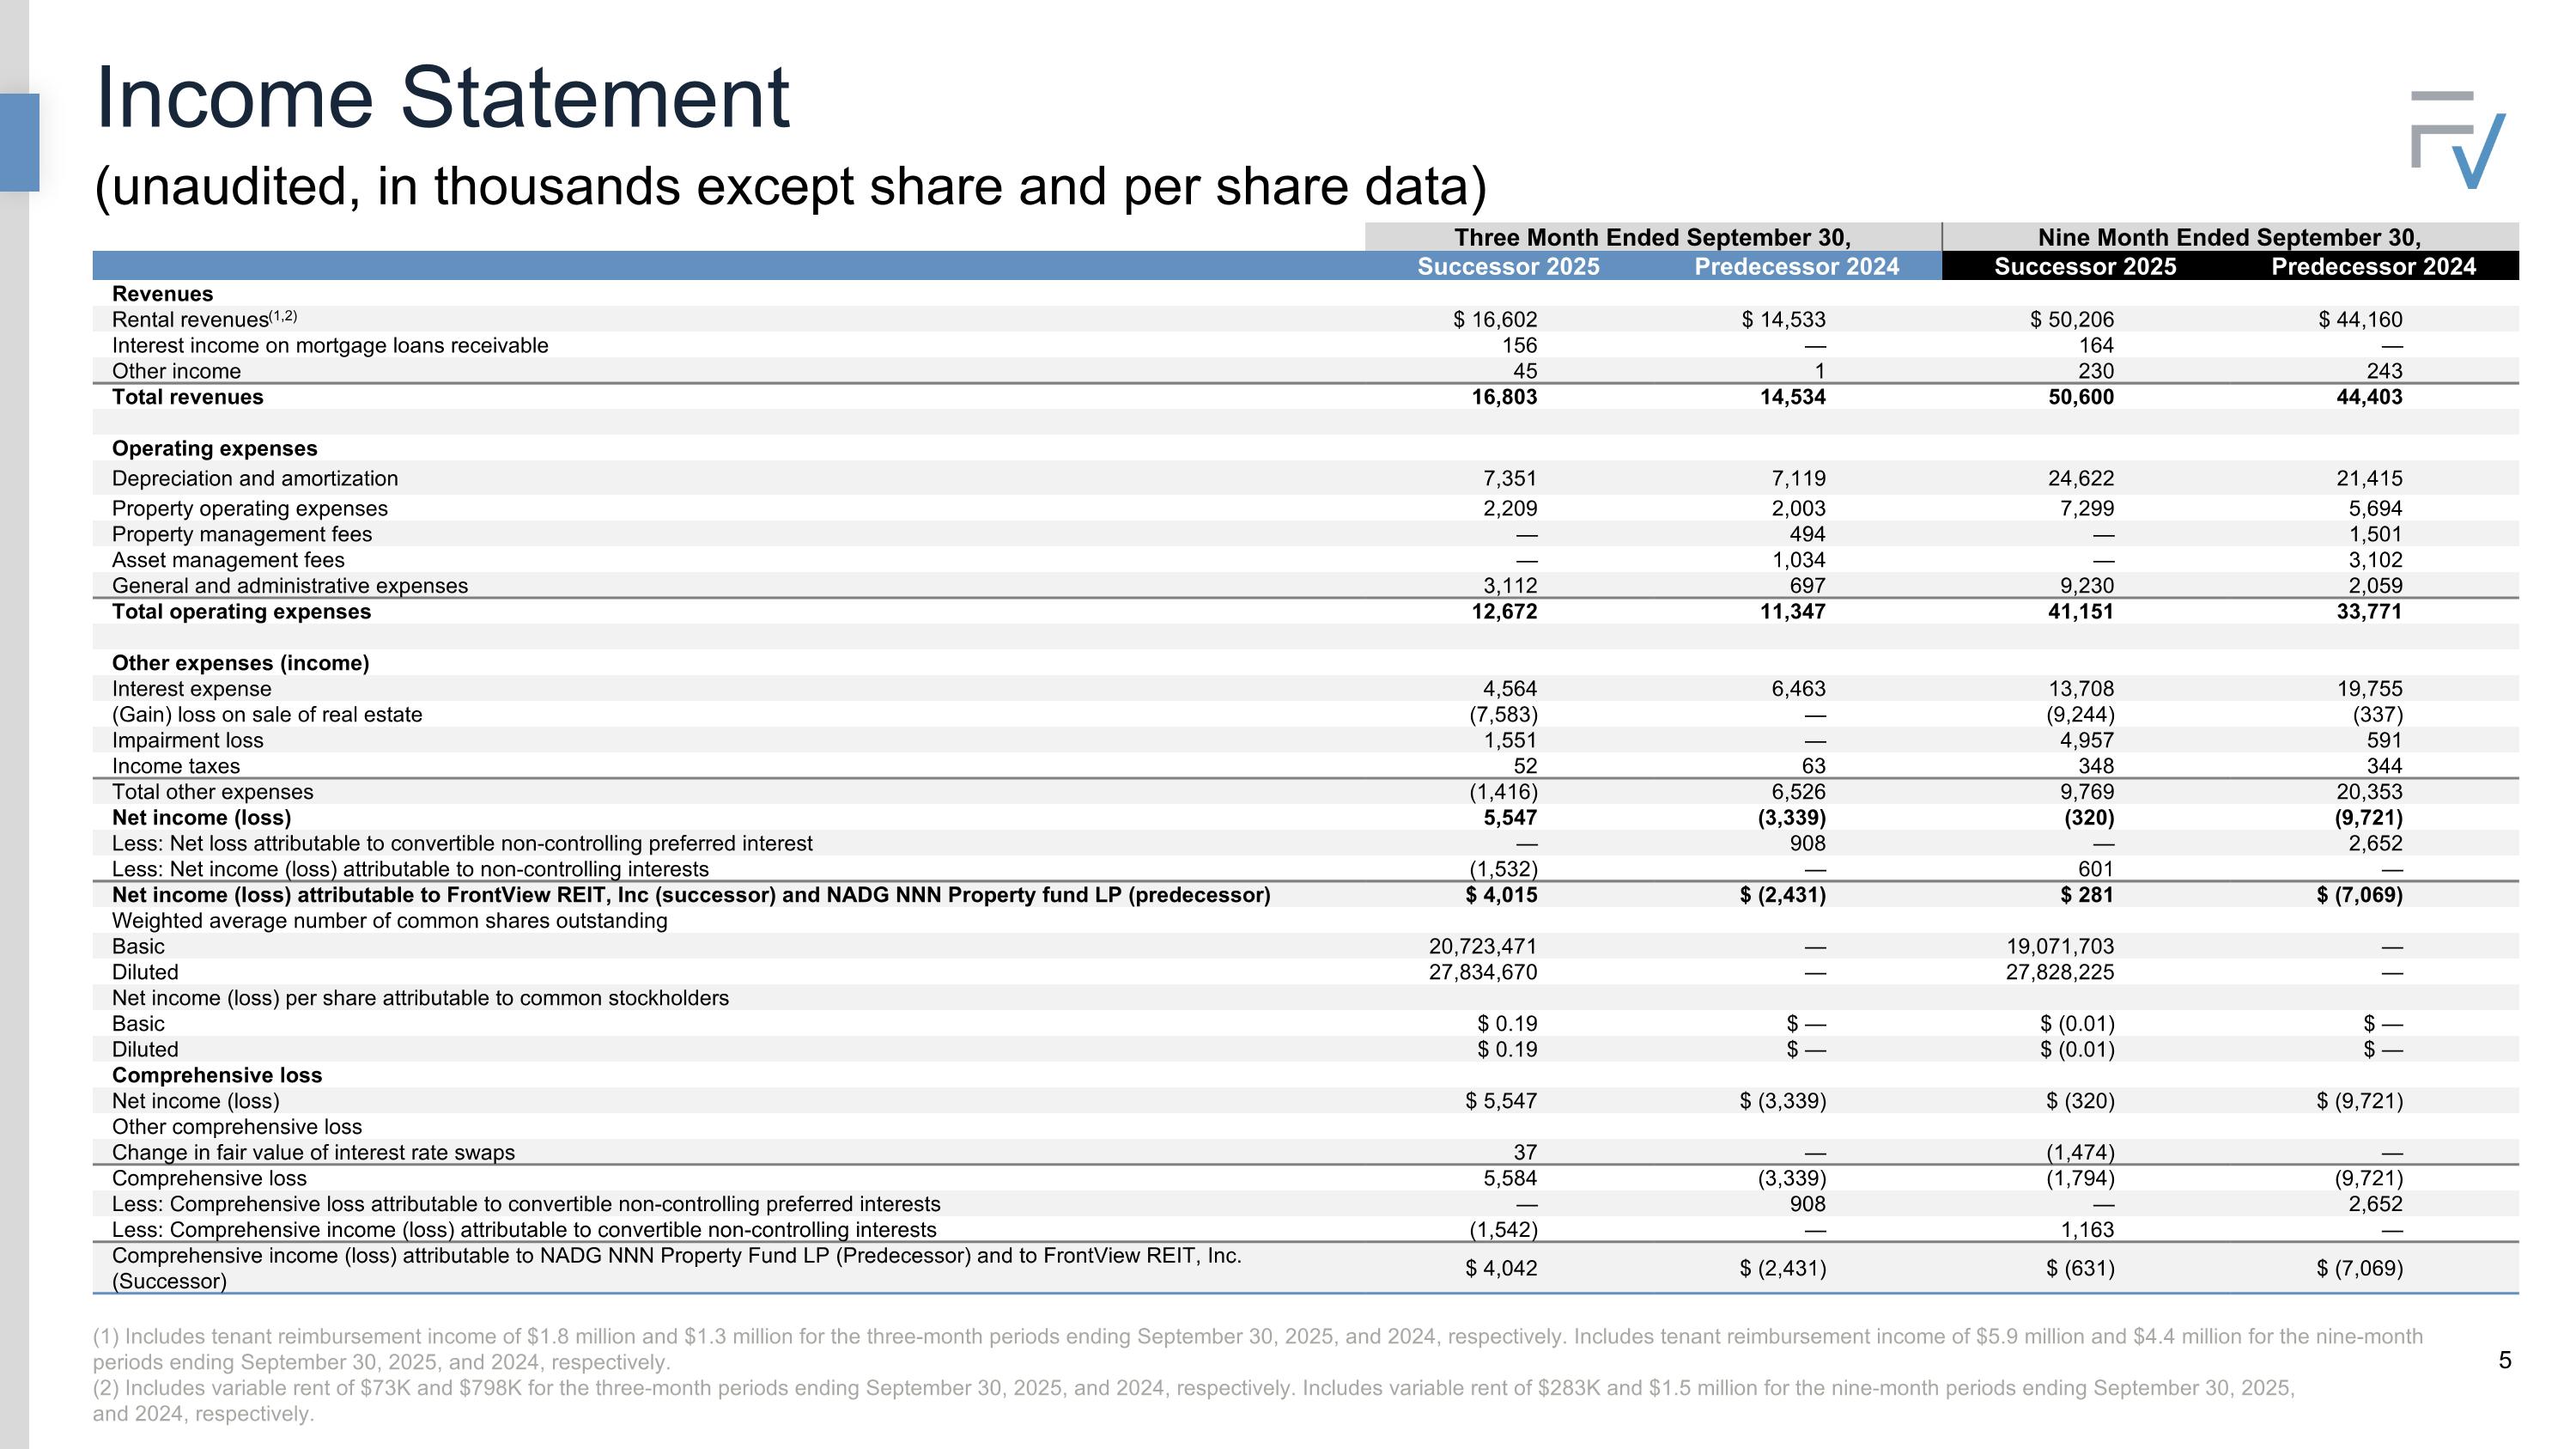
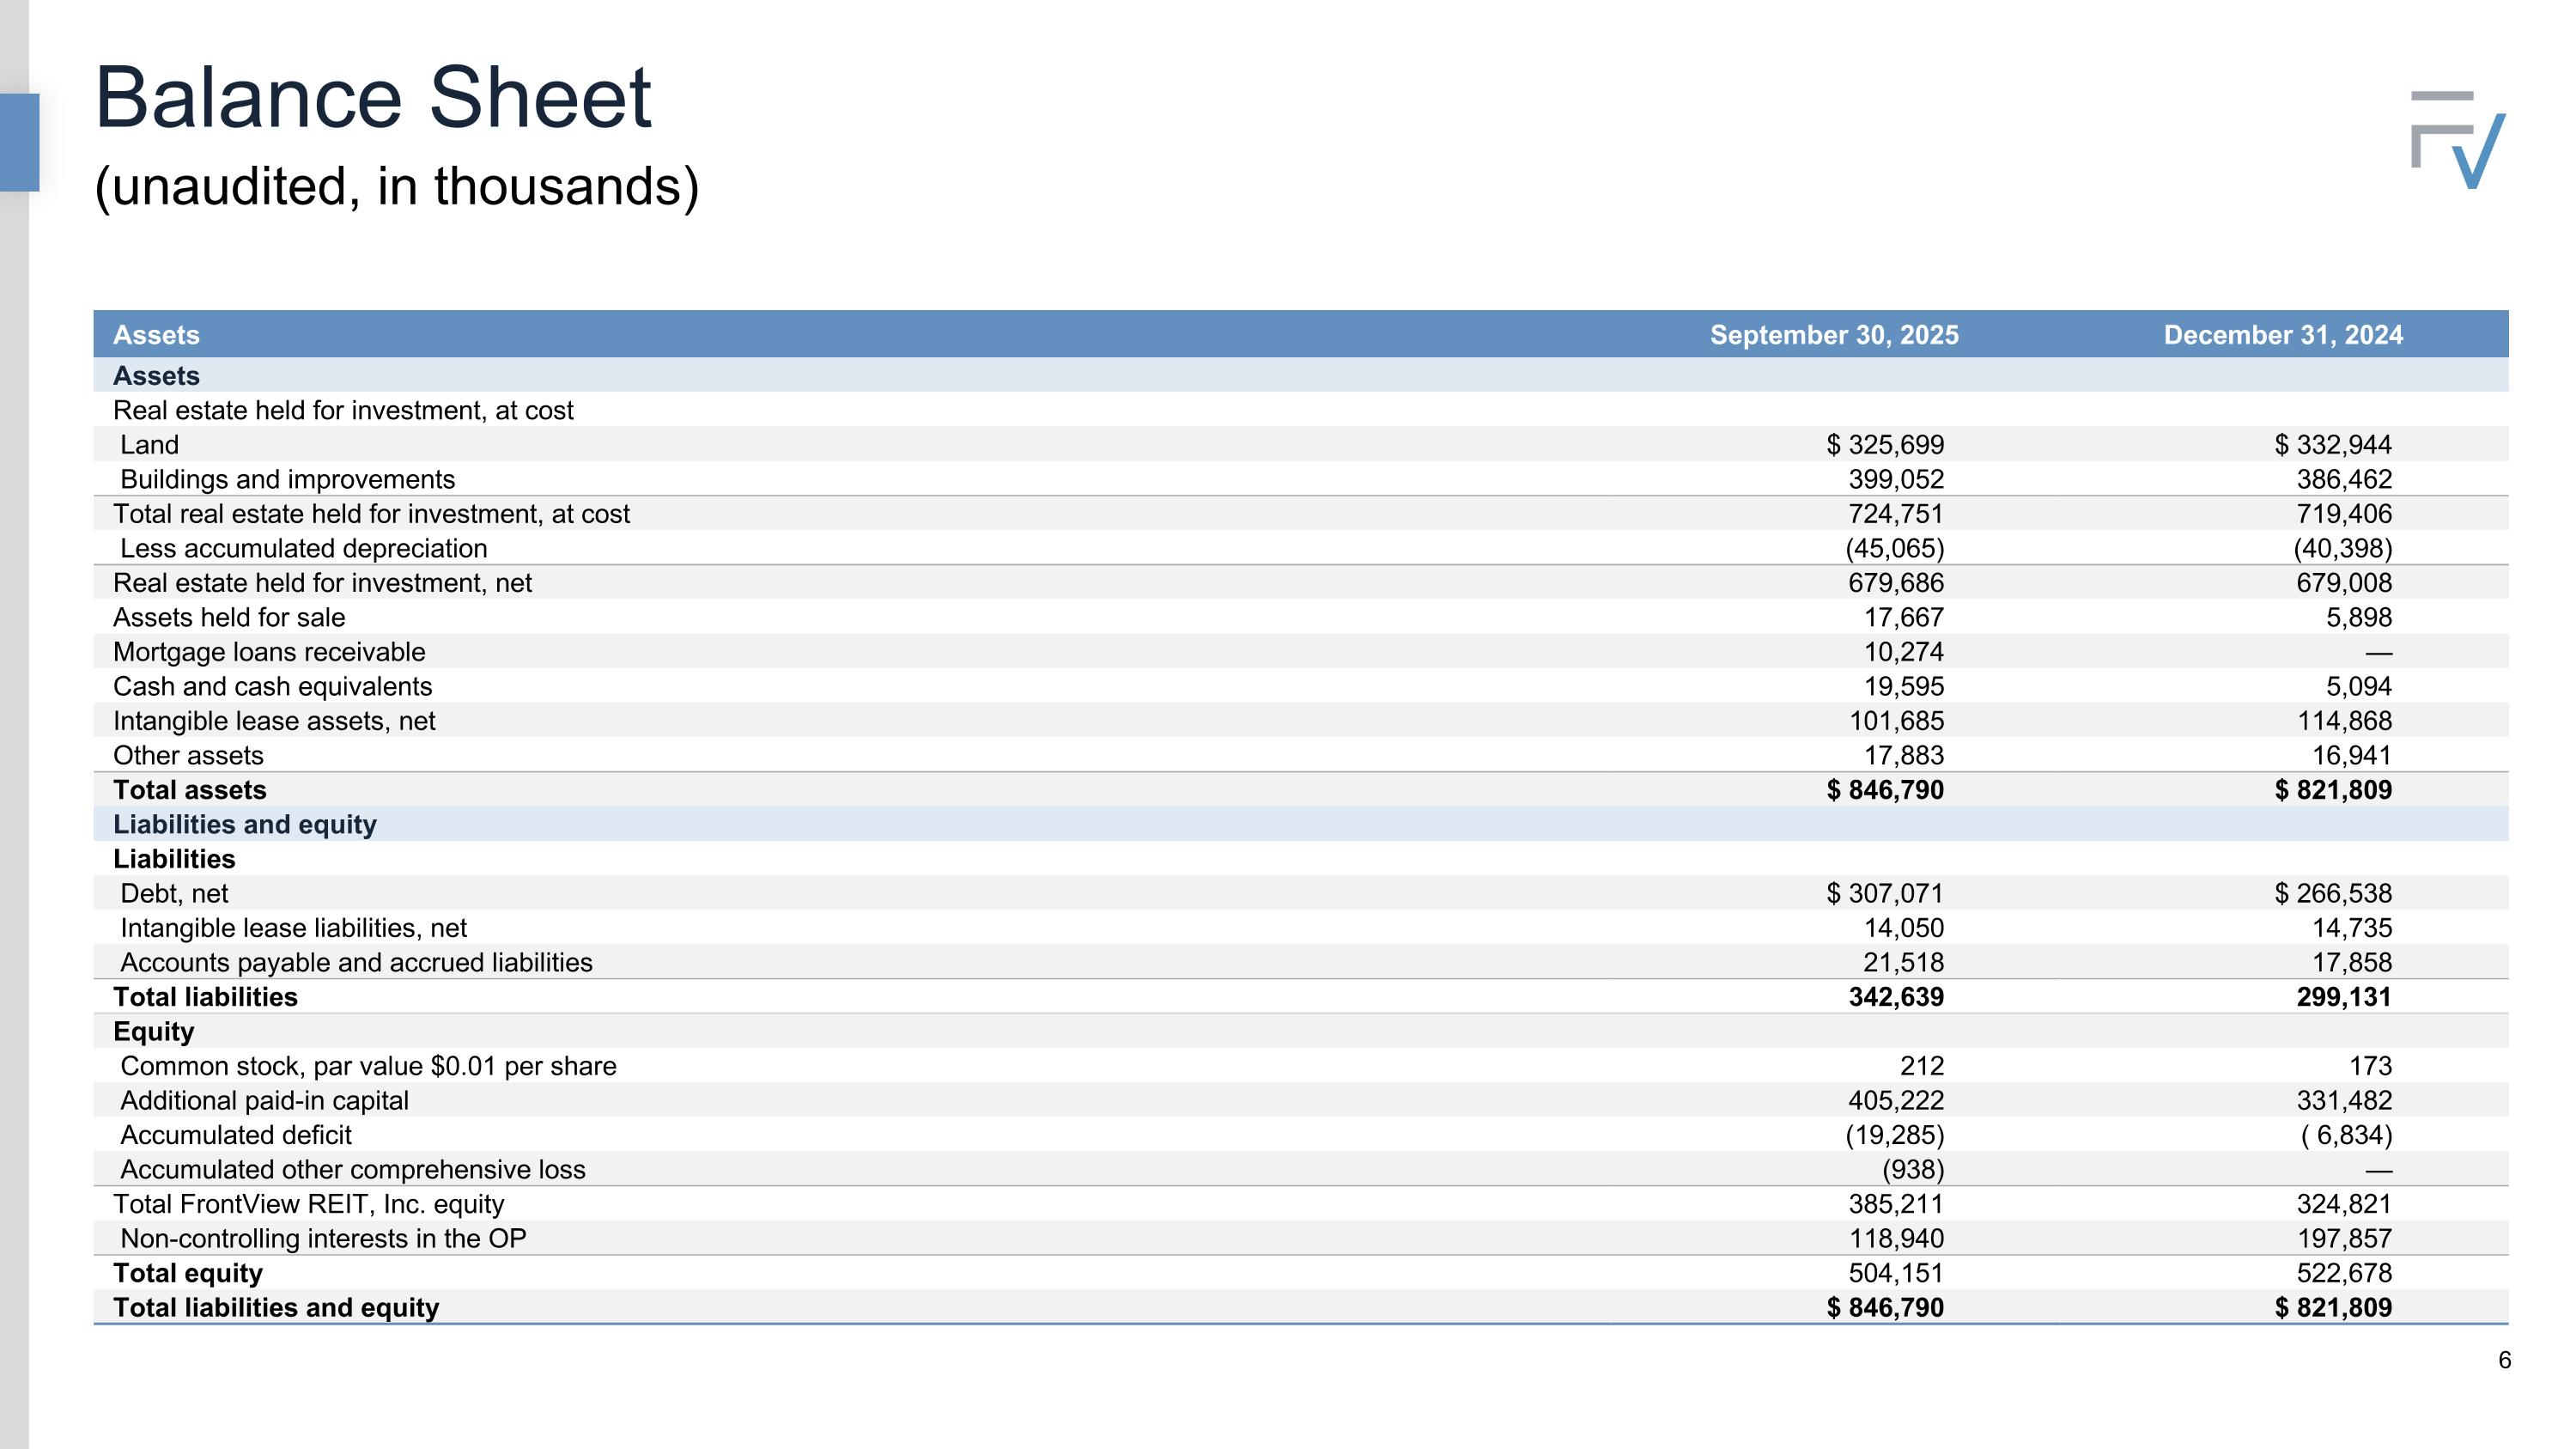
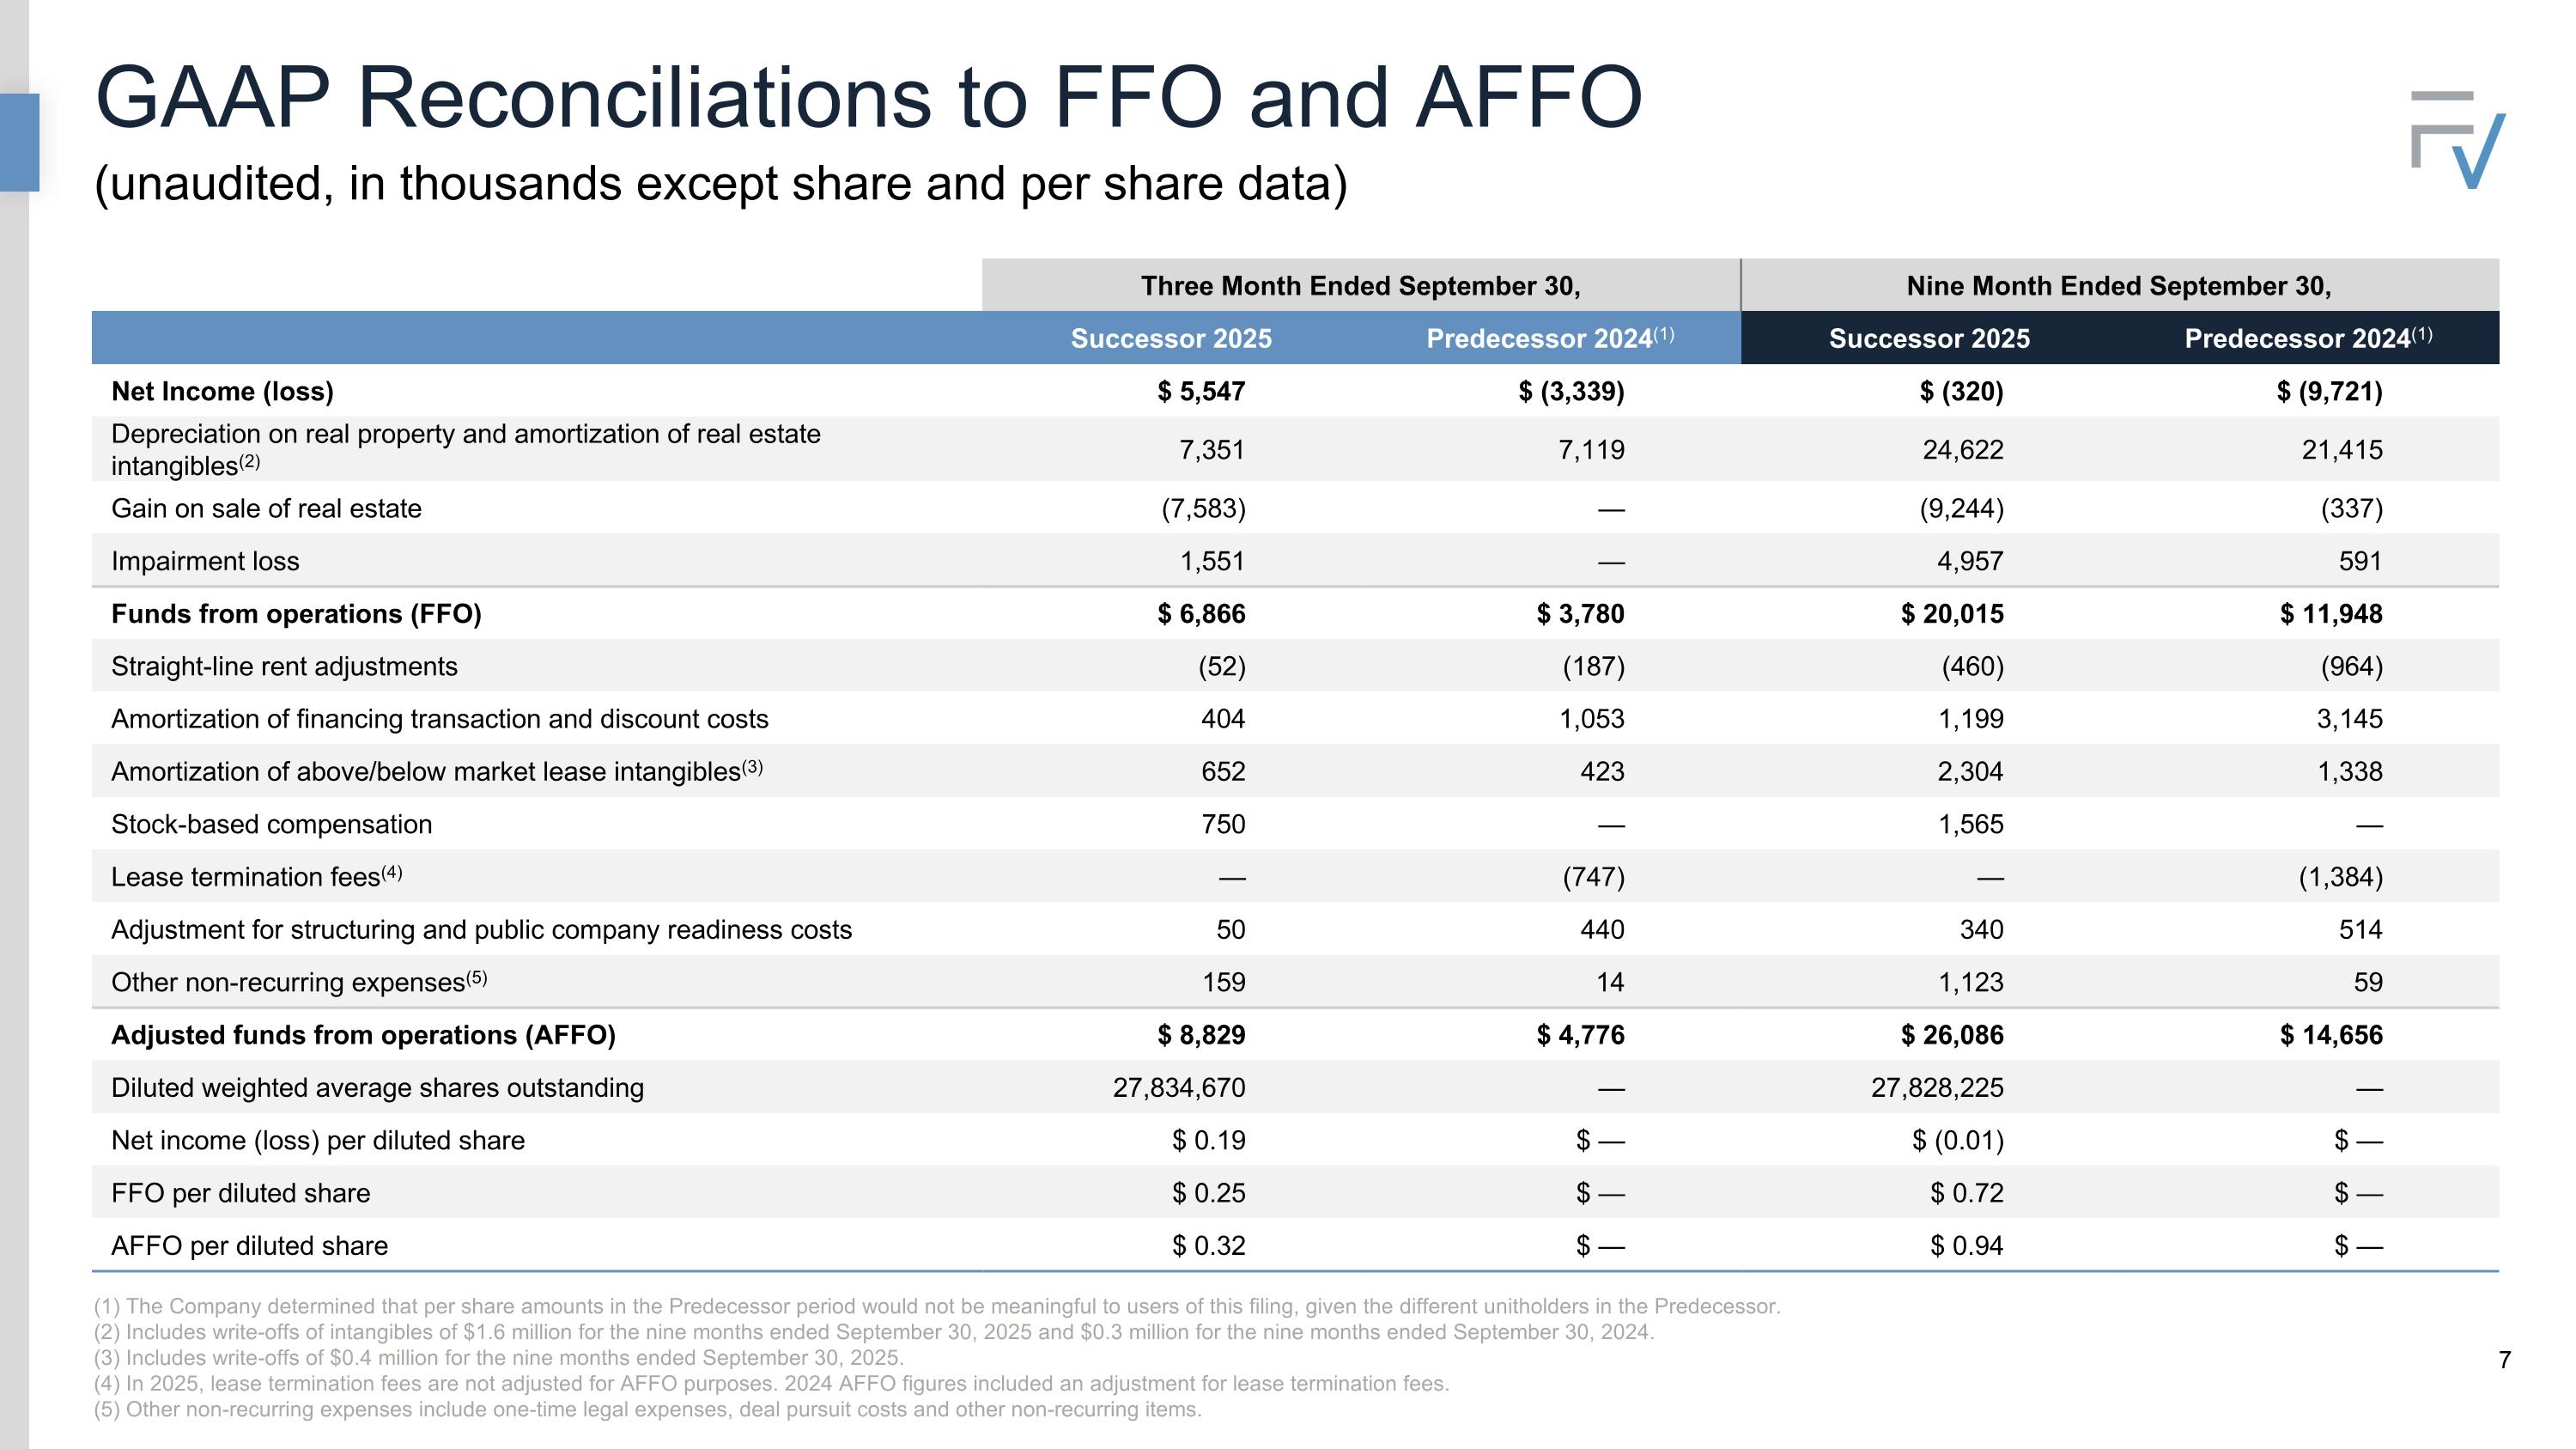
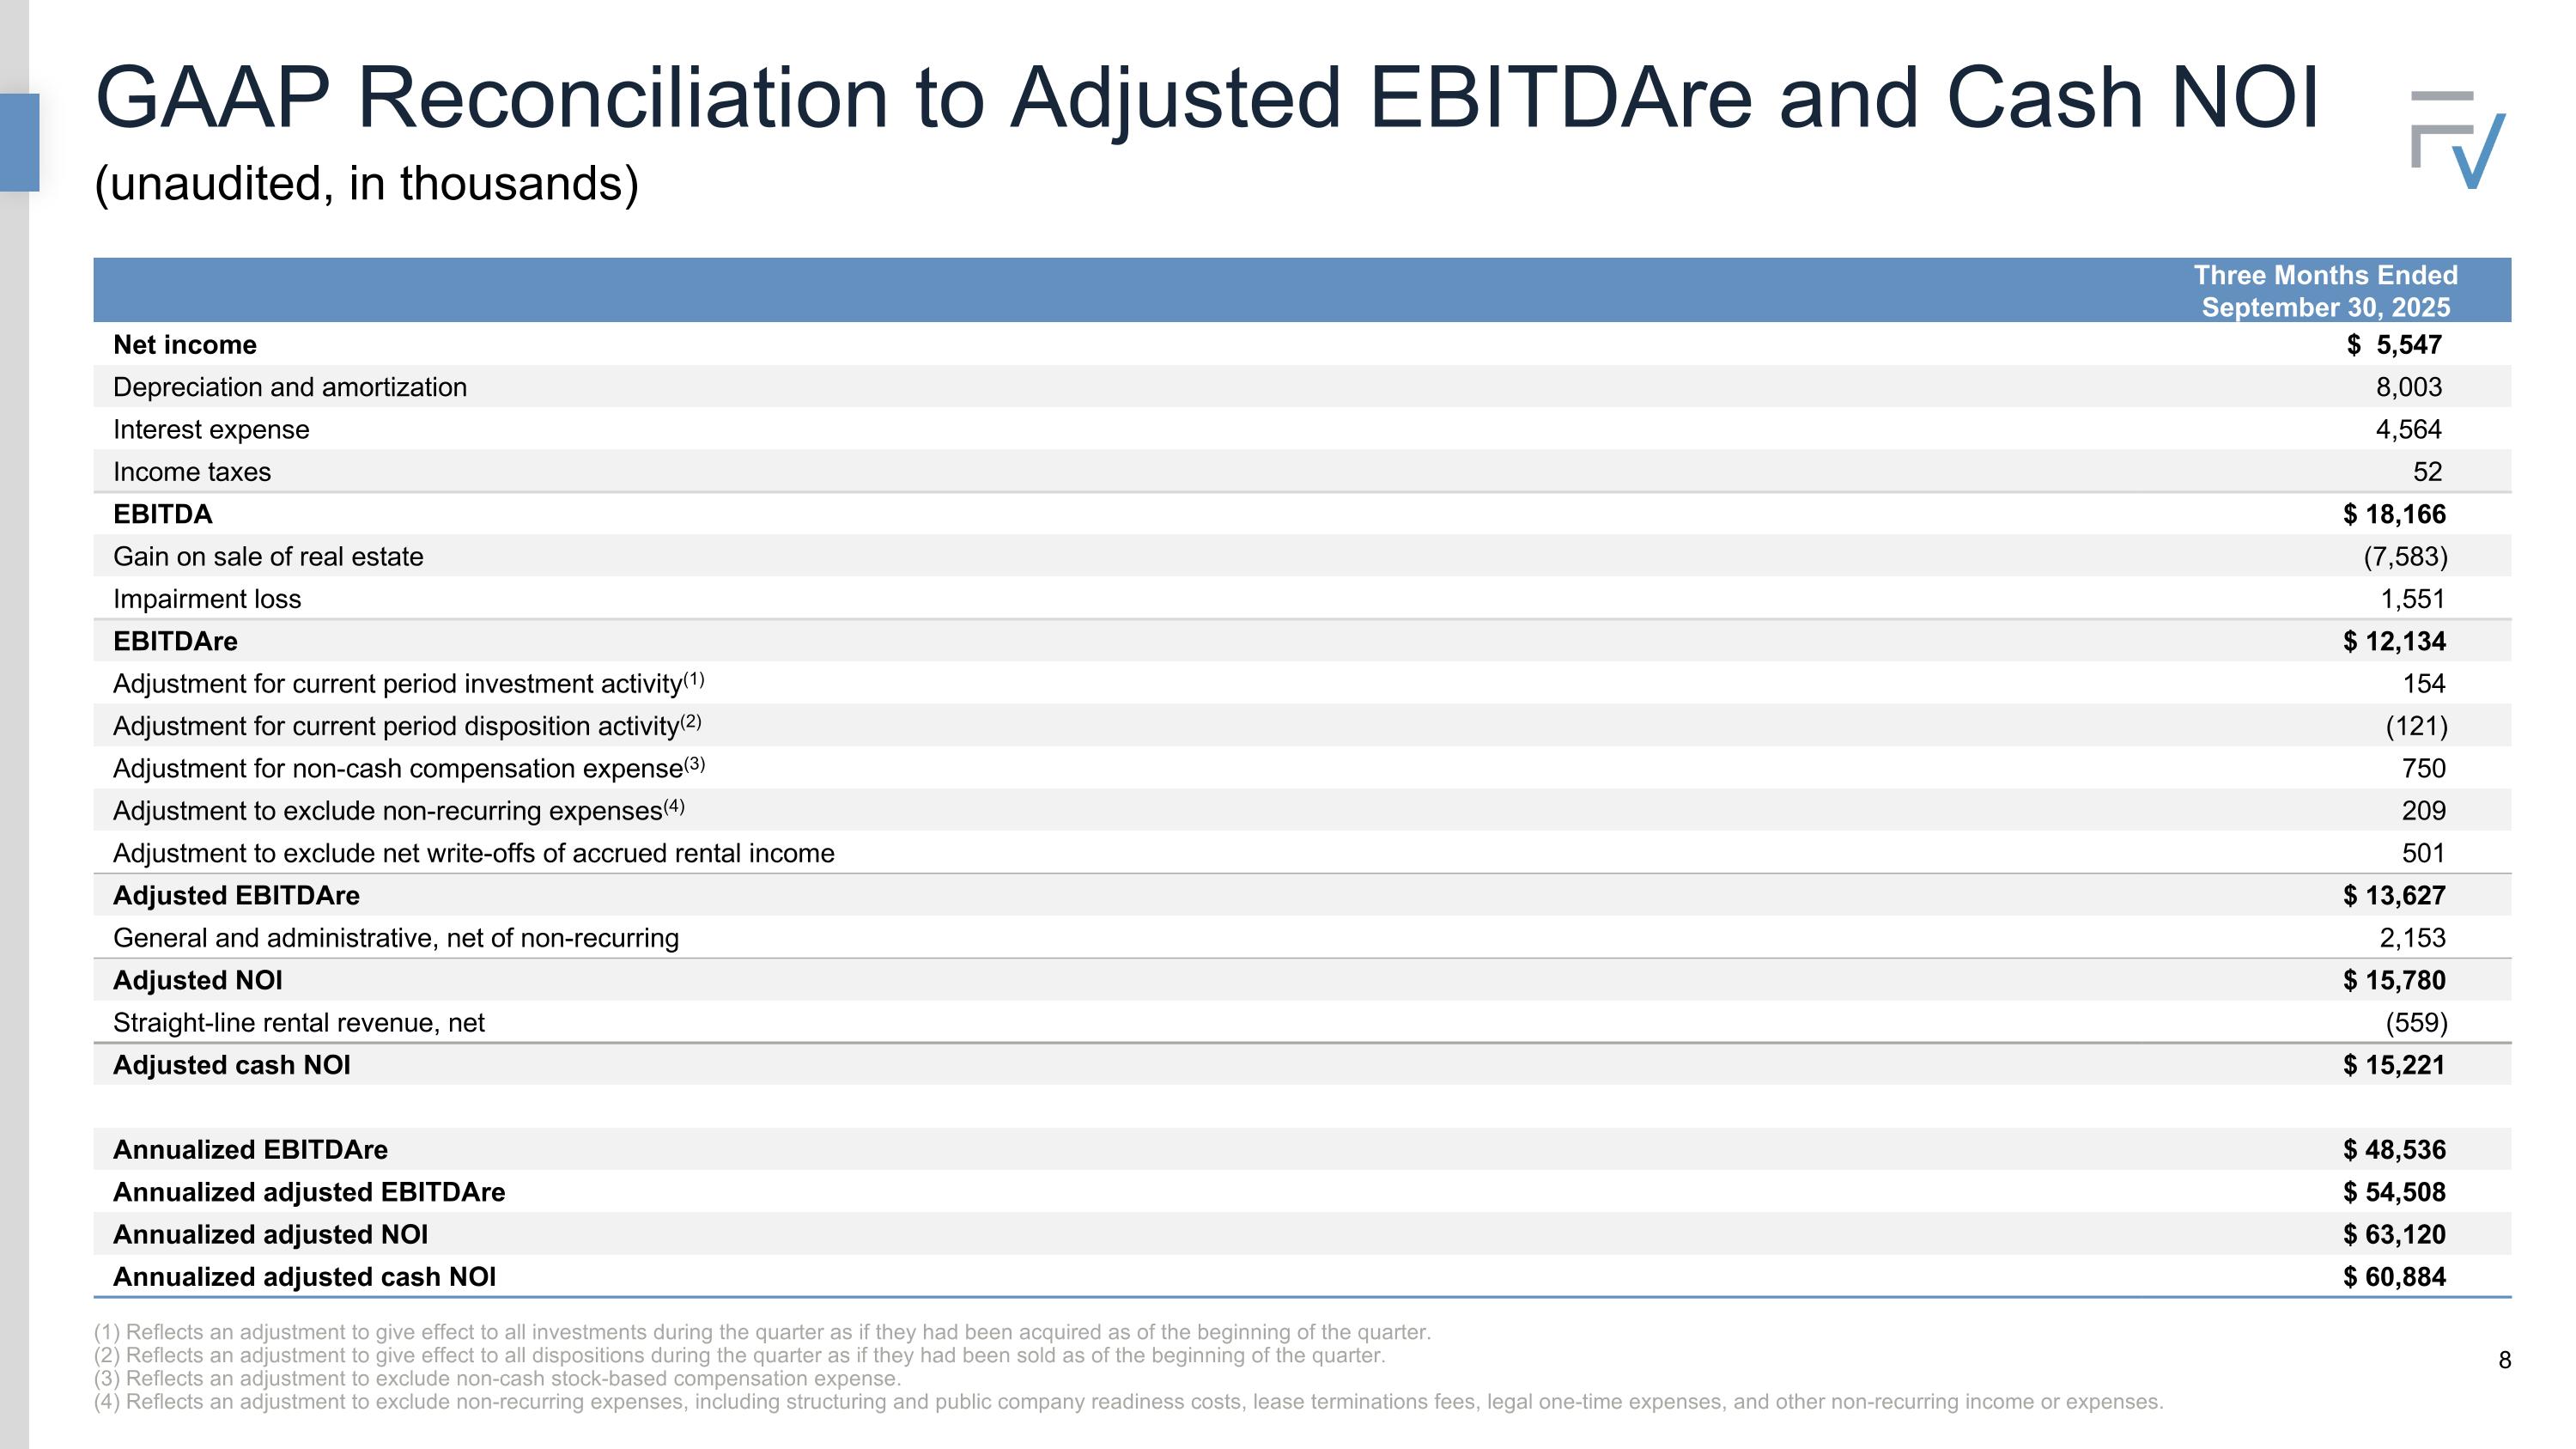
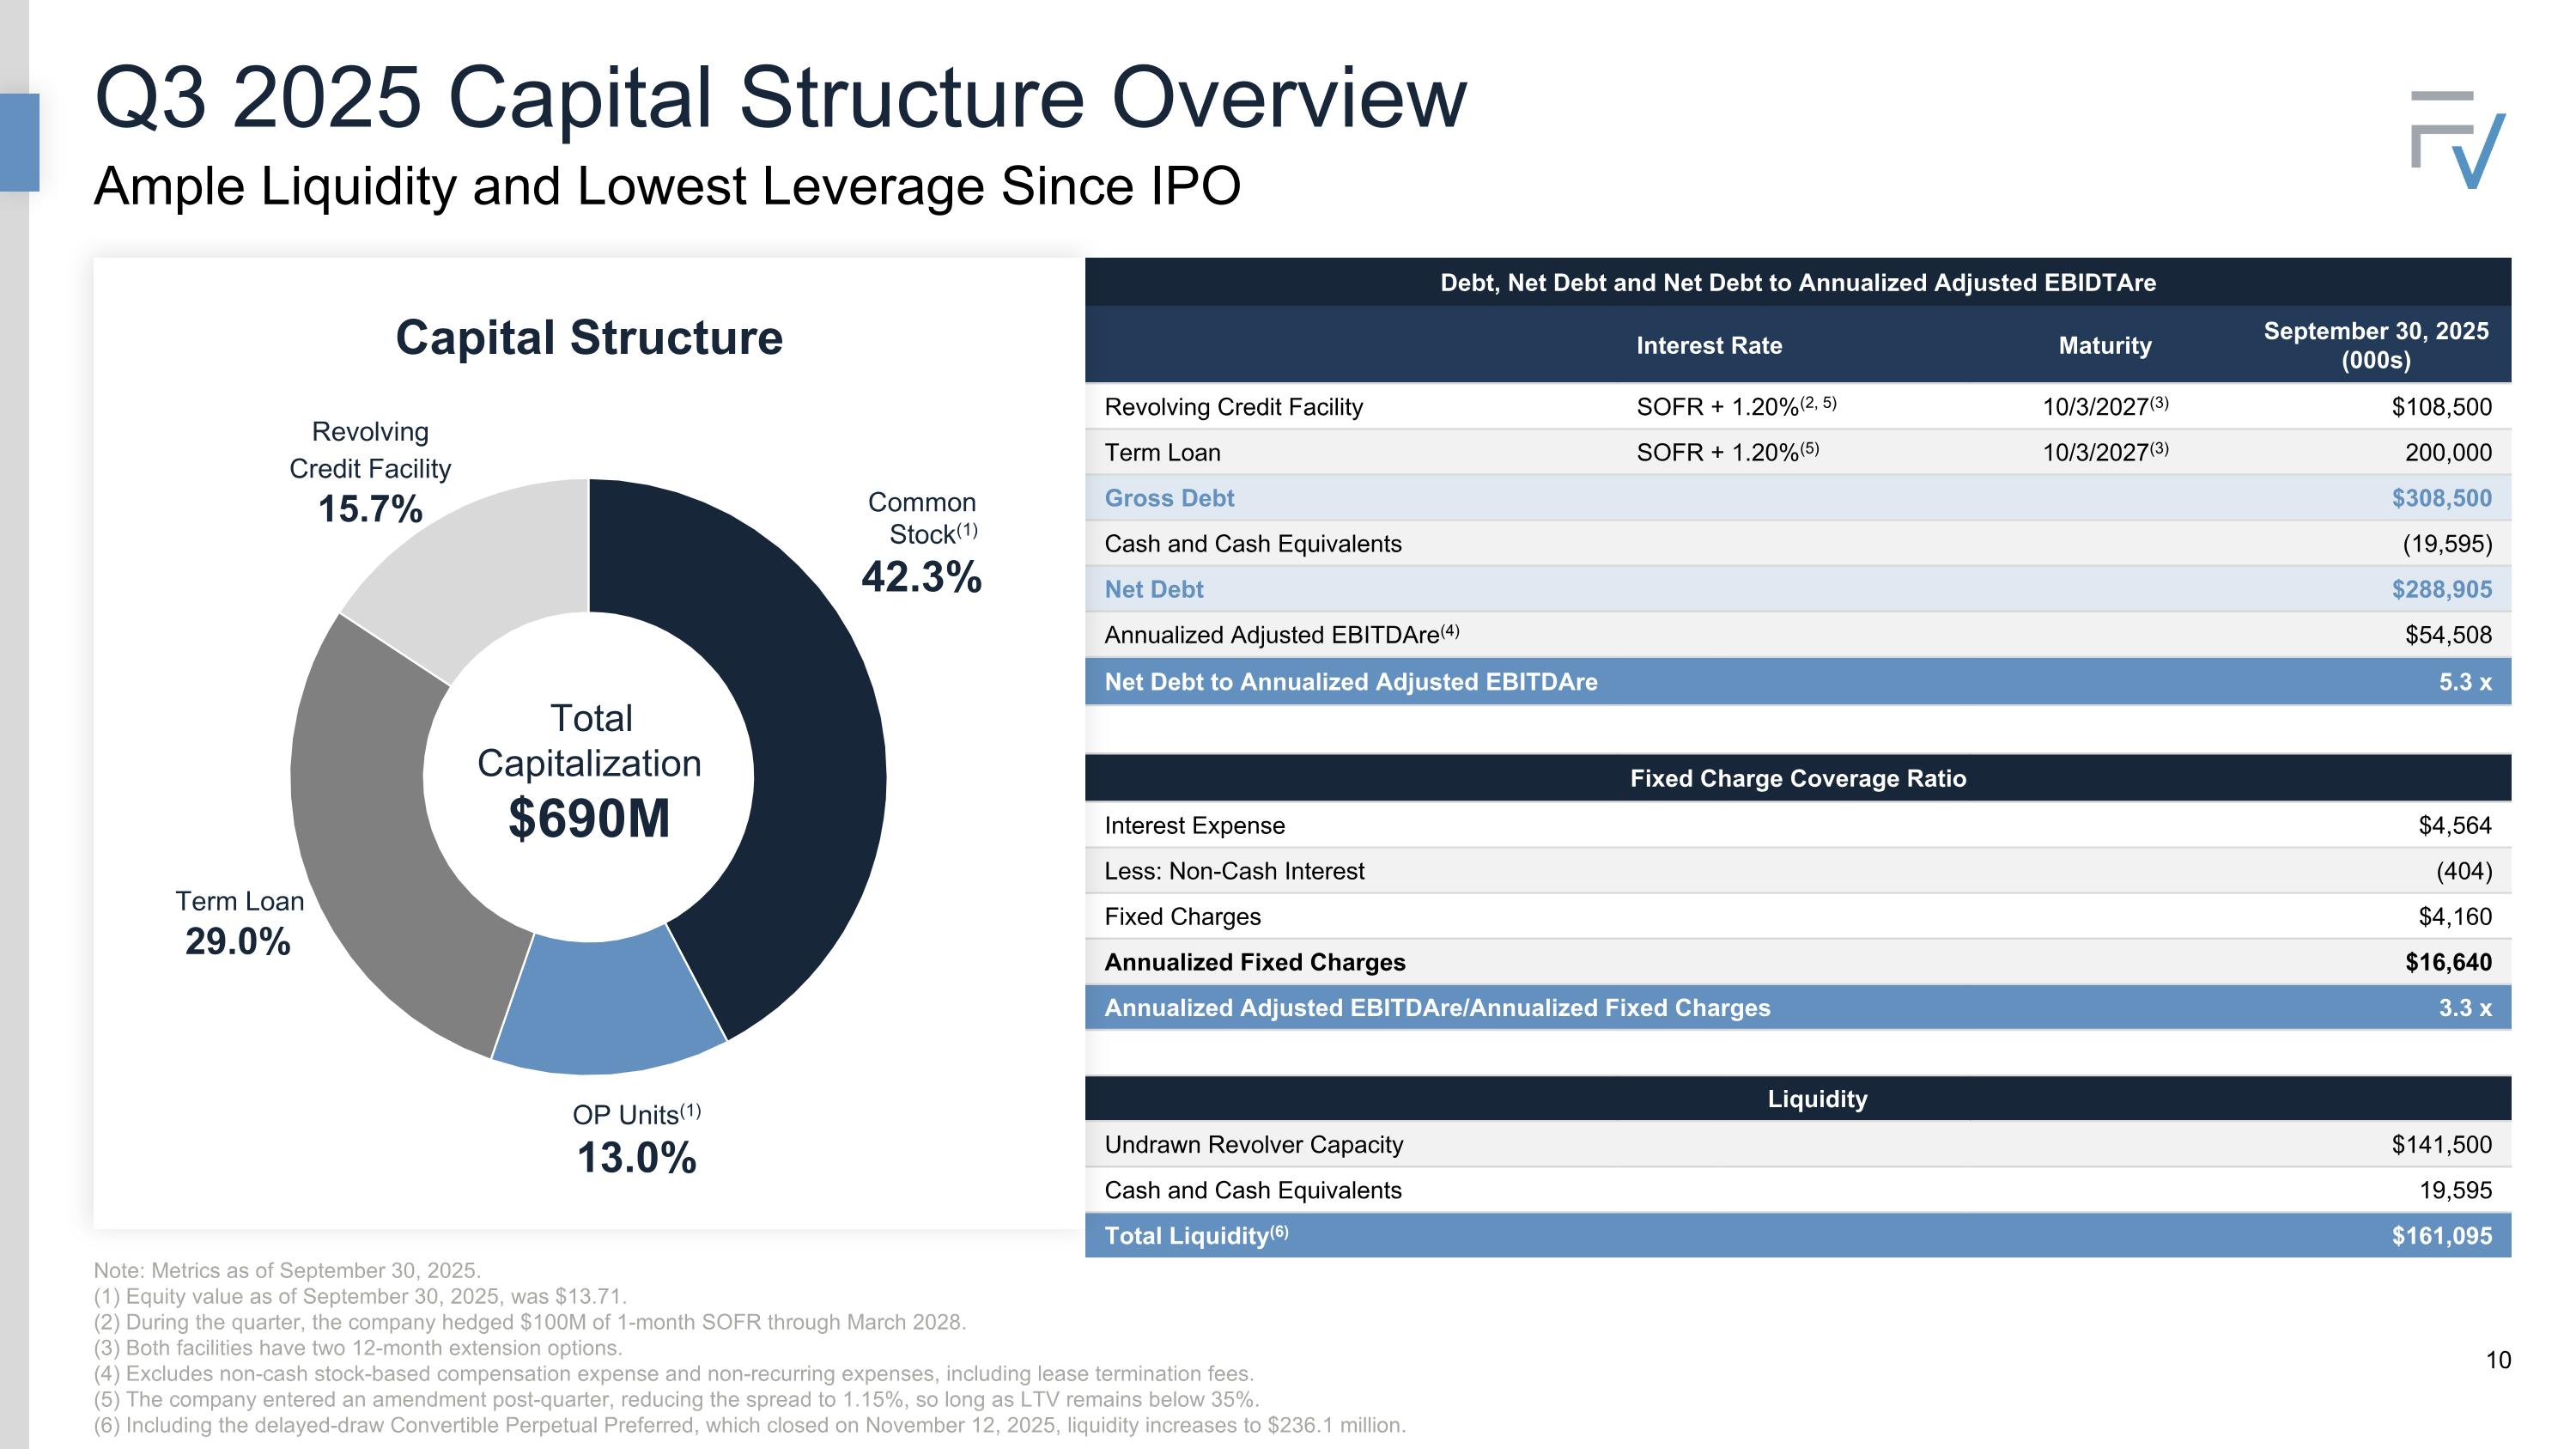
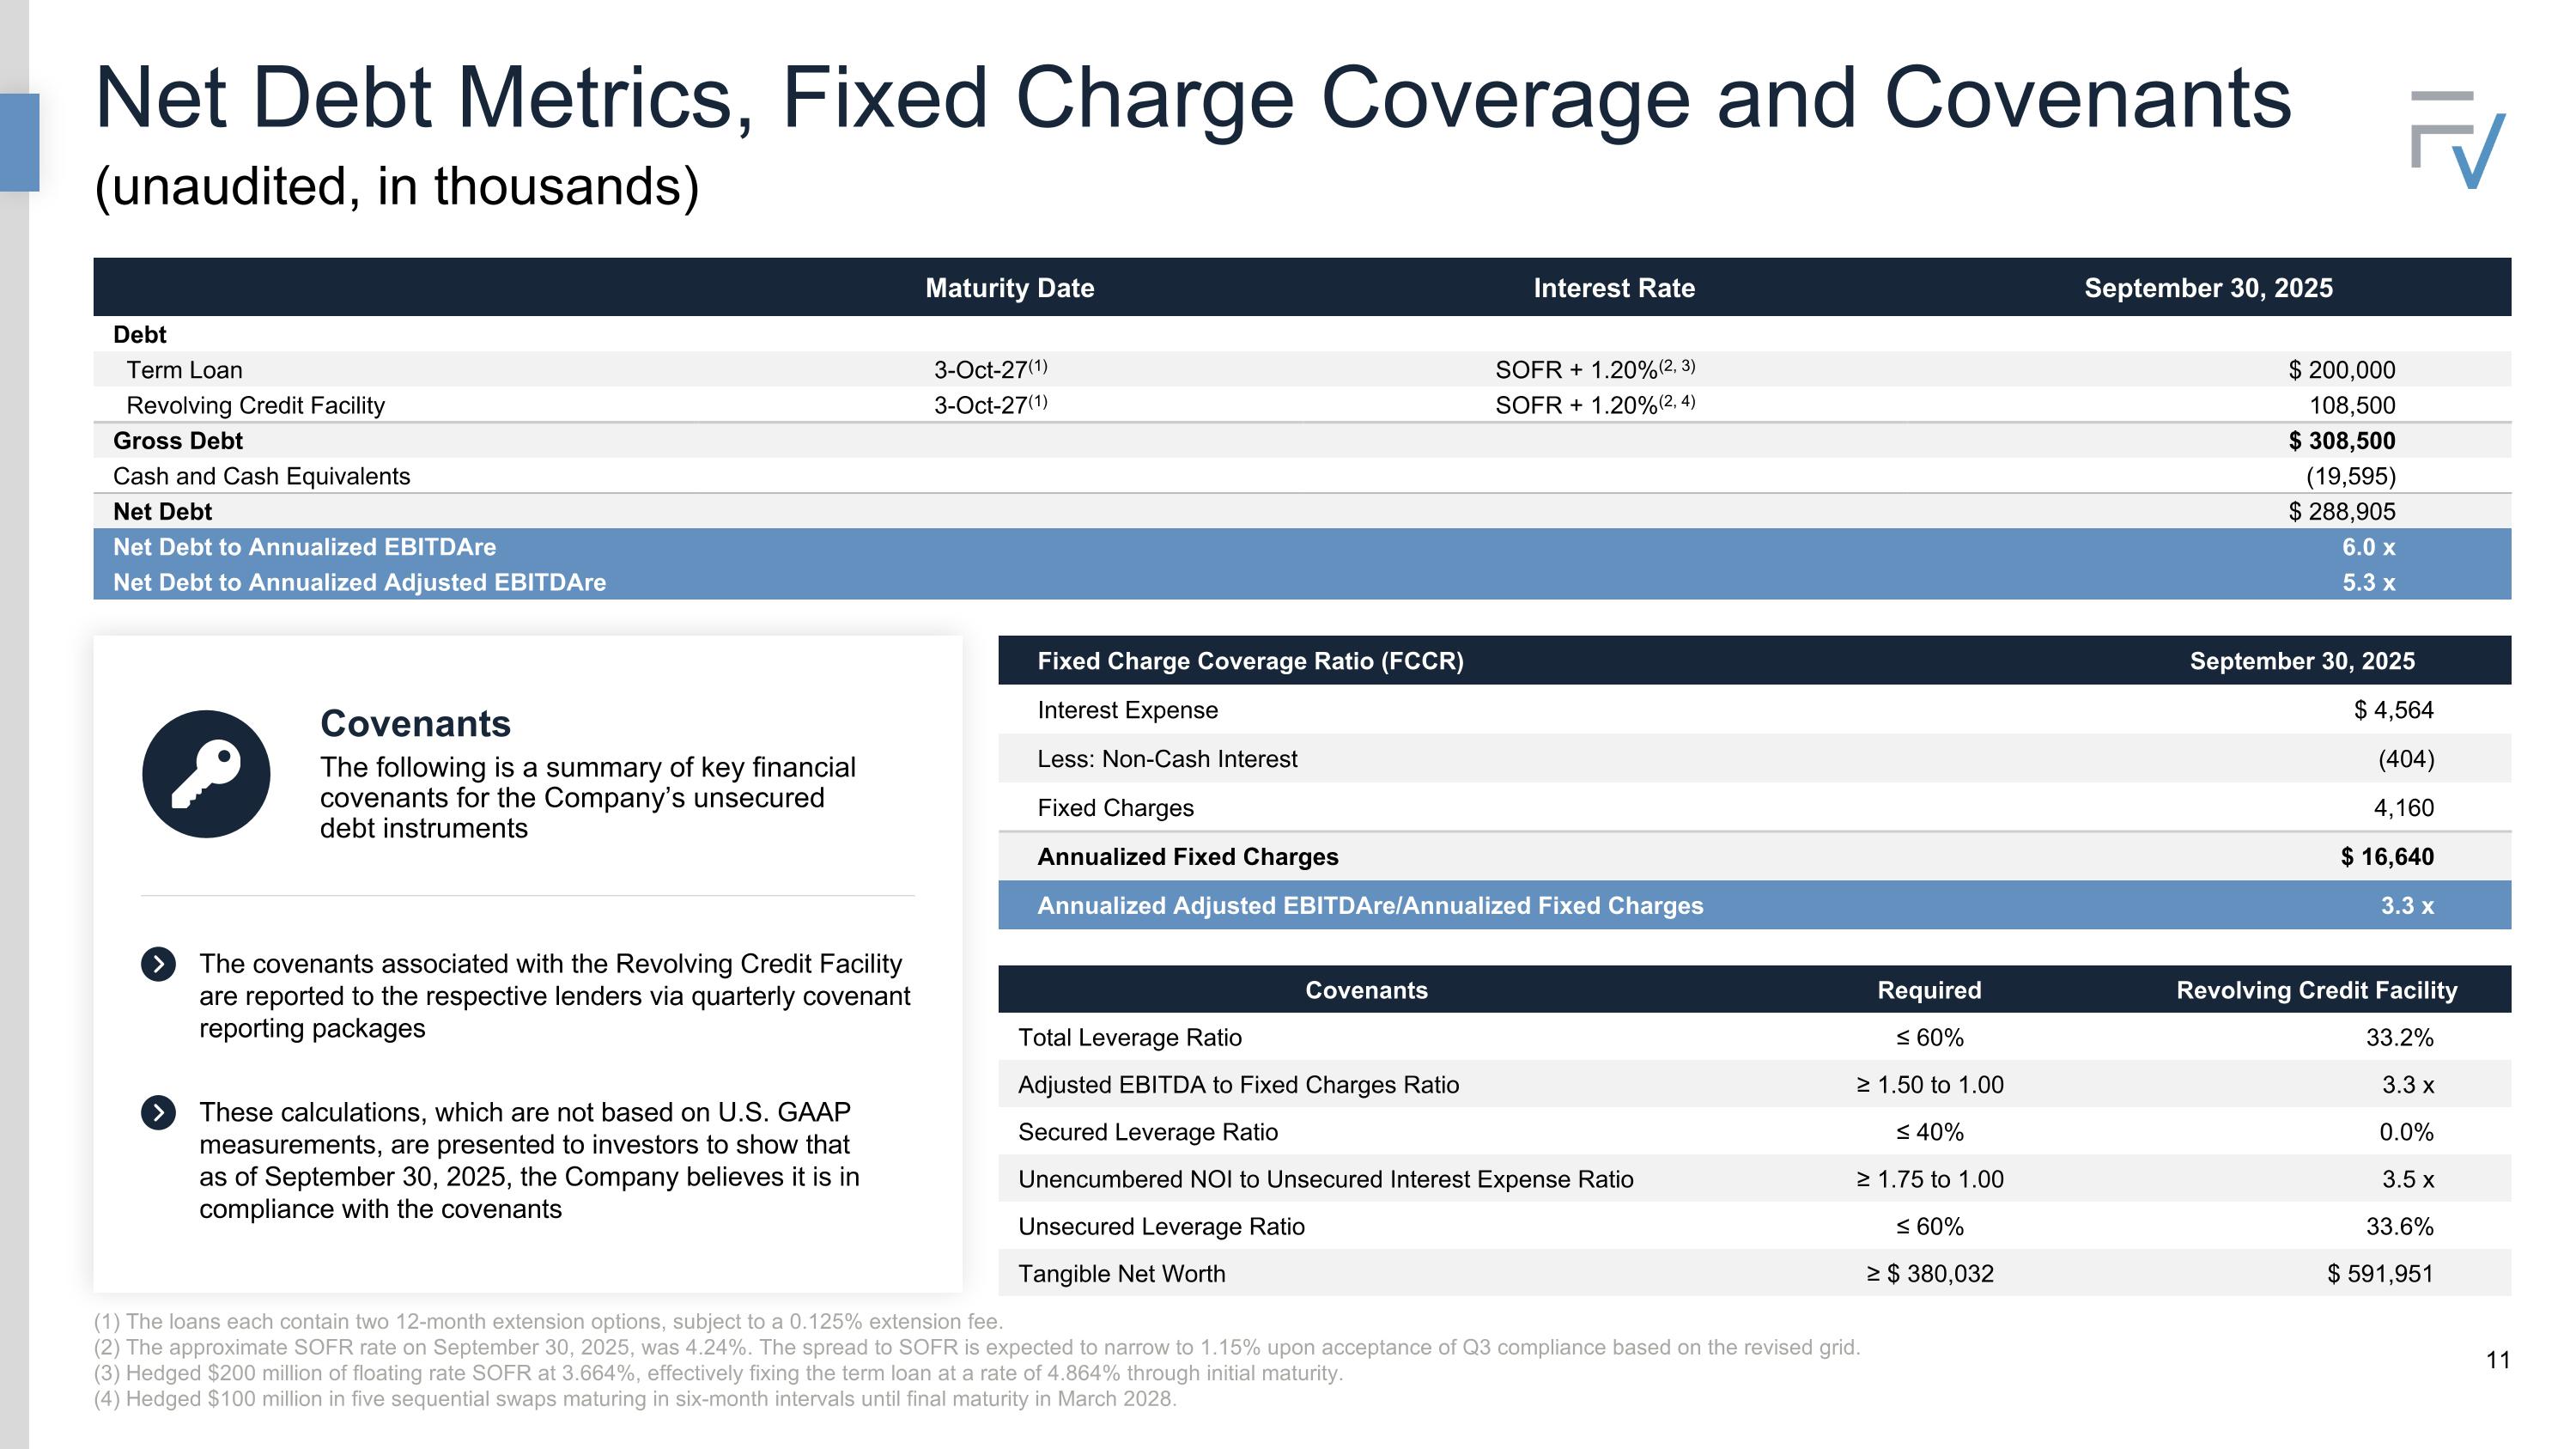
Thank you, Steve. As part of this quarter's release, we introduced several enhanced disclosures within our investor presentation designed to give investors deeper insight into the quality and productivity of our real estate. These include detailed disclosures of our assets across the top 100 MSAs, Placer.ai visitation rankings highlighting property productivity and historical recapture performance. We have also refreshed our company website to include a portfolio-level page to view 100% of the concepts by city and state, underscoring the visibility and quality of our footprint. Turning to the quarter. Annualized base rent was $61.3 million as of September 30, compared to $63.2 million at June 30. The decrease in ABR primarily reflects the company being a net seller of assets during the quarter with $32.9 million of dispositions and $15.7 million of acquisitions. Excluding the Tricolor property, which vacated post quarter, ABR would have been $60.7 million, which serves as a solid baseline for modeling the fourth quarter. Total cash rental income totaled $15.4 million, compared to $15.7 million last quarter, which included $73,000 of variable rent. Our non-reimbursed property cost or slippage was $405,000, slightly better than expectations of $500,000, helped by the dispositions in the quarter. On the expense side, cash G&A was $2.1 million and $6.3 million year-to-date, with no adjustment to our cash G&A guidance of approximately $8.9 million at the midpoint. Quarterly cash interest expense declined by $100,000 sequentially to $4.2 million, driven by a $21.2 million reduction in net debt to $288.9 million. In September and October, we also completed 2 amendments to our credit agreements with both the revolver and the term loan. These amendments removed the 10 basis point SOFR adjustment and improved our pricing grid for LTVs below 35%, producing an expected 15 basis point savings across all our debt upon submission of our Q3 covenant package this week. Additionally, in early September, we hedged an incremental $100 million of 1 month SOFR exposure through March of 2028, further reducing rate volatility. Turning to the balance sheet. Net debt to adjusted EBITDAre reduced by 0.2x to 5.3x. That's the lowest leverage since the IPO, LTV of 33% based on our bank covenants. Our fixed charge coverage ratio remained at 3.3x with 100% of our assets unencumbered. We ended the quarter with $161.1 million of liquidity, including $141.5 million of undrawn revolver capacity and $19.6 million of cash and equivalents. Including the recently closed delayed-draw convertible preferred equity, our total liquidity increases to $236.1 million. As a brief housekeeping note, having passed the 1-year mark since our IPO, FrontView is now shelf eligible. We will be filing the S-3 registration statement shortly, and once accepted, we'll request authorization for a $75 million ATM program. Additionally, we have received Board authorization to repurchase up to $75 million in shares, providing us with flexible tools for future capital markets activity. As Steve mentioned, our announced $75 million convertible preferred equity investment provides long-term growth capital with near-term accretion. This security carries a 6.75% dividend rate and a $17 conversion price, no make-whole penalties, and no restricted governance features. This structure allows us to draw capital in tranches as acquisitions close, making each draw cash flow accretive. On a converted basis, the effective cost of equity net of fees is approximately 7.5%. And with modest leverage, our weighted average cost of capital is in the mid to high 6% range. We anticipate using the equity capital to acquire $100 million of assets net of dispositions. Currently, we are making conservative assumptions on the cash cap rates of acquisitions, 7.25%, versus our existing pipeline, which ranges from 7.25% to 7.75%. Once the capital is deployed, it will drive 3% annualized AFFO per share accretion, utilizing modest leverage of 25%. This accretive equity positions us to capitalize on a compelling acquisition environment and to deliver sustained AFFO per share growth supported by our nimble scale, access to granular frontage assets, and disciplined capital deployment in a fragmented market. Turning to 2025 guidance. For the full year, we expect acquisitions to range between $115 million to $125 million, and dispositions to range between $70 million to $80 million. For the fourth quarter, at the midpoint, this implies $37 million of acquisitions and $17 million dispositions. Our AFFO per share guidance range increased by $0.01 to $1.23 to $1.25. We expect approximately $0.30 in AFFO per share in the fourth quarter. That's primarily a function of timing as the dispositions were more heavily weighted towards September where the acquisitions are anticipated to close toward the end of the year. Looking ahead, when we exit December, our run rate AFFO per share will be slightly above $0.31, including the full impact of acquisitions and dispositions for the third and fourth quarter. And this includes no NOI for a Tricolor asset that Steve discussed earlier. Turning to 2026. With the preferred equity capital secured, we expect approximately $100 million in net acquisitions, driving an AFFO per share range of $1.26 to $1.30. This represents 3.2% year-over-year growth at the midpoint compared to $1.24. We believe this acquisition pace is highly achievable and, once fully deployed, will expand our asset base by more than 10%. Our results reflect the power of disciplined execution. Over the past quarter, we've enhanced transparency across our disclosures, strengthened our balance sheet, and secured long-term, accretive equity capital, all to support sustained earnings and portfolio growth. With a high-quality real estate portfolio and a flexible capital structure, FrontView is positioned to compound AFFO per share growth faster than peers. Our smaller scale is a structural advantage as it allows us to move with precision and capitalize on opportunities in frontage retail real estate where we continue to see strong fundamentals and high demand. With that, I'll turn the call back over to the operator to open it up for Q&A.
Operator
Thank you, Mr. Revol. Your first question comes from Anthony Paolone with JPMorgan.
Speaker 3
First question relates to 2026. Can you provide more insight on Tricolor and whether it might be backfilled? Additionally, with 20 lease expirations next year, what is your outlook on the organic core portfolio included in the guidance?
Thank you for the question, Tony. It's good to hear from you. Regarding the guidance, it's straightforward. As we finished this year at approximately $0.31, which annualizes to $1.24, this figure does not account for any income from Tricolor. We hope to provide an improved update depending on the outcome of the resolution. We expect zero equity and are fully funded with the new capital deployment, which is the main factor driving our position. In terms of expirations, we are ahead of schedule, and I can let Steve discuss our expirations further.
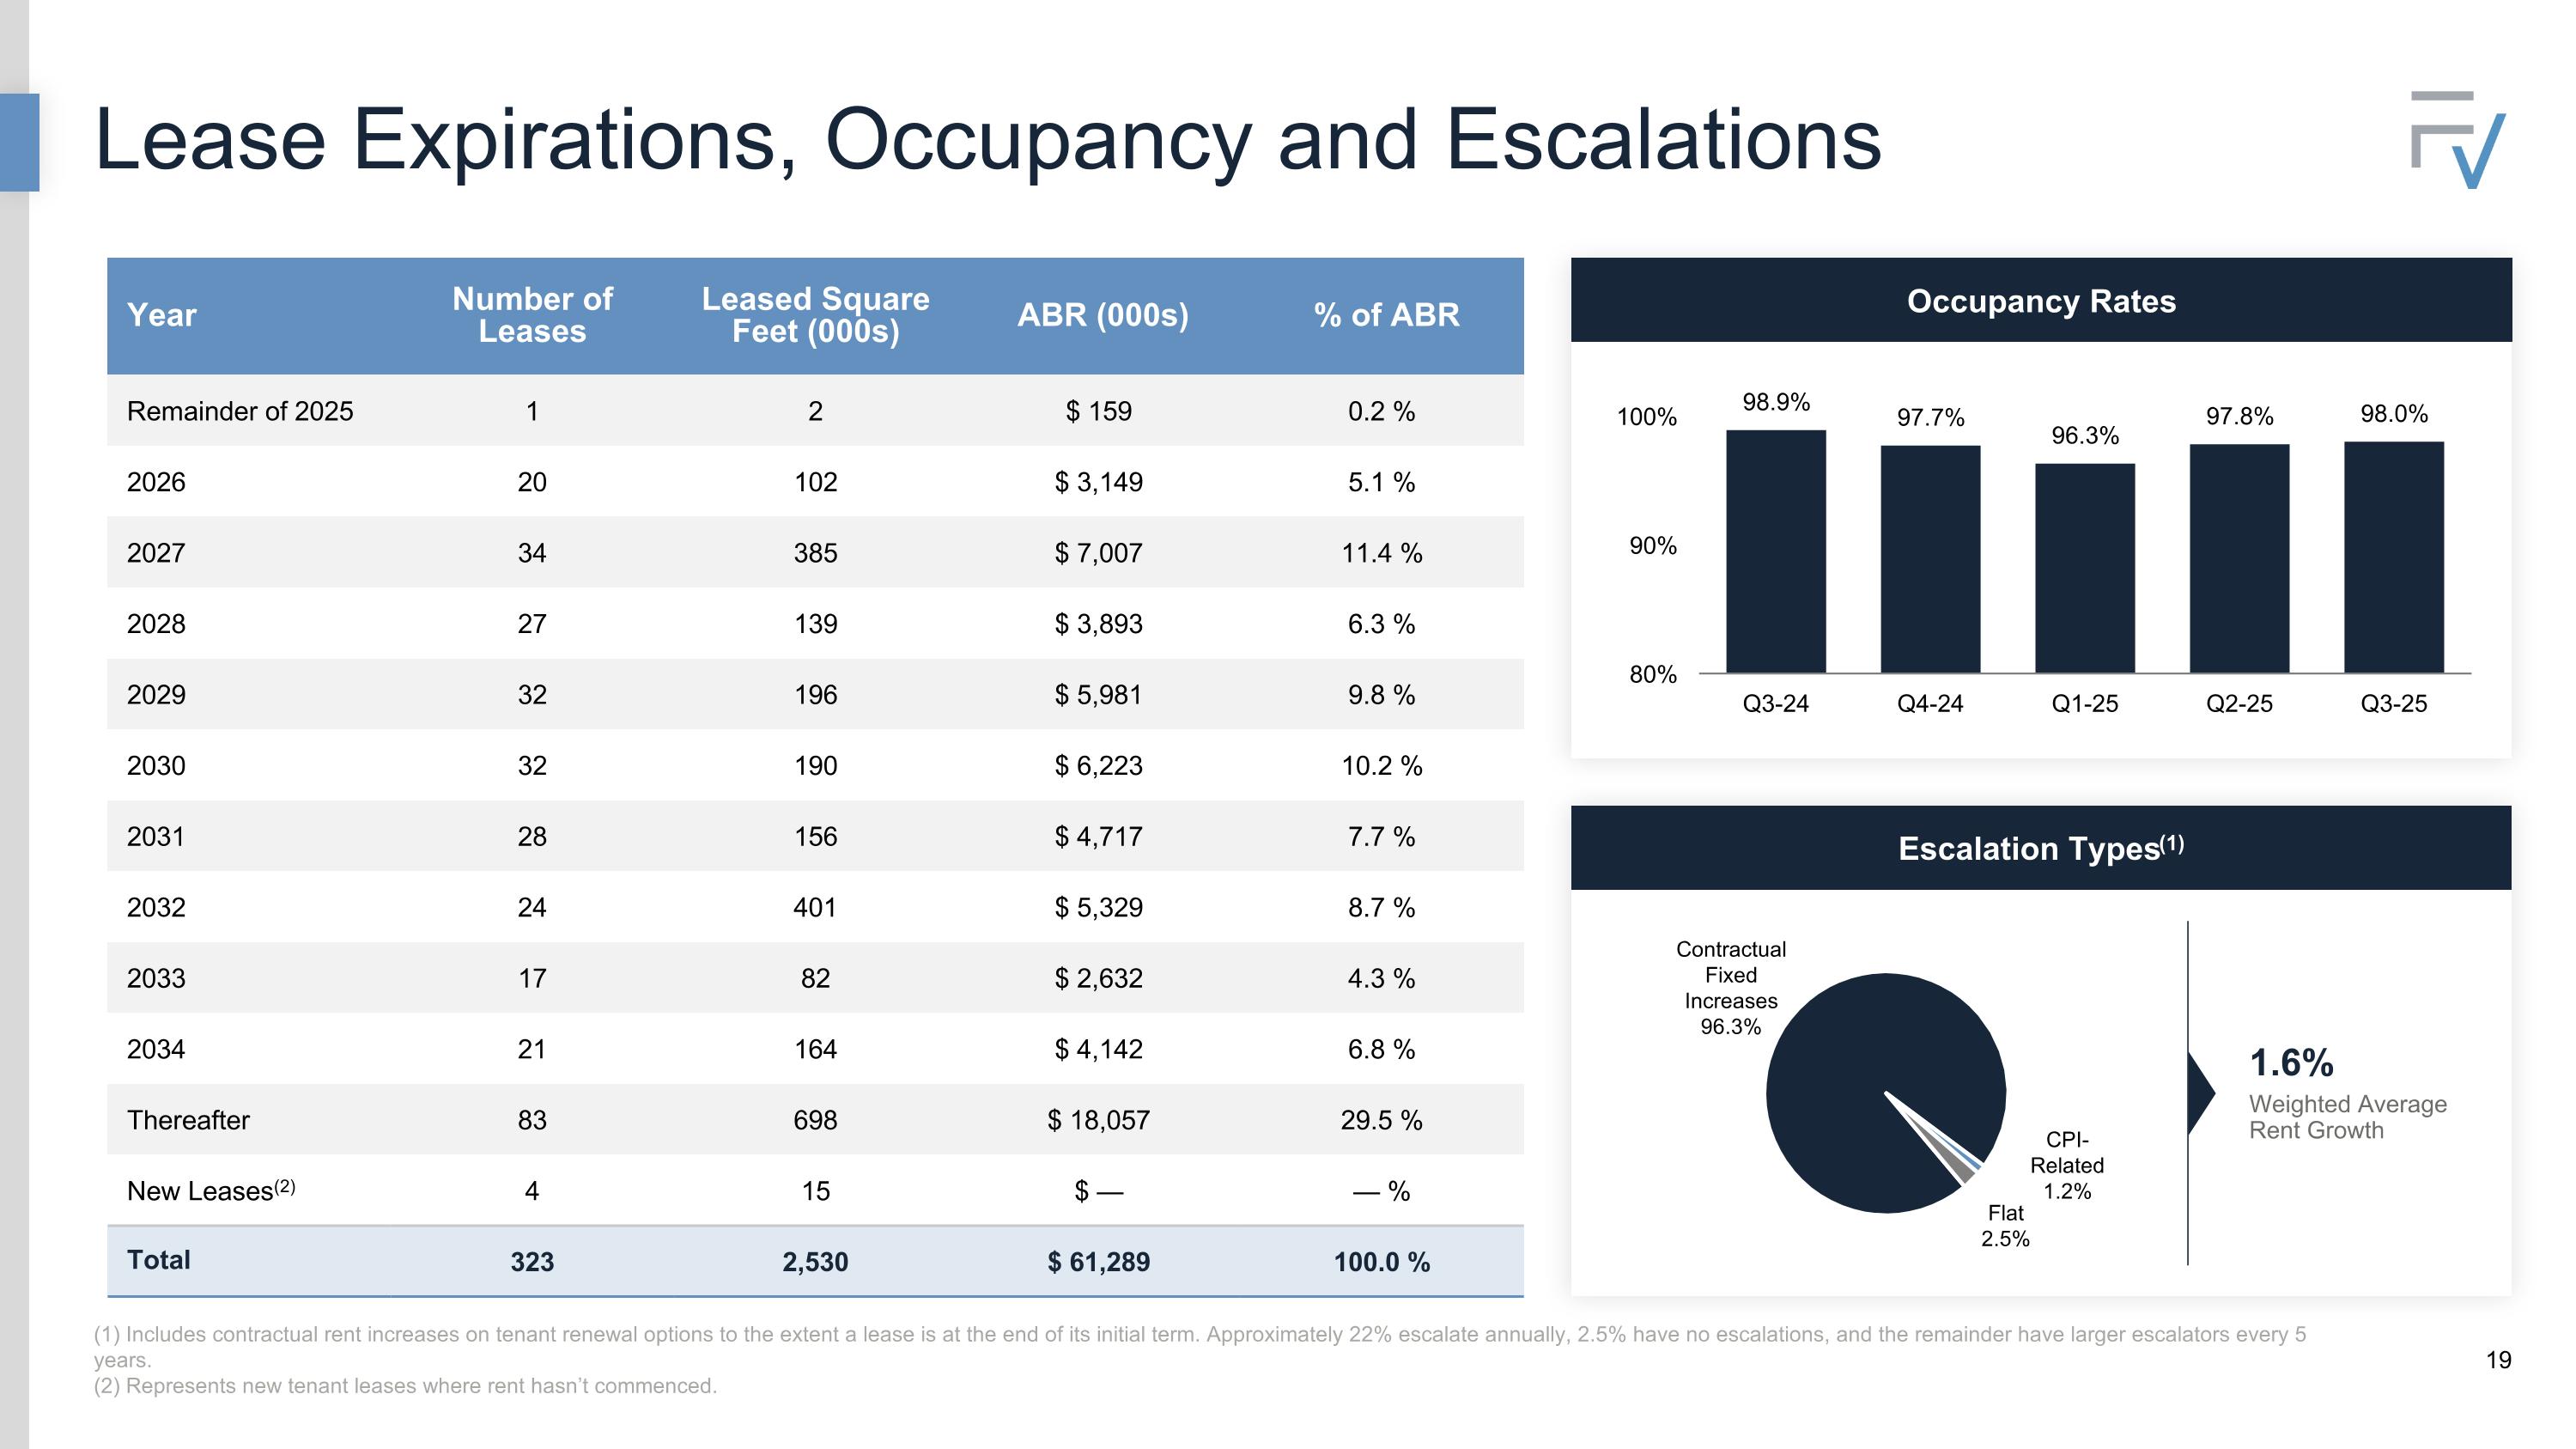
Yes, sure. Thanks, Pierre. And yes, Tony, we view the expirations historically as a positive. And just remember that we do have quality real estate; it's desirable, it's a fungible portfolio, and we maintain excellent diversification. What I would say is that since 2016, some data points, we have had 49 lease expirations, with only 8 expiring, 41 of those renewed to the same tenant, 3 renewed to a different tenant. And that represented about 105% recovery rate, with 5 that have been sold or are working to be sold off. 2 sold, 1 under contract, and 2 underway. So we look forward and we see that the renewals are an asset to bolster income based on historicals.
Speaker 3
Okay. And then just a follow-up is if you can just describe kind of your deal pipeline and where cap rates are trending and just kind of how the pipeline is coming along now that you have the capital. Do you have a lot to spend it on?
Sure. Great. Yes, good question. Thanks, Tony. Yes, I'd say that the market for us continues to be fluid. We expect cap rates for Q4 to come in similar to Q3, somewhere in that 7.5% cap rate range. I think we've all seen increased institutional interest in net lease, with abundant capital available for acquisitions. And that's really setting a tone for the marketplace. What I would say is, importantly, we typically do not compete against the institutions in our marketplace just due to our property size. So that gives us a bit of that competitive advantage. Now for those smaller buyers, leverage just has opened up a little bit. It is a little bit easier for some of the smaller buyers to obtain lending from community banks, et cetera. But we still see lots of opportunity. We've got a strong pipeline, similar assets that we've acquired along the way. And we certainly can increase the pace of acquisitions at any given time. And just remember, back in Q4, almost about a year ago, with the existing team that we had in place, we acquired a little over $100 million in acquisitions. So we do have that capacity, we do have the team in place, and we do have the relationships to turn on that faucet if we need to.
Operator
Your next question comes from John Kilichowski with Wells Fargo.
Speaker 4
Maybe if we could start back on the guide, you guys provided some helpful color around cap rates and credit loss. Could you talk to maybe what the high end and low end for the guide represents on each of those metrics? And if there's any other color you could give around what helps formulate your guide?
Sure, John. It's great to hear from you. Regarding the low end at $1.26, it's primarily about when we deploy the capital. We have set an investment guidance of $100 million for next year, and the speed of deployment is crucial. We also have some asset sales included in our guidance for next year, and we will continue with asset recycling. For the low end, to consider a $0.31 run rate at $1.24, we believe this is additive by at least $0.02. I am confident about the $1.26 figure, even if the capital deployment is slightly delayed. On the high end, factors such as favorable outcomes regarding credit issues, earlier acquisitions, and higher cap rates will significantly influence the range between the low and high end.
Speaker 4
Okay. Very helpful. And then maybe if we could just jump to the preferred. It looks like great execution here. Just kind of curious if you can give some color on the relationship with Maewyn, how you got to this number? I think the Street would have guessed something a little bit higher, so great job on your part. But just curious how you got to these terms and what the relationship was that got you here?
Sure. So we've known Maewyn and Charles Fitzgerald for a while. He's been an investor and a good partner since the beginning, since the IPO. I've worked with Charles prior when I was at Spirit so I knew him from that point as well. We sat with him, we met with them multiple times and we were discussing price and cap rates. Ultimately, just to steal a line from one of our colleagues, Shankh Mitra, he said, 'We're in early stages of a long journey of delivering compounding per share cash flow growth for our existing shareholders. And that's our North Star.' Now I'd agree with this statement and I think that is what we're trying to do here. We're trying to create a vehicle to get us back to growth. This is accretive per share capital growth that we think will drive a higher valuation. He understood that. He thinks that with this portfolio that he completely underwrote and he completely understood our business plan and was extremely supportive of giving us this capital and understanding that, at $17, it was very attractive for him as equity capital. And for us, it made sense to issue it, so we're fully funded and we can get back to growth. Given our size, which I do believe is a structural advantage in net lease, especially when you consider that 98% of net lease market cap is trading above NAV, having a small size allows us to deliver faster growth than all of our peers. We just have to get there, and I believe this is the first key step to do it.
Operator
Your next question comes from Jana Galan with Bank of America.
Speaker 5
Congrats on a nice quarter. Thinking about the dispositions you made this year, you kind of leaned away from casual dining, just curious on that 50 bps of bad debt in 2026. Could it potentially be better than that given that the portfolio composition is different than the historical?
Yes. No, I think that's a good question. And I think we feel like that's a conservative measure at this point. Selling off the concepts that we mentioned before really did help to optimize the portfolio. And we're going to continue to optimize the portfolio with select dispositions moving into 2026.
Speaker 5
And then maybe just more color on what categories that you're looking to expand in. You mentioned kind of this quarter: financial, fitness, and discount.
Yes, we still favor the same types of industries we have been investing in. We are interested in medical, financial, and automotive services. We are considering veterinary services but have not made any acquisitions in that area yet. Fitness appears to be performing well, returning to pre-COVID levels, with new class concepts being well-received in larger formats. We also remain positive about quick service restaurants, as Taco Bell continues to see sales increases despite consumer trends. We will approach the pharmacy and car wash sectors with caution, as well as certain restaurant concepts that seem to be less vibrant. Additionally, we are mindful of the credit situation for small franchisees.
Operator
Your next question comes from Ronald Kamdem with Morgan Stanley.
Speaker 6
Just a quick follow-up on the pipeline. Maybe just talk through sort of whether it's WALT or escalators, how you're thinking about those assets? And then the 40 basis points escalator on the acquisition, which I know is small, just what happened there?
Yes. No, I think the 40 basis points was just a timing. We had some assets that got pushed. The bulk of them got pushed into Q4. And I think when you see Q3 come together with Q4, you'll be a little bit more normalized with our typically 1% to 2% escalators, of course. When we're acquiring assets, having escalators built in is a key component. So focusing on longer-term WALT, we continue to build our weighted average lease term. And then also to continue to have those embedded rent bumps are, of course, critical to our acquisition criteria.
Speaker 6
And then my quick follow-up on the pref. Just can you remind us where that gets to in '26, just what that level of debt-to-EBITDA that ends up getting you to, if you include that?
As we concluded this quarter, one of our primary objectives was to finish the year with a very low leverage point. Achieving a leverage ratio of 5.3 times is quite productive, especially since we were also able to raise our guidance for AFFO per share. Looking at the preferred equity, which I consider as equity and is treated as such by our accountants, this will effectively reduce our leverage. We will be financing it at a lower rate, more like a 25-75 split rather than the traditional 60-40. We do have some acquisitions planned for the second half of this year reflected in our guidance, so we anticipate leverage will increase in the fourth quarter. However, we expect it to remain well below 6% throughout next year.
Operator
Your next question comes from Daniel Guglielmo with Capital One Securities.
Speaker 7
Although you've been in a bit of a holding pattern on acquisitions, I know you remain engaged with the brokers across the country. So over these past few quarters, which states or regions have you seen kind of these frontage outparcel properties that you focus on come up for sale? Is there anything of note there?
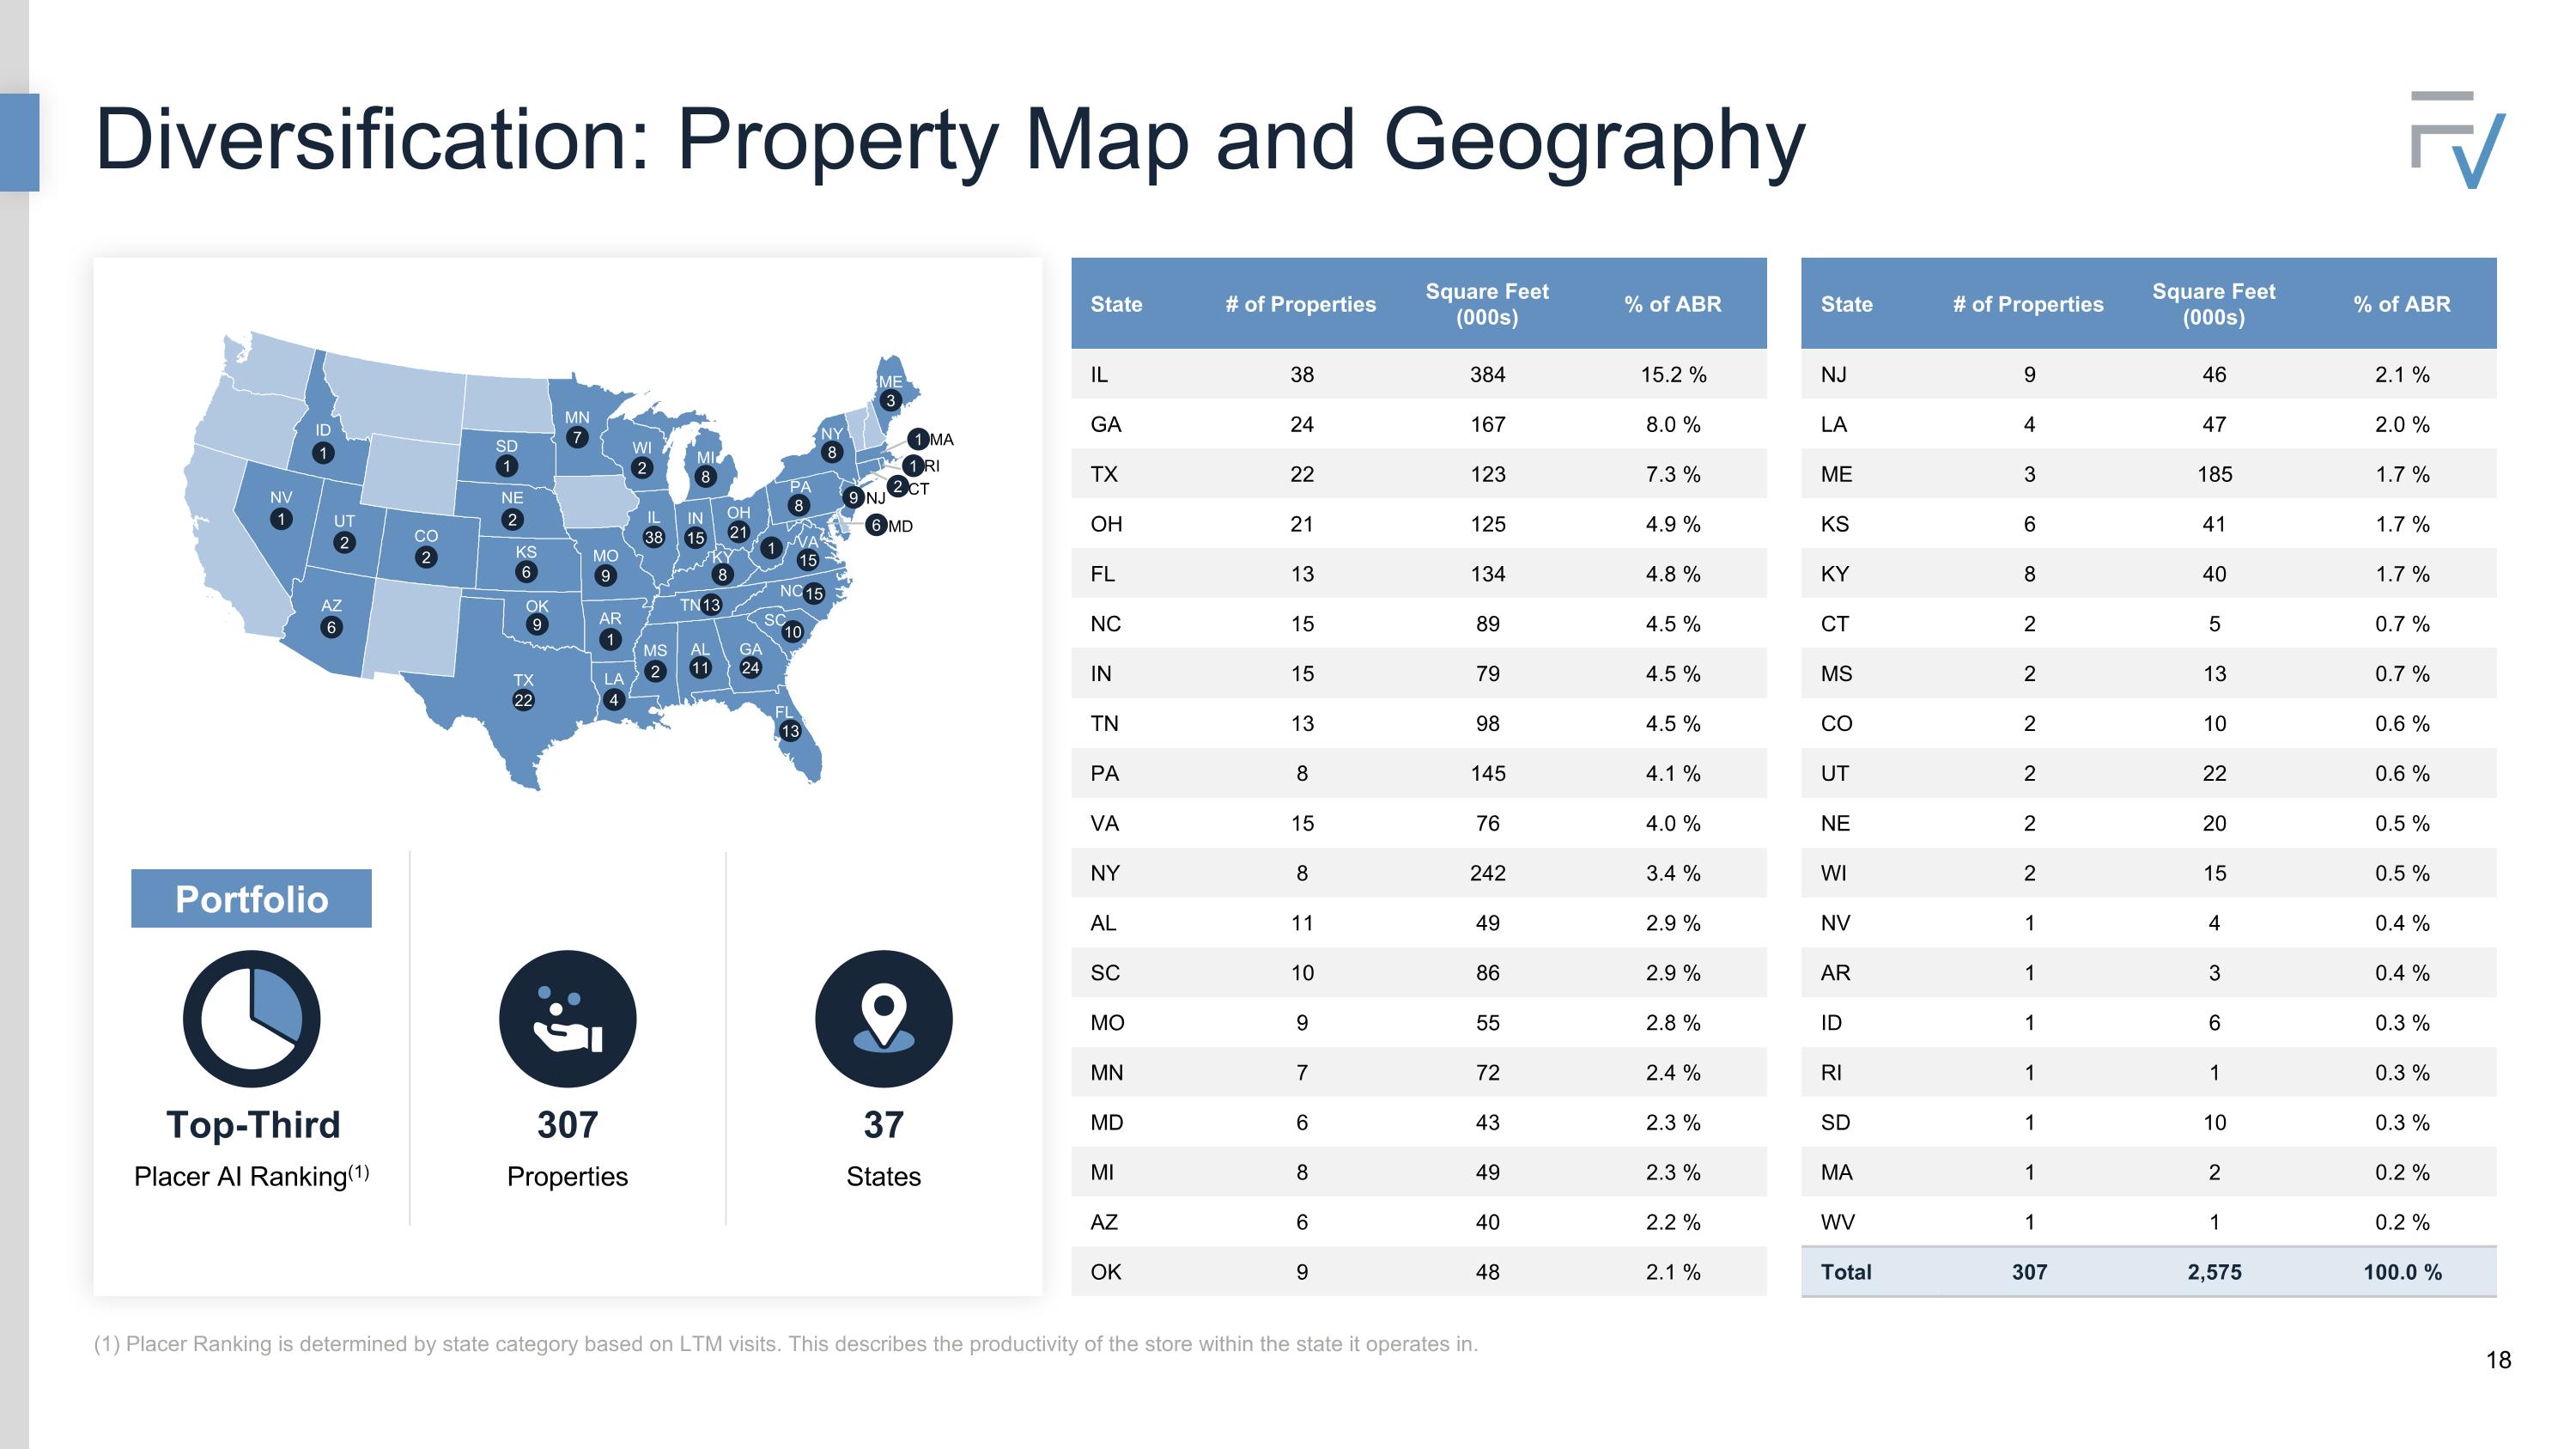
Yes. No, I don't think there's anything state specific from the marketplace. I think we're going to continue to target strong-growth states. We're going to probably start to maybe reduce exposure just because we have a little bit more of that to Illinois. But the general marketplace, there's general opportunity really across the space and across states. I wouldn't think it's really anything state specific. I think it will generally follow, call it, that same progression of assets that we've acquired throughout the portfolio.
Speaker 7
Great. And then you touched on it in an earlier question, but the portfolio occupancy has improved kind of sequentially over the last 3 quarters. Can you just talk about, are there any kind of industry mixes where you've seen something new this quarter? Maybe areas where Drew and team are spending more time with tenants to understand their needs and consumer patterns?
Yes. I'd say that by optimizing the portfolio and taking out some of those concepts that we mentioned earlier, I think that certainly helped the way that we look at the portfolio going forward. And that 50 basis points isn't a ton of action at the end of the day. So the good news is, and we'll keep the fingers crossed, but we seem to be a little bit quiet there right now, and we hope that continues.
Operator
There are no further questions on the phone lines. I will turn it back to Mr. Steve Preston for some closing remarks.
Great. Thank you, and thank you all for joining. We look forward to continuing to add value for the shareholders. And we hope to see you all at NAREIT in December or at our upcoming NDR with BofA. Thank you again for your time, and please be safe.
Operator
Ladies and gentlemen, this concludes your conference call for today. We thank you for participating and ask that you please disconnect your lines. Have a great day.