Operator
Good day, ladies and gentlemen, and welcome to the Frontview Read, Inc. Q4 2025 Earnings Conference Call. At this time, all lines are in listen-only mode. Following the presentation, we will conduct a question and answer session. If at any time during this call you require immediate assistance, please press star 0 for the operator. This call is being recorded on Wednesday, 25th of February, 2026. I will now like to turn the conference over to Pierre Revolte, CFO of Frontview. Please go ahead.
Thank you, Operator, and thank you, everyone, for joining us for Front View's fourth quarter and year-end 2025 earnings call. I will be joined on the call by Steve Preston, Chairman and CEO. In addition, Drew Ireland, our Chief Operating Officer, will be available for Q&A. Before we get started, I would like to remind everyone that this presentation contains forward-looking statements. Although we believe these forward-looking statements are based on reasonable assumptions, we are subject to known and unknown risks and guarantees that can cause actual results to differ materially from those currently anticipated due to several factors. I refer you to the State Harbor Statement in our most recent filing with the SEC for a detailed discussion of risk factors relating to these forward-looking statements. This presentation also contains certain non-GAAP financial metrics. Reconciliation to non-GAAP financial metrics to most directly comparable GAAP metrics was included in the exhibits for the SEC under Form 8-K, which include our earnings release, supplemental package, and investor presentation. These materials are available on the investor relations page of our company website. With that, I'm now pleased to introduce Steve Preston.
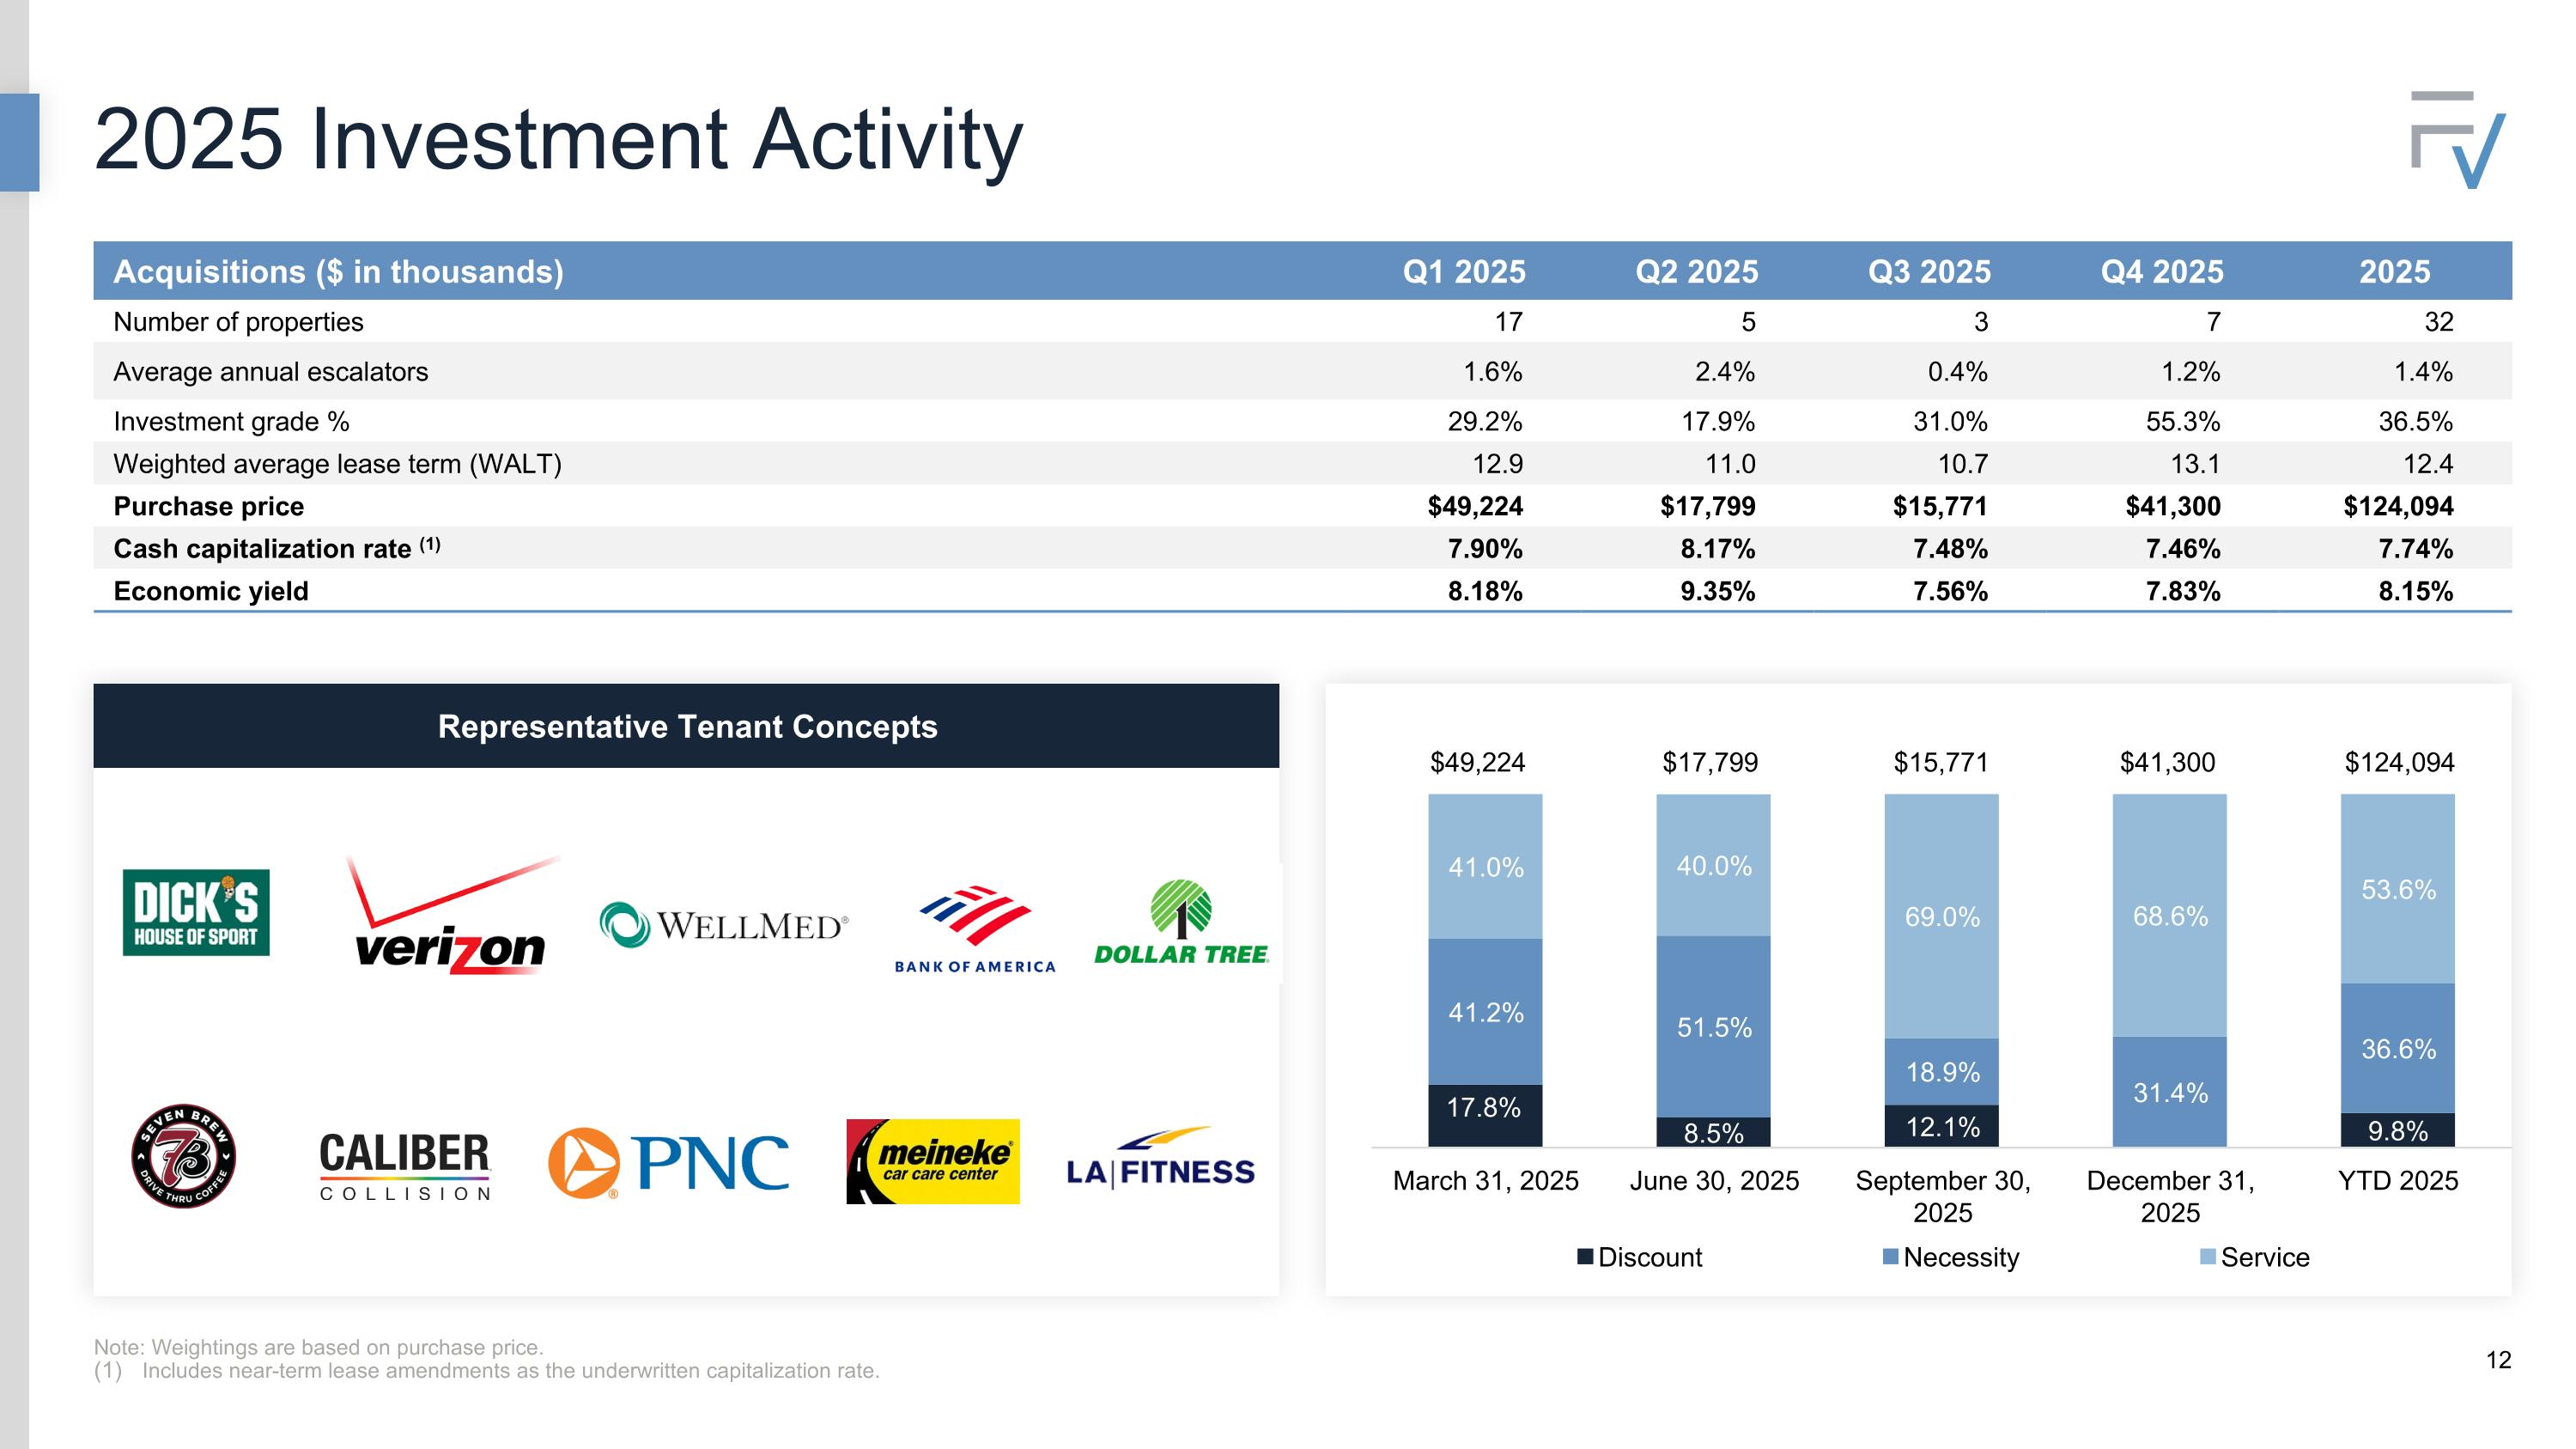
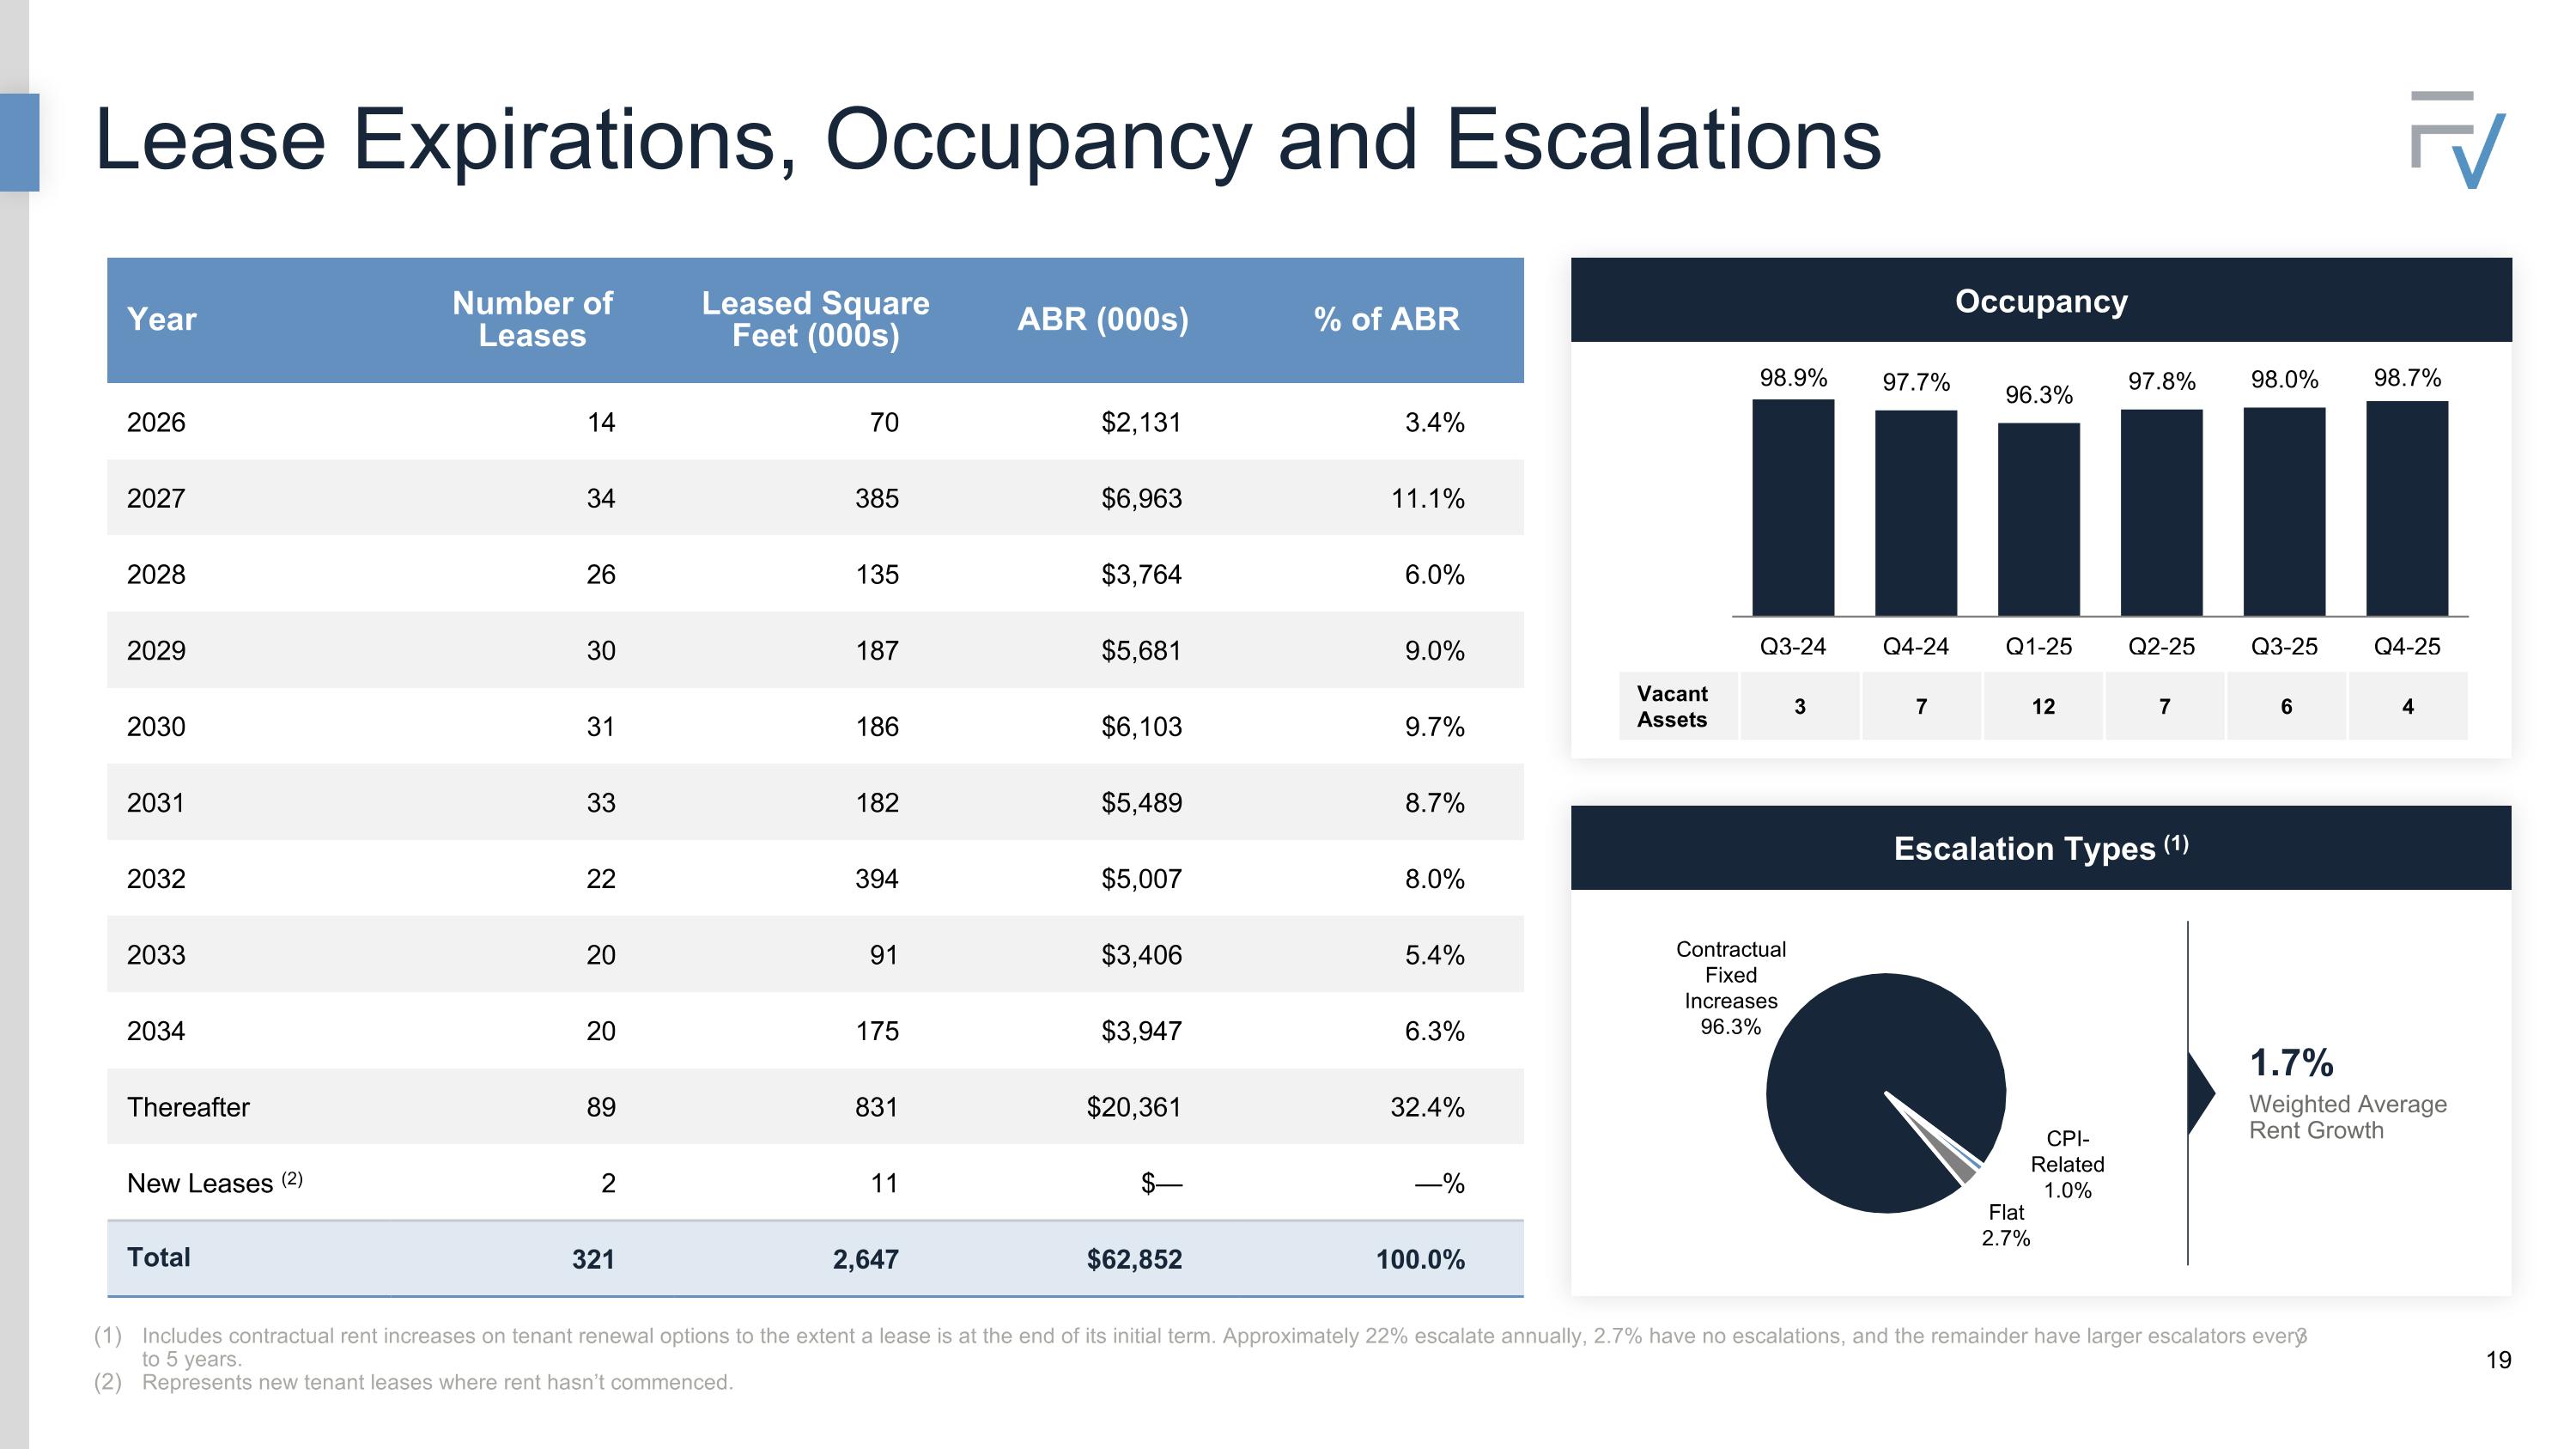
Thank you, Pierre, and good morning, everyone. I am very pleased to discuss our fourth quarter and full year results. Today, Frontview is operationally stronger, financially more resilient, and strategically better positioned than at any point since becoming public. Our portfolio has been refined. Our balance sheet remains conservative. We have secured capital to fund accretive growth opportunities consistent with our real estate first philosophy. As a reminder, our portfolio was built around a real estate-centric strategy focusing on acquiring fungible, frontage-based assets typically located in front of major retail nodes in the top 100 MSAs nationwide. Our strong real estate provides critical advantages and quicker outcomes when recycling, retenanting, or repositioning tenants. For example, we owned one tricolor auto dealership that closed in early Q4 due to the widely reported tricolor bankruptcy. Due to the quality of our real estate and our experienced management team, we quickly released the property to Avis in the same quarter, resulting in a substantial credit upgrade and an approximately 24% increase in value for our shareholders. Historically, in founding the REIT in 2016, our experience has been that that we have achieved, on average, over 110% of prior rent when leasing to a new tenant. Results like these cannot happen without top-tier real estate quality and a top-tier management team. Our tenant base remains heavily diversified across necessity and service-based industries. Today, we have 321 leases, with the top 10 accounting for only 24% of ABR, and our largest tenant contributing just 3.5 percent. In addition to our real estate first philosophy, diversification has been part of our strategy from day one and serves as another risk mitigate, keeping exposure to any single tenant low as credits come and go over time. During the fourth quarter, we acquired seven properties for approximately 41.3 million and an average cap rate of 7.5% with a weighted average remaining lease term of approximately 13.1 years. In 2025, we acquired 32 properties for approximately $124.1 million and an average cash cap rate of 7.74% and a weighted average remaining lease term of approximately 12.4 years. Since the IPO in October of 2024, we have added 61 properties and increased the initial asset base by nearly 30 percent. Starting this quarter and going forward, to help you better understand our real estate strategy, we will highlight one quarterly acquisition on the cover of our investor presentation and briefly discuss it during our calls. This quarter, we are highlighting a Seven Brew in Jacksonville, Florida. Seven Brew is a rapidly growing drive-thru coffee chain founded in 2017, known for its high energy, double drive-through model, and offering over 20,000 unique drink combinations. It received a growth equity investment from Blackstone in 2024 and has over 600 locations today and is working with some of the most experienced franchisee operators in the country. We like their business model and have three properties leased to them in the portfolio, which is about 0.6% of ABR. We acquired this property at approximately an eight cap rate, well above the low six cap rate we believe a new seven brew would typically trade at today. The property is very well located within a top 100 MSA. It features direct frontage on a major retail node. The land provides tenant flexibility, and the lease has a 15-year term, annual rental escalators, it is triple net, and it has a modest rent of $168,000 annually, which we believe other tenants could afford to pay in this desirable Florida location. We achieved a higher cap rate due to liens associated with the recent construction, which limited the buyer pool. We resolved the liens directly, cleared title, and ultimately closed on the transaction. Being known in the marketplace as a buyer who can identify and resolve problems during an acquisition further strengthens our position as a buyer of choice. Our largest acquisition during the quarter was a Dick's House of Sports located in Durham, North Carolina, adjacent to the streets at South Point, a Brookfield-owned mall that does just over 900 per square foot in sales and is rated an A-plus mall in Green Street's Advisors Mall database. We are excited about the real estate location and are very familiar with this flagship concept and owning select larger boxes. We already own a few larger format assets with strong frontage, such as Walmart, Lowe's, Best Buy, et cetera, and we'll continue to own more of these assets when the opportunities present themselves. We are always seeking to acquire assets with value creation opportunities that fit our investment criteria. And we placed this asset under control earlier in 2025 while the project was under construction to take advantage of attractive pricing. As a result, we believe we have created about 100 basis points of value based upon our purchase price cap rate in the mid-sevenths. The acquisition market remains open to us with our competitive advantages intact. We believe we can materially increase our acquisition pace as our cost of capital improves. We expect acquisition cap rates for Q126 to settle around 7.5% with volumes generally in line with guidance. As previously reported, on the capital side, we have our net acquisitions funded for the year with our $75 million convertible preferred investment from Maywin, with our first $25 million draw completed already in February. With respect to dispositions, we sold 11 properties for $20.4 million during the quarter and an average cash cap rate of approximately 6.82% for the occupied assets with a weighted average lease term of 6.9 years. For the calendar year, we sold 36 properties for $78 million at an average cash cap rate of approximately 6.79% for the occupied assets with a weighted average lease term of 7.9 years. For the year, the disposition cap rate range was 5.4% to 8%, with the median cap rate on sales at 6.9%. In the fourth quarter, the lowest cap rate was a Twin Peaks in Irving, Texas, where we achieved a 5.8% cap rate. The assets we have disposed of are less optimal concepts compared to the balance of our portfolio, or they could be concepts we just want to reduce exposure to. We expect to continue optimizing the portfolio through 2026, that we expect the pace of dispositions to decline materially as most of our portfolio optimization occurred in 2025. Since our IPO, the 2025 dispositions reduced the asset base by 11%. During the quarter, we sold the following concepts. Red Robin, Sonic, Twin Peaks, which is now bankrupt, Adams Auto, and the dark PNC, Bojangles, and First Bank. These asset sales clearly demonstrate the desirability and liquidity of our well-located real estate portfolio. They highlight the disconnect between our stock price and the implied 8.1% capitalization rate on existing NOI. Interestingly, our implied cap rate is higher than what we sold a dark Bojangles, and Alabama for, with less than four years remaining on the lease term, our highest cap rate sale for the quarter and year, and 160 basis points above the average disposition cap rate for properties sold in Q4. I would draw your attention to page 23 of our investor presentation where we show our dislocated NAV relative to the entire portfolio being valued at the same level as the assets we sold in the quarter, along with the average implied cap rate of our peers. Switching gears to the portfolio, we closed the quarter with occupancy approaching 99% with just four vacant assets. We currently have two tenants in bankruptcy, Smoky Bones and Twin Peaks, each with one unit, representing a combined 0.56% of ABR. With Smoky Bones, we have already received multiple offers to purchase the asset during the year so we believe we can maximize value by releasing the asset so we waited until the bankruptcy went through to obtain control of the property with respect to our remaining twin peaks we have understood twin peaks financial condition for some time and got ahead of their bankruptcy selling one property in the quarter at a 5.8 cap rate and already releasing the second property to two tenants, Panda Express and Jaggers. The combined rent for both of these leases is $265,000 versus Twin Peaks rent of approximately $138,000, resulting in a 92% increase in rent and approximately a three times increase in value from our original basis. This is an excellent outcome and another example of why our real estate-focused approach, combined with our seasoned management team continues to deliver value for our investors. Historically, we achieved an average recovery rate of approximately 90% when combining both vacant sales and new leases, though just our new leases alone has exceeded 110%. As a result, when an asset comes back, we will initially spend more time pursuing release options rather than quickly selling an asset in order to maximize long-term value for our shareholders. For example, our current Smokey Bones. As we have continued to optimize the portfolio through Q4, we don't see any material additions to our watch list at this point, and for clarity, we believe bad debt should be approximately 50 basis points in 2026. In closing, Frontview is stronger today than at any point since our IPO. We have optimized our portfolio. We have demonstrated the fungibility and desirability of our well-located real estate. We have shown our top-tier management team's capability of proactively creating value for shareholders through creative asset management activities and capital structuring. We beat earnings and raised guidance throughout 2025 while disposing of assets, demonstrating the strength of our operations. We have a low dividend payout ratio below 70%, low leverage, and we are fully funded to acquire $100 million of net assets and grow AFFO per share 4% in 2026 at the midpoint of our guidance. All the while, our share price remains dislocated relative to a much higher NAB, especially given that we can meaningfully accelerate our already strong growth with a lower cost of capital. We believe that our real estate-focused strategy, coupled with our developer DNA will deliver AFFO growth and drive outsized returns for our shareholders. With that, I'll turn the call over to Pierre to review the quarterly numbers and guidance.
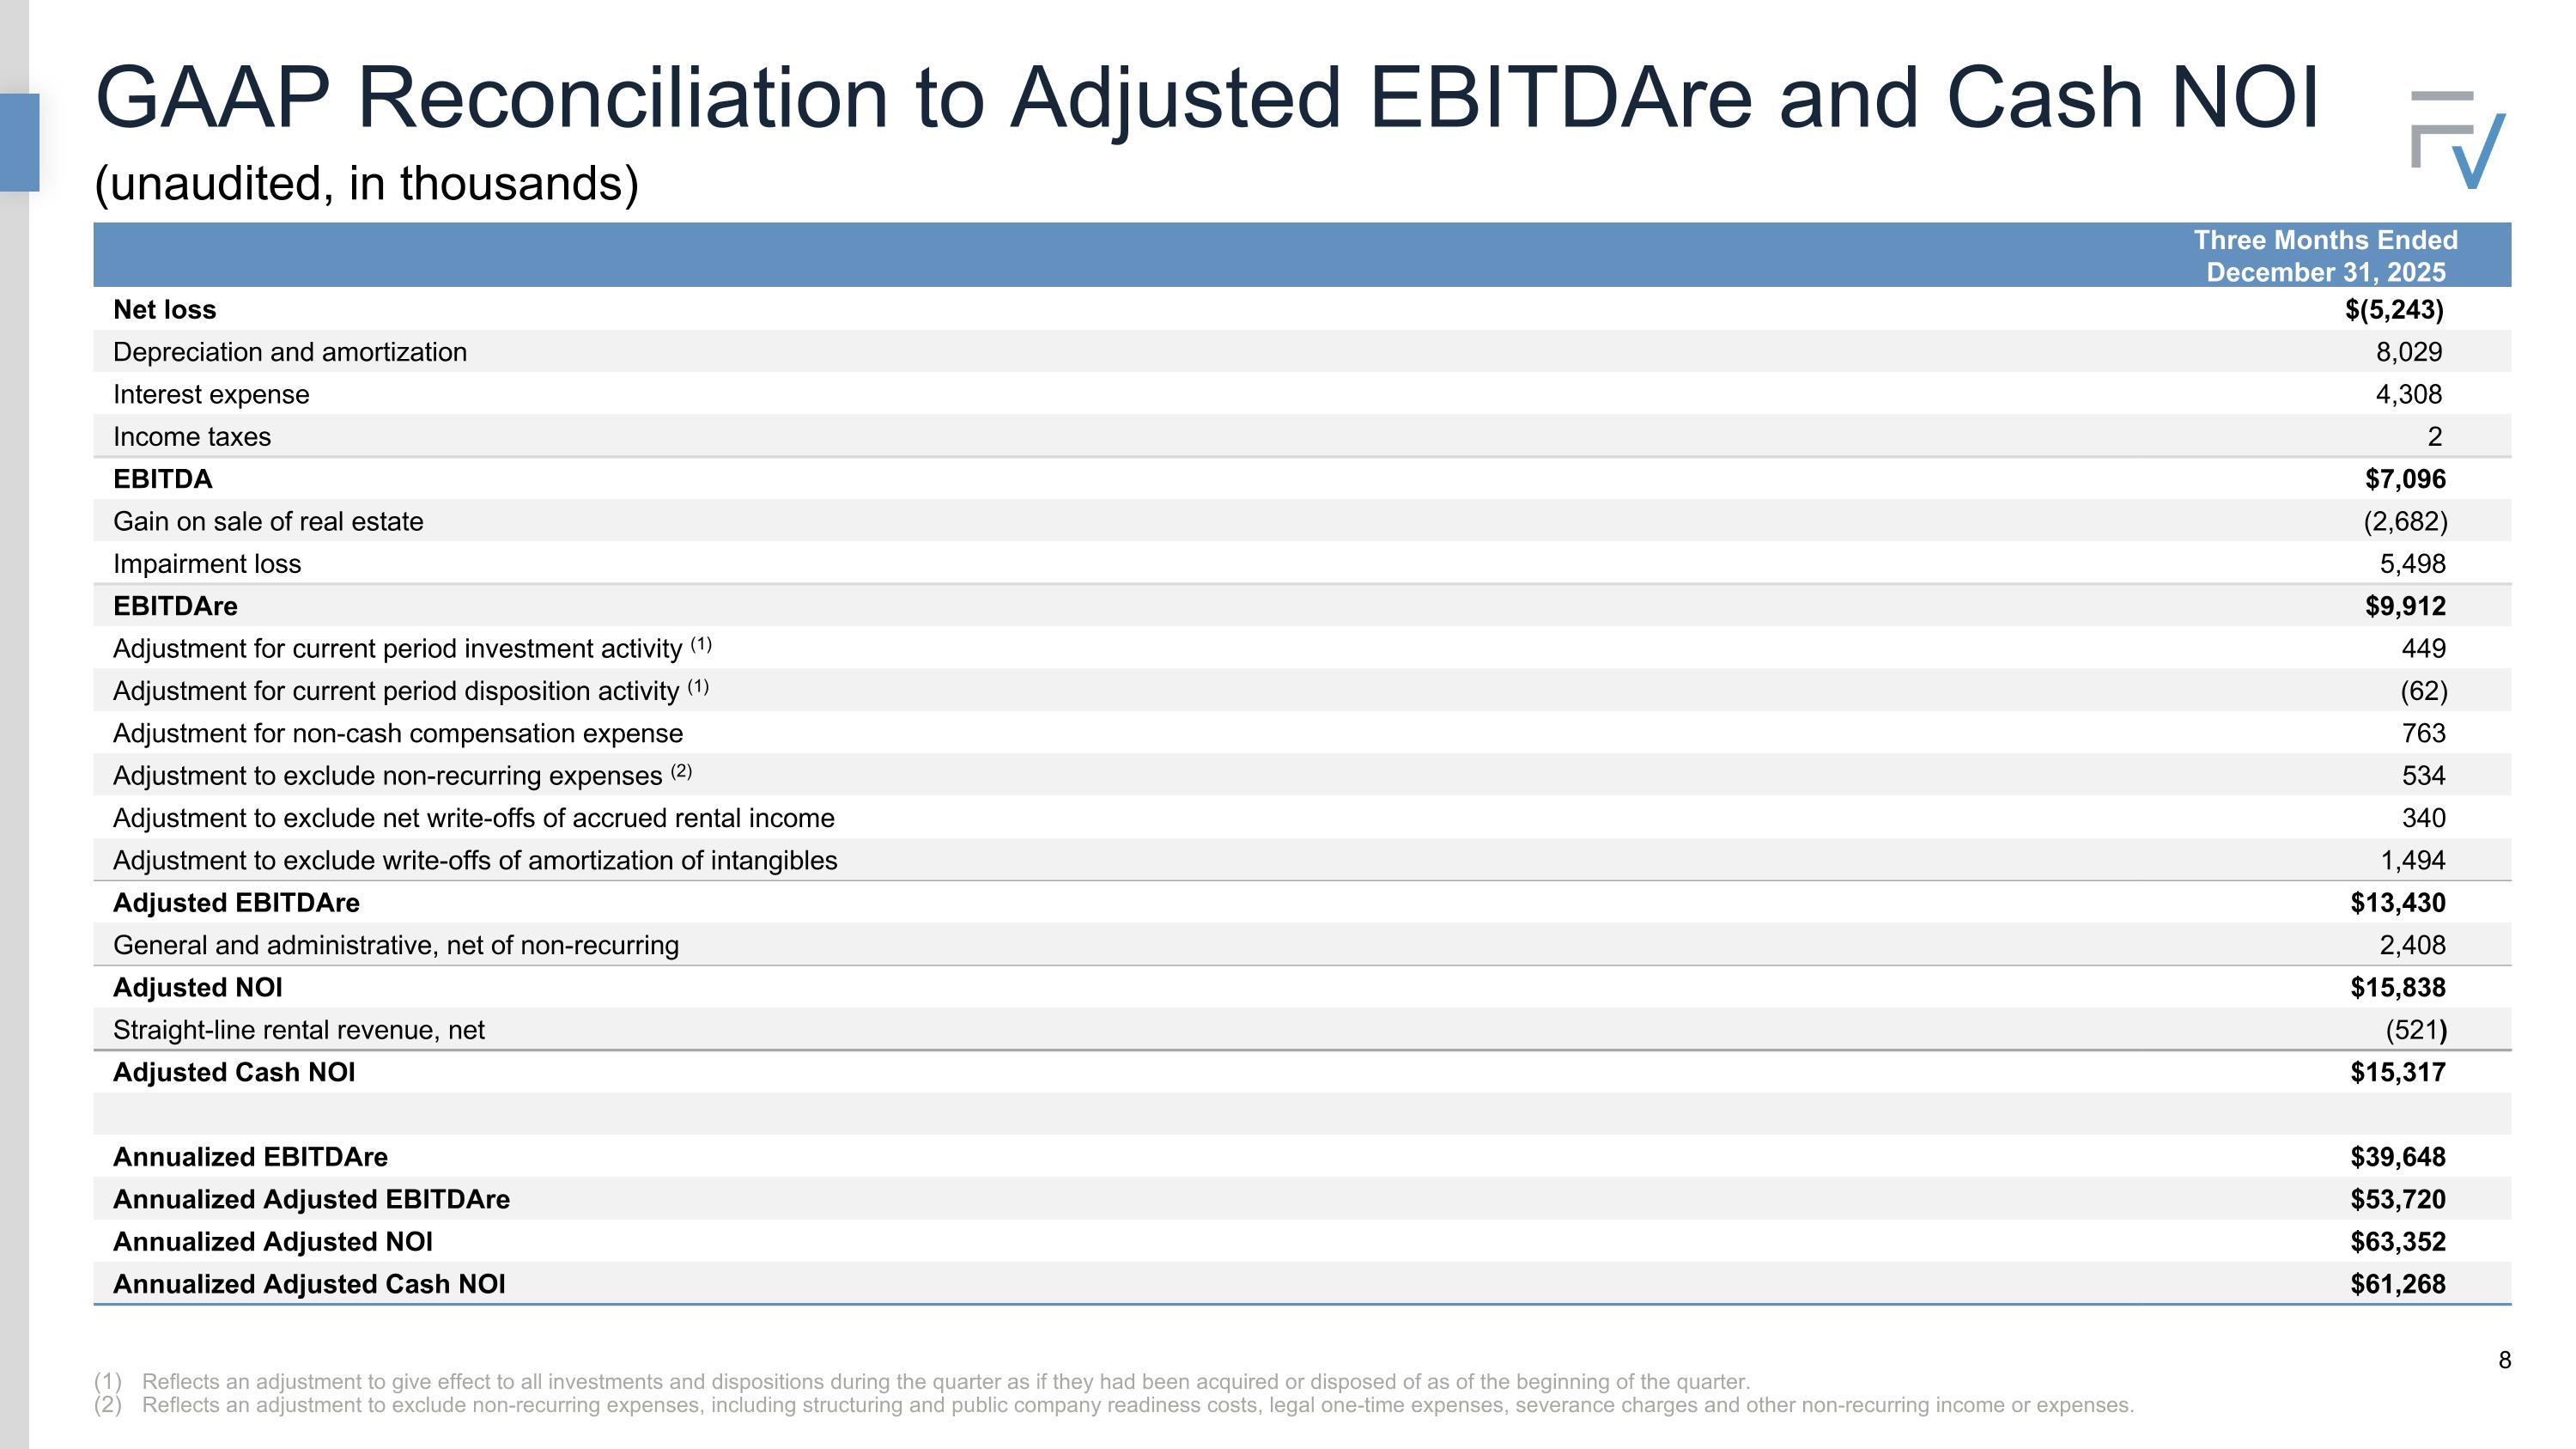
Thanks, Steve. Before turning to quarterly results, I want to briefly highlight some enhancements we made to our disclosures. We now provide 100% of ABR by Concepts, along with key location data including average daily traffic, place for AI performance, and population metrics. Our properties are located in retail nodes with average daily traffic exceeding 24,000 cars. 78% are located within top 100 MSAs, and the average five-mile population is 184,000. Placer AI ranks retail locations from 1 to 100, with 1 being the highest rank based on number of visits by retail subcategory within the state. Our locations have a median score of 26.8, placing them in the top third of retail locations. And for our upcoming lease expirations in 26 and 27, our stores have a median pleasure score of 22.5 and 15.5, respectively, both in the top 25 percent. Finally, on our website, we disclose 100 percent of our property addresses, including direct legal map links that showcases your trade area. This detailed Disclosure allows investors to independently evaluate the quality of our assets and their locations. Accomplishing every address affirms our real estate first strategy, the assets we own, and will acquire in the future. Turning to the quarter. The exit of the quarter with annualized base rent of $62.9 million, or $1.6 million higher than Q3, reflecting net acquisitions of $21 million for the quarter. This equates to approximately $15.7 million in stabilized quarterly base rent on a go-forward basis. In addition to base rent in the quarter, we generated $186,000 in interest income and $76,000 in percentage rent and other cash income. At quarter end, our run rate cash revenue is $16 million or $64 million annualized. Our annualized adjusted cash NY was $61.3 million or a 96% margin on the in-place work point. As we move into 2026, we expect NOI cash margin to expand to 97%, or roughly $62 million on a normalized basis. This improvement is driven by higher occupancy, stronger recoveries of insurance, and lower other property costs. Thus, as we start 2026, our run rate quarterly cash NOI is $15.5 million. G&A expense for the period was $3.7 million, which included $534,000 of non-recurring charges and $763,000 of stock-based compensation. Non-recurring items were primarily legal expenses related to amendments to credit facilities and corporate structure. Excluding stock-based compensation and non-recurring items, cash G&A was $2.4 million per quarter, which is approximately the run rate for the year. Interest expense declined by $256,000 a quarter of a quarter to $4.3 million. The decrease was primarily driven by amendments to our credit facilities, which reduced the spread on both the term loan and Revolver by 15 basis points. As a result, the borrowing rate on our term loan declined to 4.81%, and our savings from the spread adjustment is over $450,000 on our debt outstanding. We ended the quarter with $115.5 million outstanding on the Revolving Credit Facility of which $100 million is hedged. Based on the hedges we put in place last September, the effective SOFR rate of $100 million steps down from 3.86% to 2.97% over the course of 2026, resulting in an average rate of 3.35% for the year. Total available liquidity was $223 million, inclusive of cash, revolver capacity, and $75 million of undrawn preferred equity. We ended the quarter at 5.6 times net debt to annualized adjusted EBITDA RE, and our loan-to-value was 34.5%. On February 10th, we drew down $25 million of the convertible preferred equity and expect to draw the remaining $50 million throughout the year to fund our $100 million net acquisition target. We expect our net debt to adjusted annualized EBITDA RE to end the year below five and a half times. AFFO per share for the fourth quarter and full year achieved a high end of guidance with $0.31 for the quarter and $1.25 for the year. Looking ahead to 2026, we are revising our AFFO per share guidance range upwards to $1.27 to $1.32, representing 4% growth at the midpoint and 6% at the high end. The increase reflects faster-than-expected resolutions of tricolor, denying credit issues to date relative to our assumptions, and continued execution of a capital deployment strategy with near-term acquisitions in the mid-7 cap rate range. Our objective is clear, to build the best-in-class net lease REIT differentiated by a truly real estate-first investment strategy. We believe that credits evolve over time, and what thrives long-term value is a location, rent basis, and the box. Closing our current gap to NAV starts with performance. We intend to execute on a capital deployment plan, continue delivering strong operating results, and maintain a conservatively levered balance sheet. With that, I'll turn the call back over to the operator to open up for Q&A.
Operator
Thank you. Ladies and gentlemen, we'll now begin the question and answer session. Should you have a question, please press the start followed by the number one on your touchstone phone. You will hear a prompt that your hand has been raised. Should you wish to decline from the polling process, please press the start followed by number two. If you are using a speakerphone, please lift the handset before pressing any keys. One moment, please, for your first question. Your first question comes from John Klitschowski from Wells Fargo. Please go ahead. Hi, good morning.
Thanks for taking my question. My first question is on the AFFO guide. Pierre, thanks for walking us through the adjustments there. Maybe could you help us understand what gets us to that $1.32 versus that $1.27?
Yeah, sure, John. Thanks for the question. It really is – portfolio performance is a component of it in terms of if the portfolio continues to do as well as it's been doing, there's opportunity to go on the high end because our assumptions are – they do have some assumptions in terms of what the reserves will be. So I think number one is portfolio performance. Two is the timing of acquisitions and dispositions, assuming that we do more in the front half versus the back half that impacts it. As we talked last quarter, I said that the seven and a quarter would be the cap rate guidance, but we're still seeing mid-sevens right now, so that helps a bit. So it really comes down to portfolio, continue to execute well, and the timing and cap rate on acquisitions and dispositions.
Got it. And then one for Steve, I believe in the opening remarks, and made a comment about the implied cap rate of the business trading outside of where you sold a dark, smoky bones. I hope I said that correctly. I heard that correctly. I guess given the persistent discount to NAV, have you received any outside interest? And if so, where is that interest coming in at? Because there's clearly a disconnect.
Yeah, no, we certainly see that discount, I think it's pretty obvious and evident certainly from that one sale and then certainly from the other sales that we made disposing of about $80 million of property and then averaging about 6.79 cap rates throughout the year. With respect to inbounds, that's been quiet at this point.
I would just add, John, the portfolio and the disclosures, I think, can help people understand that in terms of the discount. I think that people are, obviously, there's a big market there of people that are looking for portfolios and qualities, and it's very hard to replicate what's been created. I will make a correction. It was at dark Bojangles. It wasn't a Smoky Bones that got sold, but when that gets sold at an ACAP, and if you think about, there was a lot of dispositions this year, including, you know, Twin Peaks that was sub six, and the media and capital dispositions of a, you know, 6.9. It's pretty, the portfolio quality is there. I think we just have to execute, and I think that will drive the performance to get closer to NAV. If there was interest, now you can see, you know, through our website, through the disclosures, there's enough information for people to come up with what this company could be worth.
Operator
Thank you. Your next question comes from Anthony Pallon from JP Morgan. Please go ahead.
Yeah, thanks. Just maybe following up on the last point there around your asset value, as you think about just growing the portfolio over time, you have the prep you could draw down. But how do you think about just incremental capital looking at it as either an AFFO yield versus, say, NAV? Because I think you end up with two pretty different numbers, I think, in terms of when you would seem to have access to capital creatively.
Thanks, Tony. It's true. Like if you think about our NAD and the discount, like we're trading like roughly at like low 8% implied cap rate. But if you think about the weighted average cost of capital, it has improved meaningfully. What's important to note is that for 2026, it's not an issue because we're fully funded with the equity that we put in place. and so we think that that gives us time to just execute on the $17 equity that we got through the preferred. But even if you think about where our stock is today, in the mid-16s going to 17, you're talking about an AFO yield that ranges from mid-7s to mid-I7s. With debt costs, I think we could probably do debt costs that are 5% or lower if you think about where seven-year term loans my price. And that translates to a weighted average cost of capital that is, you know, between 75 to 125 basis points below where we're seeing acquisitions. So that does put us in the strike zone to continue to execute. But fortunately, you know, the equity question is solved for this year. It's more about when you think about, you know, what you go into next year, how that translate. And I also highlight, I made the comment in my remarks is that, you know, we are delevering this year. We're only using 25 million of debt on the 75 million of equity. So if we end below five and a half times, we do actually have capacity to grow into 2027 without really needing the market for a bit of time. But it is nice that from a weighted average cost of capital and growing AFFO per share, which is what we intend to do, we are well set up to do that, even if we're not quite at the NAB. Now, I point to you, if we do get to, I think, if you do get to the NAB or the NAB premium, which you look at the net lease comp set, 98% of the market cap is above NAB. If we get to that point where we're doing, where our cost of capital gets there, just the math of being a smaller company will allow us to grow faster than any of our peers. And that's something that I think is an advantage that we will see over time. But first, we have to get to the NAD.
Okay, great. That's a lot of good color. And my second one relates to the deal activity as you look into the market. Are you prioritizing initial yield versus contractual bumps versus lease length? Like when I look in the quarter, you had good yield and long lease lengths. the bumps were a little on the lower side. I guess, is there a priority there? You're just looking at the totality of the transactions.
Yeah. Yeah. Generally good question. Certainly the totality, it's an equation, but certainly for us, you know, we're focusing on the location and we're, we're focusing on sort of that size of the land track. And then what's also very important for sure is the market rent and making sure that anything that we're acquiring also, you know has rent that's replaceable and then of course you know we look at and we're focusing on uh on the credits and then uh determine the escalations as well and with respect to the escalations i think they came in about 1.2 for uh for the quarter you know we it just sort of ebbs and flows on when when bumps take place uh typically it's uh you know you get uh you know a 5 or 10 percent bump every – or 1 to 2 percent bump every five years. And so, you know, it's in line with, you know, our 1 to 2 percent overall, which, you know, sort of averages about 1 and a half, maybe 10 percent every time.
Operator
Thank you. Your next question comes from Ronald Camden from Morgan Stanley. Please go ahead.
Hey, just two quick ones. I wanted to dig back in on sort of the acquisition pipeline. I think you said mid-7s cap rate, if I remember that correctly. Maybe could you just talk through are some of these deals are off-market? Are there special situations? And really, how large do you think that pipeline can get to the extent that you get the cost of capital?
Yeah, no, good question. You know, certainly the market is fluid. We have, you know, acquired through, we expect to acquire through Q1, sort of in that seven and a half percent range. You know, we see that, you know, cap rates could come in, you know, a little bit into Q2, but we are a circumstantial buyer. You know, we have seen in the marketplace a little bit of increased institutional interest just generally in net lease, which is kind of setting the tone for the marketplace. And then sort of in the market that we play in, you know, leverage is a little bit easier now for other buyers to obtain. So there's just a tiny bit more competition. But, you know, we play in this very large, very liquid market. There is a lot of opportunity for us to choose. You know, again, we don't, we're not competing with institutions or, you know, other REITs really due to property size. And we have, you know, a very strong pipeline that can build. Remember, we bought about a hundred million dollars of acquisitions during q4 so we can sort of expand and build on that pipeline and then we have these competitive advantages that we've demonstrated which is you know we get to close quickly and then see the outside returns because of that so as a result you know there are circumstances that allow us to achieve higher cap rates especially you know with respect to like the seven brew as an example buying an elevated cap rate because there were issues with an acquisition that others just can't fix. And that's another very big strength for us is that we can come in and make us this buyer of choice in the marketplace where we close quickly all cash with those sort of financing contingencies. And then at the same time, we can, you know, fix problems.
I would agree. One more point there is also that a lot of this, the transactions that we're targeting, if they're below 5 million, 6 million, it's very fragmented in that market where we can play. And there's a lot of opportunities within that market. When you get to larger deal sizes, that's where you see more people step in. But we are dealing with a highly fragmented market where if you're viewed as a buyer that can solve problems and find solutions, you get a lot of opportunities, and that's something that's helpful for the types of assets that we try to get.
Yeah, we've got, you know, just to add on that, deep brokerage relationships, and we see a lot of deals just being that repeat buyer that performs and closes quickly.
That's really helpful. My second question is, you know, we appreciate the disclosures on the traffic count, population, sort of place or AI scores. As you're sort of putting it all together, I think you talked about 50 basis points of bad debt for this year. Is the thinking that through sort of the asset management functions that you've done, like that's sort of the right run rate going forward as you're thinking about the portfolio and the watch list? Thanks.
Yeah. Yeah, I would say so. The portfolio is performing pretty well. 50 basis points is pretty in line with what we've seen historically. And, you know, as we've said, as you heard earlier this morning, you know, we're going to be expecting well over 100% recovery on the current to the smoky bones and then certainly the Twin Peaks. So, yeah, I think that's a good run rate. Also, you know, sort of with respect to the wash list, you know, that is pretty minimal right now. And I don't really see any material changes or adds to the wash list. It seems pretty healthy, pretty quiet. Obviously, you've got a Smoky Bones, you've got a small Go Health. There's a couple of sleep numbers on there and maybe a couple of gas stations. But, you know, all in all, it feels pretty good and pretty small. I know there's some tenants that there's a little bit of noise in the marketplace on today. You know, for example, there's Wendy's. They're in the news. We have five Wendy's and we've got sales on most of them. We've already proactively replacing two of them. So that would take us down to three. Our Wendy's have average rents of about $120,000, and so we feel, you know, that those are pretty good. And, again, the sales volumes show that they're performing well. They're just kind of another tenant that's been into space and people have been talking about it, you know, advanced auto. We have seven of those, represents about 1.3%, 1.4% of ABR. We were proactive with that group as well, extended several of ours into the 10-year mark. our average remaining uh walt on our remaining is about eight years and again we've only got an average rent of 120 122 000 across all of our advance so you know we don't want to take a look at selling those at any discounts and got great basis and great markets and if you know any one of those comes back to us we've got the team in place we've got the experience in place we've got the expertise in place we've demonstrated that already uh that we can you know release and create value for any problem that comes our way onesie twosies or whatever it may be.
Operator
Thank you. Your next question comes from Yana Callan from Bank of America. Please go ahead.
Good morning. This is Dan Pion on for Yana. I wonder if you could provide any color expectations around non-reimbursed property and operating expenses and cash DNA for the year? I know you guys used to guide for that.
Yeah, so that was part of the remarks. We think I think it came a little bit elevated with a 96% margin. There were some taxes that we took related to vacancies earlier in 2025. We think that that number comes down. And so we do believe that the NOI margin is going to increase to about 100 basis points. If you run that through, it's like 450, 500,000 on a quarterly basis in terms of how you should think about that. And if the portfolio continues to do well, it's a big focus area that adds value, but That should come in.
Got it. Thank you. And for my follow-up, could you talk about maybe the potential to do more preferred convertible capital raising in the future?
So what's interesting about the preferred equity has been hugely successful and there's been a lot of interest and inbounds to do more and people have been curious about that. I think that right now our mandate is to deploy it, do well, and I think that the alignment with Maywin has been helpful, and we will continue to execute on the plan. Our plan right now is to pursue that path. It's an option if we wanted it. It would not be the conversion price. It would not be a third. It was a 30% premium at a time. Now it's under 10% premium, so we're pretty close to what it is. We plan to probably just go back to more traditional funding going forward, assuming that our stock price improves as we think it will.
Operator
Thank you. Your next question comes from Daniel Guglielmo from Capital One Securities. Please go ahead.
Hi, everyone. Thank you for taking my questions. In the past, I think you all have mentioned that the elevated renewals over the next few years could be a potential benefit with current rents below market. You probably have a good line of sight into the 2026 renewals. So are you seeing kind of a rent catch up benefit with some of these older vintage leases?
Yeah, good question. The short answer to that is yes. What I'll say is that I think we all know this, but sort of continue to hit it home that we've got extremely good quality real estate, very desirable, spongible, and then ultimately the portfolio was also exceptionally diversified, which, you know, certainly is helpful. You know, from a data standpoint, peer data standpoint, you know, which gets to your point, since 2016, we've had 53 lease expirations. We've had 44 renewing to the same tenant and three renewing to a new tenant. That recovery rate has been about a little over 105%. And so that is an approximately 90% renewal rate. So we do expect that, you know, with any of these leases coming off, that, you know, we'll have those similar historical recoveries, you know, for 26 and 27. And I'd also like to point out, too, that, you know, the leases that are coming out in 26 and 27, you've got some of the top placer scores. So I think we're like about 25 to 30% of top placer scores for those tenants coming up.
And I would just add to that point, It's a great point, but one thing to point out is that as we spend more time working on properties and we lease retenanting, so if you think about what's going on with Twin Peaks and getting a 92% rent increase, that's going to show up later this year. There's, as you work vacant properties and you retenant them, new rents that are coming in higher is a benefit that is on top of the normal worth exploration. That's a little bit unique within a net lease space. A lot of net lease rates just sell properties when they go vacant. By doing this approach, you are creating some tailwinds as we re-tenant those and they come on next year.
Great. Yeah, no, I appreciate that color and it's, I guess, a testament to the quality properties. Just as a follow-up, at REIT World around kind of U.S. consumer health, I think you had mentioned potential for less dollars for older concepts. Have you kind of seen that continue into 2026, or has it generally been healthier than you expected?
I'm sorry. I'm not sure I totally followed the question. So, are you saying that the concept concerns on certain concepts?
Is that the question? yeah i just u.s consumer health i think um just overall kind of less dollars from u.s consumers yeah no listen i i think i think we see that you know throughout the space unfortunately um you know we certainly got a strong stock market and uh but you you do see the the consumer that is struggling a little bit certainly with with inflation and so we want to stick to those concepts. We certainly like the essential. We like the service tenants. And again, I'll just highlight that we're focusing on great real estate, replaceable rents. And the concepts that we have now, you can see all of our concepts throughout the entire portfolio. These are known, strong national, regional brands that apply to a real diverse demographic.
And I point out that even in terms of the dispositions if you think about uh which industries have moved sorry one one other thing just to add on that one question was that that we've actually reduced our casual dining quite a bit this year we still like certain of a casual dining concept like Texas Roadhouse is doing great we have we have a good percentage there but if you think about where we were you know beginning of last year versus today that It also has come down a little bit.
Operator
Your next question comes from Matthew Etner from Young's Trading. Please go ahead.
Thanks for taking the question. You mentioned that most of the optimization of the portfolio has kind of occurred throughout 2025. What are you guys thinking from a gross net investment, net disposition level? I guess, gross for both.
Yeah. Coming into 26, you're right. In 25, we sold off about $80 million, optimized that portfolio. I think certainly it goes without saying that we were certainly not selling off our best assets. We're selling assets that we're strategically selling concepts that we thought that could come under pressure, maybe less optimal concepts. They had lower waltz possibly or just concepts we wanted to reduce exposure to and you know we've uh we've done a lot of that optimization uh throughout the year so i would expect that you know we're we're doing about 80 you know run rate the 30 to 40 million dollar of this position continue to prune that portfolio coming into to 26 and again i think you know hopefully we'll expect that that similar cap rate, but those asset sales throughout 25 were in that upper 6.79, 6.8 cap rate median of a 6.9 against where we're trading today in the low 8, 8.1. So I think it's a pretty good proof-in-the-pudding demonstration of the dislocation, too, of the marketplace. We're not selling any of our Raising Canes. We're not selling our Walmarts. We're not selling our Chipotles or Lowe's, et cetera. So, you know, those are sitting at much, much, much lower cap rates available, you know, in the portfolio.
Right, right. That makes sense. And that's helpful. And then I think you mentioned it a little earlier, you know, if the capital was deployed kind of towards the early half of the year, you know, that'll lead to the high end of guidance. You know, what are you guys expecting in terms of pace of deployment? Obviously, the the $75 million is going to be kind of spread out across the year. But, you know, I guess just what does the first quarter kind of look like to project the first half?
So the first quarter is looking like pretty much in line. Like we have, it's going to be $25 million net, maybe I think it's closer to $35 million of acquisitions with some dispositions behind it. And the second quarter we're building it right now. My expectation in terms of what we're forecasting is it will be close to $25 million net as well. But there are a few deals that we're looking at that could bump it either way. That is a driver, but there's a lot of different drivers in terms of just the portfolio acting well that will help us achieve the high end of that number. Got it.
Awesome. Thank you, guys.
Operator
Thank you. There are no further questions at this time.
I will now turn the call over to steve preston for closing remarks please go ahead great uh yeah thank you everyone uh please uh please be safe uh please be healthy and we look forward to uh seeing you at the city event in uh early march until then thanks ladies and gentlemen this concludes today's conference call Thank you all for your participation.
Operator
You may now disconnect.