Operator
Welcome to the RxO Q2 2025 Earnings Conference Call and Webcast. My name is Ludi and I will be your operator for today's call. Please note that this conference is being recorded. During this call, the company will make certain forward-looking statements within the meaning of federal securities laws, which by their nature involve a number of risks, uncertainties, and other factors that could cause actual results to deeper materially from those in the forward-looking statements. A discussion of factors that could cause actual results to deeper materially is contained in the company's SEC filings as well as in its earnings release. You should refer to a copy of the company's earnings release in the Investor Relations section on the company's website for additional important information regarding forward-legging statements and disclosures and reconciliations of NANDGAAP financial measures that the company uses when discussing its results. I will now turn the call over to Drew Wilkerson. Mr. Wilkerson, you may begin.
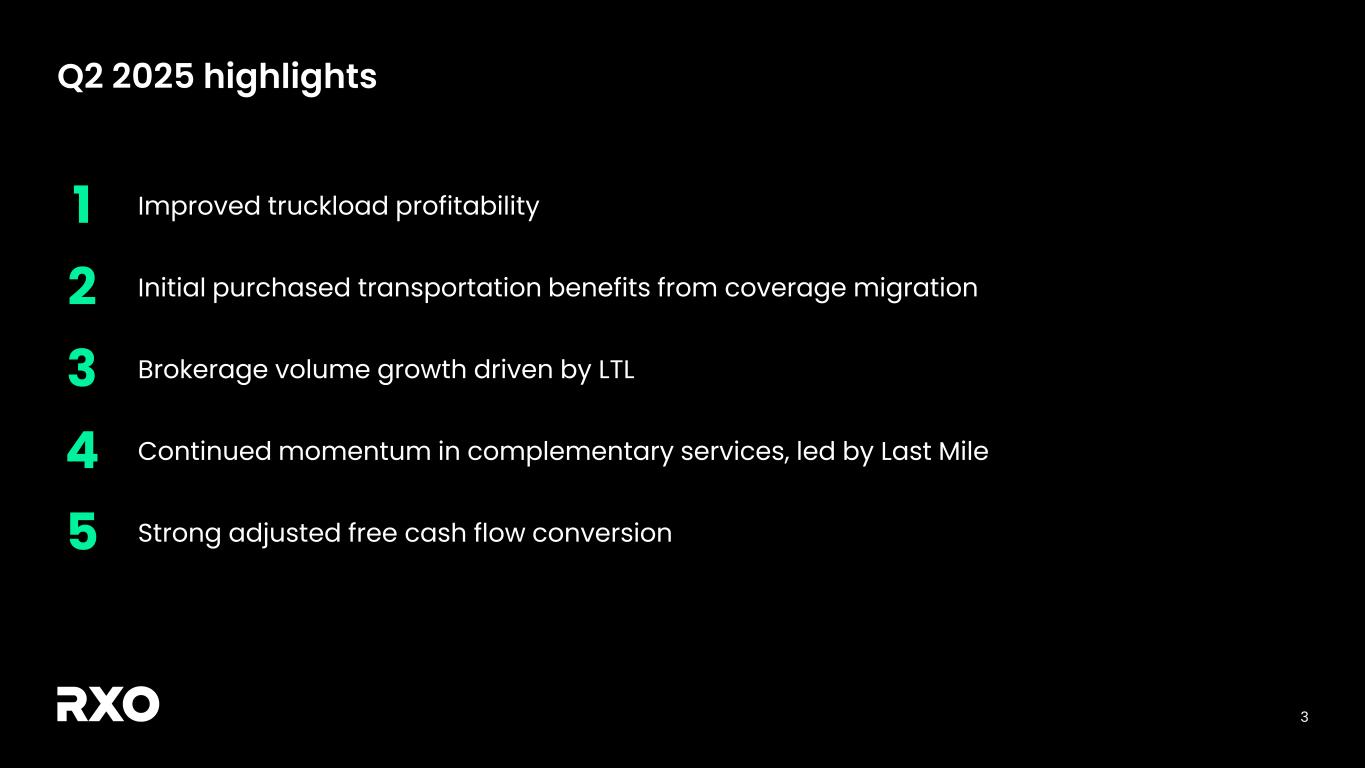
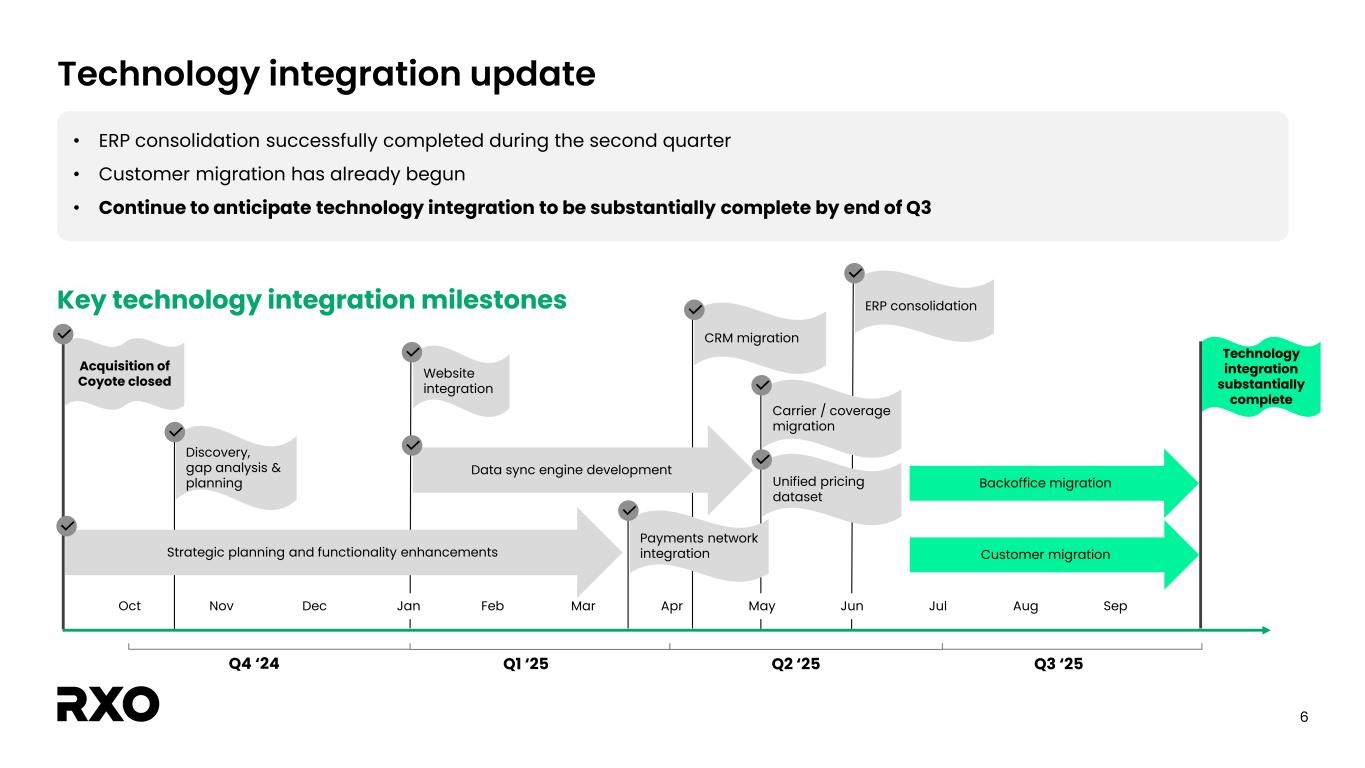
Good morning, everyone. Thank you for joining today. I'm here in Charlotte with RxO's Chief Financial Officer, Jamie Harris, and Chief Strategy Officer, Jared Weisfeld. There are five main points I want to convey this morning. First, we again delivered on our commitments in the quarter and achieved adjusted EBITDA of $38 million at the high end of the guidance range we provided to you last quarter. Second, our brokerage business outperformed the market and grew volume by 1% year-over-year, driven by 45% growth and less than truckload volume. Importantly, truckload gross profit per load improved by 7% sequentially despite tighter market conditions. Third, we're beginning to realize the benefits of having our team on a combined tech platform. We're purchasing transportation more effectively than we did before the integration, but still have a lot of opportunity ahead. Fourth, Last Mile continued its impressive run of year-over-year growth, achieving 17% stop growth, the fourth consecutive quarter of double-digit growth. And lastly, we accomplished all of this while achieving an exceptional adjusted free cash flow conversion of 58% and adding cash to our balance sheet. I'd now like to give you an overview of our results within Brokers, which outperformed despite the prolonged soft freight market. Overall, Brokers' volume grew by 1% year-over-year, outpacing the cash freight index, which contracted by more than 3% in the quarter. Our growth was led by a 45% increase in less than truckload volume. That's an acceleration from last quarter's 26% growth. We continue to win in this area because we make LTL shipping easy for our customers. Over the past few years, we've invested in cutting-edge technology that improves productivity and reduces costs for our team while giving LTL customers complete visibility. We maintain relationships with nearly all the LTL providers in North America, which enables our customers to realize the benefits of scale. Growing our LTL business is a key part of our company's strategy because it provides a stable source of EBITDA with strong margins across market cycles. We still have many opportunities to continue growing our LTL business, and that growth will come from both existing truckload customers and new customers. On the truckload side, volume declined by 12%. The decline was primarily due to automotive weakness and efforts we undertook with customers to optimize price, volume, and service. Brokerage gross margin was 14.4% in the second quarter, above the midpoint of our outlook. And truckload gross profit per load increased by 7% sequentially, despite tighter market conditions. This was the strongest sequential increase in three years, and we expect to improve truckload gross profit per load again in the third quarter. We continue to achieve robust productivity gains in brokerage, driven by enhancements to our tech platform. Productivity over the last 12 months increased by about 18%, and over the last two years by 45%. There's still significant room for improvement. we continue to invest in AI tools that help our people be more productive and enhance the experience for our customers and network of carrier partners. Let's talk about our efforts to procure brokerage capacity more efficiently, leveraging our larger scale. As a reminder, on May 1st, our coverage operations were combined, providing our carrier network with access to significantly more freight and our reps with access to an even larger network of carriers to cover that freight our common platform is enabling us to realize the benefits of our increased scale helping provide the best truck for each load and realize the benefits of our additional power lanes we're already seeing the results and over the last few months we've improved our buy rate favorability by approximately 30 to 50 basis points we remain confident in our ability to drive further improvements and jared will walk you through more details later in the call. Earlier this quarter, we successfully completed the migration of Legacy Coyote's ERP system, which was a huge accomplishment. The last two items remaining in the integration are the completion of the customer migration to RxO's technology platform and the decommissioning of certain back office systems. The customer migration is underway, and we continue to expect that the bulk of our tech integration will be complete by the end of the third quarter. Importantly, our team is already operating as one RXO, working together to ensure the success of our customers and our network of carrier partners. As I travel to the branches around the country, I'm proud of the energy and the dedication that I'm seeing. We set forth an aggressive timeline to complete the integration, and we're ahead thanks to the hard work of our team. In complementary services, our momentum continued in the second quarter. Last mile stops grew by 17% year-over-year, the fourth consecutive quarter of double-digit stop growth. The exceptional service we provide, combined with our massive scale, cutting-edge technology, and financial stability, is enabling us to gain profitable market share. The best-known brands in the big and bulky space continue to rely on RxO for home delivery services. Managed transportation again increased the number of synergy loads it provided to brokers and grew its late-stage sales pipeline sequentially. For the quarter, RxO delivered adjusted EBITDA of $38 million. RxO's company-wide gross margin was 17.8%. Cash performance was a highlight for us in the second quarter. Despite the prolonged soft freight market, we delivered a 58% adjusted free cash flow conversion. We also added cash to our balance sheet. All of this speaks to the long-term free cash flow generation capabilities of the RHO business model. Jamie will discuss cash in more detail later in the call. Overall, the freight market continues to be soft. We did see some tightening throughout the second quarter, but this was driven by capacity and not improved freight demand. As we previously stated, carriers have exited, resulting in a more balanced market overall. On the demand side, though, our customers are still managing through macroeconomic uncertainty. Our effort to procure transportation more effectively, along with our focus on cost discipline, will enable us to outperform typical seasonality in the third quarter. Jared will discuss this in more detail later in the call. Our strategy remains the same. We're focused on driving profitable growth across market cycles while continuing to advance our cutting-edge technology platform. When it comes to growth, we're focused on increasing our scale and expanding the solutions we offer to our customers. We have a great track record when it comes to driving growth. Our total volume in the second quarter, when including the inorganic impact of the Coyote acquisition, is up 275% versus the comparable quarter five years ago. Our long-term organic growth results are likewise impressive. Over the five years prior to the Coyote acquisition, RxO grew total volume by 72% organically and 11% CAGR. In that time period, truckload was up 43% and LTL was up a whopping 851%. More importantly, when you focus on the three years pre-acquisition, which narrows in on the current down cycle, our team was able to grow volume by 21%. Future growth will not only come from our core truckload business, but will also come from premium services that expand our deep customer relationships. We'll continue to advance the businesses that provide us with stable sources of EBITDA during all market conditions, including LTL and managed transportation. We are focused on taking profitable market share over the long term through market cycles. We continue to hear from customers and carriers that our technology is the most advanced and easiest to use in the industry. Each year, we spend more than $100 million on technology. Our tech continues to improve the productivity of our people, enabling them to spend more time with our customers and network of carriers. Our AI and machine learning algorithms are also constantly working to optimize our pricing. You can see the impact of these investments in our margins and our productivity, which has increased by 45% over the last two years. We're doing all of this while remaining disciplined when it comes to costs. The focus is helping us navigate the difficult freight market conditions and will enable us to achieve significant operating leverage once the market improves. RSO is well positioned to deliver increased earnings power and free cash flow over the long term and across market cycles. Now, Jamie will discuss our financial results in more detail.
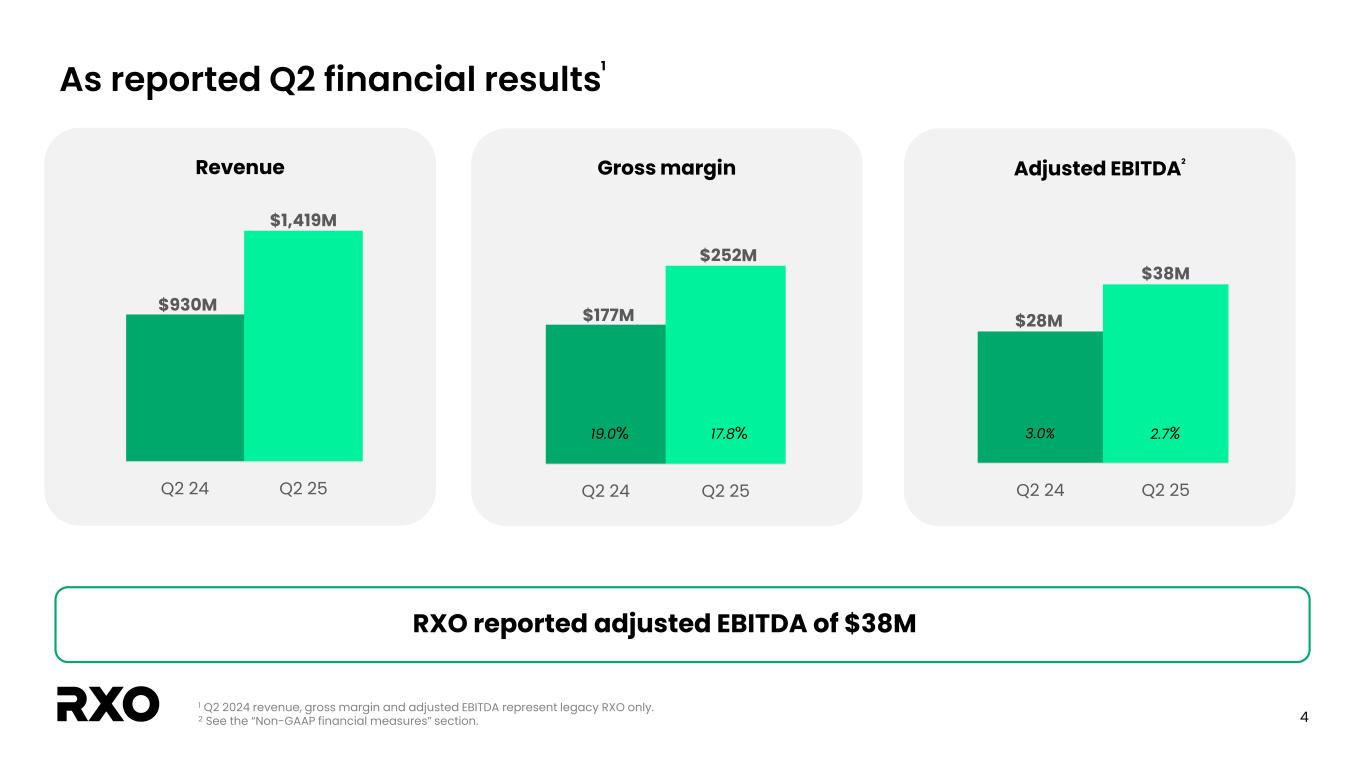
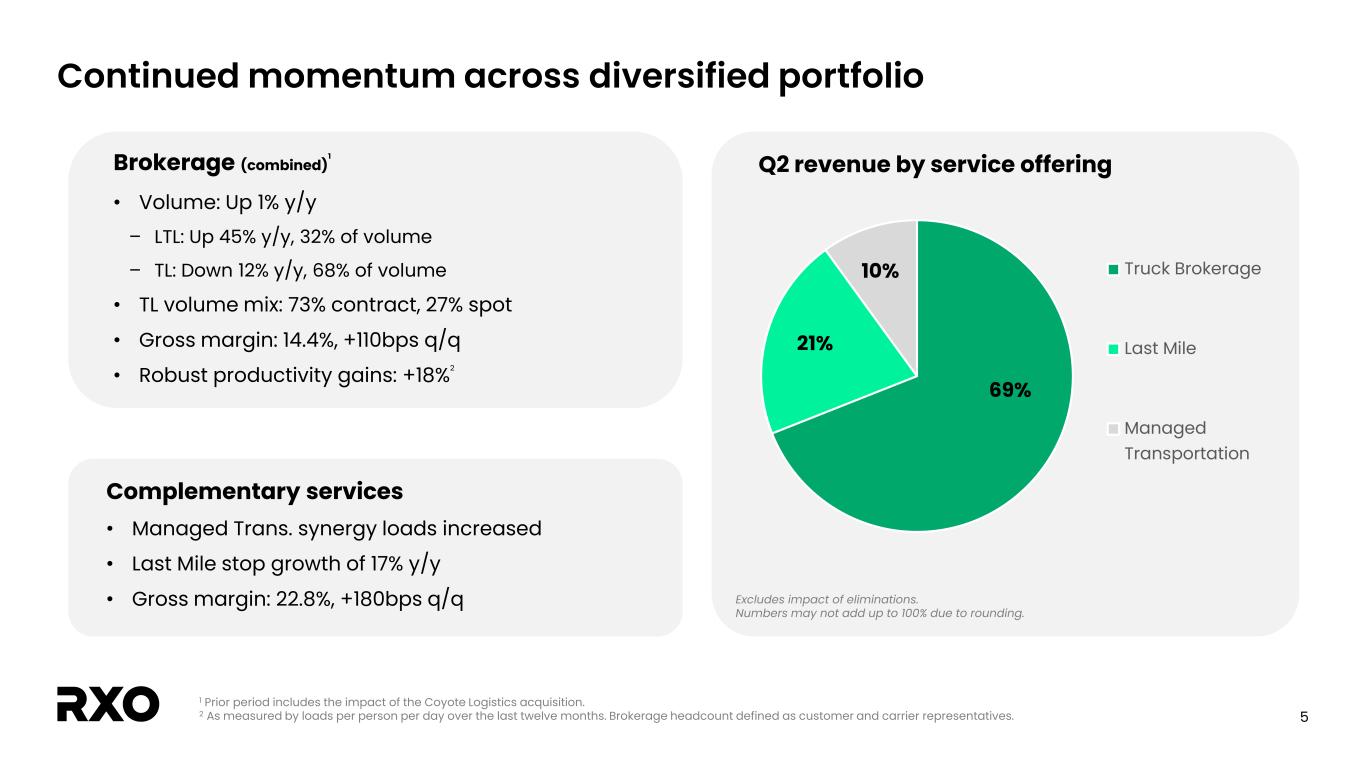
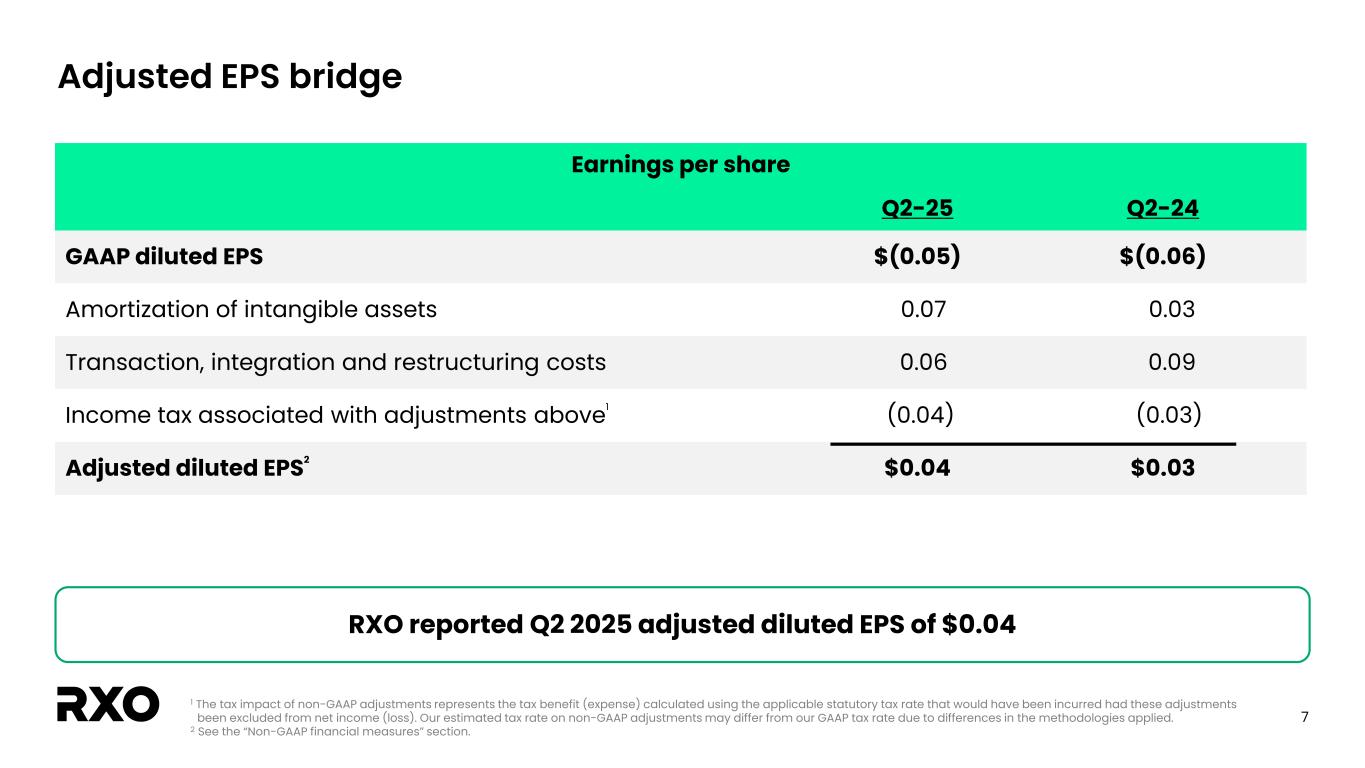
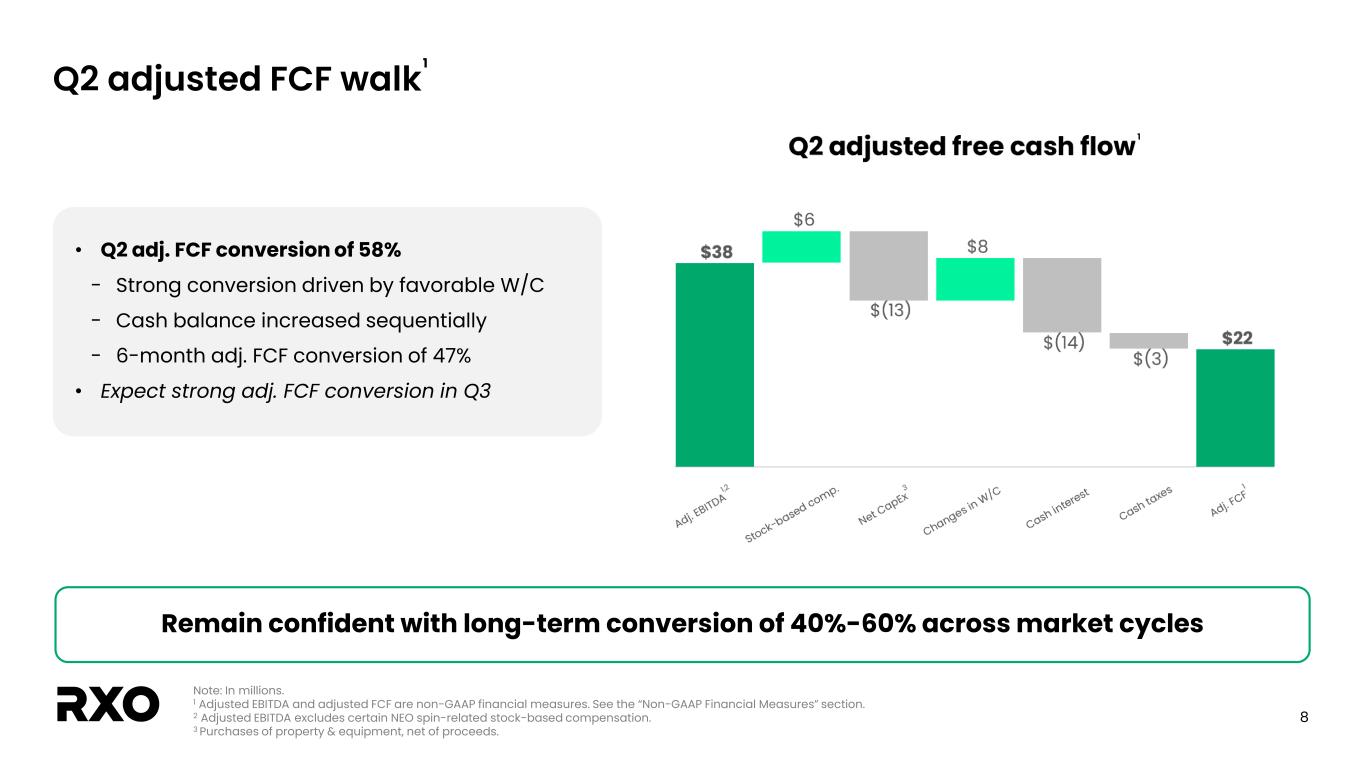
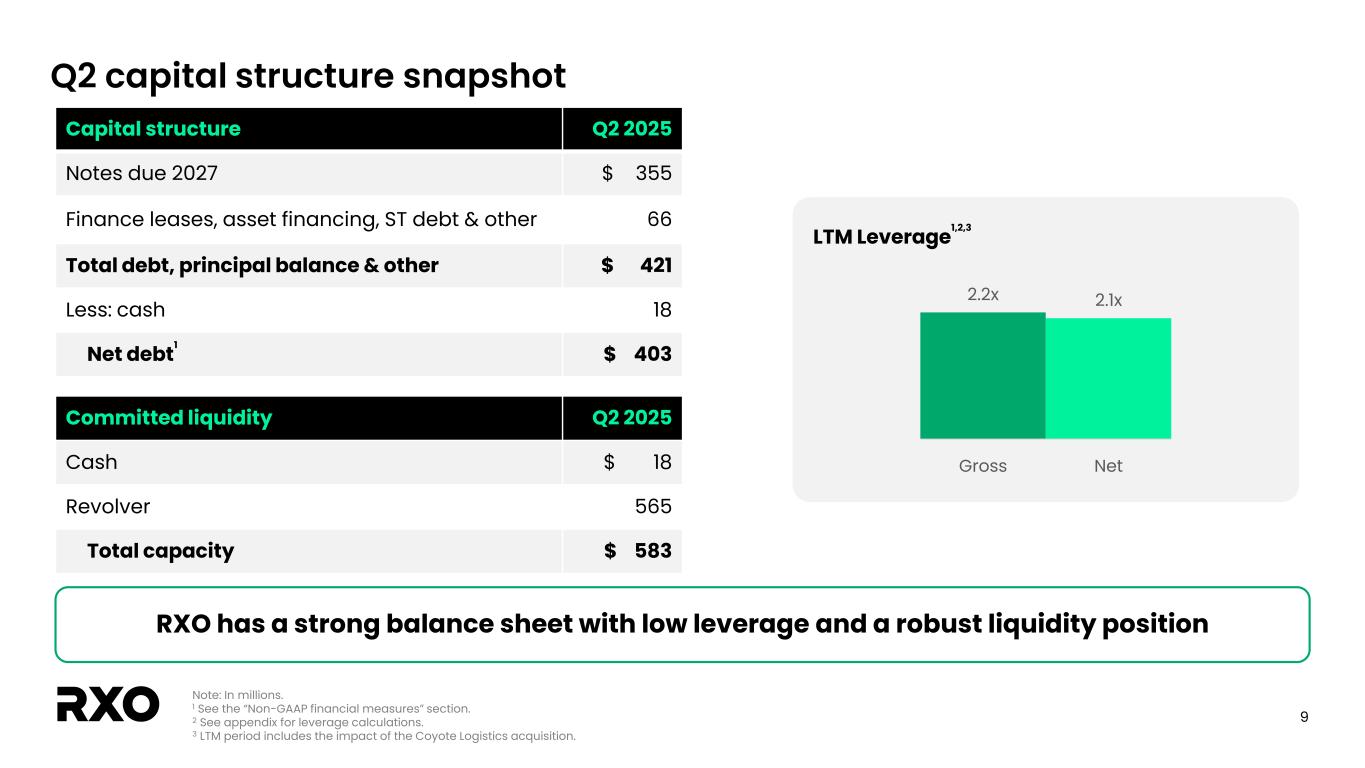
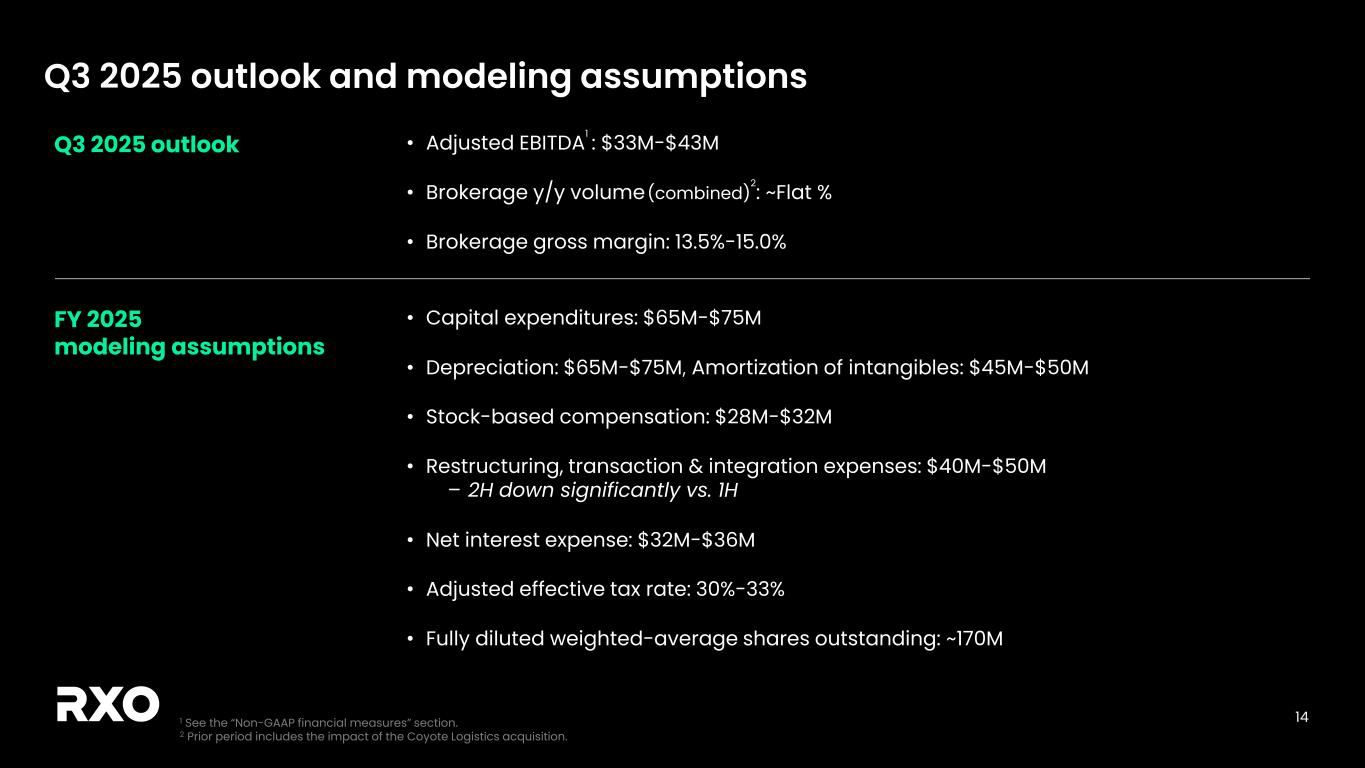
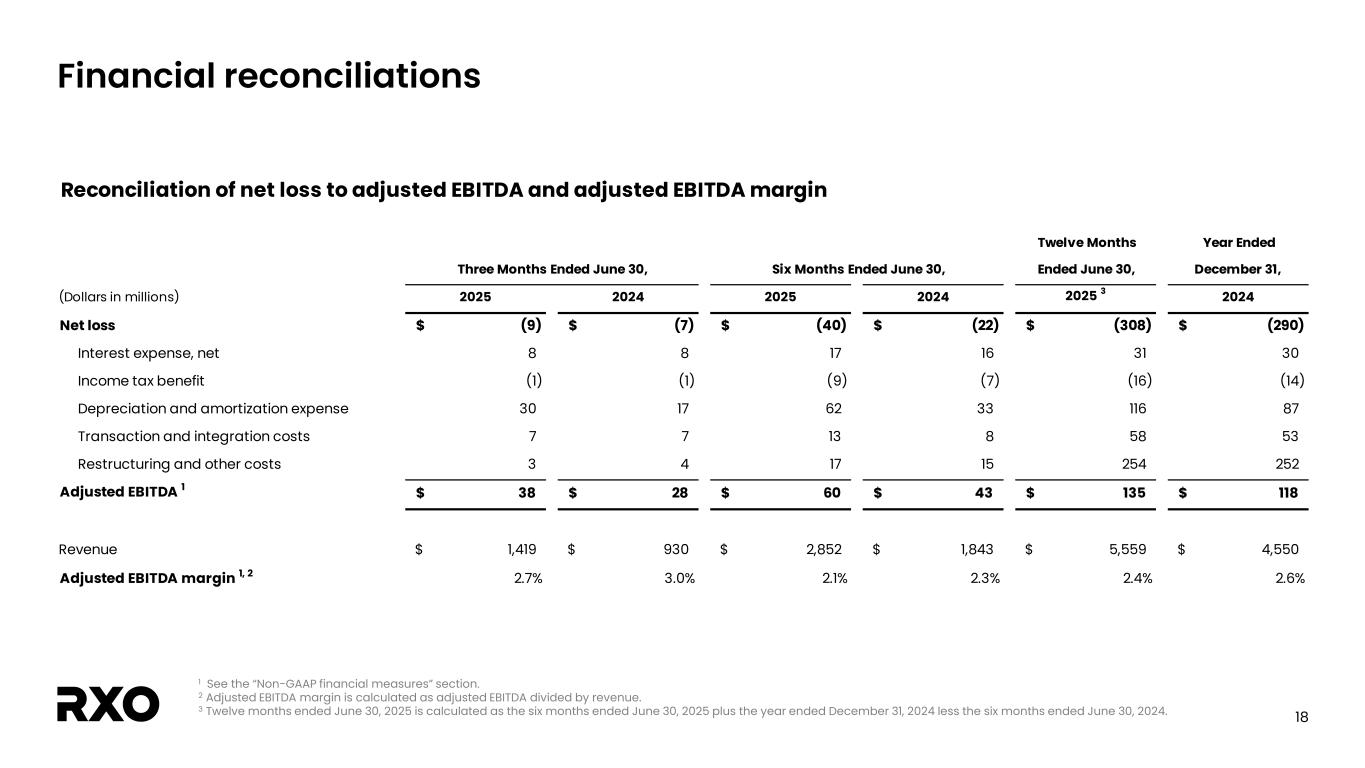
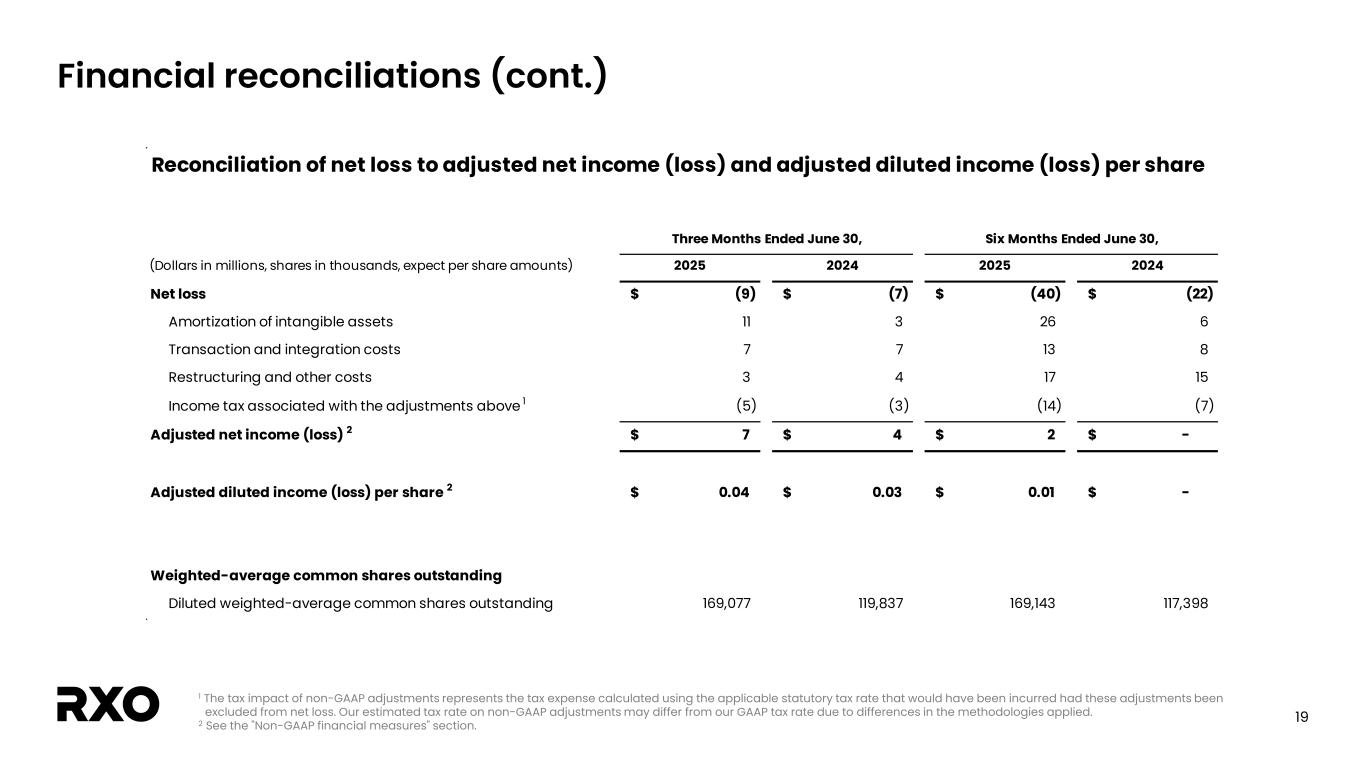
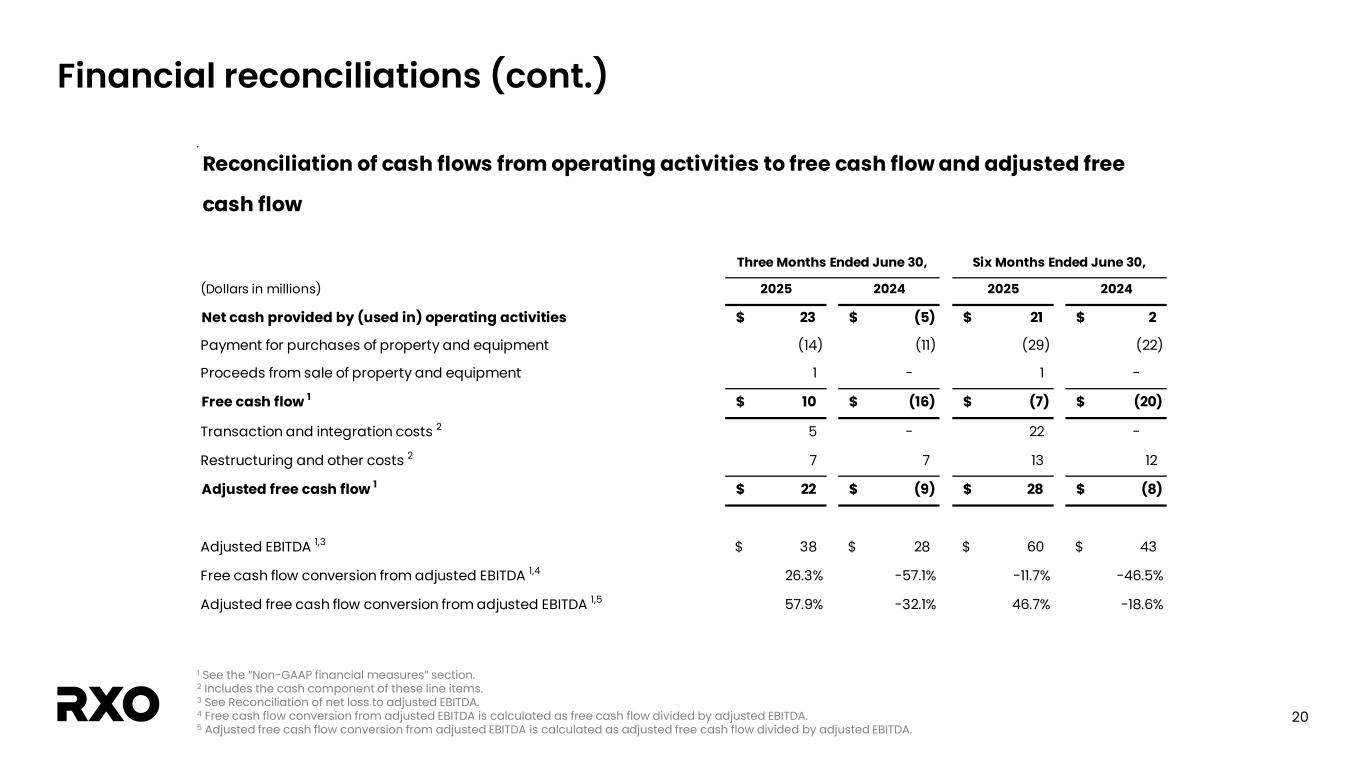
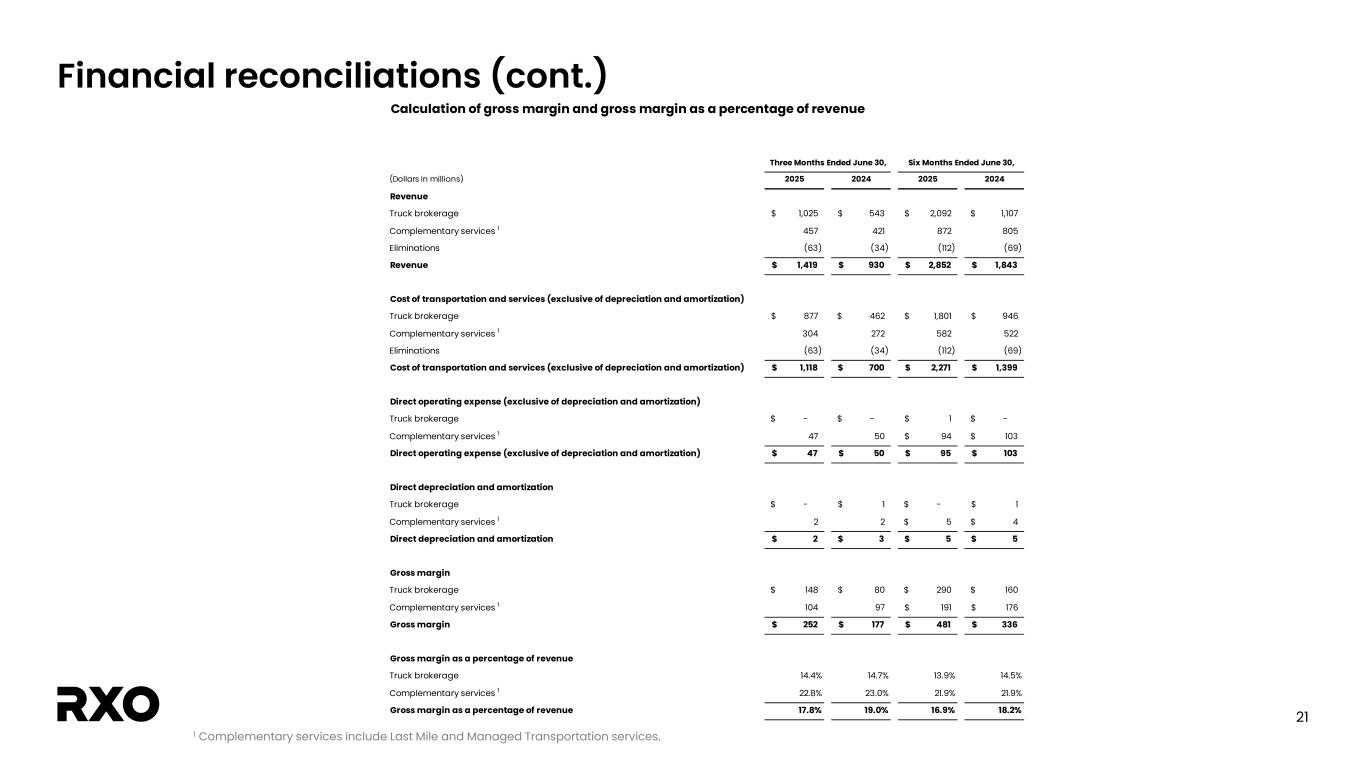
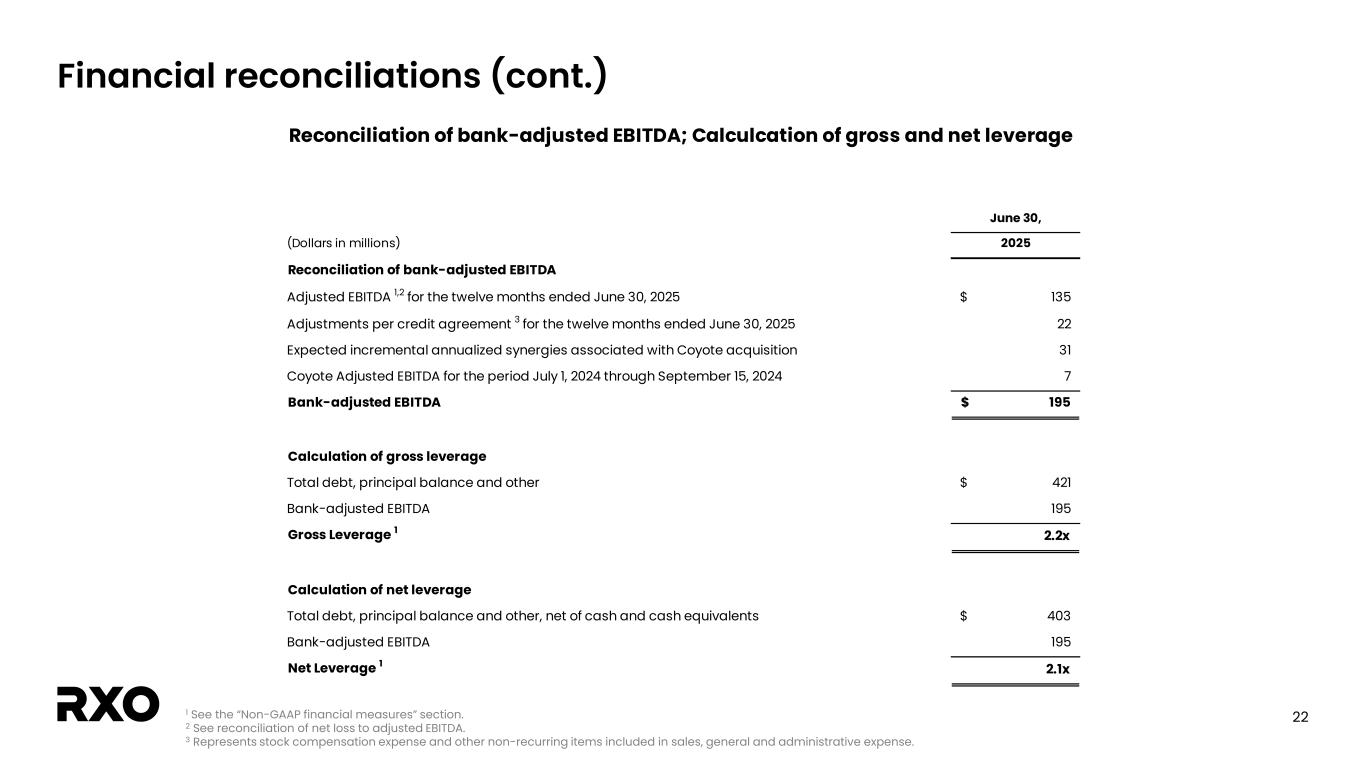
Jamie? Thank you, Drew, and good morning. Let's review our second quarter performance in more detail. Our results were at the high end of the ranges we provided. For the quarter, we delivered $1.4 billion in total revenue, gross margin of 17.8 percent, adjusted EBITDA of $38 million, and adjusted EBITDA margin of 2.7 percent. Sequential adjusted EBITDA growth was driven by improved truckload profitability within brokerage, strong execution and seasonality from last mile, and disciplined cost management. We delivered these improved results despite continued headwinds within the automotive industry. Automotive headwinds increased on both the sequential and year-over-year basis. Specifically, the slowdown in automotive volume represented a company-wide gross profit headwind of more than $10 million year-over-year. Automotive freight, because of its time-critical nature and higher service requirements, typically carries a higher than average gross margin with strong flow through to EBITDA. Below the line, our interest expense was $8 million. For the quarter, our adjusted earnings per share was $0.04. You can find a bridge to adjusted EPS on slide 7 of the earnings presentation. Now, I'd like to give an overview of our performance within our lines of business. Brokers' revenue was $1.025 billion and represented 69% of total revenue. We had strong LTL growth driven by continued customer wins. That growth was all set by a decline in full truckload volume. The decline was primarily due to automotive weakness and efforts we undertook with customers to optimize price, volume, and service. Brokers' gross margin was 14.4%, up 110 basis points sequentially. Gross profit per load for truckload improved by 7% sequentially, which was the largest increase in three years. We achieved this result despite the tighter market conditions in the quarter. We continued to bring down our cost of purchase transportation, and we're also beginning to see early benefits associated with the carrier and coverage migration, which was completed on May 1. Complementary services revenue in a quarter of $457 million increased by 9% year-over-year and was 31% of our total revenue. The gross margin within complementary services remained strong at 22.8%, a sequential increase of 180 basis points. Now let's move to each line of business within complementary services. Managed transportation generated $142 million of revenue in the quarter, down 9% year-over-year. Managed transportation continues to be impacted by lower automotive volume in our managed expedite business. Our last mile business generated $315 million in revenue in the quarter, but 19% year-over-year. Last mile stops grew by 17% as we continue to gain profitable market share within the big and bulky category. This was the fourth consecutive quarter we've grown last mile volume by double digits. Let's now discuss cash. Please refer to slide eight. Adjusted free cash flow in the second quarter was $22 million, yielding a strong 58% conversion from adjusted EBITDA. This puts our year-to-date conversion at 47%. We're especially pleased with our conversion during the quarter, as it included our semi-annual bond interest payment of $13 million. Our results were primarily driven by working capital management. Most impactful, we've harmonized working capital processes across the combined organization, and we believe the majority of these improvements to be permanent. We anticipate strong cash performance again in the third quarter. Longer term, given our asset-like business model, we remain confident in the 40% to 60% conversion across market cycles. We ended the quarter with $18 million of cash on the balance sheet, which increased by $2 million sequentially with no change to the revolver balance. We grew a cash balance despite our $13 million semi-annual bond interest payment and $12 million of restructuring transaction and integration cash outflows. Looking forward, we expect to grow our cash balance again in the third quarter. As you can see on slide 9, our liquidity position continues to be strong with more than $575 million of total committed liquidity at the end of the second quarter. Quarter-end net leverage was 2.1 times trailing 12 months bank-adjusted EBITDA, but slightly we compared to the prior quarter. We continue to have significant capacity to deploy our balance sheet in line with our balanced capital allocation philosophy. Now let's discuss our expectations for the third quarter. We continue to operate in a fluid macroeconomic environment with significant shipper uncertainty, which is reflected in our outlook. For the combined company in the third quarter, we expect to generate between $33 and $43 million of adjusted EBITDA. Sequentially, improved truckload brokerage profitability and disciplined cost management are helping to offset a seasonal decline in last mile. For the third quarter, you should model SG&A down slightly when compared to the second quarter, depreciation expense of approximately 17 to 19 million dollars, amortization expense of approximately 9 to 11 million dollars, and an adjusted effective tax rate of approximately 30 percent. Jared will provide more details on our third quarter outlook shortly. Slide 14 includes our 2025 modeling assumptions. There are a few things I want to highlight. While we're always operating with a continuous improvement mindset, we have completed most of the cost actions associated with the Coyote acquisition. We therefore expect a significant reduction in second half restructuring transaction and integration expenses when compared to the first half of 2025. For 2026, we continue to anticipate a material reduction in capital expenditures and expect next year's CapEx to be between $45 and $55 million. Our business model, combined with our cost discipline, will yield significant operating leverage as the market improves. While the timing of an improvement in the freight market demand remains uncertain, we are hearing some cautious optimism from our customers that clarity on trade policy is bringing incremental business confidence. The integration of CODI is nearly complete, and we are seeing early wins when it comes to procuring transportation more effectively. RxO is well positioned to deliver strong results across market cycles. Now, I'd like to turn it over to our Chief Strategy Officer, Jared Weisfeld, who will talk in more detail about our results and our outlook.
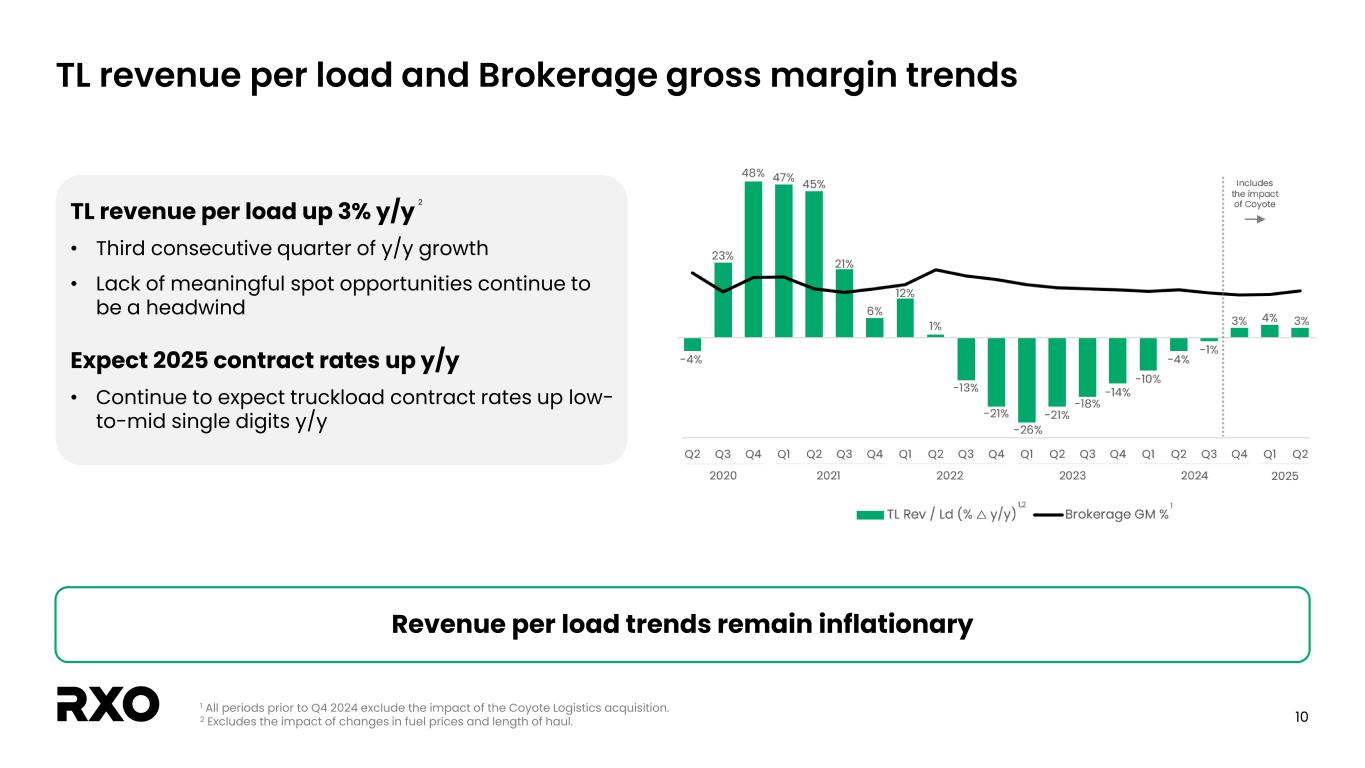
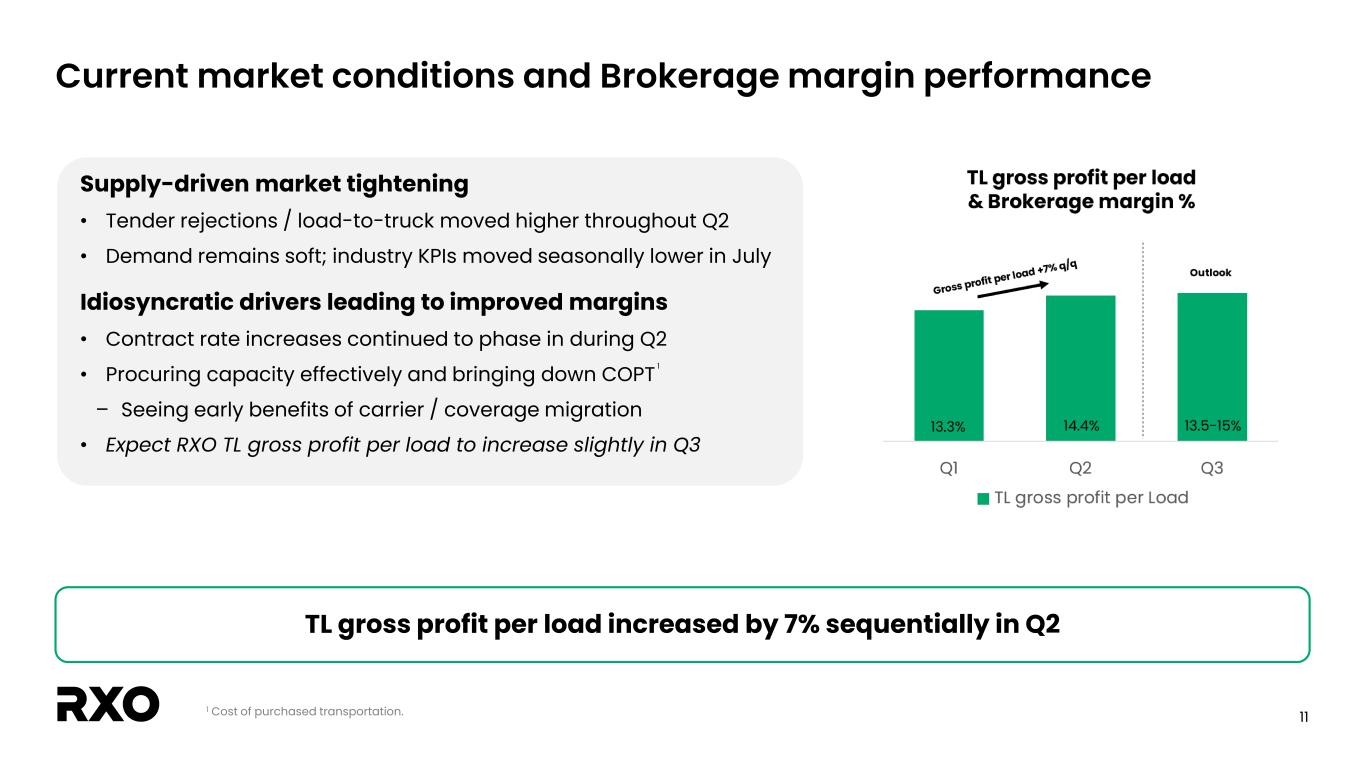
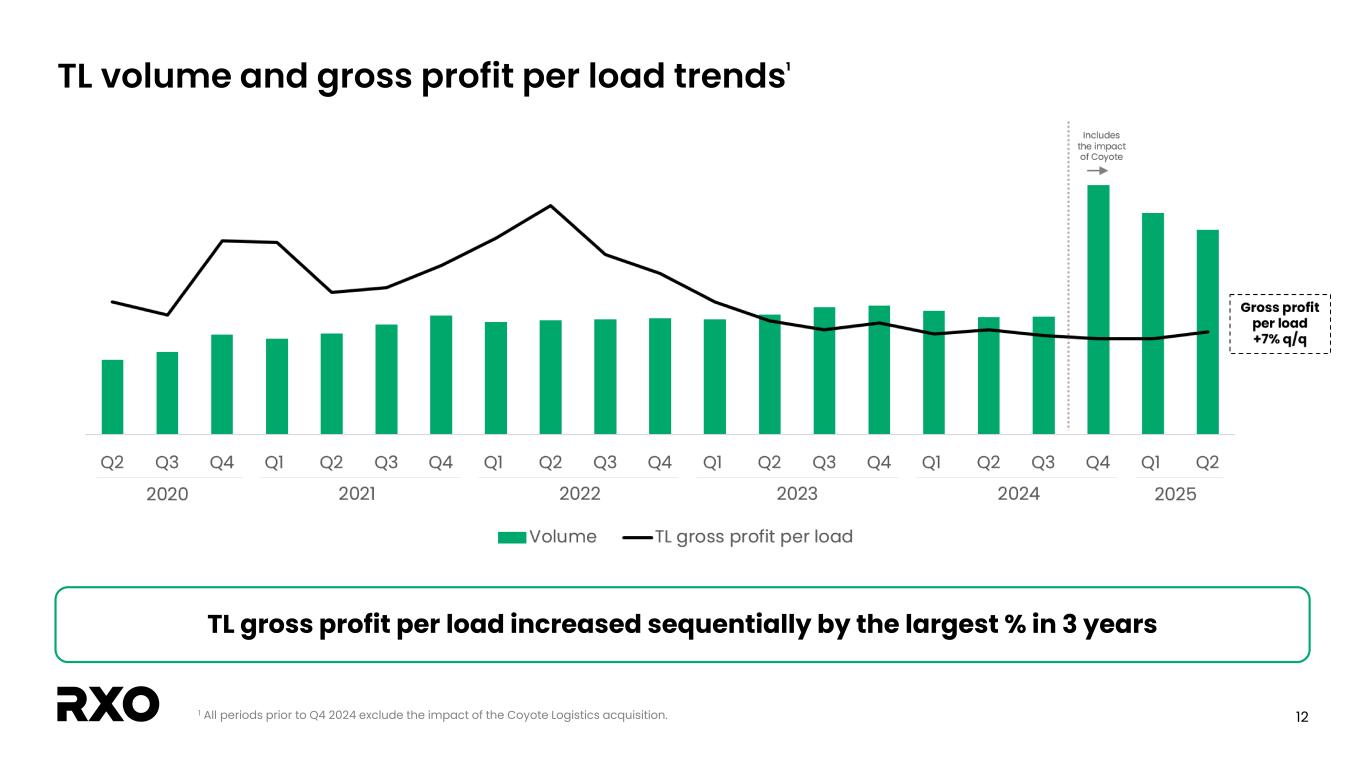
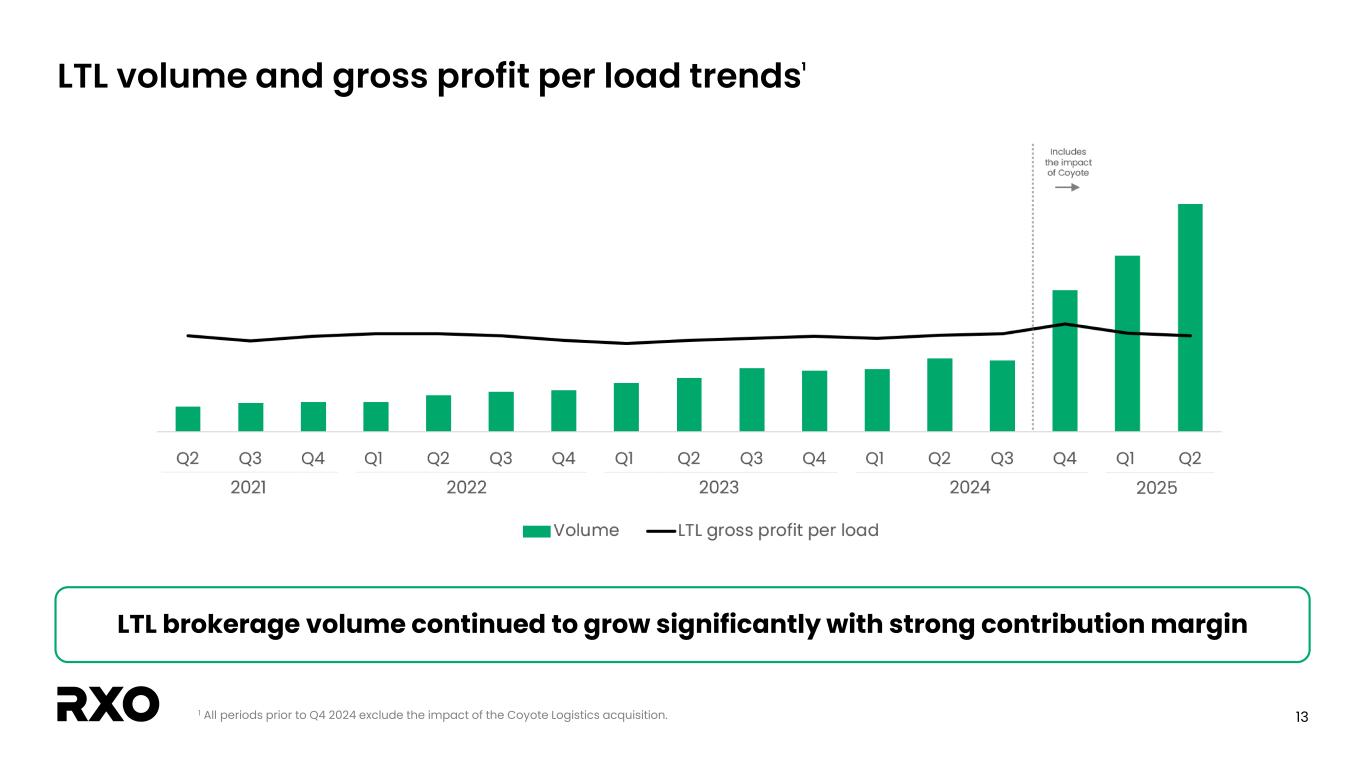
Thanks, Jamie, and good morning, everyone. As I typically do, I'll start with an overview of our brokerage performance in the quarter. To make the comparisons more useful for you, I'll give you combined numbers for our brokerage business, which include Coyote's results in prior periods. Brokerage volume in the quarter was up 1% year-over-year, ahead of our expectations. The better-than-expected performance was driven entirely by LTL strength. LTL volume increased by a strong 45% year-over-year and included the full quarterly contribution from the customer onboardings we shared with you last quarter. LTL represented 32% of brokerage volume in the second quarter, up 1,000 basis points year-over-year and the highest contribution in the company's history. Truckload volume was down 12% year-over-year, primarily driven by automotive weakness and efforts we undertook with customers to optimize price, volume, and service. Combined, those two drivers represented a majority of the year-over-year volume decline. To give you more color, automotive volume was down 28% year-over-year and headwinds increased on both a sequential and year-over-year basis. This accounted for about a quarter of our overall truckload volume decline in the quarter. As a reminder, we service our automotive customers across brokerage and managed transportation. As the largest provider of managed ground expedite services to the automotive industry in North America, RxO is uniquely exposed to the current automotive headwinds. However, we are well positioned for growth when the market recovers. Truckload represented 68% of our brokerage volume. Contract was 73% of our truckload volume, flat sequentially, and up 100 basis points year over year. Spot represented 27% of our truckload volume in the quarter. We continue to operate in a prolonged soft freight environment with minimal spot opportunities. Before reviewing our financial performance and market conditions in more detail, I'd like to talk more about the initial success we've achieved as a result of the combination of RxOs and Coyote's carrier and coverage operations, which was completed on May 1st. We've historically purchased transportation better than the market. We believe that combining RxOs and Coyote's carrier networks would allow us to purchase transportation even more effectively by increasing our network density and reducing deadhead miles. We previously communicated a framework to think about the long-term COPT opportunity. A 100-basis point improvement would translate into an approximately $40 million of cost avoidance or savings, depending on market conditions. The initial results are encouraging. Over the last few months, we have seen buy rate favorability improve incrementally by approximately 30 to 50 basis points. This improvement also occurred during tighter freight market conditions, yielding cost avoidance. As a reminder, buy rate favorability needs to be measured against constantly changing market conditions. We still have a significant opportunity to improve our buy rates as a combined organization. Let's now review our brokerage financial performance and market conditions in more detail. You can find this information on slides 10 through 13 of the presentation, starting with revenue per load on slide 10. In the second quarter, truckload revenue per load trends remained inflationary. Revenue per load, excluding the impact of changes in fuel prices and length of haul, was up 3% year-over-year, but the lack of meaningful spot opportunities continued to be a headwind to revenue per load. Truckload revenue per load also increased year-over-year during the month of July. We continue to expect 2025 contract rates to be up low to mid-single digits year-over-year. Let's move to slide 11 and discuss current market conditions and brokerage margin performance. The market tightened throughout the second quarter, with both industry-wide tender rejections and load-to-truck ratio moving higher. We believe this was driven by continued supply rationalization, not improved demand for freight. Also supporting this view, Class 8 net orders have continued to decline and remain below replacement levels. Carrier unit economics continue to remain challenged in the current environment. Additionally, we saw even more market tightness driven by produce season this year when compared to the last few years, an encouraging sign that the market is responding to seasonality and is more balanced when compared to the last few years. While industry KPIs moved lower into July as they typically do, we are seeing them increase year over year. Despite tightening market conditions as the second quarter progressed, we were able to procure transportation effectively. This resulted in truckload gross profit per load improving by 7% sequentially. We also saw early benefits of the previously discussed carrier and coverage migration. This will help drive another sequential improvement in truckload profitability in the third quarter. Let's go to slide 12 and look at quarterly truckload gross profit per load trends. As I just mentioned, we improved truckload gross profit per load significantly, resulting in a 7% improvement when compared to the first quarter. this is the largest increase in truckload gross profit per load for the combined company since Q2 of 2022. An improvement in truckload gross profit per load yields very strong contribution margins and flow through to EBITDA, typically greater than 60%. Moving to slide 13, RxO's LTL brokerage volume continues to outperform the broader LTL market, contributing stable gross profit per load and strong contribution margins to the business. We have significant opportunities to continue to grow LTL volume with existing and new customers. I'd now like to look forward and give you some more details on our third quarter outlook that JB provided. Starting with brokerage, we expect overall volume to remain approximately flat year-over-year with continued soft truckload volume trends, all set by strong LTL growth. We expect truckload gross profit per load to be up slightly in the third quarter, significantly outpacing recent seasonality. We anticipate that brokerage gross margin will be between 13.5% and 15%. Let's now talk about complementary services. In managed transportation, while the business has significant sales momentum and an expanded pipeline, managed expedite automotive headwinds continue to impact us in the near term. In last mile, we expect another quarter of year-over-year stop growth, although at a slower rate when compared to the second quarter. As a reminder, The third quarter is seasonally weaker for last mile when compared to the second quarter. And we also expect last mile stop growth to decelerate into the back half of the year due to tougher comparisons as we lap last year's new business wins. Putting it all together, we expect RxO's third quarter adjusted EBITDA to be in the range of $33 and $43 million. We thought it would be helpful to give you some historical trends for the combined company. Over the last few years, on average, third quarter adjusted EBITDA is typically down anywhere between 15 and 30 percent sequentially primarily driven by last mile seasonality. We expect to perform better than this with improvement in truckload brokerage profitability and lower expenses offsetting a sequential decline in last mile. Similar to last quarter, we thought it would also be helpful to share the brokerage volume assumptions underlying our third quarter outlook. Truckload volume is typically higher in September when compared to the seasonally slow month of July. The midpoint of our outlook does not embed any above seasonal volume growth from July. The high end of our adjusted EBITDA outlook assumes volume growth from July to September modestly above our three-year average, while the low end assumes volume growth modestly below our three-year average. To close, while we continue to operate in a fluid environment, we've entered the third quarter and upcoming bid season with momentum. Truckload brokerage profitability has significantly improved. We are gaining profitable market share within LTL. With carrier and coverage migration complete, we're seeing early wins on procuring transportation more effectively. Productivity gains fueled by our investments in technology are accelerating. Our technology integration will be substantially complete this quarter. Managed transportation continues to increase synergy loads to brokerage with an expanded sales pipeline, and we continue to gain market share within last mile. We remain focused on driving profitable growth and leveraging our cutting-edge technology, both of which position the company for significant long-term earnings and free cash flow growth. With that, I'll turn it over to the operator for Q&A.
Operator
Thank you. And ladies and gentlemen, we will now begin the question and answer session. To ask a question, you may press a star followed by the number one on your telephone keypad. If you're using a speakerphone, please pick up your handset before pressing any keys. If we draw your question, please press the store too. With that, our first question comes from the line of Tom Wadowitz with UBS. Please go ahead.
Yeah, great. Good morning. Wanted to ask Drew on one of the comments you made in kind of talking about the truckload volumes and the weakness. So the auto makes sense. you have more leverage to that. You mentioned the optimizing price, volume, and service, I think is kind of the language you use. So to me, that sounds like, you know, kind of quality of the book that you're working on improving that. I don't know if that's the right way to view it. And how much of this is kind of related to Coyote that, you know, you'd say maybe, well, you know, the mix of what we had needed some of this improvement. I guess I'm just a little more color behind that. And how long does this process last in terms of working on the, you know, price volume service component, just so we can think about, you know, kind of the forward impact on volume. Thank you.
Yeah, thanks, Tom. You know, first, when you look at the volume, you highlighted the first piece on automotive. Automotive was roughly a quarter of the 12% of why volume was down on a year-over-year basis. And a bigger piece of it was exactly what we talked about. We worked with the customers, And it wasn't an overarching strategy of, you know, hey, we're just going out there and taking price from customers. We're working with the customers one by one on what's the right strategy for them, looking at the power lanes that we've got across the country, where we have the strongest amount of capacity, where we provide the best value to their overall transportation network. So we were able to improve gross profit per load 7% sequentially, the biggest increase that we've had in three years. And price was obviously a piece of that. Your customers even come to us, and they want to make sure that we can service their business profitably. And so there was some business that we did lose and walk away from. Some of that we think we've got good opportunity to move back. You know well, Tom, that bid season typically happens in Q4 and Q1, and it's implemented throughout Q2. So that's largely behind us, and that's what gives us confidence when you start to look at sequentially on Q3, you know, it's going to be roughly flat. It could be up a little bit, could be down a little bit. One last point I want to make is just on the customer base and the retention of the customer And when you look at our top customers, take our top 100, for example, you know, from pre-acquisition, we're still with 99 of them and we're still at 99 of them at size.
So what we want to make sure that we're doing is that we know that we're in a soft rate We want to make sure that we're relevant and that we're providing enough value that we are the call whenever the market starts to turn that we we receive those spots projects in mini bids right okay that that makes sense and and focusing on on quality the book or improvement you know that seven percent improvement in gross profit per load is uh obviously a constructive move how how do you long do you think this uh this you know kind of focus on quality would affect the volume though you think you know like three q four q you know will you be still talking about this in 1Q next year just trying to think about the duration of that impact to the uh
the truckload volume year over year yeah i think when you look at year over year for q3 you're probably talking about similar numbers for what we put up for q2 but i think the important piece is where you look at where you're going sequentially and you know like i said that's going to be roughly flat so bid season is behind us bid season is implemented and we're already working on next bid season i spent time over the last couple weeks with some of our top customers working on what the strategy is for 2026.
Okay. And is it related to Coyote or this is just kind of broader look across the combined book?
We stay in a continual set of improvement as a company. That's something that we've done from day one as a company. We did talk about at the time of acquisition that we felt like we had the opportunity to improve gross profit per load profitability for the overall Coyote book, but that's not exclusive to them. We're operating as one company, and it's all RxO now.
Okay. Thank you for the time.
Operator
Thank you. And your next question comes from the line of Ken Huckster with Bank of America. Please go ahead.
Hey, great. Good morning. Drew, can you talk about the margin characteristics or maybe the operating differences in getting such strong LTL growth compared to truckload? How should we think about the impact on the business there?
Yeah, so when you look at the LTL piece, it starts with the relationships that we have on the truckload side, Ken. These are customers who have been with us for a really long time, and they're large customers, and they come to us and, you know, they say LTL is a small piece of our overall transportation spend, and I'm working with a few of the national players, but I'm having to go into different platforms, and I'm having to look for claims, lost shipments, damages, all of those things, and they're familiar with our technology rxo connect and so they come in and they say if we can put everything on rxo connect and now we can start capitalizing on some of the capacity from the regional players as well this can be something that gives us best better visibility and you know for us ltl is going to be a part of our growth story for a long time we're just getting started i'm sure you remember at the time of spin you know ltl made up only 10 of our overall volume it's now over 30. yeah i want that volume to get up over 50 percent we know the stability that that adds to margins if you look at what comes out in the deck gross profit per load and that is relatively stable it doesn't move a whole lot it doesn't have the volatility that truckload does so it's good stable ebitda for us as a book of business um and then just to follow up right so given the the integration the merger can you talk about the the synergy details where where are we now uh jared you kind of threw in the potential cost savings, I guess, 30 to 50 basis points on your buying.
Can you talk about what's left? How should we see that scale going forward? Thanks.
Hey, Ken. This is Jamie. On the synergies, we're still on track with the $70 million we talked about last quarter. In terms of realization, let's call it annualized $50 million of the $60 million of OPEX has flown through the P&L from a realization standpoint in Q2. You know, small amount moving into Q3, but as you head into Q1 of next year, that last $10 million of annualized synergy because of the completing the tech integration will be complete.
We should see, you know, two and a half million dollars per quarter flow through the P&L beginning in Q1 of 26 and then that last 10 million of synergies that we talked about which is capex spend this year you should see that be removed from capex span going into 26. and then on hey can it's darred on on purchase transportation you know that was part of the original investment thesis as it relates to the coyote acquisition combining these two organizations you know approximately last year four billion dollars of cost to purchase transportation how do we as an organization procure capacity more effectively. Carrier migration was completed on May 1st, and in just a few months, we've seen significant improvement in our ability to buy relative to the market. We've increased already buy rate favorability incrementally by about 30 to 50 basis points in a period where rates were inflationary, so that yielded significant cost avoidance. When we think about that historical framework that we provided, approximately 100 basis points of incremental improvement relative to buy rate favorability, we feel very confident in that.
Thanks for the time, guys.
Operator
And your next question comes from the line of Stephanie Moore with Jeffrey East. Please go ahead.
Good morning. So hoping you could touch a little bit about what your underlying freight market assumptions are for the third quarter, you know, in particular, maybe your outlook for the automotive sector, just given the impact you've seen so far in the first half of the year, and then as well, any benefits from PT savings and the integrated platform and that contribution to third quarter expectations. Thank you.
Hey, Stephanie, it's Jared. When you think about the underlying assumptions from Q2 to Q3 that's embedded in our outlook, we are continuing to assume that we're operating within a soft freight market. So, you know, limited spot opportunities. July, as you know, is the seasonally, one of the seasonally slowest months of the year. And when you think about automotive as it relates to our business, as Drew mentioned earlier, it was down 28% year over year with headwinds increasing both sequentially end year-over-year into the second quarter, embedded within our third-quarter outlook assumes continued automotive headwinds. We're the largest provider of ground expedite services in North America, so when the market does recover, we will have strong incremental contribution margins in excess of 70% to 80% when the market does recover, so we're positioned very well. As it relates to PT synergies, absolutely, we have embedded continued improvement as it relates to our ability to buy. And just to give you a little bit more flavor in terms of from Q2 to Q3, typically, brokerage gross margin is down sequentially. And typically, gross profit per load is down significantly sequentially. So, we're outpacing historical seasonality over the last few years by a pretty wide margin embedded within our Q3 outlook, in part due to how well we are procuring transportation.
Thank you. That's helpful. And then, you know, I guess as we think about normal seasonality, 3Q to 4Q, and if we kind of layer in what you just outlined, synergies, you know, PT optimization, the like, maybe you could talk a little bit about your confidence and the ability to continue to outperform seasonality if this environment, overall free environment, you know, continues to be weak. Thanks.
From Q3 to Q4, historically, the combined business is up sequentially, but would caution you that the variability is pretty significant. If you look at over the last few years, there's been a quarter where, you know, we've been down sequentially, and there's been a quarter where we've been up 100% sequentially. So, it really does depend on how peak season shapes up what um whether or not the consumer shows shows up and what consumer demand looks like but we do expect q4 to be up sequentially relative to q3 in the context of you know continued improvements we're making in the business with truckload profitability combined with how well we are procuring transportation that should remain to be a tailwinds uh into q4 thanks everybody thank you and your next question comes from the line of chris witherby with wells Fargo, please go ahead.
Hey, thanks. Good morning, guys. Drew, you were talking about the work you're doing with the customer base on the truckload side, and that's certainly a piece of the year of year declines in volume that we saw in the second quarter. I think a quarter came from the auto business. How much of the three quarters that was left, I guess, came from sort of this customer exercise, and where are you with that process? I guess, in other words, should we expect to see, you know, a multi-quarter effort to kind of get the book of business, the portfolio in the right place from a profitability perspective? How much more kind of runway do you have on that?
Yeah, you know, thanks for the question, Chris. It's largely done because bid season was Q4, Q1, and it was implemented in Q2. So, you know, we've said before, we stay in a continual state of improvement. So it's something that we're always working on, and it's something that we're always having conversations with our customers. I don't know of an organization that could be in front of customers more than what we are. And so it's making sure that we're working through it thoughtfully, strategically, and we're adding value for the customers and what we're doing. But when you look at bid season, it's largely done and we're off and running. And that's why when you look at Q3, volumes will be roughly flat. Could be up a little bit, could be down a little bit, but roughly flat from Q2 to Q3 overall. Okay.
That's helpful. And then when you think about peak season, maybe if we could zoom out a little bit and get a sense, I guess there's been some discussion of a pull forward and maybe what we're seeing in July and August is potentially the peak and fourth quarter could be a little bit weaker as a result. If you could sort of offer some thoughts on what you're hearing from your customer base about how busy or not you're going to be as we move through the rest of the year.
Yeah, we're hearing different things from different customers, and I don't know that there's a consistent message. It's still too early to call what will happen for peak season. We saw some customers pull volume forward. We saw some customers hold volume, and that's hitting now as there starts to be a little bit more clarity on tariffs and where that's landing. So, yeah, I think that it's still too early to call what happens on peak season. Right now, off of what we see, we're confident in our ability to be able to grow EBITDA from Q3 to Q4, but it's too early to call what happens on peak season at this point.
And just if I could sneak in, just sort of follow up on that, you know, UPS has got some volume dynamics that they're working through as we go through the rest of the year. How does that influence that sort of outlook for the fourth quarter, if it does at all?
UPS is obviously a peak season customer. We talked about at the time of acquisition of Coyote, we went through a great peak season of giving them phenomenal service. Last year, we've got a very strong relationship there, one that we look to continue to build on. Our job is to be able to go in there and service them as they experience peak season. I think it's still too early to call what happens with peak season for them or for anyone else. But, you know, happy with where the partnership is. And, you know, Chris, if you'll remember, there was volume commitments that came in with the time acquisition. And, you know, right now we're hitting those volume commitments.
Appreciate the time. Thank you. Thank you.
Operator
And your next question comes from the line of Daniel Inborough with Stevens Inc. Please go ahead.
Hey, good morning, guys. Thanks for taking our questions. Thank you. maybe i'll i'll start on the final mile piece and you know continues to grow stops i think high teens is any of that due to inorganic growth or is that all organic and i guess if it is organic you know why do you think you're gaining share in that market how should we think about that growth into the back half of the year uh just from an absolute growth standpoint it's all organic 100 organic we haven't done a last mile acquisition in many many years and so when you think about it It is all organic, and it starts with our relationships with our existing customers.
So when you think about customers who are working with multiple last mile providers, what we've seen over the last couple of years is they've started to reduce the number of carriers that they're working with. So this isn't necessarily a market share pickup in the certain markets what we're operating in. What it means is if we're operating in the southeast market for a customer today, and they look to go with one of their current providers that they have strong strategic relationships within another market, we're winning a lot of those markets with multiple existing customers right now. The other piece is off of the Coyote acquisition, there was some large customers that came over from Coyote that were not doing last mile business with us, that started doing last mile business with us very early on after the acquisition. So the cross-sell from the acquisition is paying off.
And then we've got an outside sales team that is always working the pipeline and so we brought on some new customers in last mile as well great and then jared maybe focusing a little more on the third quarter you gave some helpful sequential seasonality comments to stephanie but maybe stepping back we just walked through the five million dollar year-over-year increase in ebitda for the third quarter because i mean you bought coyote brokerage volume is flat i think jamie mentioned 50 million of synergies are in the pnl now truck workers profits like up i'm trying to think what are the offsets as to why maybe on a year-over-year basis that EBITDA increase isn't maybe larger in the third quarter.
Yeah, the biggest delta there, Daniel, is going to be automotive. When you think about the headwinds that we had in the automotive business in the second quarter, automotive volumes were down 28% in our brokerage business. Overall, company-wide gross profit dollars were actually down more year-over-year in the second quarter relative to the first quarter. I think Jamie said in his prepared remarks more than $10 million. We expect those headwinds to persist again into the third quarter. So that's definitely part of the bridge. The other thing to consider also is that we still have continued synergies that will get rolled out that are not yet fully reflected in the P&L as you think about 2026 with the decommissioning of Bazooka as we finish the tech integration. So that'll be another $10 million year over year, which will come in the P&L in 2026. And those are going to be the two biggest drivers when you think about the year over Great.
Operator
And your next question comes from the line of Ravi Shankar with Morgan Stanley. Please go ahead.
Great. Morning, Jeff. So I was surprised to hear you guys. You say that your customers are cautiously optimistic on the environment. Given some of the tariff lines are not taken off. Are you saying that a settled tariff is what your customers need to unlock the demand that they create in here rather than the actual tariff level? or just kind of what we might expect into the broad economy that's going to do now?
Ravi, we got about a quarter of what you said, so I'm not sure if it's our line or yours, but I'm going to take a stab at what I think you said, and if I didn't answer your question, then we can take it in a follow-up. What we're talking about with our customers right now is having clarity on what's going on. When you look at what happened on Liberation Day, you had customers who had already pulled things forward, you had customers who had not, you had customers who slowed down on some of what they're shipping, some who stopped completely during that time and when you start to look at more clarity that has come on some of the tariffs people have better visibility of how to do planning there was a lot of chaos early on right around liberation day of what should we do and plans were changing every single day as we work with our customers on how they were going to pull inventory into the u.s and now there's more clarity on on that so i think that that's the optimism that jamie was referencing so if that did not answer your question we'll give you a chance to ask it again That's a decent shot.
I apologize. Hope we can hear me better now. Maybe as a follow-up, how much of a magic wand is AI for what you guys are doing? And is there a natural feeling of productivity in terms of transactions per employee? And also, where are you on the path to getting there and how do you get there?
Hey, Robbie, it's Jared. When you think about how we're leveraging artificial intelligence in the business you know this is something we've been doing for a long time you know 10 years plus i'd say specifically we've been we use ai and machine learning on our pricing algorithms uh pretty significantly as the algorithms continue to learn from each other and when you think about the combination of uh rxo plus coyote having that larger data set uh combined with the operating history of coyote we think increases the power of our pricing algorithms i would say secondly to your point when you think about productivity and our ability to go ahead and think about margin expansion from the operating margin line driven by artificial intelligence and what that means to productivity. Over the last two years, productivity is up 45% in terms of loads per person per day. Think about everyone in the organization that's involved with touching a load and what that looks like relative to two years ago. That growth rate actually accelerated versus prior quarter was about 40%. So, So having the ability to go ahead and drive incremental volume in the network with a growth rate that is nonlinear relative to the headcount growth driving that significant operating margin, we think that we are still in the very early innings with significant expansion opportunities ahead.
Ravi, one thing that I would add, I agree with everything that Jared said on being on the early innings of AI, and it will continue to help us with employees, with customers, and with the network of peers we partner with. The other thing is we're a company that wants to stay staffed for growth for the long term through a market cycle. And so we probably do carry some headcount right now knowing of what we can do in the upside of a market. And so that's something that we still operate in a people business that is built off of relationships. That's how we were able to go in and have so many of these conversations, deep conversations, strategic conversations about adding value to our customers. But we're staffed for growth right now. Make no mistake about it.
Sorry about the phone issues.
Operator
All right. Thank you. And your next question comes from the line of Scott Group with Wolf Research. Please go ahead.
Hey, thanks. Good morning. A couple of things. As the LTL volume growth is really accelerating, the gross profit per load has moderated a little bit the last couple of quarters. Just wondering if you have any color there. And then why do you think you're having such outsized declines in auto volume? them.
Yeah, Scott, this is where I'll take that. I don't think you can walk outside of your office in New York and buy a Snickers bar for how little gross profit per load is down whenever you look at it sequentially. That's the beauty of the LTL business. When you look at that chart, it is very, very stable on what it does. Now, when you look at length of haul on some of the business that we have onboarded, it is a lower length of haul. So that means your revenue per load comes down. And therefore, the gross profit per load is a little bit lower on those. but it's still a good margin percentage, it's highly automated, and it's accretive. And on the automotive, I would disagree with the premise of your question. When you look at automotive, we're the largest manager of ground expedite shipments. So when you're managing these ground expedite shipments, it's not a market share question. You own the market. You're doing this for the largest OEMs, the largest auto parts providers out there. So when you're managing it, it's the portion that comes over that. And typically, the part that we're managing is the expedite. So it's not the normal truckload. It's not the deviations that happen. It's that last part when things fall apart. That's when these companies depend on us.
And then you made a comment that you're starting to prepare for next year's bid season. I know it's early, but what are you thinking about? Should we be thinking about another year of low to mid-single digit pricing increases? Do you think it could be better than that? Just any initial thoughts.
It's still very, very early, Scott, and, like, these are preliminary conversations with customers on planning, so I don't want to pin ourselves down on what we're expecting on the truckload market to do on a year-over-year basis. You know, right now, we understand that we're still in a soft-rate environment.
All right. Thank you, guys.
Operator
And your next question comes from the line of David Cezula with Barclays. Please go ahead.
Hey, good morning. Thanks for taking the question. You'd mentioned during the prepared remarks, you're bringing on profitable last mile growth. Is there any way to talk about the profitability of kind of the existing book to business, normal trends, and then the incremental profitability of the new business you brought on and how we should expect to compare and monitor going forward?
Yeah. Hey, David. So the business we brought on, as Drew said, we're winning new customer relationships. We're also winning some white space and new markets from existing customers. The business that we won year over year, fourth quarter in a row with double-digit growth, really came more in the area where we're running business out of a customer facility. That's typically going to have a smaller contribution margin flow through than when we win business in our hubs. If you think about winning business in one of our hubs, you can think about a 30% to 40% flow through from revenue down to the EBITDA. When we run that business out of the customer hub, that's going to be in the mid-teens. The profitability, the incremental profitability was in line with what we were expecting. The business is doing well. Customers like our service, and we're really actually winning a lot of good new markets.
Okay, Roger. So I understand the business at the customer facility is a lower capital type spend, and that is why you have a lower market profile?
Yes, I'd probably frame it up more in a lower fixed cost type spend because we're operating out of their facilities, therefore we don't have our warehousing cost as part of the equation. But that's the primary difference between the flow through. Got it. and then jimmy you mentioned earlier you know the 100 million dollars in tech spend how are you measuring the results of that tech spend and kind of evaluating the flow through of what's appropriate to spend going forward yes so we've got a very robust process internally we have an internal investment committee if you will it's made up of our tech leadership drew myself Every project that comes through, we're looking at what's the ROIC, what's the strategic value to the customer service, does it give us new capabilities, et cetera, et cetera. If you take an example, Drew mentioned the 30 to 50 basis points that we've gotten from the integration of the carrier procurement. That's the beginning of what we think is a lot of upside in terms of our purchase trends. that took investment dollars to achieve that but every project that we have in tech regardless of the the line of business to supply to we're going through this model strategic value customer service value you know return financial value and we and we think we've got a lot of upside in organic investments around our tech spend and it's still ahead of us awesome thanks Tammy.
Operator
And your next question comes from the line of Ari Rossa with Titi Group. Please go ahead.
Yeah. Hi. Good morning. I wanted to talk about the LTL versus TL market dynamics. I was surprised, Drew, to hear you say that you expect LTL eventually to reach 50 percent of your load volume or correct me if I got that wrong. But just talk about what the value add is that you're bringing in the LTL market versus the TL market? And given that the TL market is so much bigger than the LTL market, why would that not continue to just outpace, I guess, the LTL share?
Yeah, so it's not an either or for us, Ari. We want to be able to do both. And that's, again, if you go back and you look at the organic growth just of truckload pre-Coyote acquisition for the last five years that included the downturn that's still up more than 40 percent so growing truckload organically is still a part of our story and who we are but ltl has a lot of room to grow we love the stability that that brings from a profitability perspective to us and we also the the ease of managing it on our rxo connect platform for our customers is highly automated there's not a lot of touch but i want to be very clear it is not an either or and we expect to grow both through a cycle hey let me add one thing to that from the shipper side having been on the shipper side you know a lot of my career this is an area that's hard to
manage it's often the smallest part of the transportation spend of a shipper it's an easy piece of business to outsource it's also been very beneficial to outsource and one of the things we provide a shipper is we have the scale on a regional level to pick different LTL providers to provide that shipper that can create even a bigger scale than an individual shipper can get on their own. So there's a lot of kind of operational and financial advantages to move into us, which is one of the reasons why we're winning big books of business at a time.
I guess just a point of clarification. Do you think that you're adding more value for shippers in the LTL market than you are in terms of the service that you're offering in the truckload market? And I don't mean that specific as like a knock on RxO. It's just, is there more opportunity to add value to shippers in LTL brokerage than there is in TL brokerage?
No, because remember, Ari, these are coming to us because of our truckload relationships and the value that we were adding on the truckload side. If we were not adding value on the truckload side, we would not be getting these opportunities within LTL. That's how they started. So, you know, So, I mean, again, through a cycle, we will organically grow both truckload and LTL above the market.
Okay, understood. And then just for my second question, I wanted to ask about expectations for the buyback. I noticed in the slides you mentioned the buyback authorization. I know it hasn't really been tapped, but just wanted to get your thoughts on, you know, is that a good use of cash right now, given the cash conversion that you're seeing and kind of the expectations to continue to generate cash and the level of interest internally on deploying that towards a buyback?
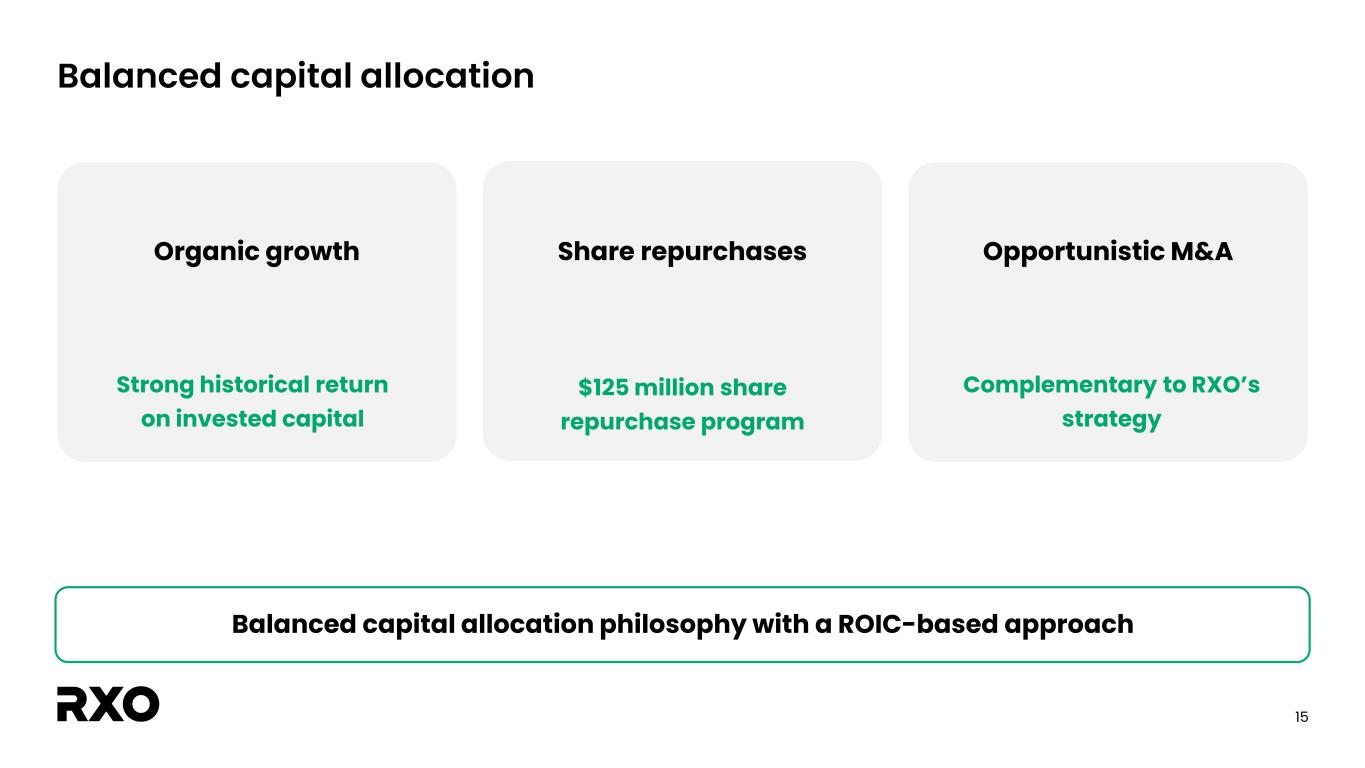
Yeah, so the buyback, we've had it in place a couple years. It has been since day one kind of one of our key pillars of capital allocation. You know, first and foremost, organic growth, strategic M&A as it becomes available and we think it's a good strategic move, and then of course the buyback capital allocation to kind of the return to shareholder. As we think about the buyback, we certainly think there's good value in our stock. We're always looking at that relative to the market conditions overall and our balance sheet is something that we pay a lot of attention to. Your point, I had a really strong cash flow quarter. We expect another strong cash flow quarter in Q3. As we think about that balance sheet though, if you go all the way back to our time at spend we talked about a leverage ratio of one to two times we're at that 2.1 times we feel good about that right now in the market cycle so that buyback decision is always going to be taken in context of how where are we with our balance sheet and and so something we're watching very closely but it those three pillars are our key allocation priorities and you know they continue to they continue to be where we're focused thank you for the time and your next This question comes from the line of Jason Seidel with TD Cowan, please go ahead.
Thank you, operator. Drew, Jamie, Jared, morning, guys. I wanted to flip back a little bit to sort of your gross profit per load commentary. How much of the improvement that you saw on the truckload side in 2Q and then your forecasted improvement is due to sort of your carrier migration and your unified pricing data set that we saw move over earlier in 2Q?
Yeah, I'd say it's a combination of two things, Jason. You've got the pricing strategy that we've talked about. You're seeing that begin to kick in. You're also seeing the cost of purchase trends. You won't quantify each of those individuals, but I think Jared made this point earlier. If you look back at the history, Q2 to Q3 as an example, we typically would see gross profit per load being down. Materially, we could see gross margin percentage being down. You know, as we go from Q2 to Q3, we see both of those up, gross profit per load up slightly. We see kind of a stable growth margin percentage. Both of those are different than we've seen the last two or three years. So, you know, we believe that you're seeing both the pricing strategy and our procuring transportation better begin to kick into the P&L.
For my follow-up, I wanted to hop over to manage trans since we haven't talked much about it. you guys mentioned that the pipeline continues to expand a bit maybe you could dive a little bit deeper in there and talk about that pipeline and and where you see the opportunities coming from you know for Manus Trans the pipeline is up sequentially right now we've got a bunch of deals that we think are making decisions over the next six months with Manus Trans typically they are longer sales cycles so sometimes those do get pushed out a little bit for us right now you know When you look at how we built Manus Trans, a lot of it was built off of automotive, oil and gas, and industrial manufacturing. One of the things that we've done a really good job at over the last couple years is building a pipeline that is stronger on the food and beverage side, stronger on the CPG side, stronger on the technology and electronics side. So building diversification in the verticals that we're serving with Manus Trans is something that we're focused on as we go forward.
Appreciate the color. Appreciate the time as always, guys.
Operator
Thank you. And your last question comes from the line of Jordan Alliger with Golden Sacks. Please go ahead.
Yeah, hi. I know you generally, freight conditions remain soft, but I'm just sort of curious. Are there pockets that have developed in the spot market at all where there's signs of life? And then sort of following on that, to get the true inflection in gross profit per load, let's say, do you need that spot market to be favorable? Thanks.
We do not need the spot market to be favorable in terms of how well we buy transportation versus market. That's what you saw as one organization now buying 30 to 50 basis points better than what we were doing previously in the acquisition. So we do not need it for that. To see the true inflection, of course you need spot loads. When you look at what spots do, typically those are higher gross profit per load, and you see that around whenever tender rejections get up and stay over that 10% mark. So, you know, for us, we've got some things that are idiosyncratic in our favor as far as how well we can perform in terms of gross profit per load. But the market, if the market inflexed impacts the whole industry, you've seen what we can do there before whenever we posted double-digit EBITDA margins during that time period.
And just in the spot market in general, you would say it's fairly non-existent?
I think when you look at large enterprise customers, routing guide compliance is holding up very well. If you think about the SMB market, that is largely spot. Those aren't typically contract moves. They're spots on a one-off basis. But routing guides for large enterprise customers is holding up right now. And, you know, so for us, our job is to go in there and make sure that we are leveraging where we have the strongest capacity, where we can provide the best service, and where we can make a fair margin at.
Operator
Thank you. And that is all the time we have for questions. I would like to turn it back to Mr. Wilkerson for closing remarks.
Thank you, Ludi. RxO delivered strong results in the second quarter. We're starting to see the benefits from our unified carrier operations, and we're purchasing transportation more effectively than we did before the integration, with a lot of runway for future improvements. Despite tighter market conditions, we increased truckload gross profit per load by 7% sequentially, an impressive result. Brokers' volume grew by 1% year-over-year, and in last mile, we grew stops by double digits for the fourth consecutive quarter. Our cash performance was strong with 58% adjusted free cash flow conversion. We also added cash to our balance sheet. We remain focused on taking profitable market share, and we're well-positioned to deliver increased earnings power and free cash flow over the long term and across market cycles. Thank you all for joining today.
Operator
Thank you, presenters. and ladies and gentlemen, this concludes today's conference call. Thank you all for joining. You may now disconnect.