Operator
Greetings and welcome to the AmeriCold Realty Trust second quarter 2026 earnings call. At this time, all participants are in a listen-only mode. A brief question and answer session will follow the formal presentation. Should anyone require operator assistance during the conference, please press star zero on your telephone keypad. As a reminder, this conference is being recorded. It is now my pleasure to introduce your host, Rich Leland, Vice President, Investor Relations. Thank you. You may begin.
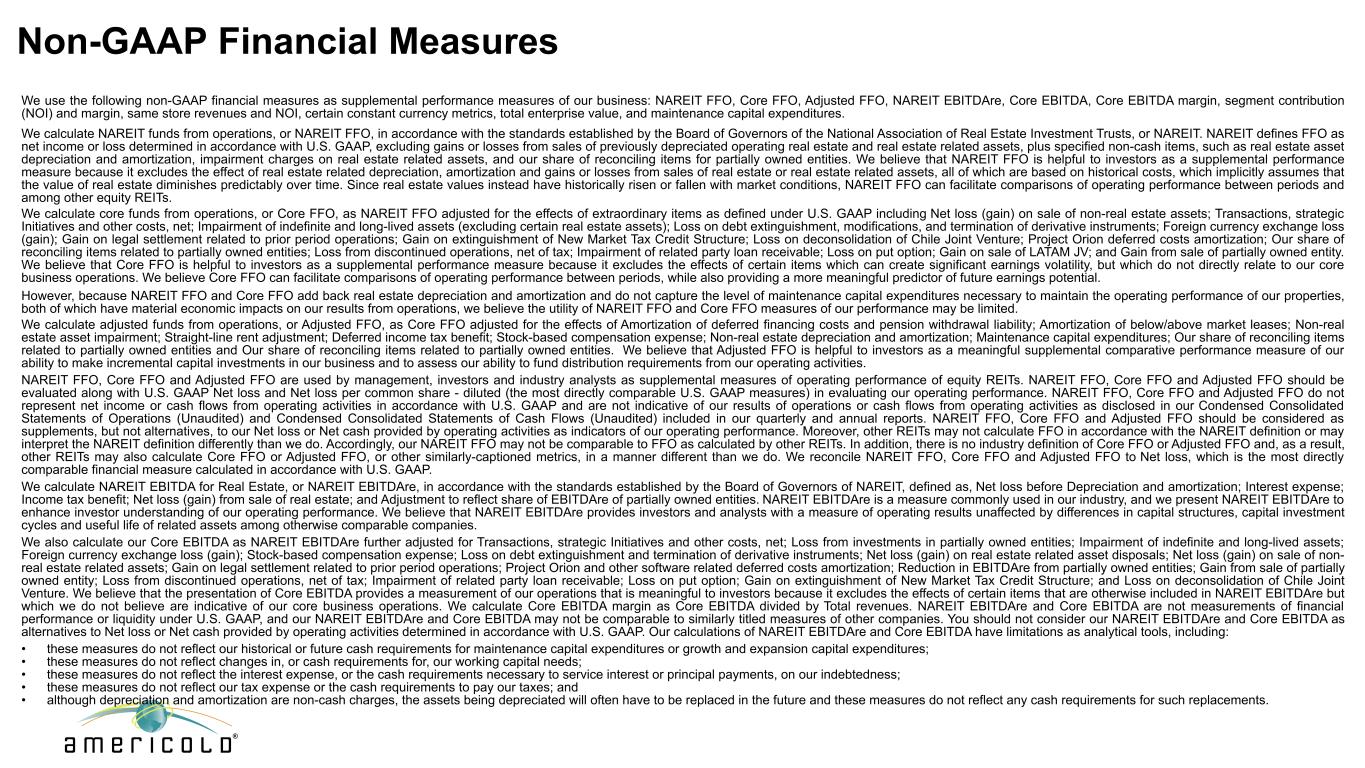
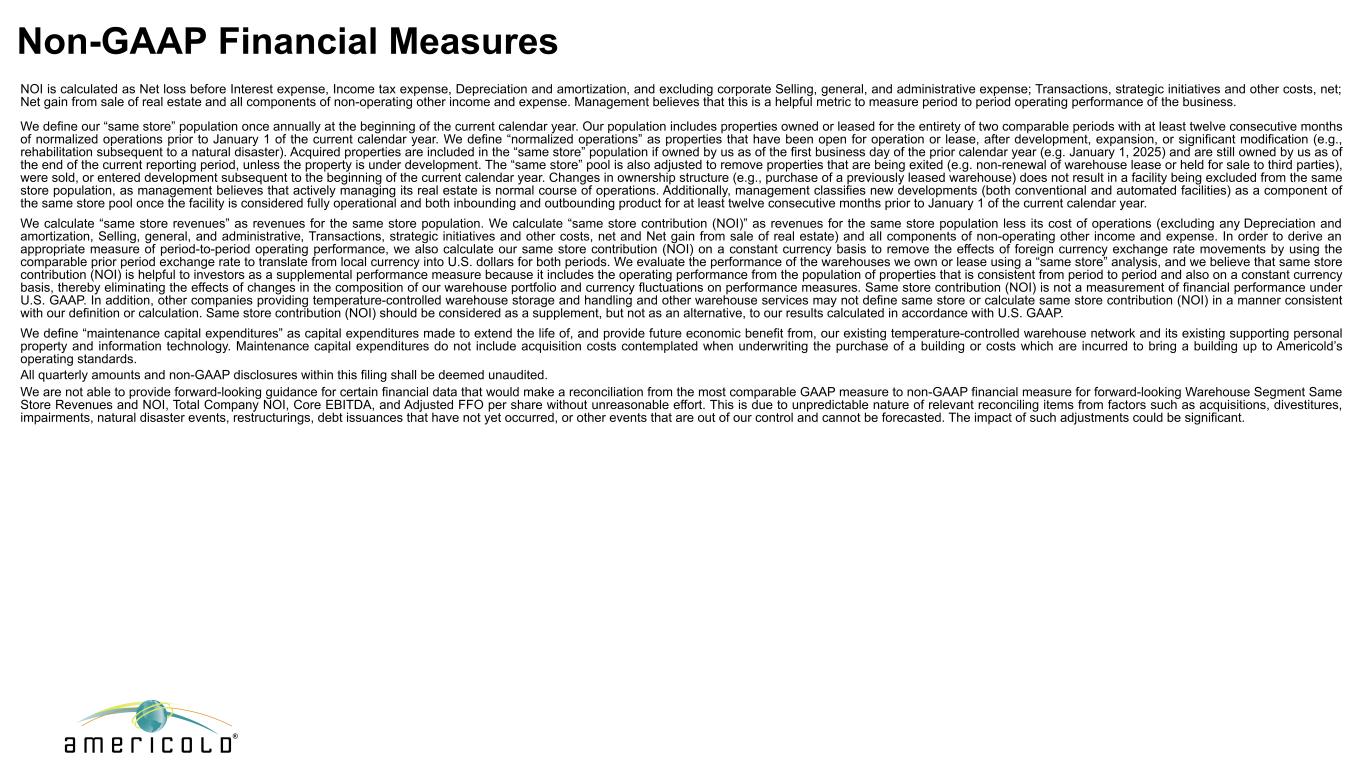
Good morning. and thank you for joining us today for AmeriCold Realty Trust's second quarter 2026 earnings conference call. In addition to the press release distributed this morning, we have filed a supplemental financial package with additional detail on our results. These materials are available on the Investor Relations section of our website at www.americold.com. This morning's conference call is hosted by AmeriCold's Chief Executive Officer Rob Chambers, along with Chris Papa, our Chief Financial Officer. Management will make some prepared comments, after which will open up the call to your questions. Before we begin, let me remind you that management's remarks today may contain forward-looking statements. Forward-looking statements are subject to a number of risks and uncertainties that may cause actual results to differ materially from those anticipated. These forward-looking statements are based on current expectations, assumptions, and beliefs, as well as information available to us at this time, and speak only as the date they are made. Management undertakes no obligation to update publicly any of these statements in light of new information or future events. During this call, we will also discuss certain non-GAAP financial measures, including NOI, same-store NOI, core EBITDA, net debt to pro forma core EBITDA, and AFFO, among others. The full definitions of these non-GAAP financial measures and reconciliations to the comparable GAAP financial measures are contained in the supplemental financial package available on the company's website. Please note that all warehouse financial results are in constant currency and reflect the second quarter 2026 same-store pool unless otherwise noted. Now, I'll turn the call over to Rob for his prepared remarks.
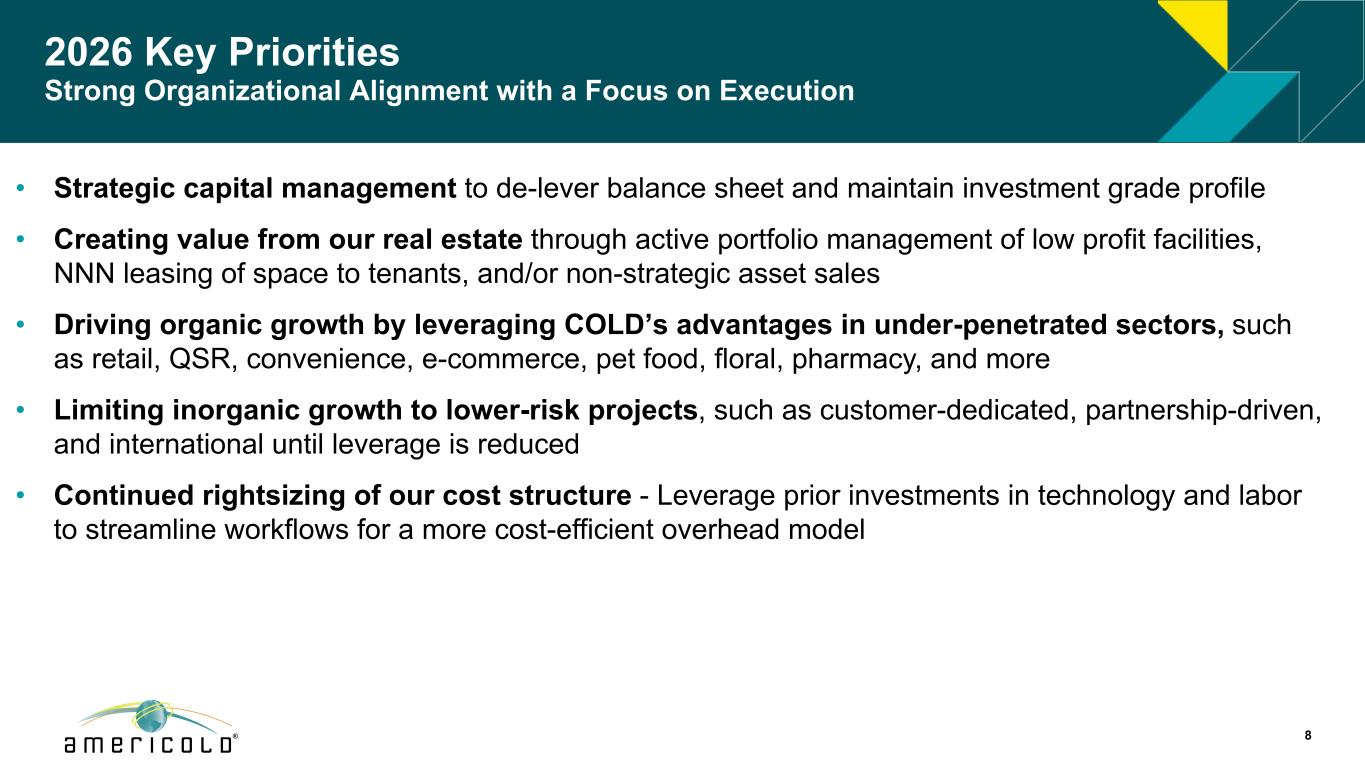
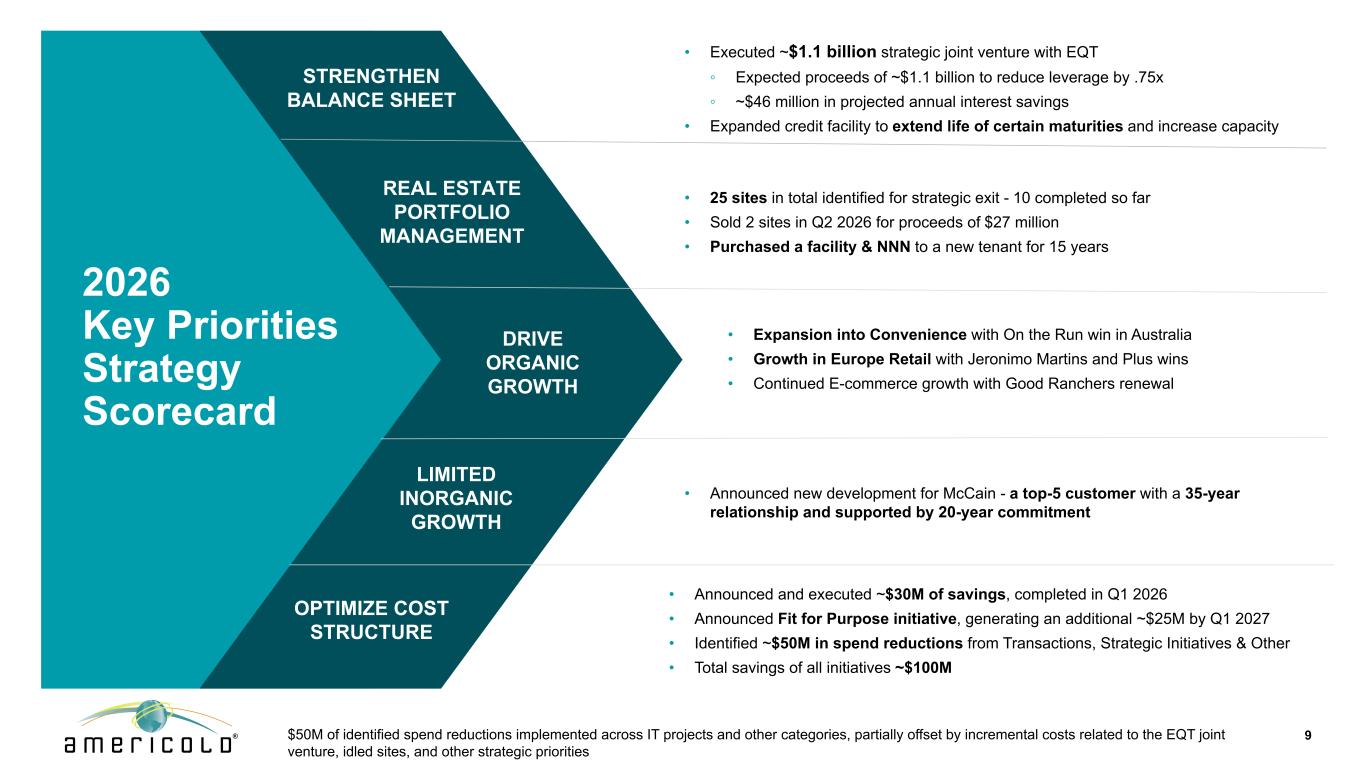
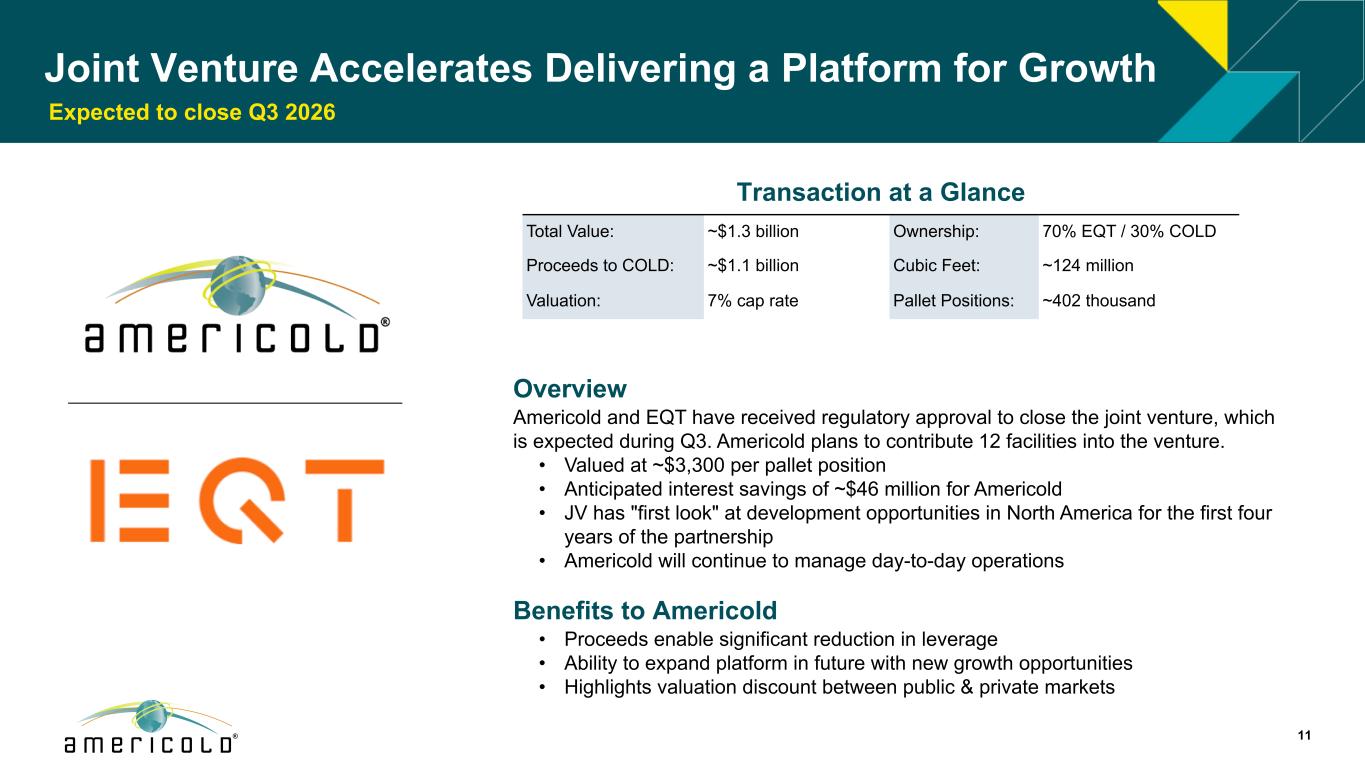
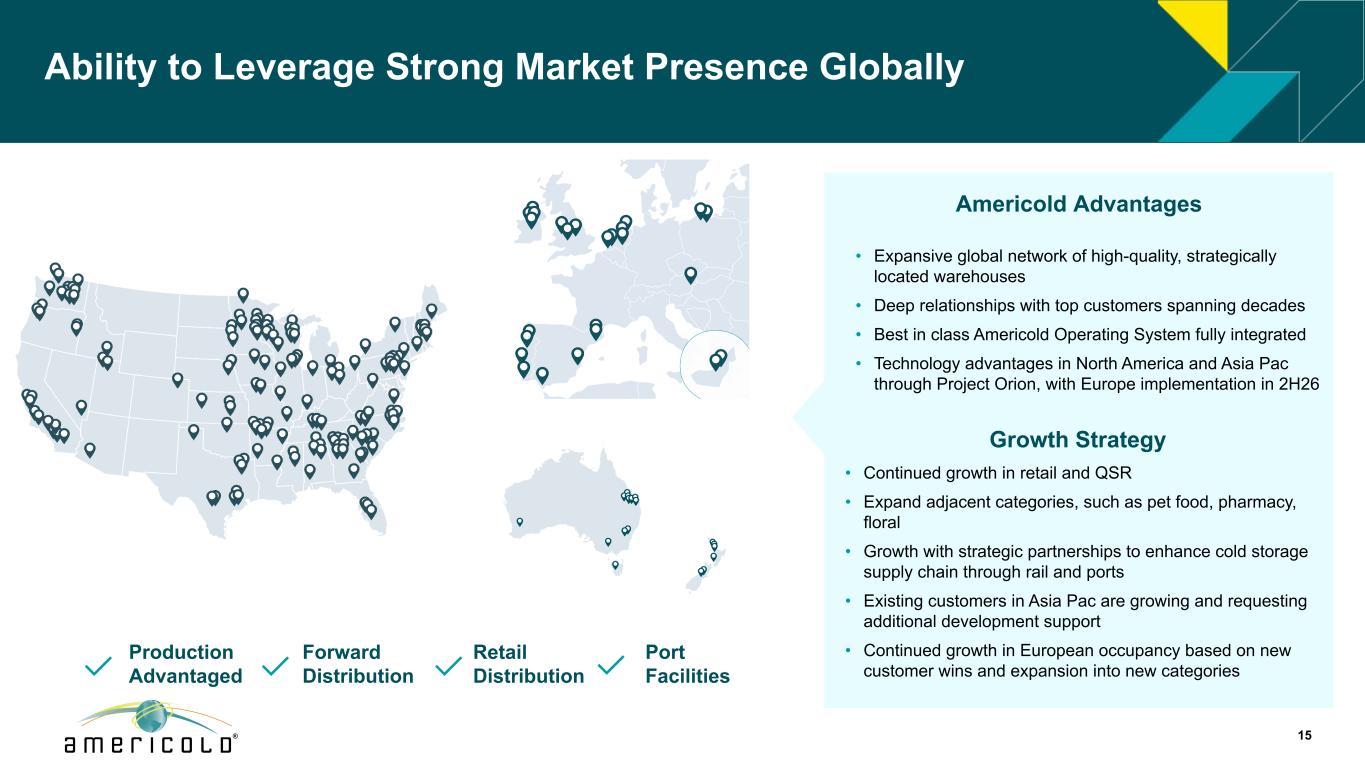
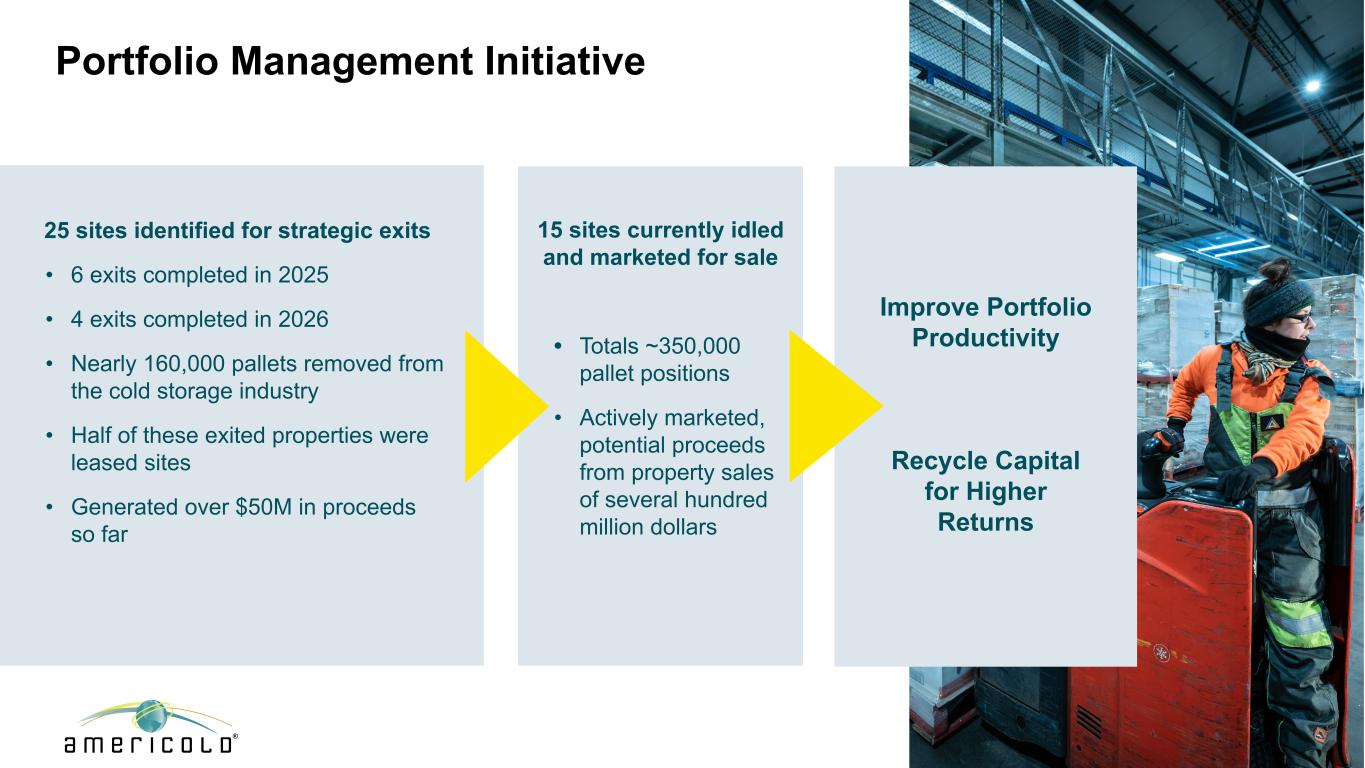
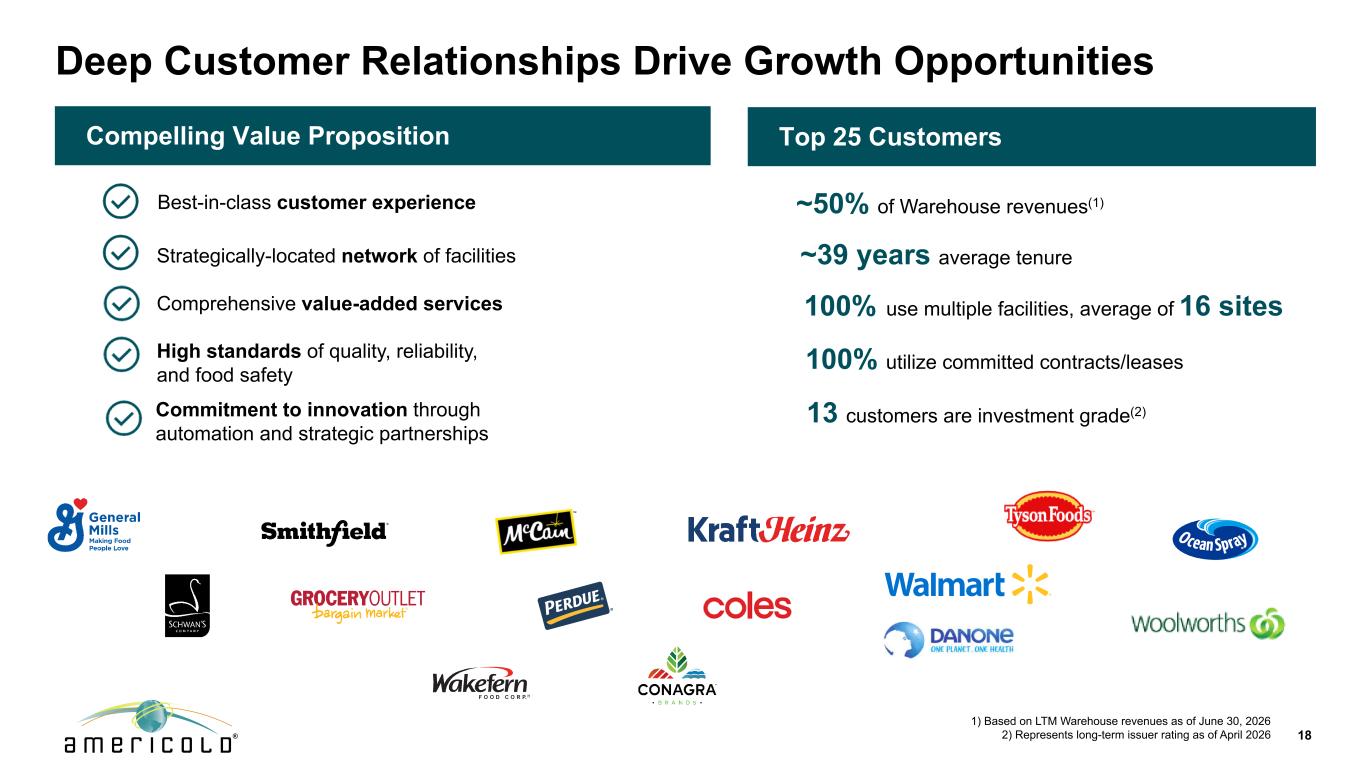
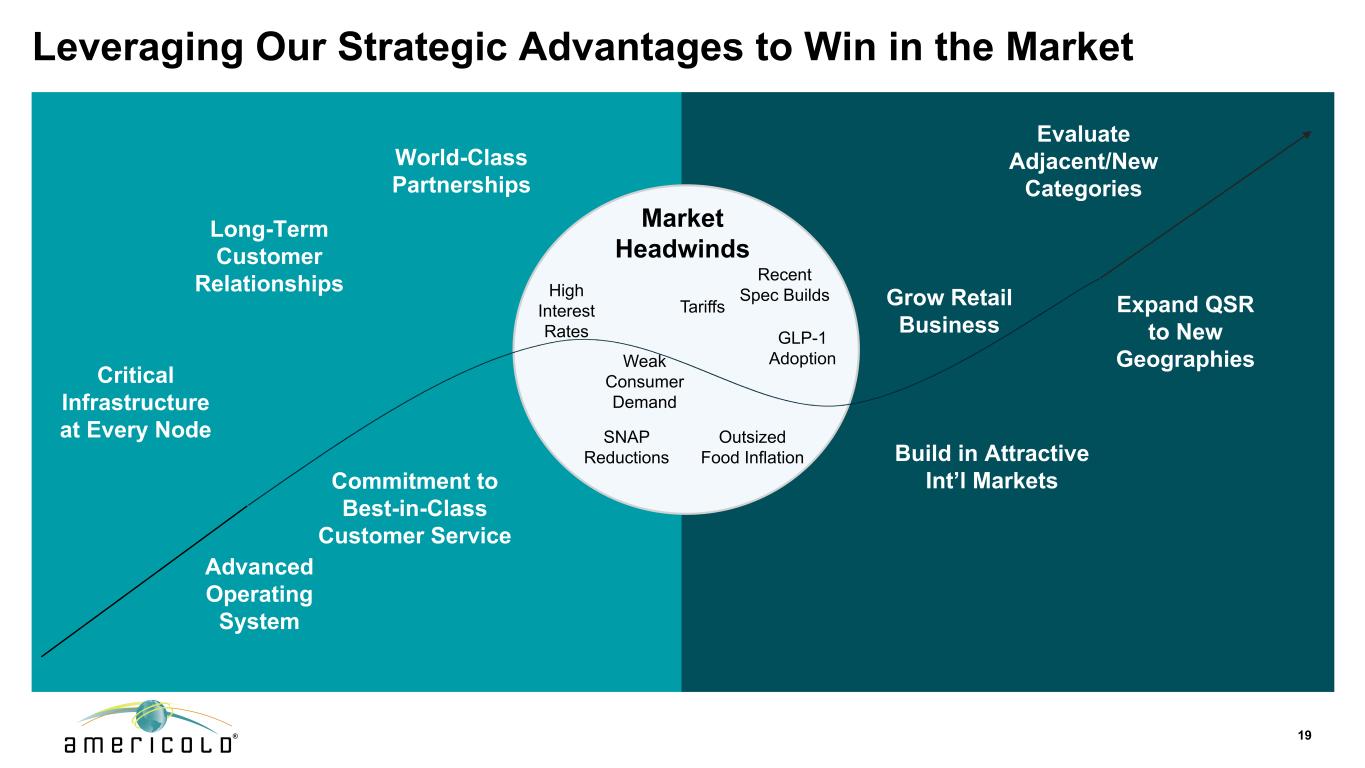
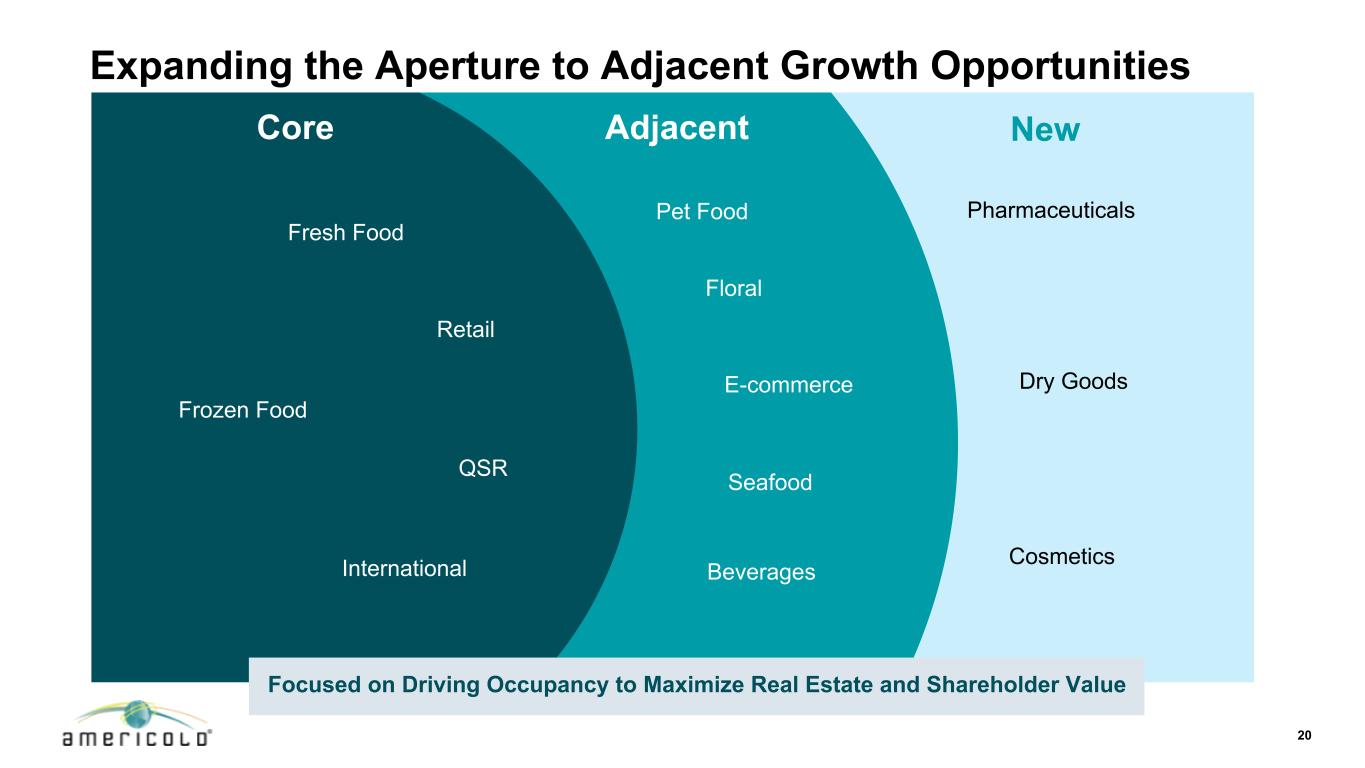
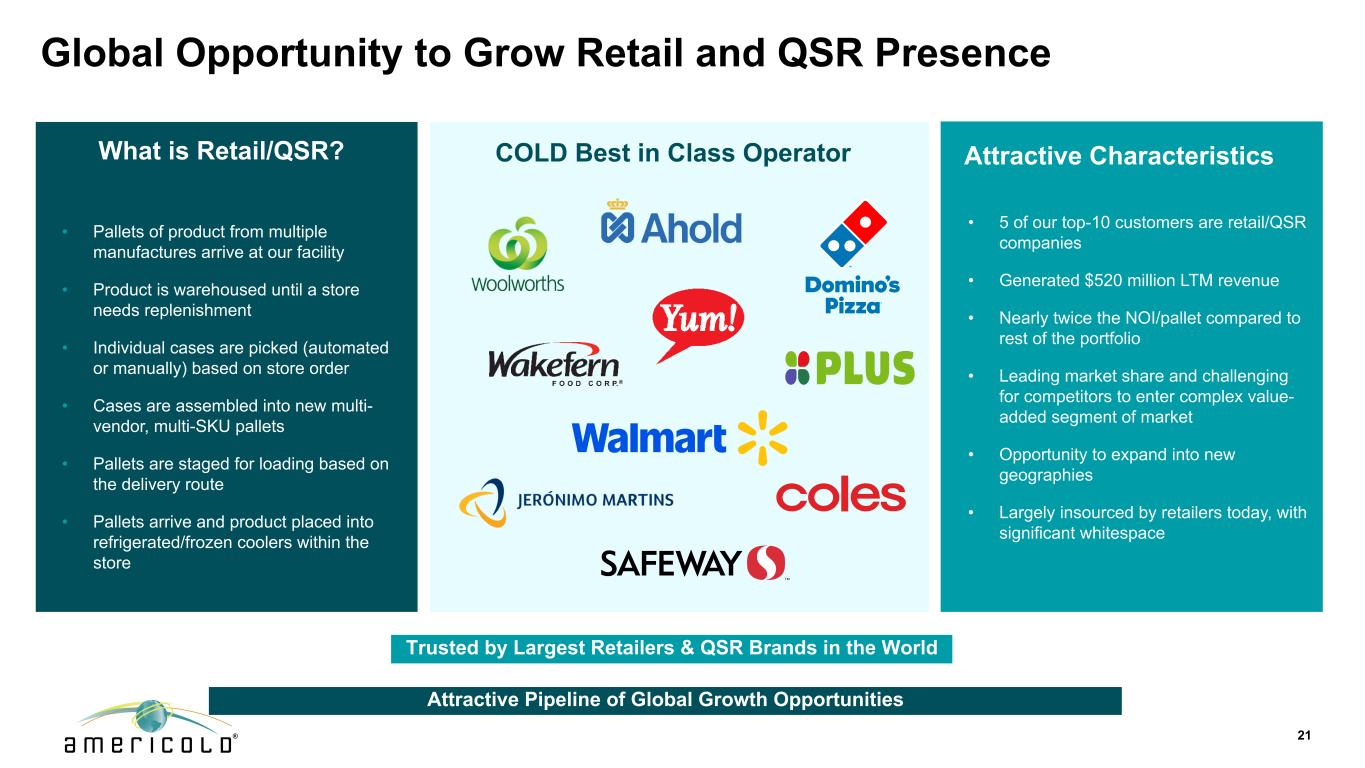
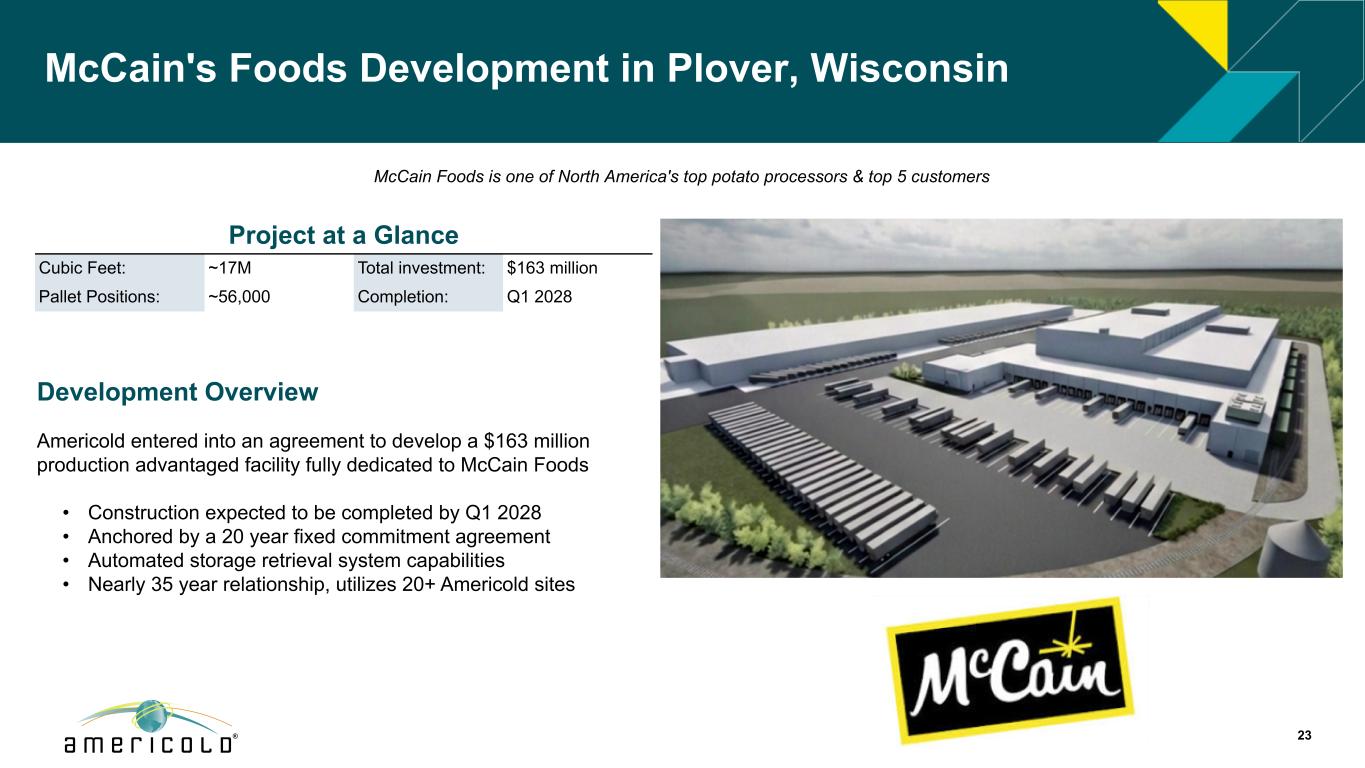
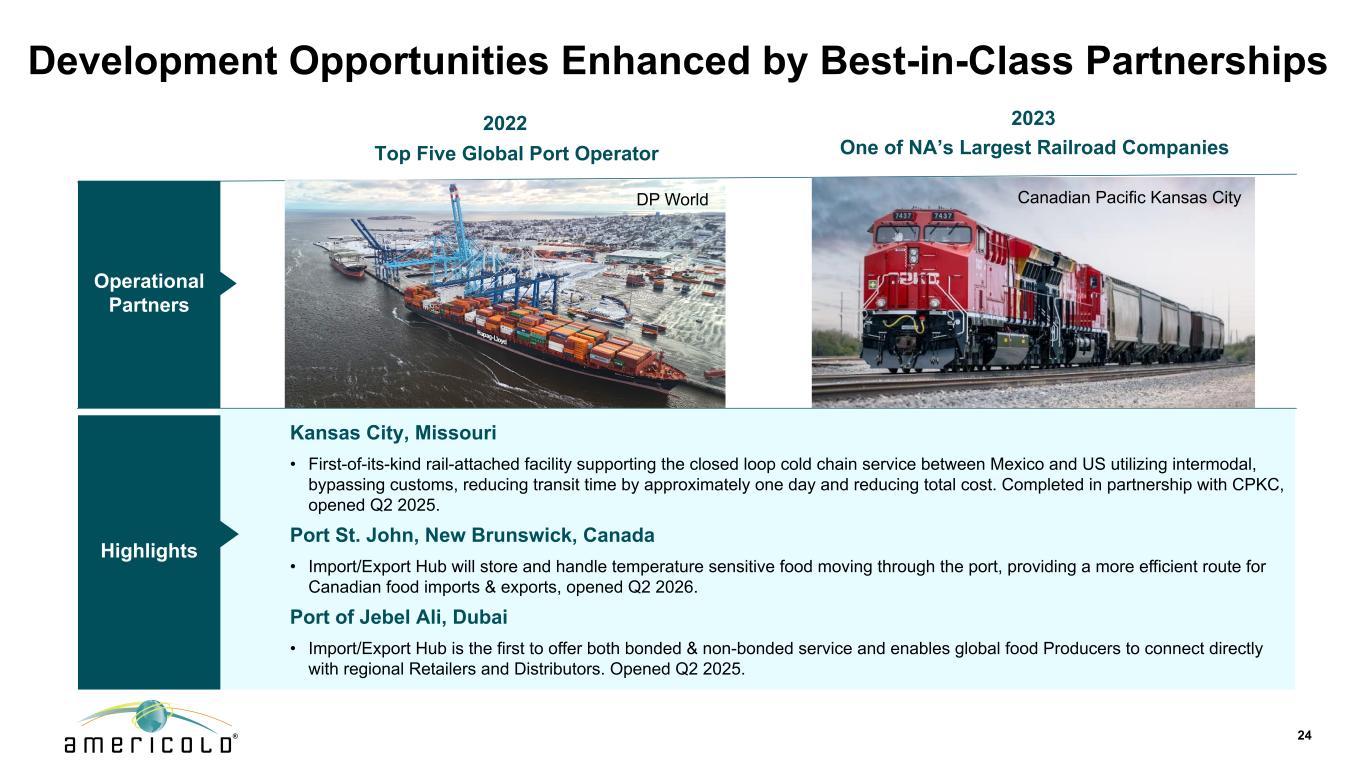
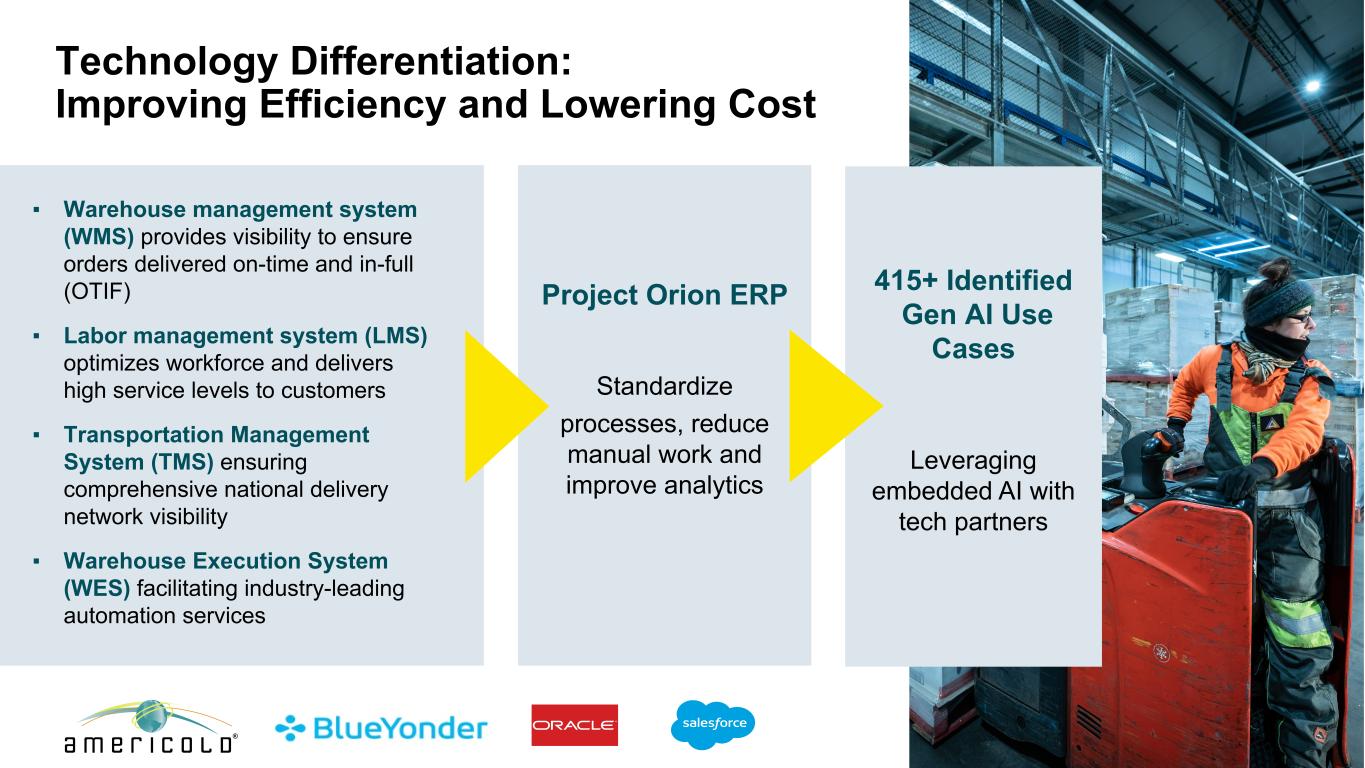
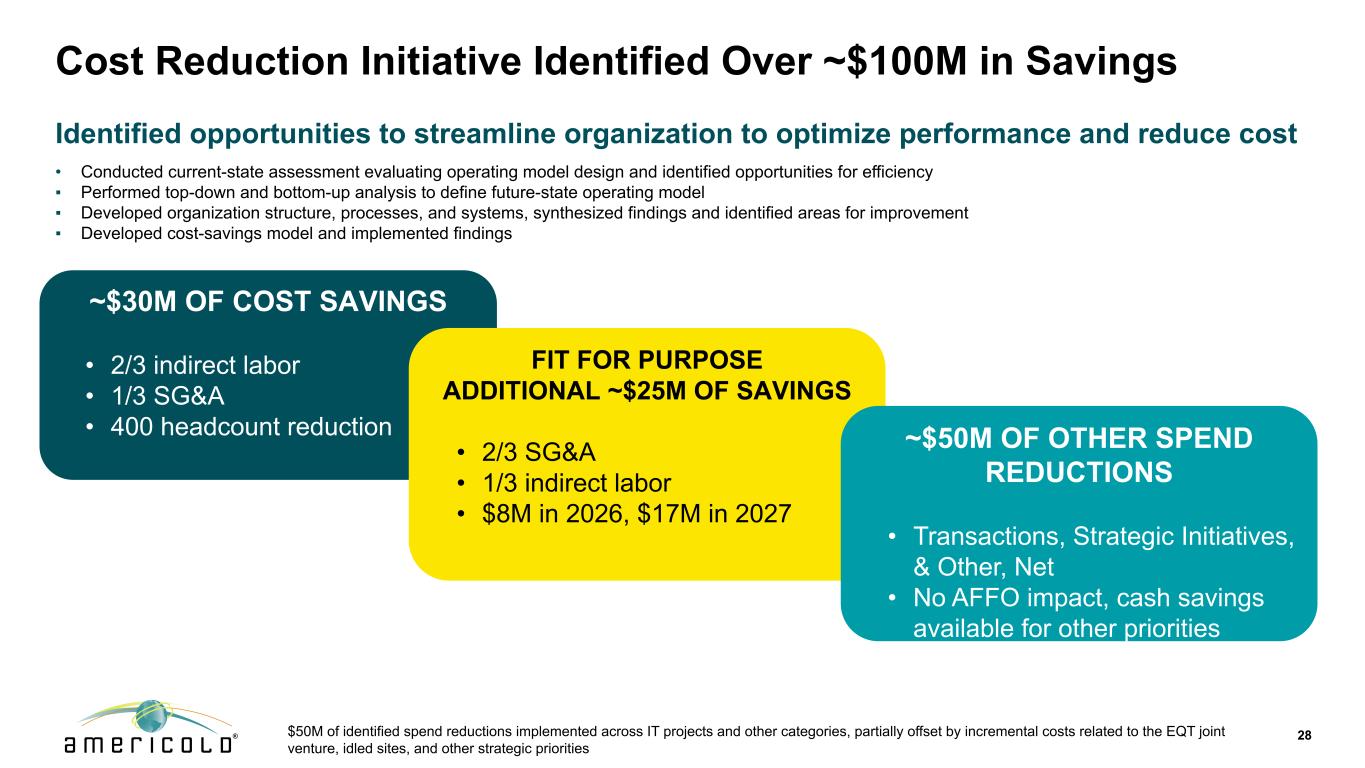
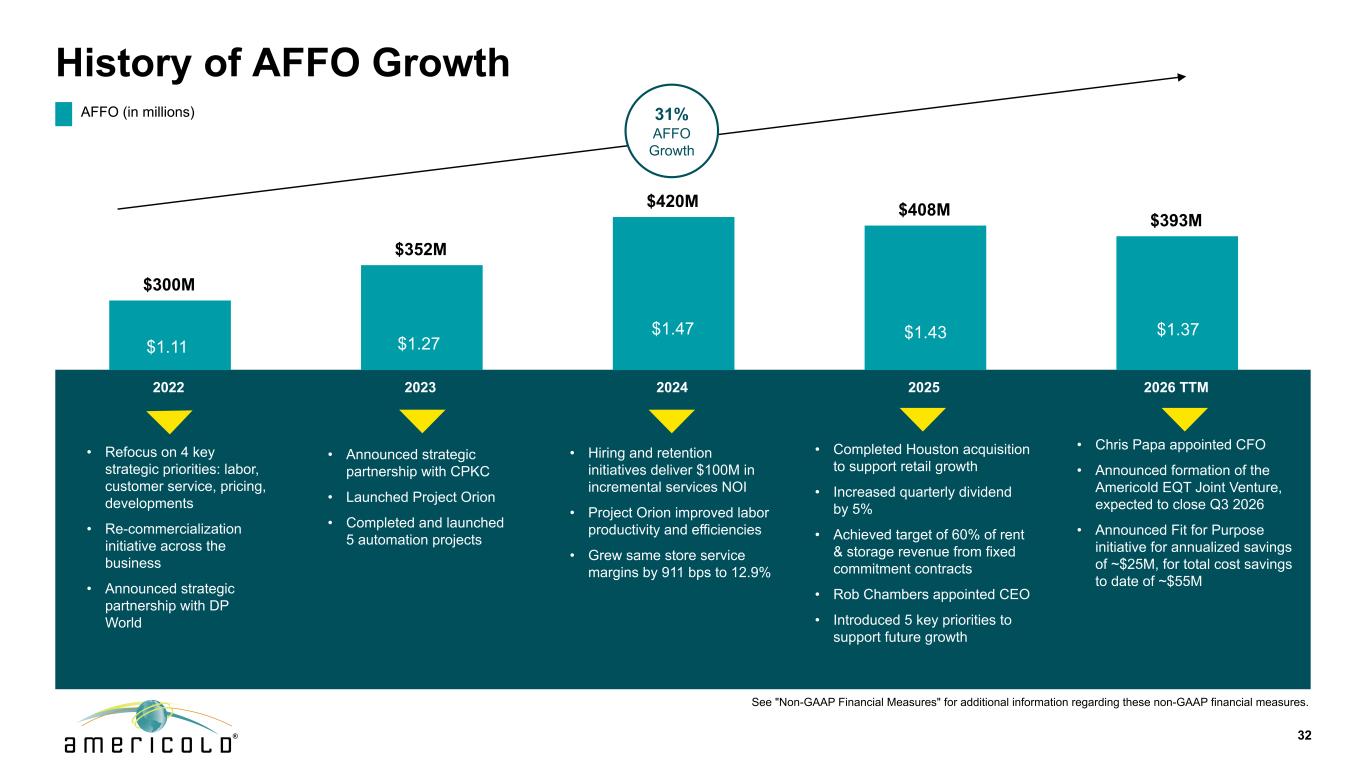
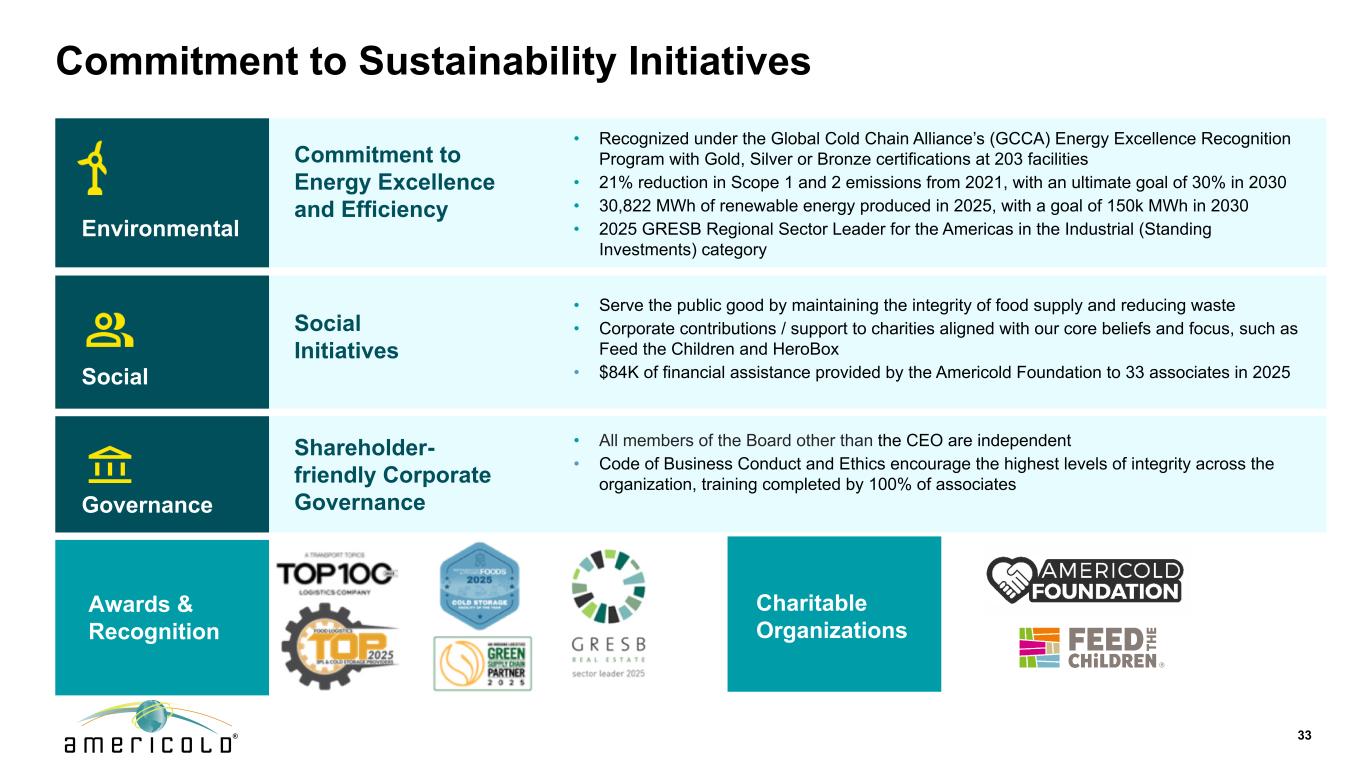
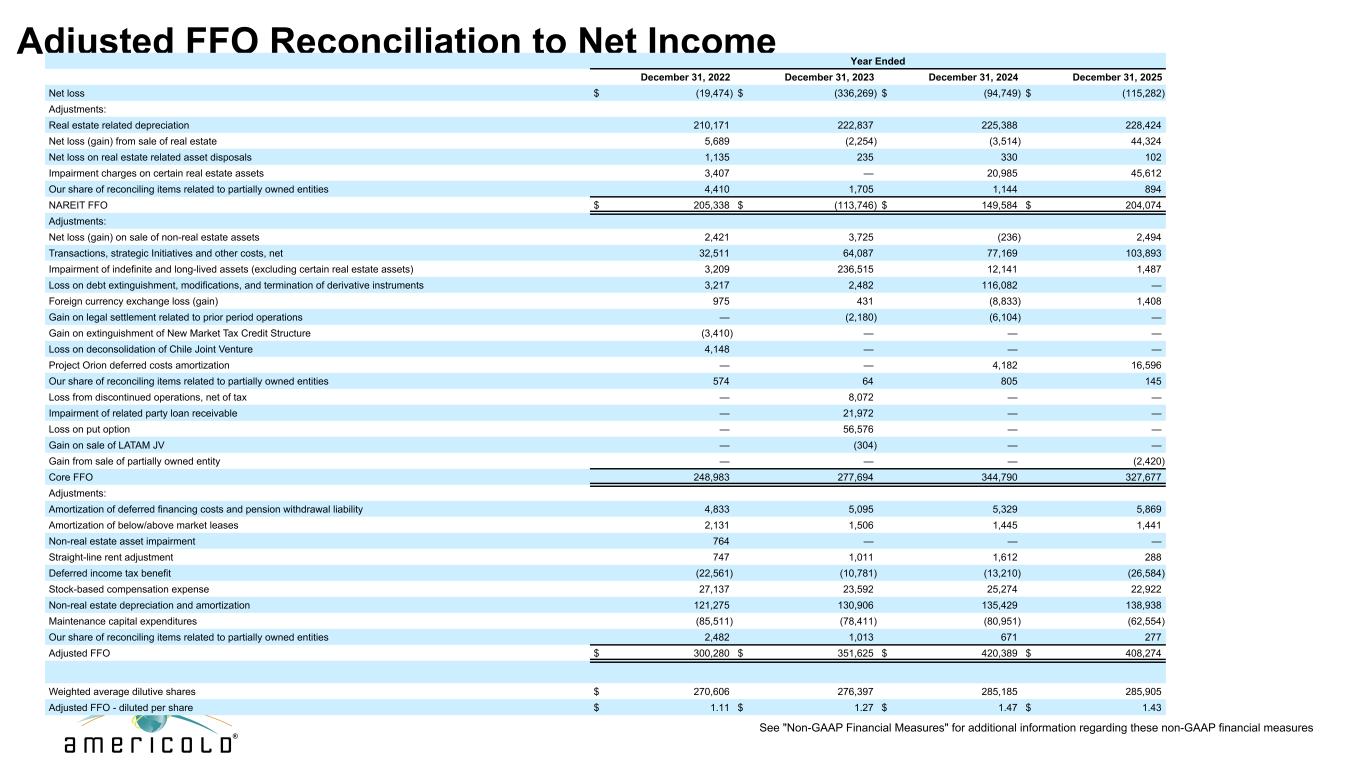
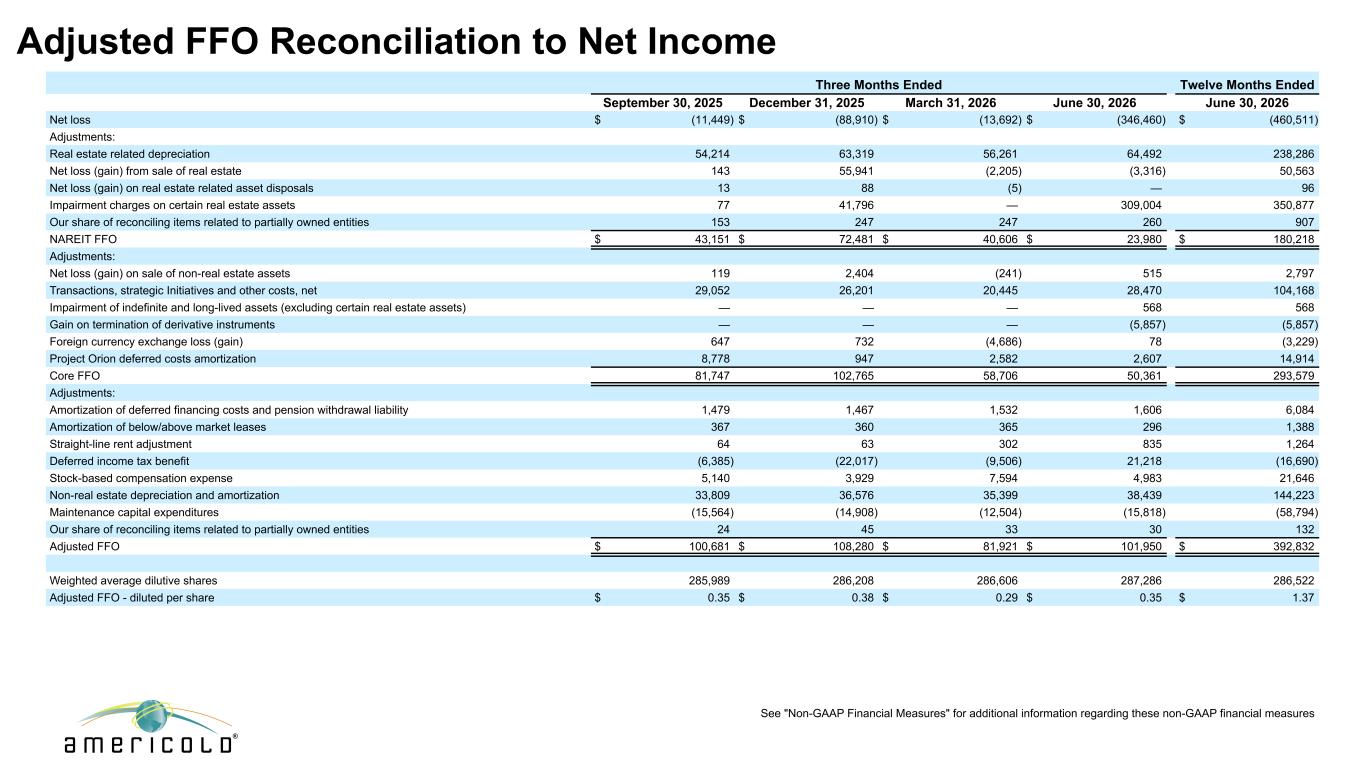
Thank you, Rich, and thank you all for joining our second quarter 2026 earnings conference call. I'm pleased to report that our team delivered another strong quarter, and this morning I'd like to walk you through our financial results and some of the encouraging trends we are seeing across the industry. I will also highlight the significant progress we've made against each one of our five key priorities as we continue to build momentum and strengthen our foundation for future growth. Second quarter results demonstrate two important trends. First, we are continuing to see ongoing signs of stabilization across the industry. And second, the resiliency of our business model combined with strong execution, market share gains, and continued progress against our key priorities has a miracle well positioned to win in this environment. Starting with the financials, second quarter AFFO per share came in ahead of expectations at 35 cents per share. Delivering on our financial commitments is paramount for this management team, and this marks the fourth consecutive quarter of AFFO per share that either met or exceeded analyst consensus. Similar to the first quarter, all key operating metrics materialized in line or better than our original outlook, further reinforcing our conviction that the industry continues to stabilize and our ability to gain share during the process. I'm particularly encouraged by the continued positive trends we are seeing in physical occupancy levels across our portfolio. We saw growth beginning in Q1 of this year, and this continued sequentially as we moved through the second quarter. In a typical year, inventories are generally flat to slightly down from Q1 to Q2. However, we saw our physical occupancy increase over 200 basis points sequentially, and perhaps even more importantly, inventories grew nearly 300 basis points on a year-over-year basis. While this is certainly encouraging regarding the broader industry trends, it is also evidence of our ability to leverage our scale and operational expertise to gain market share in this environment. Last year, we won a record amount of new business, and we're now seeing the benefits flow into our warehouses as inventory ramps from those new wins. Additionally, in the current environment, we believe we are winning more than our fair share of new business as some of the smaller capital-constrained players continue to struggle operationally and are beginning to exit the industry, while the level of new project announcements has slowed materially. Customers that may have given some of these new market entrants a try are coming back to AmeriCold due to our strong history of service, reliability, and operating excellence. From an economic occupancy perspective, we came into the year expecting some contraction as customers re-evaluated their space requirements in the soft consumer demand environment. Here, too, we are seeing results come in ahead of expectations as economic occupancy was up year over year in the second quarter. Additionally, because of the increase in physical inventories, we saw the gap between physical and economic occupancy tighten by 240 basis points. The current 860 basis point gap reflects a healthier and more sustainable long-term level. While we are not waiting for a demand recovery, all of these trends point to an increasingly stable environment, and we continue to believe that we should see a return to more normalized seasonal trends as we progress throughout the year. Beyond occupancy, we were also encouraged to see that our pricing for the second quarter increased year over year for both stores and handling. While the environment remains competitive and many of the smaller players continue to use price as their only way to win new business, our commercial teams are executing extremely well and leading with the AmeriCold value proposition. We believe that operating and service excellence will be even more important to customers in the future as the industry continues to stabilize and eventually returns to growth. You can see this reflected in both our churn rate, which remains low at 2.1%, and in the consistency of our storage revenue from fixed commitments, which remains stable at 58% for We continue to remain disciplined in our approach to pricing, prioritizing long-term value creation and contract quality over short-term volume gains. The fundamental benefits of the fixed commitment structure continue to provide a compelling value proposition with 100% of our top 25 customers who account for over 50% of our total revenues utilizing our fixed committed contract structure. Beyond our financial performance, I also want to highlight some of the significant accomplishments that our team delivered during the quarter to strengthen our foundation and set us up for long-term success. You will remember that we entered the year focused on five key priorities for the business. Since then, we have delivered meaningful progress in each of these areas. First is our initiative to delever the balance sheet. I'm very pleased that during the quarter we received regulatory approval to proceed with the closing of our previously announced $1.3 billion strategic joint venture with EQT. Our teams are working through the final closing conditions, and we expect to have the transaction completed in the third quarter. They have been a fantastic partner and truly understand the mission-critical nature of our assets and the embedded growth opportunities across our portfolio. I look forward to expanding this platform in the future with new opportunities, and I believe that having a strong capital partner like EQT will be a strategic advantage for AmeriCold going forward. Chris will provide additional details in a few minutes, but we expect to use the proceeds from this transaction to repay approximately $1.1 billion of our outstanding debt, resulting in a substantial reduction in our total leverage. In addition, during the second quarter, we also amended our revolving credit agreement to extend the maturity date out to 2031. As a result of these actions, we are making significant progress towards improving our balance sheet and enhancing both our liquidity position and financial flexibility. Maintaining our investment grade rating is an important objective for us, and Moody's recently reaffirmed our rating and outlook, further validating the progress we have made. The second of our five key priorities is to create value from our real estate through active portfolio management. During the quarter, we sold two previously idled facilities for total proceeds of approximately 27 million dollars. Both facilities will be removed from the cold storage industry, eliminating 31,000 pallet positions. Since launching this initiative last year, we have exited a total of 10 underperforming facilities and have an additional 15 that have either been idled and are awaiting exit or actively being marketed for sale. Additionally, last quarter, we expanded this initiative to include a review of our more recent development projects. Based on the projected return assumptions, we announced late last month that we have mutually agreed with the customer to wind down operations at our Lancaster and Plainville facilities and strategically reallocate the capital to other, more productive uses. From a capital allocation perspective, these properties were not meeting our return expectations and would have required additional investments in capital, time, and resources to fully ramp. Their current contribution to NOI was negligible, and in conjunction with this closure, we have reached a broader commercial agreement with the customer to extend and expand their business at other assets across our network. We recorded a $298.8 million non-cash impairment charge in the second quarter and will be classifying these facilities as held for sale starting in the third quarter and have already listed both buildings for sale. In total, we have the potential for substantial future cash proceeds from buildings we intend to exit, with several hundred million dollars of properties currently listed for sale. These actions reflect our commitment to allocating capital to assets and opportunities with the strongest risk-adjusted returns, and by cleaning up the portfolio, we expect to have a healthier and more productive mix of assets to generate long-term sustainable returns for shareholders. One area where we continue to see interesting growth opportunities is in underpenetrated sectors, as we continue to extend our capabilities into adjacent and complementary areas of the temperature-controlled supply chain. This is our third key priority, and already this year we have successfully won new business that established our retail footprint in Europe, as well as expanding our QSR and convenience capabilities in AsiaPAC. We are also continuing to see new business wins in adjacent sectors, including e-commerce and pet food. During the quarter, we renewed our long-standing relationship with Good Ranchers, a direct-to-consumer protein provider that has grown rapidly over the past several years. They have expanded from a single site to now using five facilities across our network to distribute products nationwide to their growing customer base. These wins reinforce our operational expertise in handling fast-turning product and is aligned with the broader growth trends in direct-to-consumer business and the humanization of pets that our top customers have discussed on their public earnings calls. These initial entries deepen our integration with customers and enhance our value proposition beyond traditional storage and handling services, further demonstrating our ability to pivot to new growth opportunities when customer demand trends shift. While still early, we believe these opportunities will drive incremental growth over time and further differentiate AmeriCold from its competitors, especially the smaller players who lack the resources to invest in the capabilities and technology necessary to support customers in these more operationally intensive sectors in the market. Our fourth priority is to focus our development spend on a limited set of lower-risk, customer-driven projects. Last quarter, we announced a new $163 million plant-adjacent project dedicated to McCain Foods and anchored by a 20-year fixed commitment agreement. We were also excited to announce the June grand opening of our facility in Port St. John, Canada, which was developed in partnership with both CPKC and DP World. This integrated import-export facility is the first of its kind globally to combine the rail, port, and cold storage expertise of CPKC, DP World, and AmeriCold in a single location. This is a unique solution that creates a new way of moving temperature-sensitive products between inland production regions and international markets. Similar to our focus on adjacent categories, these strategic partnerships help diversify our business and provide additional unique growth opportunities for AmeriCold that are difficult to replicate. Finally, our previously announced expansion project in Dallas-Fort Worth remains on budget and on track for an opening later this year. Our fifth priority is to right-size our cost structure and transition to a more efficient overhead model, while maintaining our focus on operational excellence. Earlier this year, we completed the first phase of this initiative, which was designed to deliver approximately $30 million in annual savings, primarily in indirect labor. Thus far, we have reduced our indirect headcount by 400 positions, which is over 10% globally. During the second quarter, we announced our Fit for Purpose Initiative, which builds on this progress with an additional $25 million of targeted savings by the end of Q1 2027, focused primarily on SG&A and our support functions. This initiative is intended to unlock efficiencies enabled by our prior investments in labor and technology to drive clearer accountability, faster execution, and stronger performance across the organization. We're already starting to see the early benefits of these actions as SG&A was down year over year this quarter, more than offsetting the impacts of ongoing wage inflation across the business. Finally, I'm also pleased to announce that in early July, MSCI upgraded our ESG rating by four categories from double B to double A. This reflects the continued maturity of AmeriCold's sustainability program and the cumulative impact of several years of focused work in this area. We have maintained a consistent approach centered on operational efficiency, governance, risk management, and transparent disclosure. Congratulations to our ESG team on reaching this milestone and positioning AmeriCold as a leader in sustainability. I am incredibly proud of our team and the momentum that we are building across each of our priorities. In an environment that continues to challenge many in our industry, our scale, operational expertise, and customer relationships are allowing us to differentiate and win in this market. As a result of our outperformance in the first half of the year, an outlook for continued positive trends, we are increasing our full-year AFFO guidance to a range of $1.26 to $1.32 per share, an increase of $0.04 at the midpoint of the range. This is after absorbing an estimated $0.05 of dilution from the EQT joint venture as our strong execution in the base business has positioned us to more than offset any dilutive impacts from that transaction. Next, I would like to turn it over to Chris so he can discuss the reporting changes you can expect to see in Q3 from the joint venture, as well as the additional details of our financial outlook. Chris?
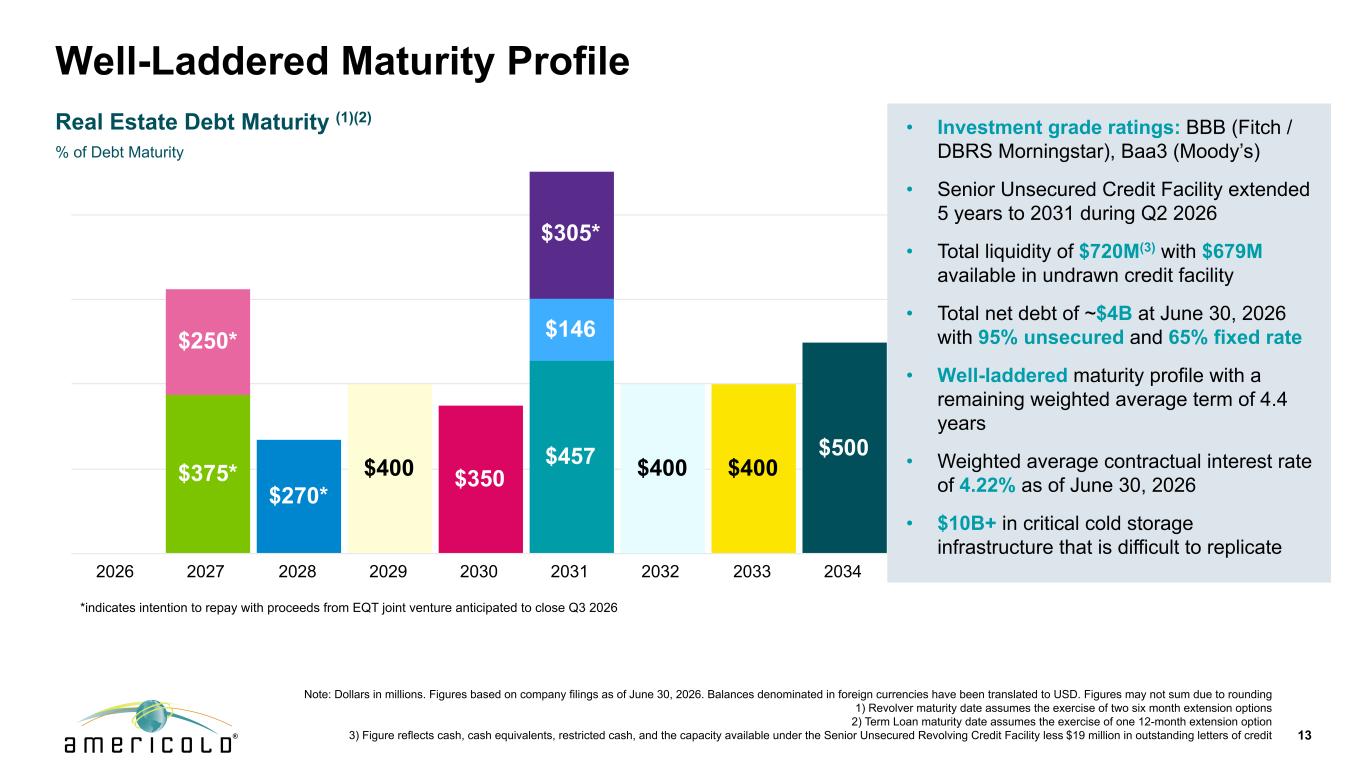
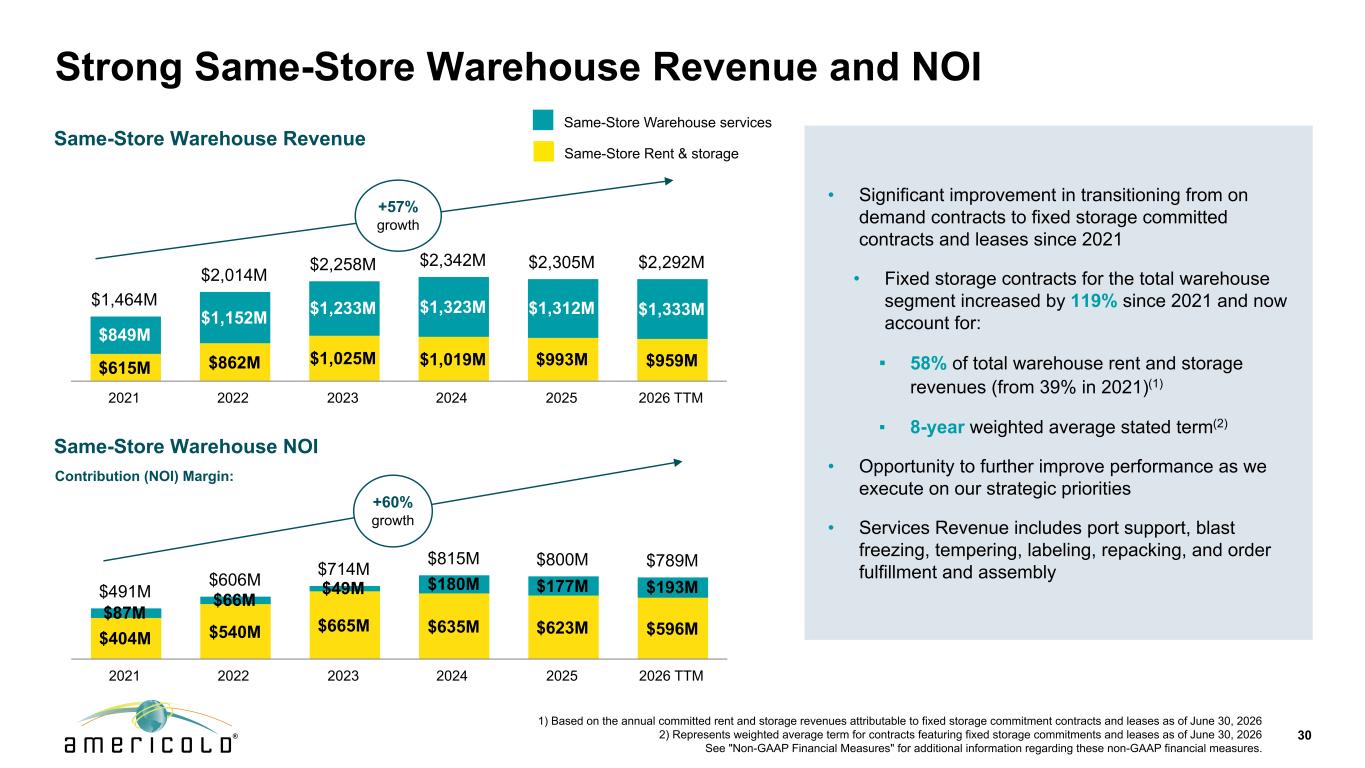
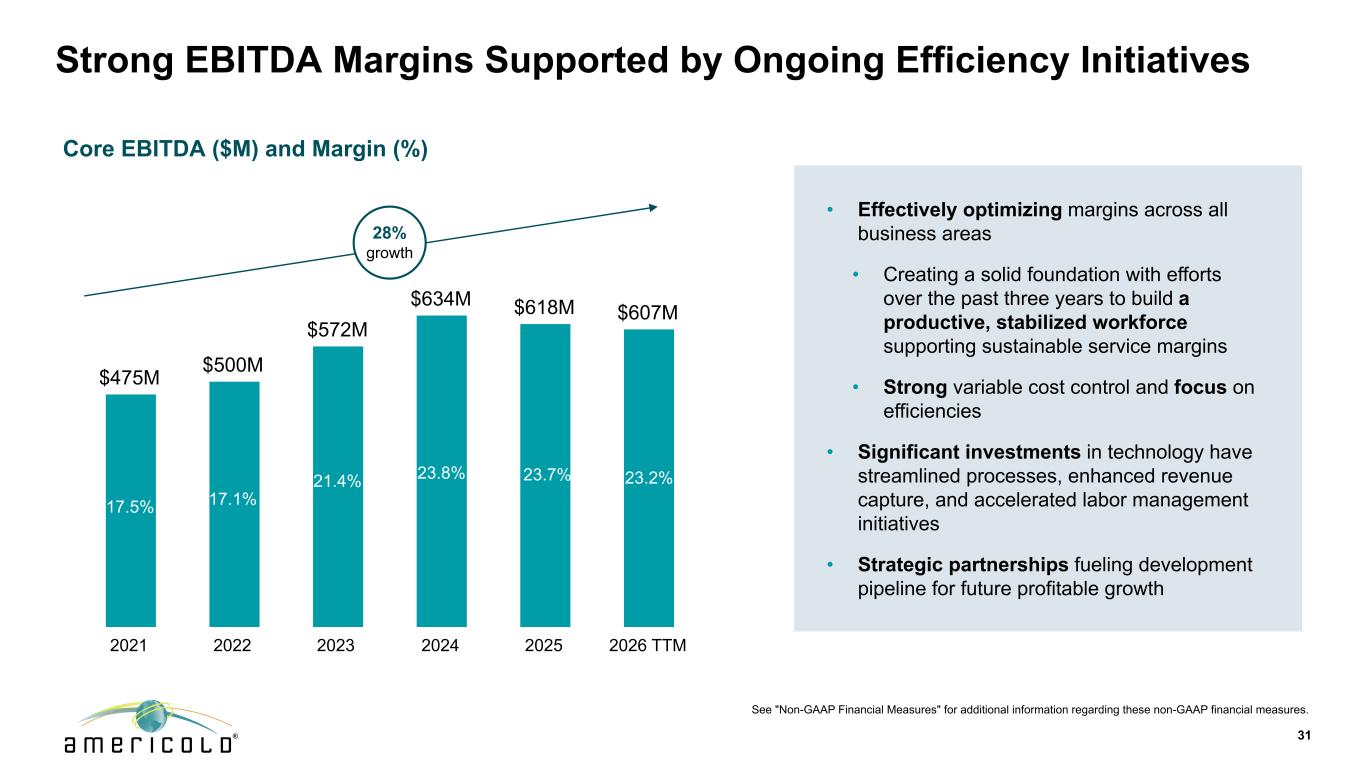
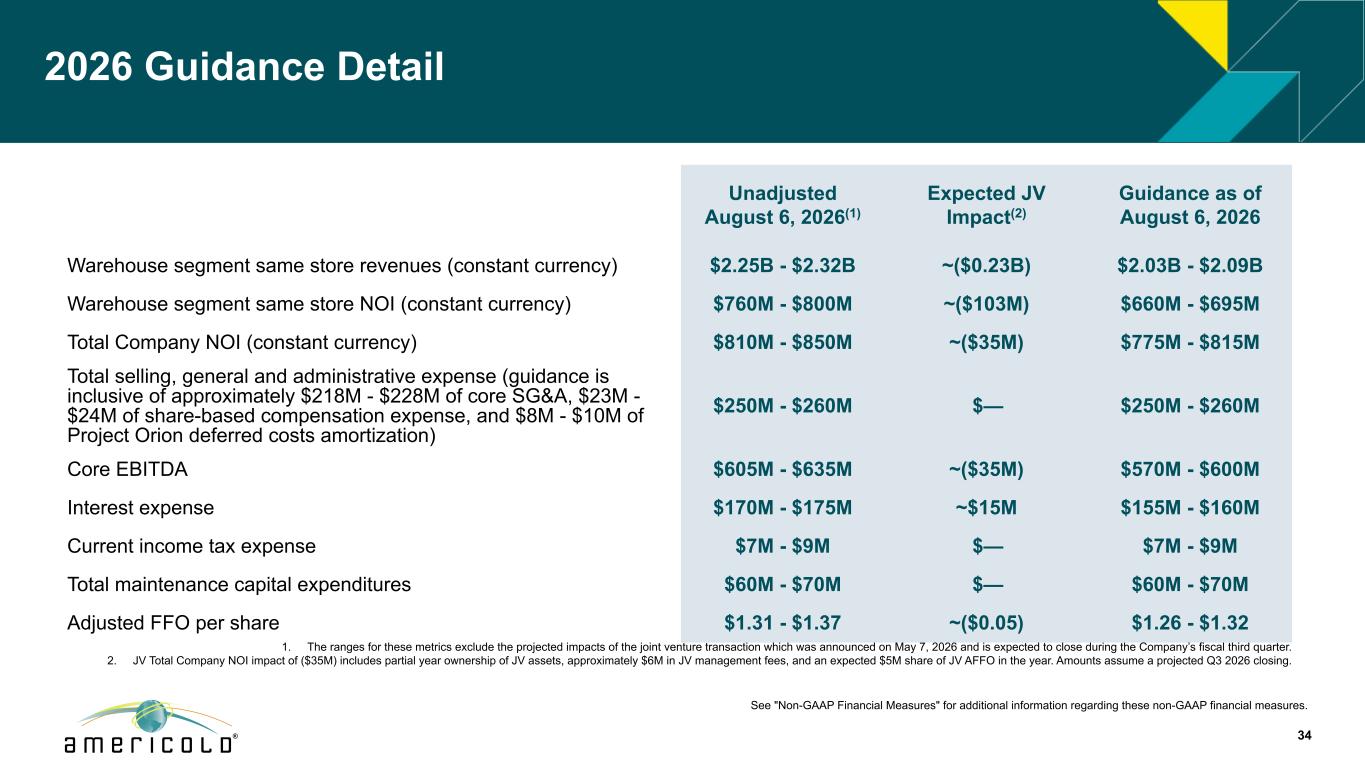
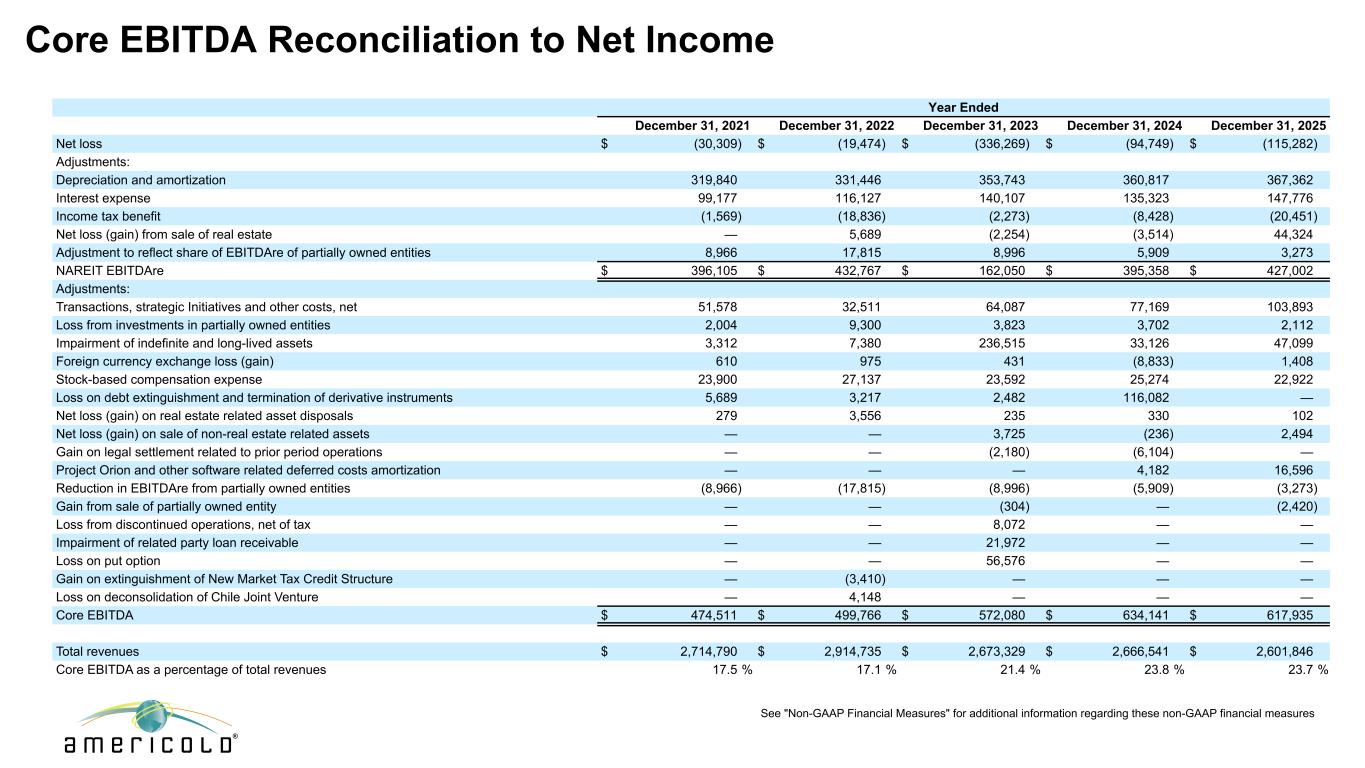
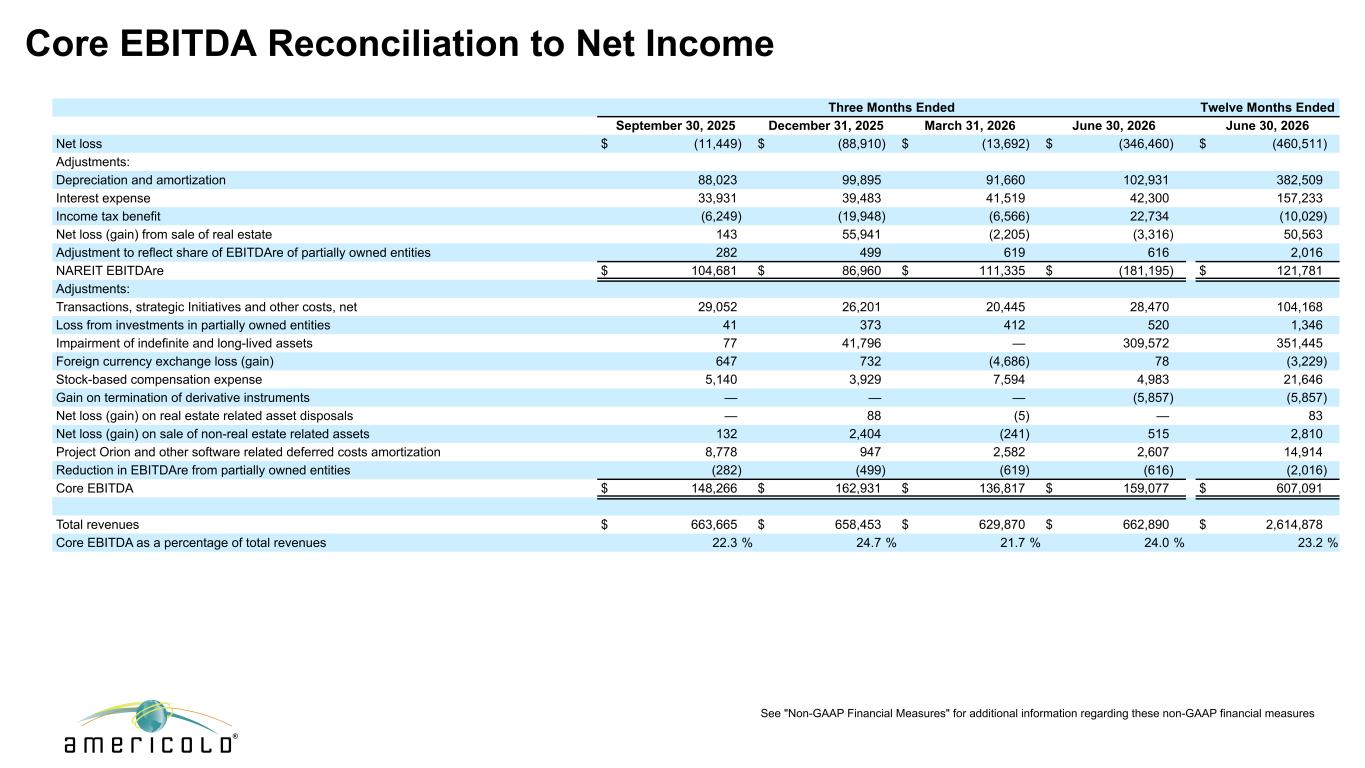
Thanks, Rob, and good morning, everyone. Before walking through the details of our outlook for the year, I want to clearly address comparability as our reported revenue, NOI, and occupancy levels will change going forward due to the change in portfolio composition from the previously announced joint venture transaction with EQT. Importantly, underlying operating performance continues to improve in line with the trends we are seeing across the business. As Rob mentioned earlier, we remain on track to close on the joint venture later this quarter. As we communicated during our last call, Maricold will contribute 12 assets to the joint venture with a total value of approximately $1.3 billion. As a reminder, this represents a blended cap rate of approximately 7% or nearly $3,300 per pallet position. Starting with our third quarter reporting, we anticipate recasting the same store pool and these 12 assets will come out of the total warehouse count and segment results. For your convenience and comparability, we have provided a pro forma version of the historical performance trend table on page 31 of the supplemental to reflect the recast of the You will remember that this is structured as a 70-30 joint venture, so going forward, we will record our 30% interest in the JV's net income on the line item titled Income Loss from Investments in Partially Owned Entities on our P&L. In addition, we will earn an annual management fee plus receive reimbursement for pass-through operating expenses such as power, labor, and other expenses associated with operating the facilities. Both the management fee and the reimbursement for the operating expenses will be recorded on a new line item within total revenues, and there will be other nuances in the accounting for the JV, which we will outline once the transaction closes. Similar to our disclosures for other minority-owned joint ventures, we will also add summarized financial information to the supplemental beginning in the third quarter, and our 30% share of earnings from this venture will be included in AFFO. As I mentioned earlier, as a result of the transaction, you will see lower reported results such as revenue and NOI as assets contributed to the JV will no longer be consolidated in those metrics. From a balance sheet perspective, the book value of the JV assets and related accumulated depreciation will be removed upon sale. We intend to use the proceeds from the transaction to repay approximately $1.1 billion of our outstanding debt. This includes all of our 2026 through 2028 U.S. dollar-denominated debt maturities. At the end of Q2, our total debt was $4.3 billion. So this $1.1 billion paydown would reduce our outstanding borrowings by approximately 25% and lower our leverage ratio by around three-quarters of return, providing us with increased financial flexibility and moving us closer to our target of six times or less. The anticipated dispositions of our idols and health-first sale assets in the future will also allow us to make additional progress towards this target. Now, I'd like to discuss the details of our revised outlook for the year. As you think about our updated outlook, it is important to distinguish between reported results and the underlying performance trends. While our reported revenue and NOI will be lower as a result of the joint venture, the year-over-year operating trends are largely unchanged and in most cases improving relative to original expectations. For modeling purposes, we are assuming that the transaction will close in the third quarter and note that the same store guidance metrics assume the removal of the sites contributed to the venture. For same-store revenue, reported levels will be lower by approximately $230 million due to the updated asset base. However, underlying growth trends within the portfolio remain consistent with or modestly ahead of our prior expectations. Assuming a third quarter close for the JV, we now expect same-store revenue to land between $2.03 and $2.09 billion for 2026. We're up slightly year over year at the midpoint based on the revised same-store pool, compared to our expectations coming into the year for a revenue decline of approximately 2.5%. Similarly, same-store NOI will also be impacted as a result of the JV, but operating trends in the base business remain similar and are supported by our ongoing cost initiatives. We are now expecting same-store NOI in the range of $660 to $695 million, with core EBITDA in the range of $570 to $600 million. For interest expense, we are expecting approximately $155 to $160 million for the full year, reflecting the benefits of the $1.1 billion debt paydown that I mentioned earlier. Our planning assumptions coming into the year assume that we would see some pressure on both pricing and occupancy. At that time, we thought that economic occupancy could be flat to down 300 basis points for the year, and pricing would be down by a blended rate of between 100 to 200 basis points. As Rob mentioned earlier, we have seen signs of continued stabilization in the industry and the results for the first half of the year have surpassed our original expectations. As a result, we are now forecasting these trends to continue for the remainder of the year. While the EQT joint venture is expected to create a headwind to AFFO of approximately five cents this year. We believe that the improvements in the base business will allow us to more than offset that impact. Given our performance in the first half of the year and the continued stabilization of industry trends, we are raising our full year AFFO guidance to $1.26 to $1.32 per share, an increase of four cents at the midpoint, and more than offsetting the projected dilution from the JV. You will note that we have also included a comparison in the supplemental and in our investor deck that includes an unadjusted comparison for your ease in identifying the expected JV impacts. As I consider where the business is today, we are seeing strong evidence that our actions against the five key priorities that we outlined at the start of the year are delivering tangible results. We have made significant progress towards strengthening the balance sheet, advancing our portfolio management efforts, maintaining a disciplined approach to development, and took meaningful actions to optimize our cost structure while continuing to serve as customers and win new business. We are not relying on a recovery in demand to create value. Instead, we are laser focused on executing against the priorities that are within our control. The combination of disciplined execution, a stronger financial position, and a gradually stabilizing industry reinforce our confidence in the outlook we have provided, and we believe that AmeriCold is well-positioned to deliver sustainable growth and long-term value for our shareholders. With that, I'll turn the call back over to Rob for some closing remarks.
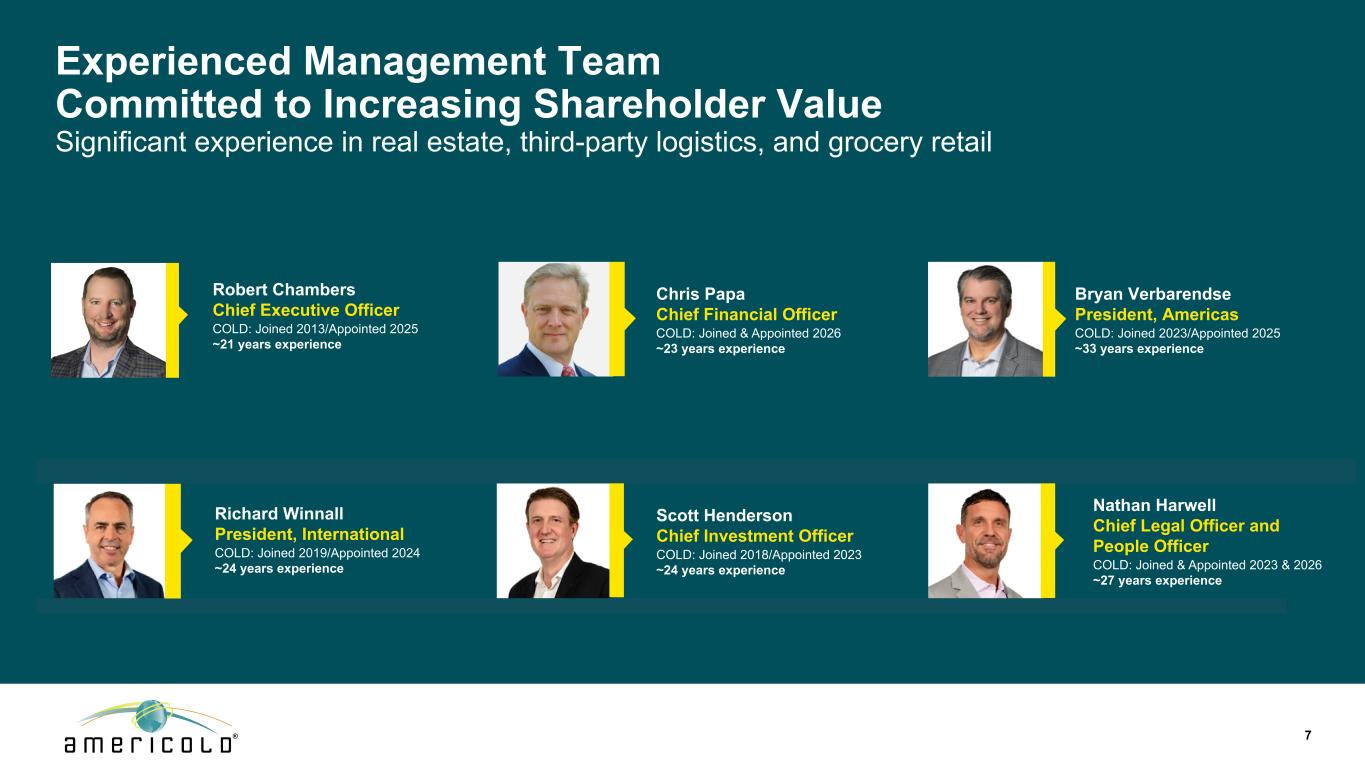
Rob? Thank you, Chris. As I mentioned in my opening remarks, we are encouraged by the continued signs of stabilization that we are seeing across the industry, and I believe that America is well positioned to succeed in this environment. Our results in the first half of the year have come in ahead of expectations, and we are delivering against the commitments we communicated to you at the end of last year. Our financial results are beginning to reflect that execution, largely because of the strong team we have assembled. The momentum we're seeing across the business is a direct result of the dedication and execution of our associates around the world, and I remain confident that we have the right people and the right strategy to continue delivering for our customers and shareholders. Having now been in the CEO role for almost a full year, I think it's a great time to reflect back on the work we've accomplished over that time. Four straight quarters by their meeting or beating expectations. Executing on a strategic joint venture with a strong partner to strengthen our balance sheet and provide future growth capital. Strengthening our management team with the hiring of Chris as our CFO and the strong real estate experience that he brings to the company. Actively managing our portfolio to identify the highest and best use for our properties while exiting low-performing sites. Winning significant new business around the world that expands our capabilities into attractive new sectors, and streamlining our cost structure to a more efficient overhead model. Looking ahead, our priorities remain unchanged. Disciplined execution, advancing each of our five strategic priorities, and delivering our financial commitments to shareholders. We believe the actions we have taken over the past year have strengthened AmeriCold Foundation and positioned the company for sustainable long-term growth and value creation. I remain confident in our team, our strategy, and our ability to continue creating value for our customers and shareholders, and I look forward to updating you on our continued progress in the quarters ahead. With that, Operator, we are ready to open the line for questions.
Operator
Thank you. We will now be conducting a question and answer session. We ask that you please limit yourselves to one question each. If you would like to ask a question, please press star 1 on your telephone keypad. A confirmation tone will indicate your line is in the question queue. You may press star 2 if you would like to remove your question from the queue. For participants using speaker equipment, it may be necessary to pick up your handset before pressing the star keys. One moment, please, while we poll for questions. The first question is from Michael Goldsmith from UBS. Please go ahead.
Good morning. Thanks a lot for taking my question. Physical occupancy increased more than 200 basis points sequentially, despite a period that's typically flat to down seasonally. It was also up 300 basis points year over year. So can you help us break that down a bit? How much of this improvement do you view as structural market share gains versus a temporary benefit from customer consolidation and inventory rebuilding? And then also, what gives you confidence that these occupancy gains can be sustained through the back half of the year and into 2027?
Yeah, thanks, Michael. Really appreciate the question. We were very pleased with performance, really across all of our key metrics. for the quarter, but physical occupancy was certainly a highlight. As you mentioned, it was up, you know, 200 basis points sequentially, nearly 300 basis points year over year. You know, why is that? I think first, we said at the beginning of the year, you know, that our customers had reached a point where their inventory was in line with demand, meaning, you know, there really wasn't a need for any further destocking like we had seen over the last few years. So, that was a very encouraging message that we heard earlier in the year. It pointed to stabilization from an occupancy standpoint. Why is it increasing? I think it's increasing, you know, really because of our strategy and because of our execution. And, you know, a big part of that execution was winning new business. You know, we've talked a lot about it um you know over the last 18 months we've won a record amount of new business and now we're seeing those volumes flow into our network um we also said and this this was one of our five key priorities that we were going to go after under penetrated sectors we've had great success there we brought our retail capabilities to europe and one new business with several large grocery retailers there um you know and our physical occupancy in that region is up significantly year over year. In Australia, we won the convenience business that's now ramping up and providing nice growth in that region. And then I think, you know, if I bring it to North America, it really is a share gain story here in North America, which is something that I'm very proud of. You know, we took a different strategy 18 months ago than most of the rest of the market. We watched, you know, most industry participants cut rate as a way to drive volume, and we took a different approach. We said we were going to let service win the day. We held steady on rate. You see that in our numbers every quarter, and we knew that that would come at the cost of some volume, but now we're in a position where we're already paid appropriately for the service that we're being provided. Our customers are realizing the value of that best-in-class service, and they're coming back to a miracle organically, and our churn rate is really low. So, you know, I think it's great execution. It took a lot of conviction, you know, but our strategy is clearly working. So, you know, I think it's sustainable market share gains and new business wins that's driving that.
Operator
The next question is from Michael Griffin from Evercore ISI.
Operator
Please go ahead.
Great, thanks. I know Chris mentioned in his prepared remarks that the updated operating expectations expect trends to continue in the back half of the year. I was wondering if you can quantify that. Does that imply sort of flattish economic occupancy and maybe slightly positive growth on pricing? And then maybe, Rob, as you look at the business more holistically, the economic occupancy spreads about 860 bps in the quarter. Is that a good run rate that we should think about going forward? And I realize you're not relying on a recovery in demand, But do you think that this is a business that can get back to, you know, call it low, lowish 80s economic occupancy over time? Do you think there could be a pickup? Just curious, some thoughts there as it relates to the ultimate trajectory of economic occupancy as well.
Sure. I'll hit on the second two and ask Chris to talk a little bit about guidance, expectations. I mean, as it relates to the spread between physical and economic occupancy, we were really pleased to see that spread tighten within the quarter. You know, obviously, you know, some growth in economic occupancy with outsized growth and physical occupancy resulted in that gap coming in to kind of high single digits. And I do think that that's, you know, a relatively stable expectation. You know, there's maybe another 100, you know, basis points or so, but I think a high single-digit, you know, gap is very reasonable and something that, you know, we're comfortable with and our customers are comfortable with. As it relates to where occupancy, you know, can go longer term, certainly we think occupancy can get back, you know, into the 80s. We were there for a long time. We think there's the opportunity to get back there. you know, we're doing, I think, all the right things to kind of manage the right split between, you know, being disciplined in pricing and also going out and trying to win new business. And I think our strategy is working and that you can absolutely expect the ability for us to bring that economic occupancy back up into the 80s over time.
So we're excited about that opportunity obviously the results you know get pretty compelling when we when we get to that point uh and that's something that we're we're focused on doing yeah and then i think for you know just expectations i think you know we really see things you know somewhat sustaining for the rest of the year maybe picking up a little bit you know it's it's really within the range of our expectations for occupancy on the same store basis uh to be you know improved from where we were, we originally said zero to 300 down. Now we're thinking it's probably going to be a little bit tighter, maybe 100 up to 200 down for the year. And then on revenue, we see that somewhat flat and maybe slightly positive for the year.
Operator
The next question is from Todd Thomas from Key Bank Capital Markets.
Operator
Please go ahead.
Yeah, hi, thanks. Good morning. Just wanted to follow up on some of that. I guess, you know, Rob, it sounds like the majority of the increase in physical occupancy is new business, because I think physical would be flatter, lower sequentially otherwise. Are you seeing any signs of inventory restocking from your customers at this point? And similarly, throughput improved sequentially in 2Q, was higher year over year. Was that largely attributable to new customer wins as well and just having more volume ramping up and flowing through the warehouses, or are you seeing an increase in throughput more broadly? And what's the expectation for throughput to remain positive year over year as we think about the updated guidance in the second half?
Thanks, Todd. On the throughput piece, yeah, it was great to see throughput up for the quarter. That's largely driven by new wins. I mean, we were very intentional in terms of going out and trying to bring, you know, our retail capability more broadly across the portfolio. Some big wins in Europe. We've been talking for a while about the convenience store distribution wins that are material in our Asia-Pac business. Those are very fast-turning product. Growth in our e-commerce business has been outsized relative to the rest of the portfolio. another fast turning, you know, type of business. So I would say it's the new business wins that are driving the higher throughput, which, you know, is very impactful for us. And yeah, I mean, the physical occupancy gains are something that was a mix of both market share and new business wins, you know, driven by really, really strong. We would expect that to continue.
Speaker 13
And, you know, and we're encouraged to see those trends all head in the right.
Operator
The next question is from Victor Feddiv from Scotiabank.
Operator
Please go ahead.
Good morning, everyone. Thank you for taking my question. Chris, can you provide us with an update on the breach from warehouse same-story NOI to total NOI? Because I understand that it now includes equity, JV, but non-same-story NOI appears to be contributing more meaningfully to guidance than originally contemplated. I think you said $15 million to $30 million as of Q4 update. And also, what share did Lancaster and Plainville represented in that number at the beginning of the year and now?
Yeah, I mean, as far as a bridge, I mean, if you look at the guidance we provided, I think you can see the change period over period. I would focus on the unadjusted columns to get a real view of what's happening with both same-store revenues and same-store NOIs. What you're seeing in the actual guidance we provided is the JV properties would be coming out of that. If you look at the detail back on 31, you'll see the breakout there of the JV properties. and it largely is similar. There is some non-same store within the JV pool that is also coming out, which offsets that. So, but overall, I would say our non-same store properties have come down a bit and are reflected in the guidance. And some of that is just due to the market conditions, things just taking a little bit longer in this environment from a lease-up standpoint. point.
Speaker 13
So we can certainly provide more color offline if needed.
Operator
The next question is from Blaine Heck from Wells Fargo.
Operator
Please go ahead.
Great. Thanks. Good morning. When you think about food costs and inflation, can you just comment on how you're feeling about the latest statistics and trends along with your forward expectations or, you know, what you're hearing from clients about promotions? You know, are there any specific product areas that you expect to see better stabilization and others that continue to suffer most from inflation?
Sure, thanks. It's still a challenging environment, right? I mean, I'm really proud of the execution that we've been able to achieve in this environment because, you know, there hasn't been a lot of, you know, there hasn't been a big, you know, change since the beginning of the year in terms of some of the, whether it be food inflation or input costs or the environment that a lot of lower end, you know, consumers are dealing with. So, you know, much of that is still consistent with what we described at the beginning of the year. Our customers are still dealing with higher input costs for their product, which makes it hard for them to kind of roll back products or prices sustainably. Consumers haven't gotten a whole lot of relief just yet from inflation or higher interest rate costs, costs at the pump. So, I think it's still a challenging environment out there, but there are some green shoots. I think the more that you dig in, you see that, as an example, wage rate growth for lower-income consumers has been growing pretty significantly over the course of the last quarter or so. That's really good news for us to see that there are some wage rate gains there in the lower end. I think our customers are spending a lot on promotional activity to try to drive volume. And then the other thing that is an important factor, and this helps with safety stock, is that customers continue to find ways to innovate to adapt to shifting consumer trends. So we've seen a lot of new activity, whether it is higher protein-type SKUs, higher fiber-type SKUs, lower serving size. type SKUs, all of that drives incremental safety stock, even if it doesn't necessarily drive overall volume sales at the grocery store. So, you know, I think we're hanging in there. We're not counting, again, on a big demand recovery or inflection throughout the back half of the year to achieve our guide. I think, you know, if we were to see that, that would represent upside to our plan and upside into next year. What we're really focused on is controlling what we can control. And you can see we're doing a great job of that. At the end of the day, for us to be able to have a quarter where we say our physical occupancy is up, our economic occupancy is up, our throughput is up, our storage rate is up, our handling rate is up, and our G&A is down, I think it's phenomenal.
Operator
The next question is from Brendan Lynch from Barclays.
Operator
Please go ahead.
Great. Thanks for taking my question. Just a couple on the Lancaster and Plainville assets. Can you talk a little bit about the prospective buyers, if you anticipate these will be run at cold storage facilities going forward, and how we should think about your development of automated facilities going forward as well?
Yeah, we're actively marketing those two buildings for sale. It's a broad, broad base of folks that would be potentially interested in these facilities. It could be end users of the buildings themselves. There's the opportunity that it could be used for a combination of both cold and dry going forward. So I would say, you know, a broad base of users, and the buildings are already listed for sale. And, you know, I think there's the opportunity for meaningful proceeds that could be reallocated to other projects. And, you know, I think we've really strengthened our development platform over the last few years. We've brought in great talent, great expertise. You see that in our track record here on recent development projects where they've all been delivered on time and on budget. So, you know, our focus on development remains unchanged other than to say that, you know, it really going forward is more refined to lower risk projects from an underwriting standpoint with regard to leasing up and customer dedicated projects. but our ability to execute there has increased significantly over the last few years as we've strengthened our team.
Operator
The next question is from Nick Tillman from Baird.
Operator
Please go ahead.
Maybe following up on those lines regarding just the whole termination, I mean, what concessions did you get out of the deal? Obviously, there's no termination fee associated with it. Like, how many projects did they renew in, and what terms did you kind of get extended on those existing fixed commitments and then just overall as we think about the development yields how much of the change you guys now are disclosing the updated ones with those two assets being moved out of that pool is the yield change strictly from from that mixed shift or is there some other I know Chris had mentioned that he was going to look a little bit more at the yields overall and the underwriting has there been any other shift in in the overall yields on the on the current pool as well.
Yeah, I'm not going to get into a ton of detail around the commercial relationship other than to say that the relationship is very, very strong. So, you know, this was a decision that we made, you know, kind of mutually and we were able to, or we will be relocating, you know, a significant amount of the volume that was in our Pennsylvania facility today to another location within the Americal Network. We were able to extend existing agreements that we already had and other. That relationship remains very, very strong. As it relates to the development yields going forward on other projects, all the delivery dates, the upfront construction costs, all of that remained very consistent across the rest of the projects that were in the schedule. It's a testament to our team's ability to deliver these projects on time and on budget. I think we took a little bit more of a conservative view on some of the rate expectations, just given the current market environment relative to when some of these were underwritten, but outside of that, no other real changes.
Operator
The next question is from Alexander Goldberg from Piper Sandler. Please go ahead.
Oh, hey. Good morning. Just a question, as you guys are expanding into the QSR, Pets, Floral, Candy, and all these sort of adjacent sectors, who are you finding is the competition? Is it, like, big, like, entrenched competitors, or is it a lot of small mom-and-pops? Just trying to get a sense as you guys expand, you know, what sort of competitive set you're going to run into.
Yeah, across the board, to be honest with you. I mean, we see the opportunity to take share from smaller competitors. both in the traditional, you know, cold storage space and that are more specialized in whether it be pharma, floral, pet food. I would say that there's the opportunity for some of this business to be outsourced. So in many instances, some of this is actually done by the end customer. And there's a pretty compelling value proposition and case for a lot of this business to be outsourced. And then in other instances, it is larger, more entrenched, you know, competitors where a lot of our customers don't want to deal with those larger entrenched competitors anymore and are looking for new ways to kind of change and shift the business model. And in those instances, AmeriCold is here to help as well. So it's really coming from across the board.
Speaker 13
And, you know, early success in many of those instances is very encouraging.
Operator
The next question is from Michael Carroll from RBC Capital Markets. Please go ahead.
Yeah, thanks. Rob or Chris, maybe, can you discuss how the EQTJV impacts the same-store trends? I know it looks like the unadjusted same-store-wide growth is up about 250 basis points versus your prior guidance to about down 2.2%. Does EQT move these numbers around? Like, for example, is the EQTJV assets expected to be above or below that specific target as implied in guidance?
Yeah. I mean, if you look at the recast pool, you'll see that we're now forecasting same-store revenues for the pool of, you know, call it around negative 1.1% to a positive 1.8%. And then on the same store, NOI, it could be around negative five to just positive 0.1%. If you look at the page 31, you can kind of back into the results for the JV itself. And if you look at that, I think it is, you know, somewhat representative. It's, you know, for the full year, it should be around down 1% or so overall on revenue. So, within the range and on NOI, it could be down at about 60 basis points. So, again, inside the range. Remember that that pool is a little bit more of a defensive pool, a little bit more highly occupied. So, I think that's representative of what you're seeing here. But the information, if you go back to 30 and 31, you do have all the information, I think, needed there to help reconcile, as well as if you look at the unadjusted numbers we provided, we really try to provide that clarity for you to back into those numbers that I just went through.
Operator
The next question is from Craig Mailman from Citi.
Operator
Please go ahead.
Hey, guys. um maybe big picture you know you guys are talking a lot about things normalizing your peers saying the same thing which is all positive right you guys have basically a 10 cent gross guidance increase offset by the eqt jv um but underneath right like a lot of that 10 cent increase was the gna savings call it 80 plus looking at the 25 million depending on timing your fixed commits the renewals are going 12 to 18 months versus five years you took that big impairment on the hold assets and didn't extract a ton of lease term fees from them i'm just trying to get a sense of the where we are in the the power dynamic of landlord versus tenant um because it feels like the tenants are comfortable kind of rolling the dice and not locking in and you guys are still in landlords generally not you guys specifically but landlords are still in the protect occupancy phase um so you know correct me if i'm wrong in this viewpoint or you know put some clarity around kind of what you think the the business cycle where we are in that recovery stage yeah yeah great i mean let me you know correct one thing i mean the the guidance
increase is a result of our occupancy outperforming expectations, our pricing on storage outperforming expectations, our pricing on handling outperforming expectations, and our throughput outperforming expectations. The guidance on the G&A is flat from our prior original guide to where we are today. You know, we are going to get after a lot of the savings that we discussed, but a lot of those savings that we talked about will be, you know, things that we do between now and the first quarter of next year. So that's not what's driving the favorability. It's the underlying business trends. You know, I think where we are in the cycle is very much consistent with what we've been saying now for the last few quarters, which is we're in a stabilized environment where demand and inventories are aligned, and that demand is off of a relatively low base. We've not seen, you know, significant improvement in the environment just yet. I think, you know, there's no reason to believe that that won't be something that happens over time, but we're not counting on that to achieve our guidance for this year or to put ourselves in a good position for next year. We're focused on what we can control, and, you know, the results speak to great performance and great execution there. So, I think we can win in this current environment, and I think that if it gets better from here, that represents upside to both our guide and to where we could go in 2027 and beyond. So, yeah, we're comfortable winning in this environment, and we've been doing it now going back to the past.
Operator
The next question is from Mike Mueller from J.P. Morgan.
Operator
Please go ahead.
Yeah, hi. Just a couple quick number questions here. One, your CapEx guidance, how come it stays steady and just doesn't decline as your, you know, NOI does post-EQT transaction? And then just, can you just talk a little bit about the power cost, just what's driving those components and the time to pass through?
Yeah, I mean, we held our CapEx guidance where it is. Obviously, as we're prioritizing projects during the year, we felt comfortable just leaving that as is, even with the joint venture. And then from a power cost standpoint, I think we are, similar to last quarter, seeing And, you know, some cost pressures there across the board on rate. I mean, we do have mechanisms to pass through adjustments for increased costs. I mean, obviously those mechanics can vary, but that is something that we try to do and keep on top of in all our contracts.
Yeah, Mike, you saw storage rate per pallet flip from slightly down in Q1 to up in Q2, and the reality is that's largely driven by power surcharges. So we have a lot of operational opportunities that we focus on to try to, you know, keep power relating beyond our expectations. But, you know, in the current environment, it's a headwind year over year, and so we just...
Operator
This question is from Rob Simone from Compass Point.
Operator
Please go ahead.
Hey, guys. Thanks a lot for taking the question. Kind of a longer-term thought or trying to understand the longer-term thinking here. So after this JV, and especially if, you know, you guys are talking about potentially getting back into the 80s on physical and economic occupancy, there's this path towards where at least your consolidated balance sheet can get sub six times leverage pretty quickly. So up until now, it's been executing and getting to that point, and you guys have been doing that. So kind of what comes next? After you hit that mark, how do you think about priorities for capital allocation beyond that once you're more conservatively levered? Thanks a lot for taking the question.
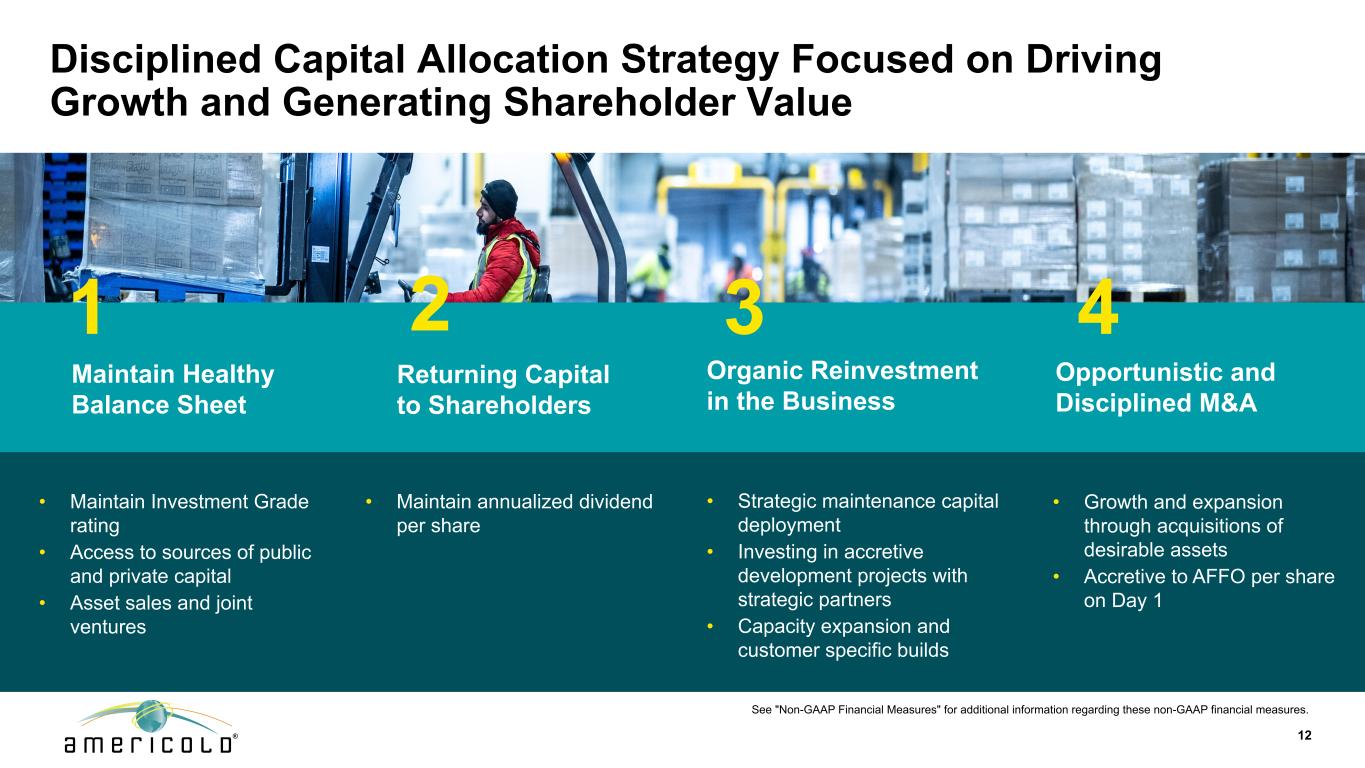
Yeah, thanks for the question, Rob. I mean, I think you're right. It's actually to get the balance sheet uh more stable and i think you know from here um it gives us flexibility we can we can really continue to to de-lever and get to where we want to go by kind of more hitting more singles and doubles from from here than having to do anything else you know significant um i think between organic growth i think between cost savings um in the p&l i think our development projects where we've already spent the capital and it will be EBITDA that comes online without necessarily having to make any other investment. All of that helps de-lever the balance sheet meaningfully. From there, from a capital allocation perspective, we're going to prioritize things that create the most shareholder value. I think there still is a development opportunity or there's still significant development opportunities out there with customers that we need to be focused on to continue to support their growth. I think that as we see the industry potentially have some dislocation, there could be the opportunity for some strategic M&A to the extent that seller expectations, there's a lot of no shortage of opportunities, I would say, once we get into a position where we feel comfortable and we're well on our way thanks in large part to question is from Vince Tybone from Green Street please go ahead good morning um please just provide a little bit additional color on kind of what actually took
place with Yahoo facilities um kind of just what made them unique and ultimately caused them to fail versus other automated facilities that you you know recently developed that were successful and fully operational today?
What I'd say there is we recently expanded the review from a portfolio management standpoint to include development projects. These were buildings that were designed back in 2019 by prior management teams, very, very complex retail automation. They don't look anything like the type of automation that you see in most facilities to support traditional food manufacturers. So there were a lot of unique requirements. And Pennsylvania was operational. It was just not ramping in a manner that met our return expectations or some of the service level agreements to our customer. And so we made a mutual decision there to unwind that, and Connecticut was the same kind of sister facility, so we made the decision with both at the same time. We think it was prudent to reallocate this capital to other high-performing assets and opportunities, and we have a lot of very successful automated facilities all around our portfolio. And, you know, this is part of an active mix of assets going forward, and that's exactly what we got accomplished through.
Operator
This concludes the question and answer session, as well as today's teleconference.
Operator
You may disconnect your lines at this time. Thank you for your participation.