Operator
Good morning. Welcome to F&G's fourth quarter and full year 2025 earnings call. During today's presentation, all callers will be placed in listen-only mode. Following management's prepared remarks, the conference will be open for questions with instructions to follow at that time. I would now like to turn the call over to Lisa Foxworthy-Parker, Senior Vice President, Investor in External Relations. Please go ahead.
Thanks, Operator, and welcome, everyone. I'm joined today by Chris Blunt, Chief Executive Officer, and Connor Murphy, President and Chief Financial Officer. Today's earnings call may include forward-looking statements and projections under the Private Securities Litigation Reform Act, which do not guarantee future events or performance. We do not undertake any duty to revise or update such statements to reflect new information, subsequent events, or changes in strategy. Please refer to our most recent quarterly and annual reports and other SEC filings for details on important factors that could cause actual results to differ materially from those expressed or implied. This morning's discussion also includes non-GAAP measures, which management believes are relevant in assessing the financial performance of the business. Non-GAAP measures have been reconciled to GAAP where required and in accordance with SEC rules within our earnings materials available on the company's investor website. Please note that today's call is being recorded and will be available for webcast replay. And with that, I'll hand the call over to Chris Blunt.
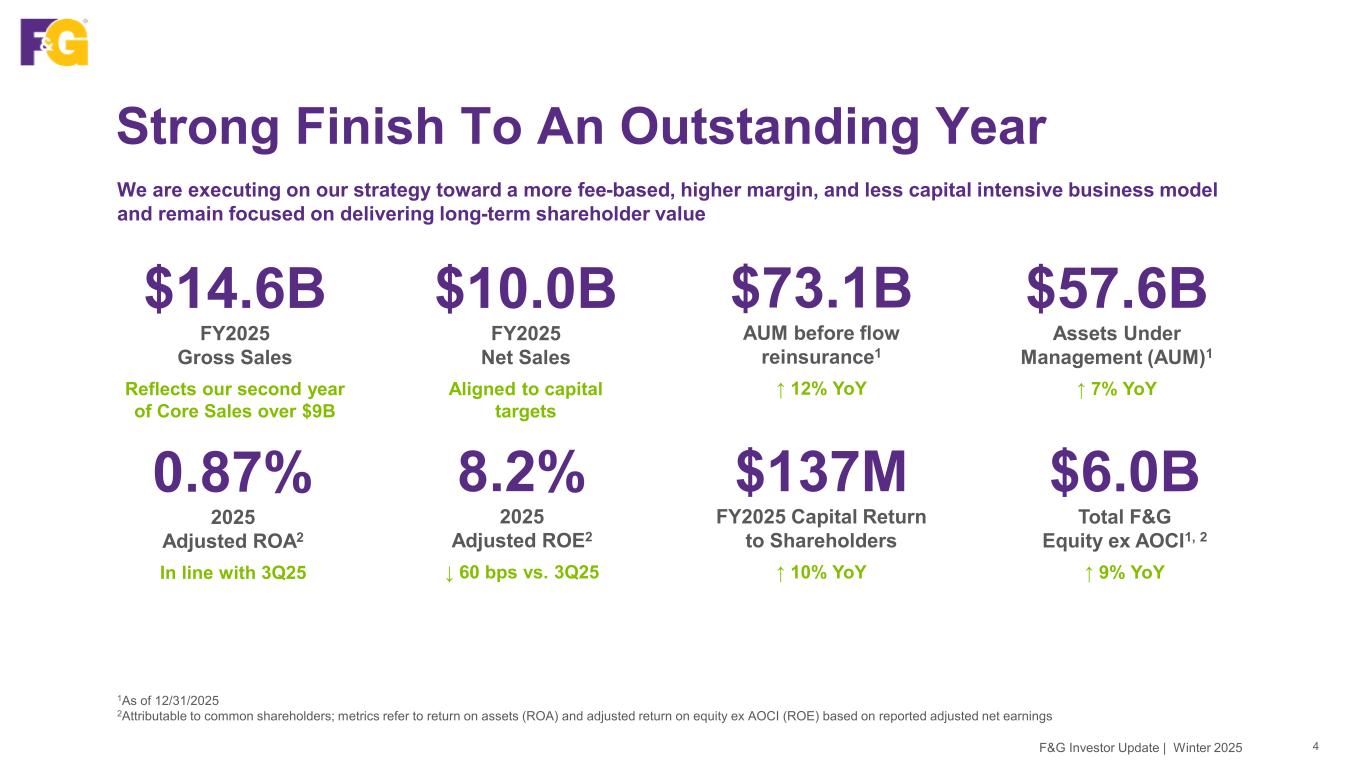
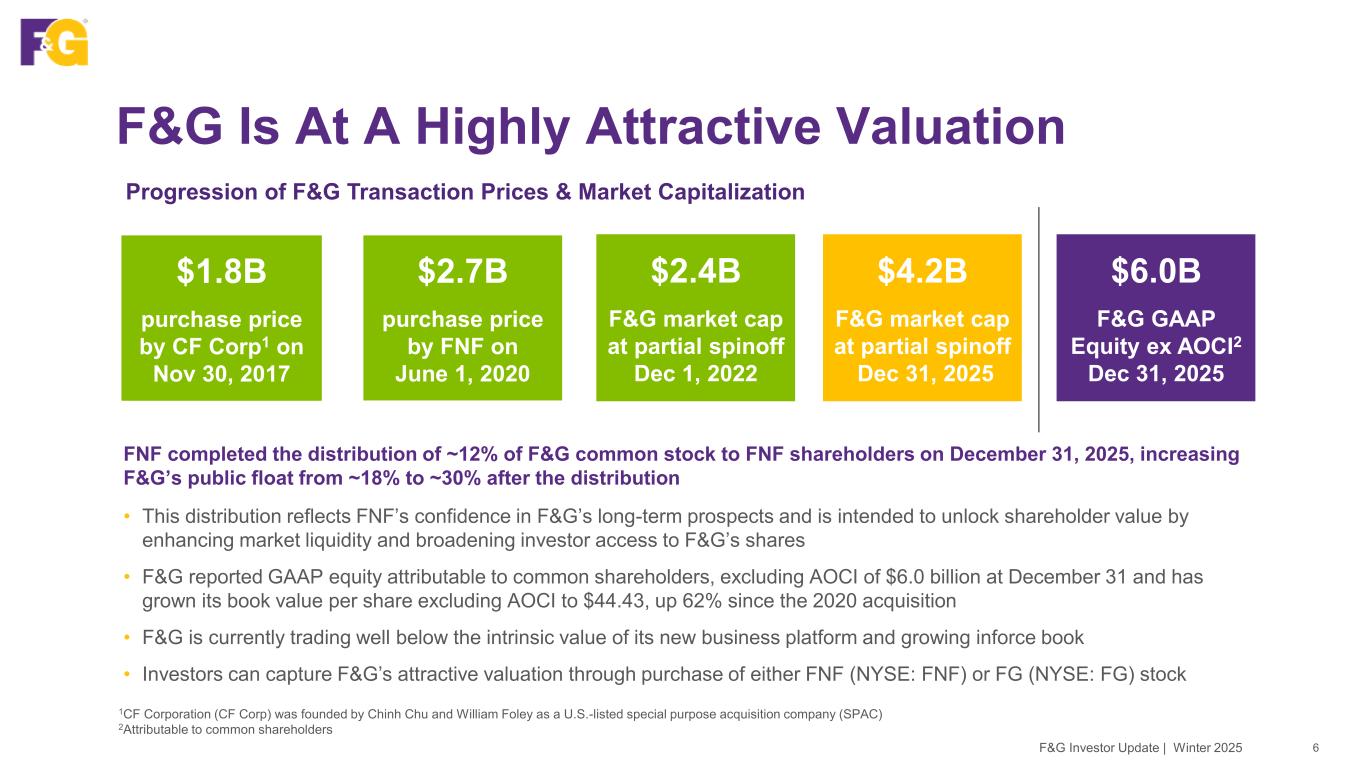
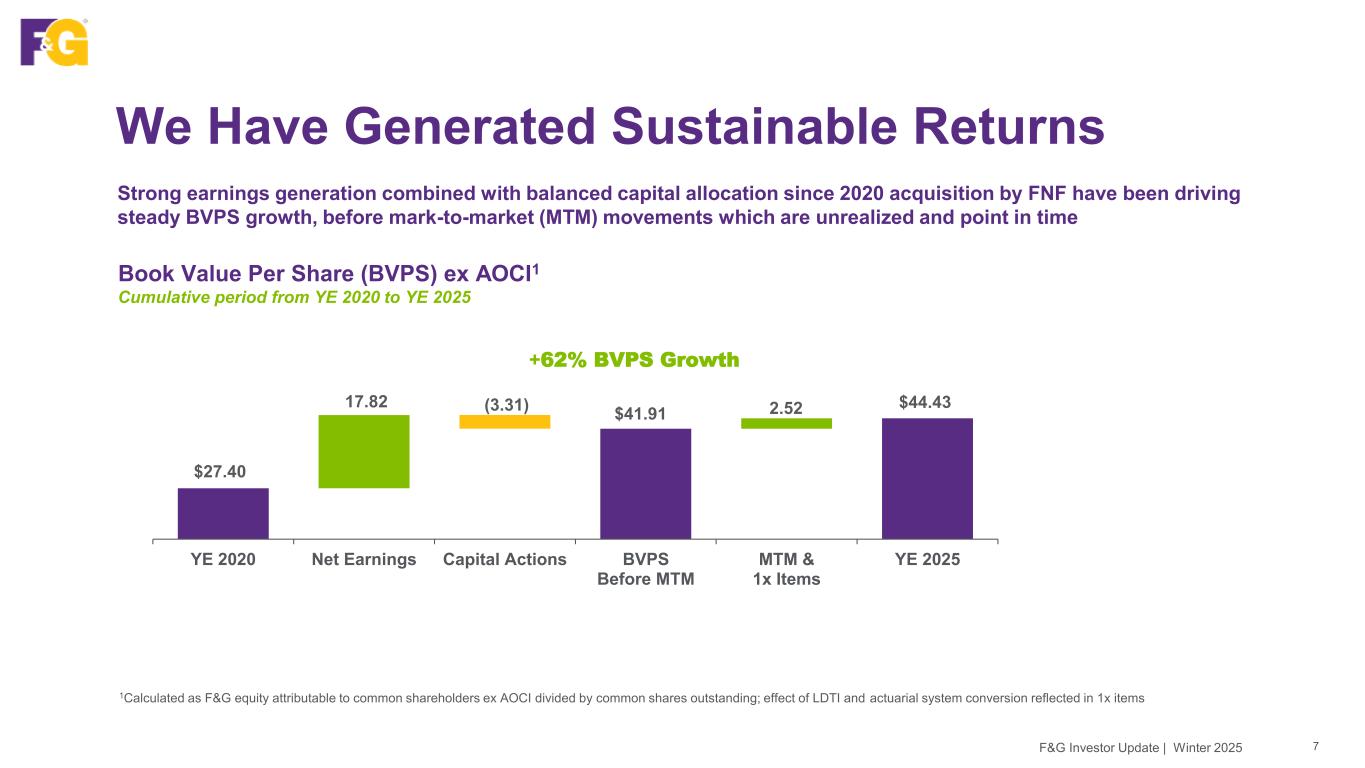
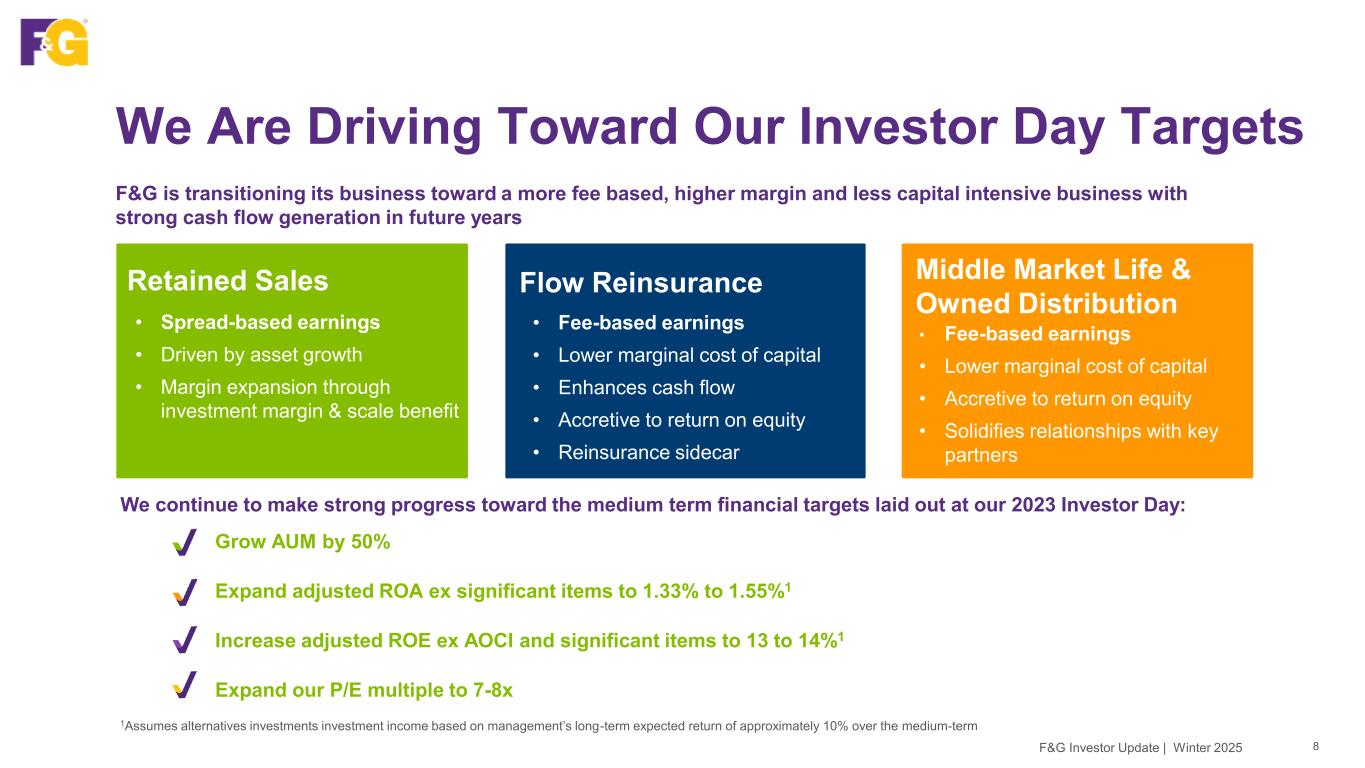
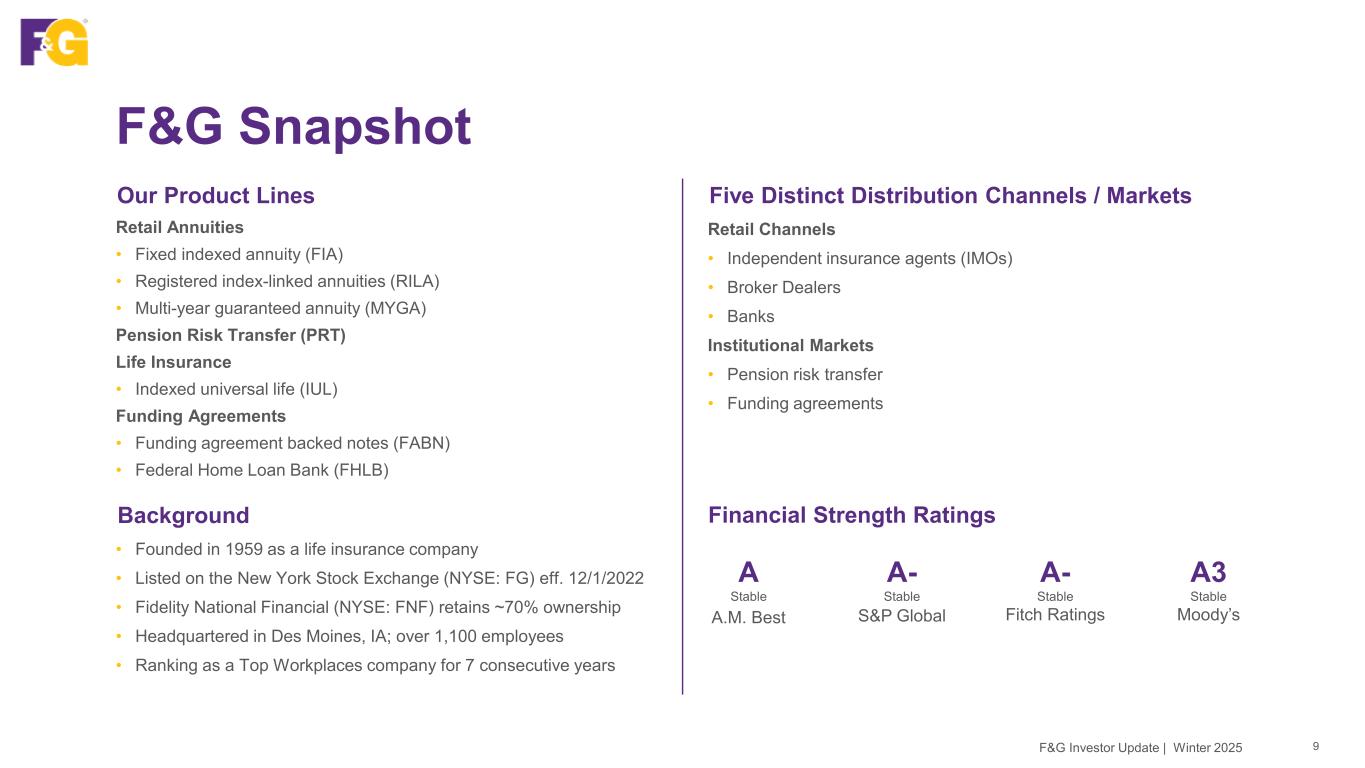
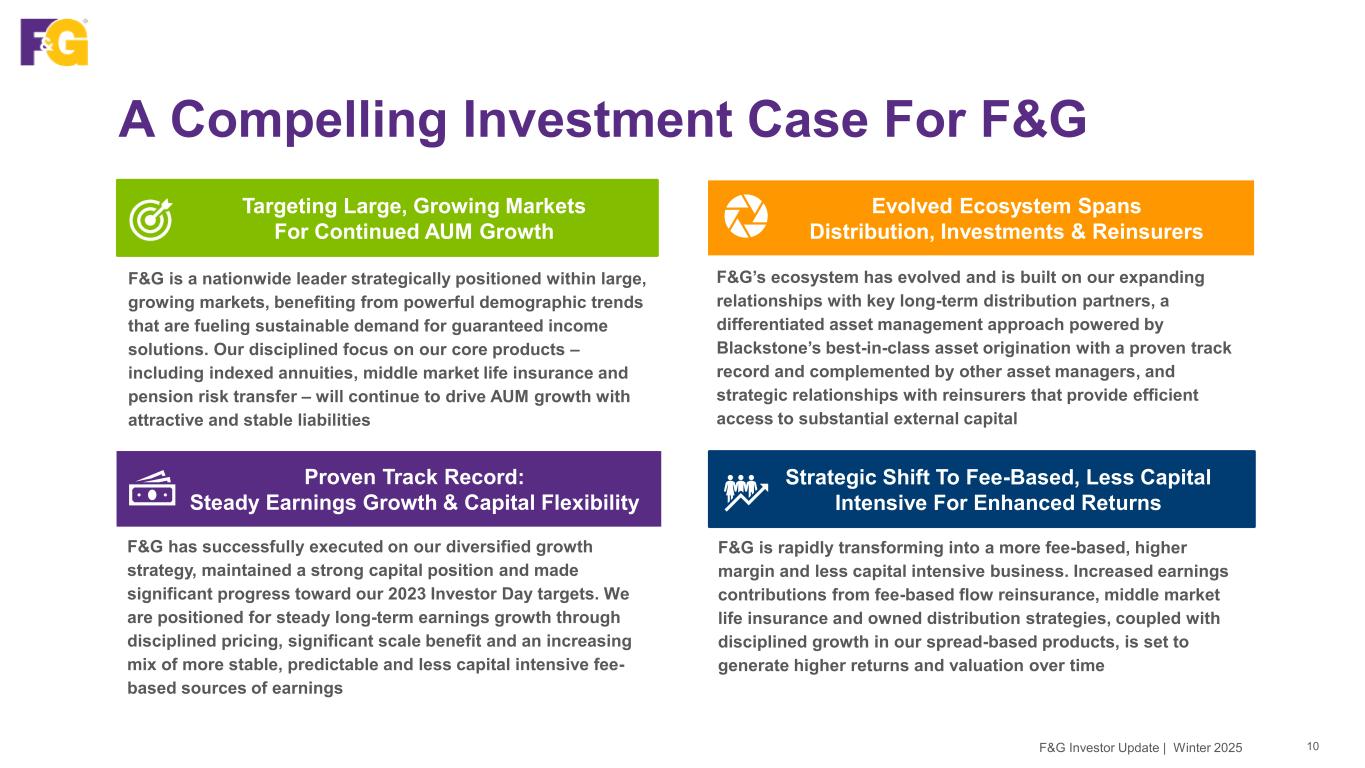
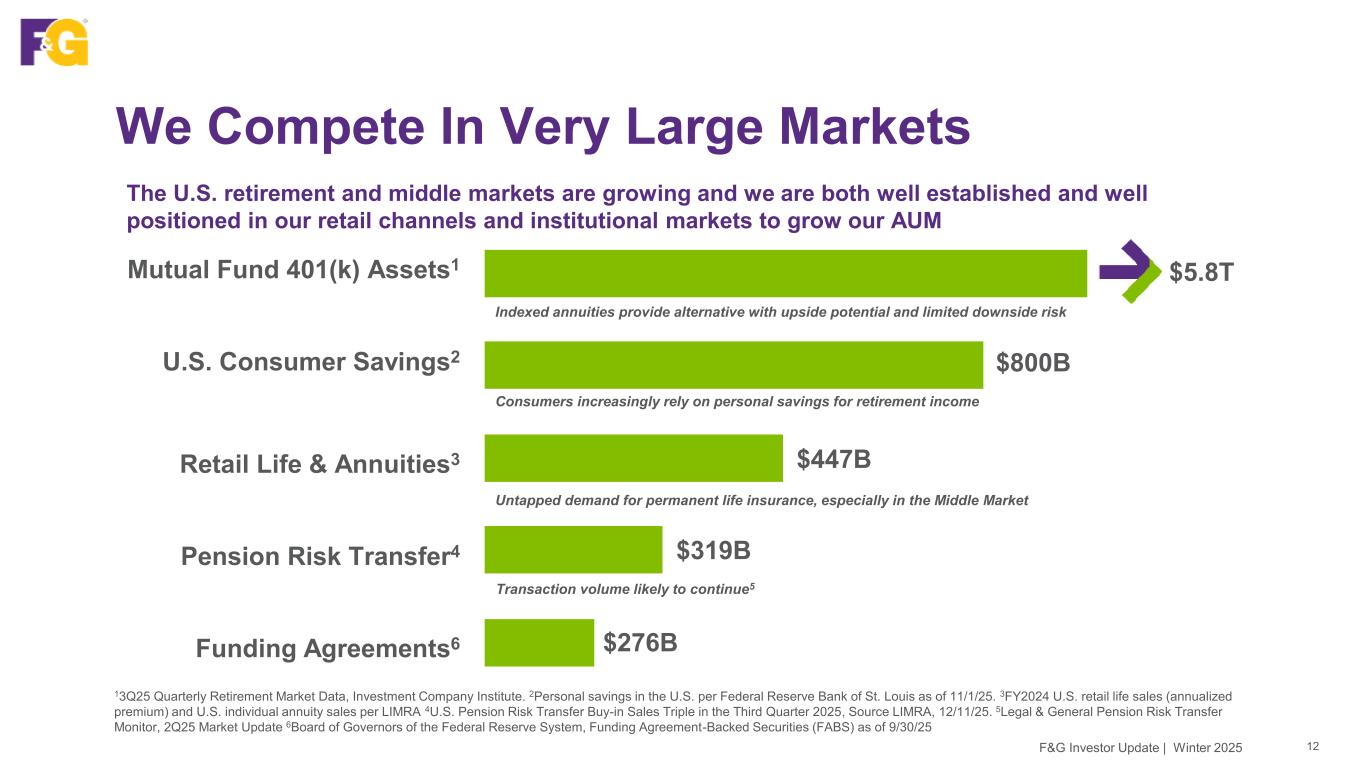
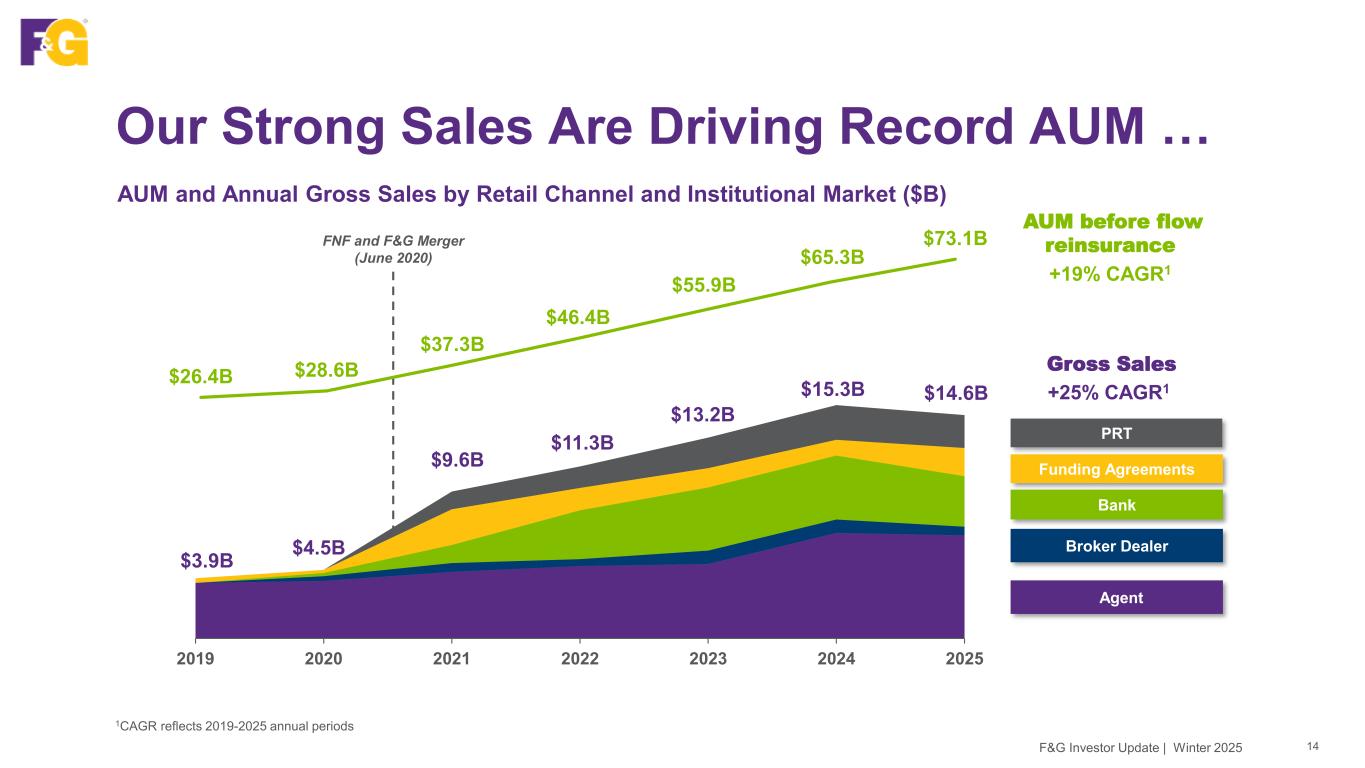
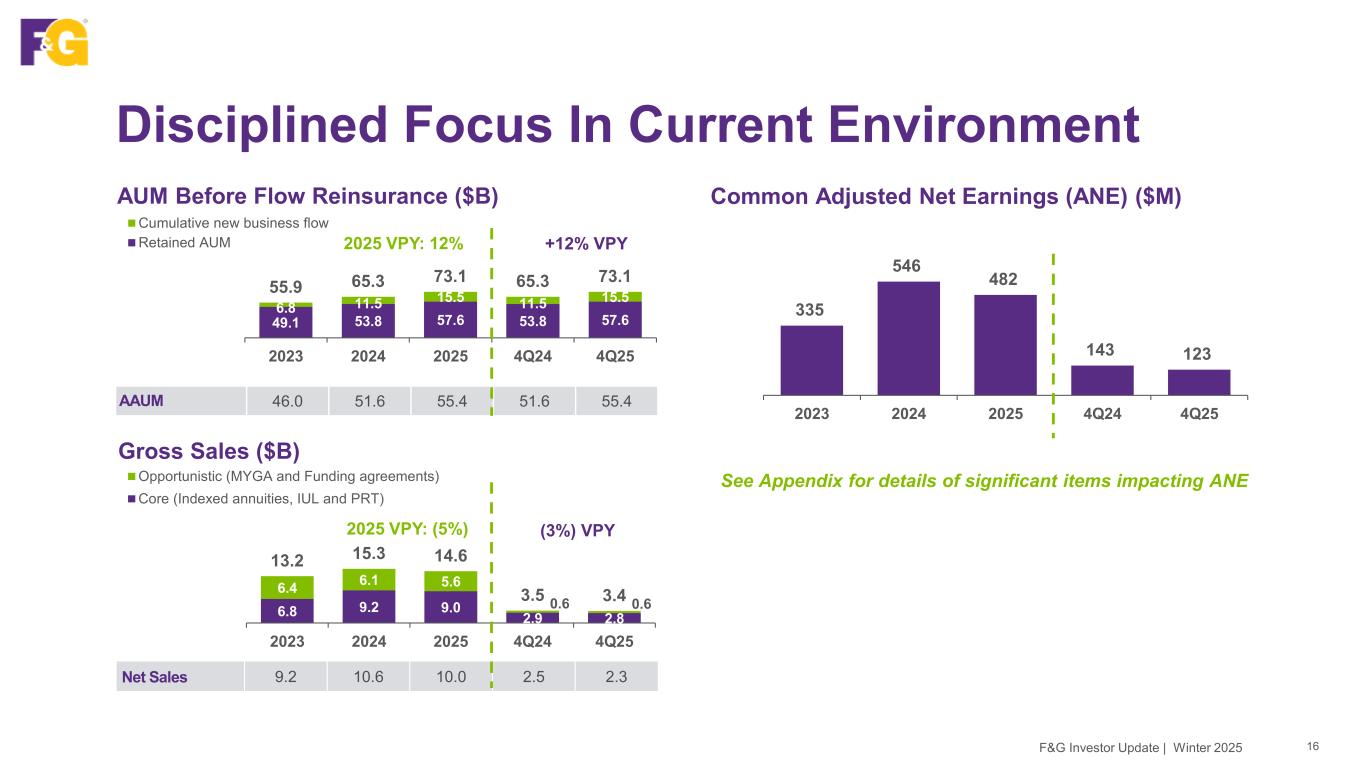
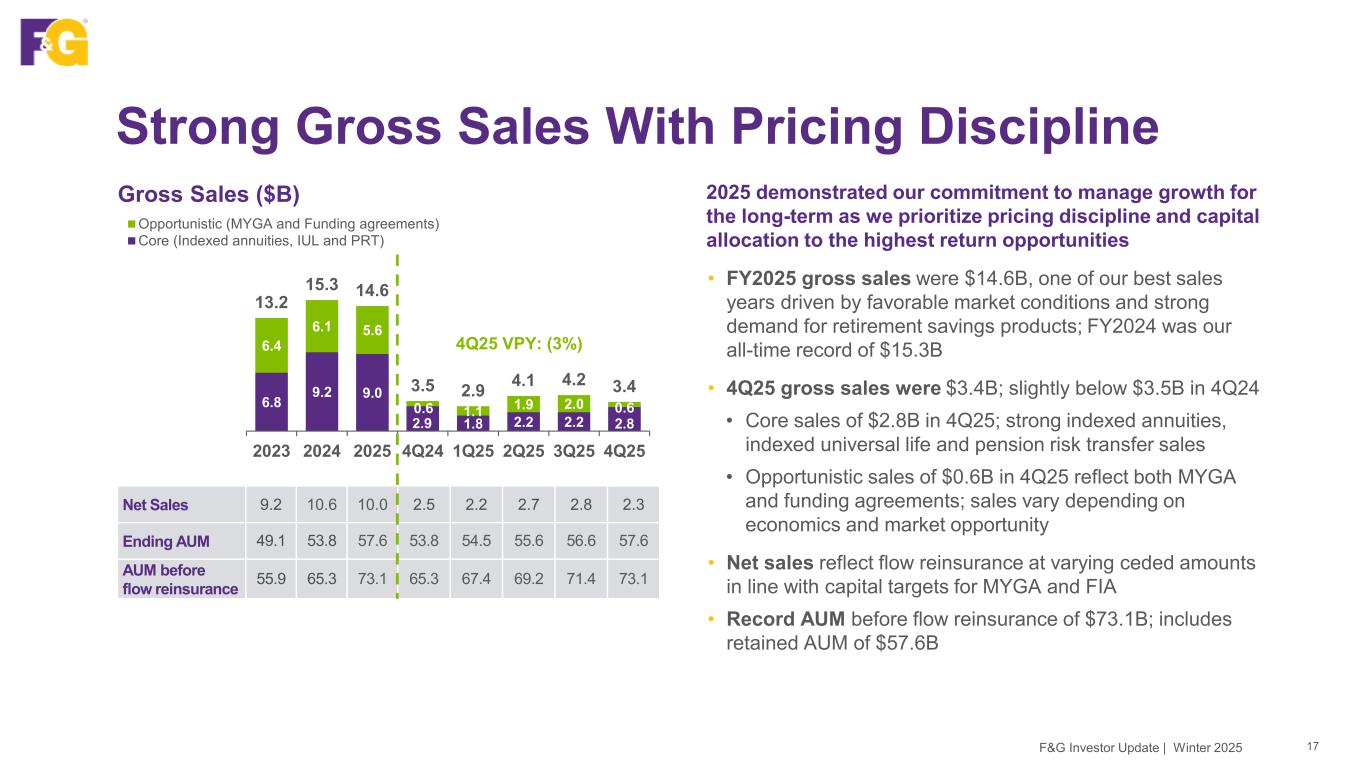
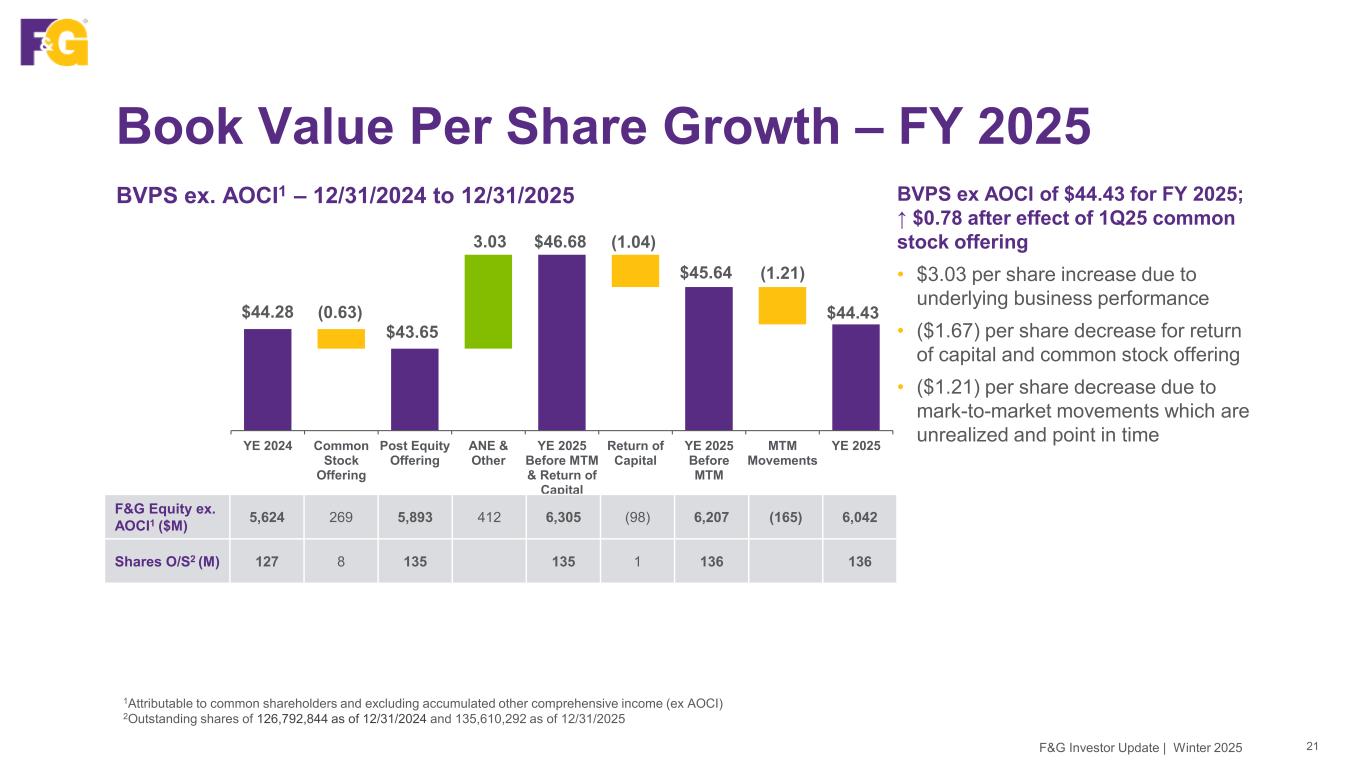
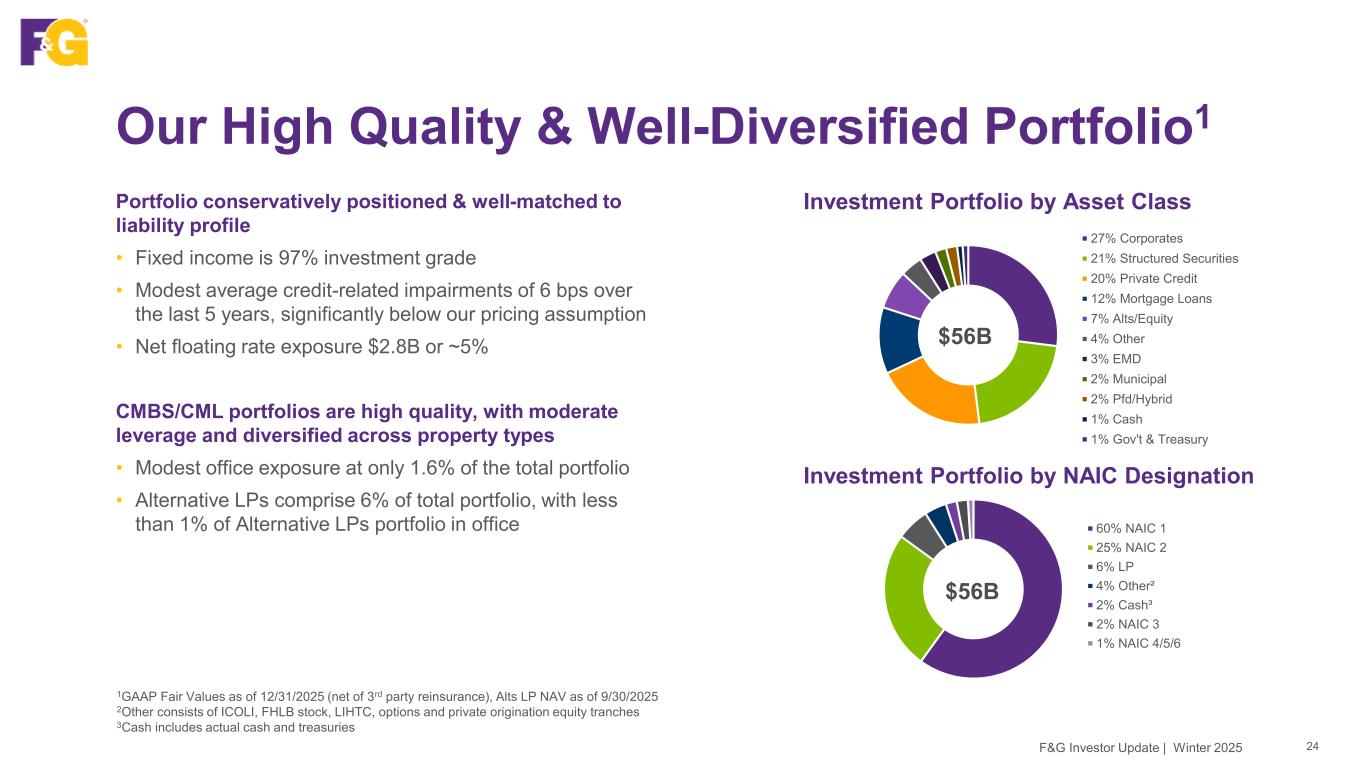
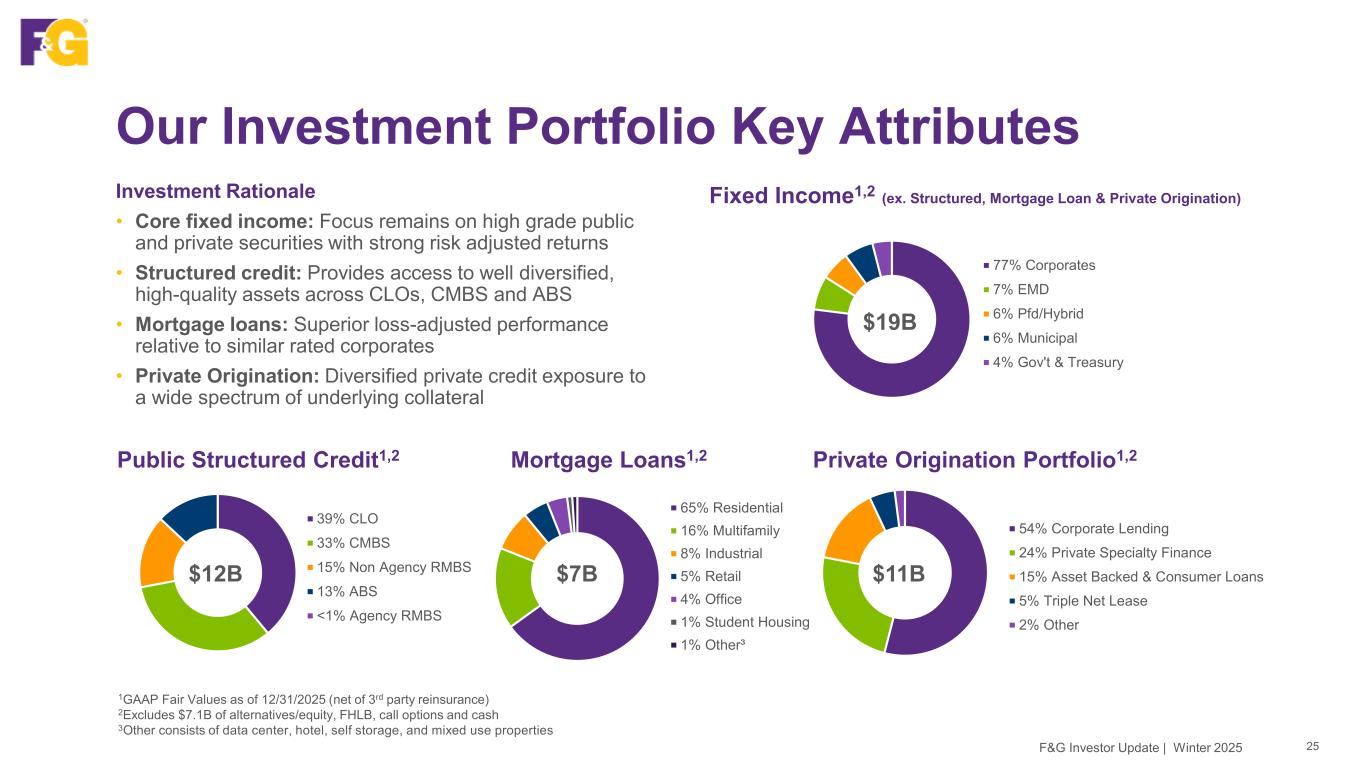
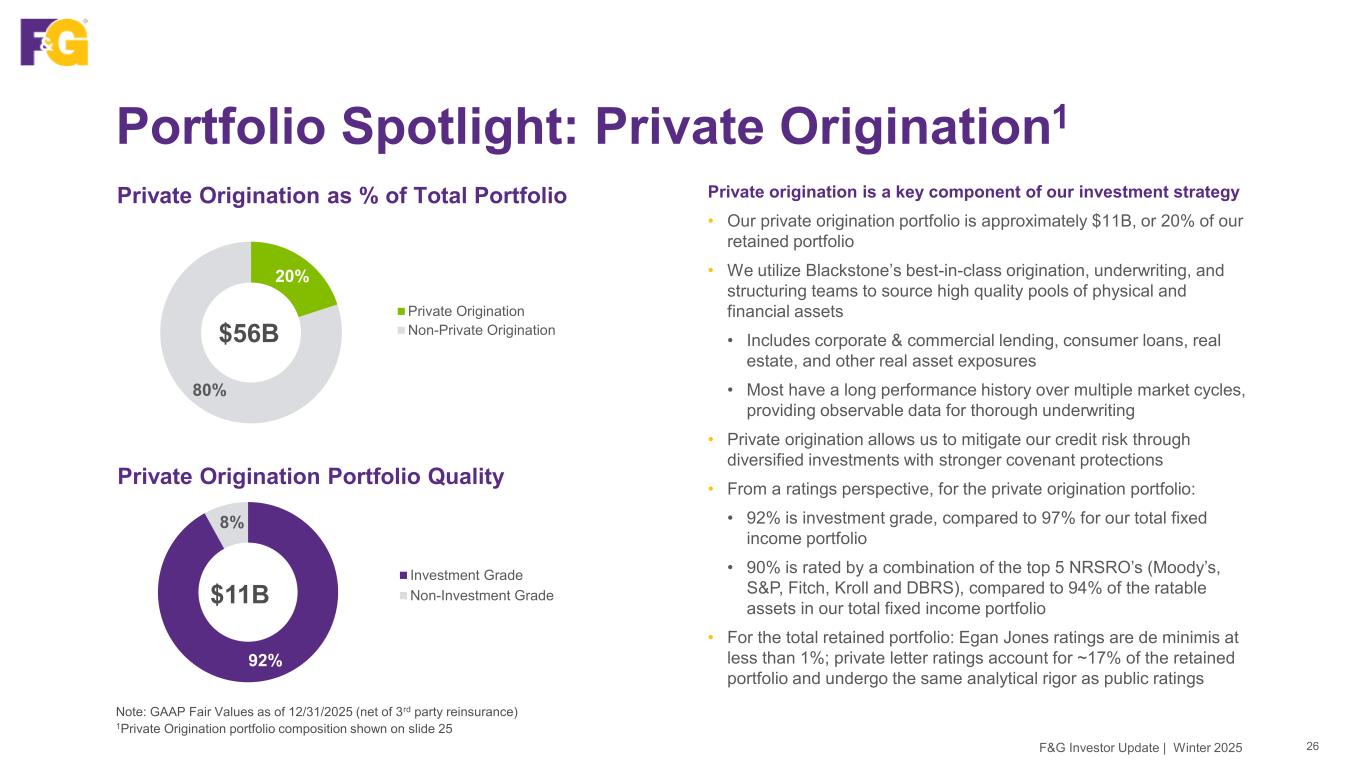
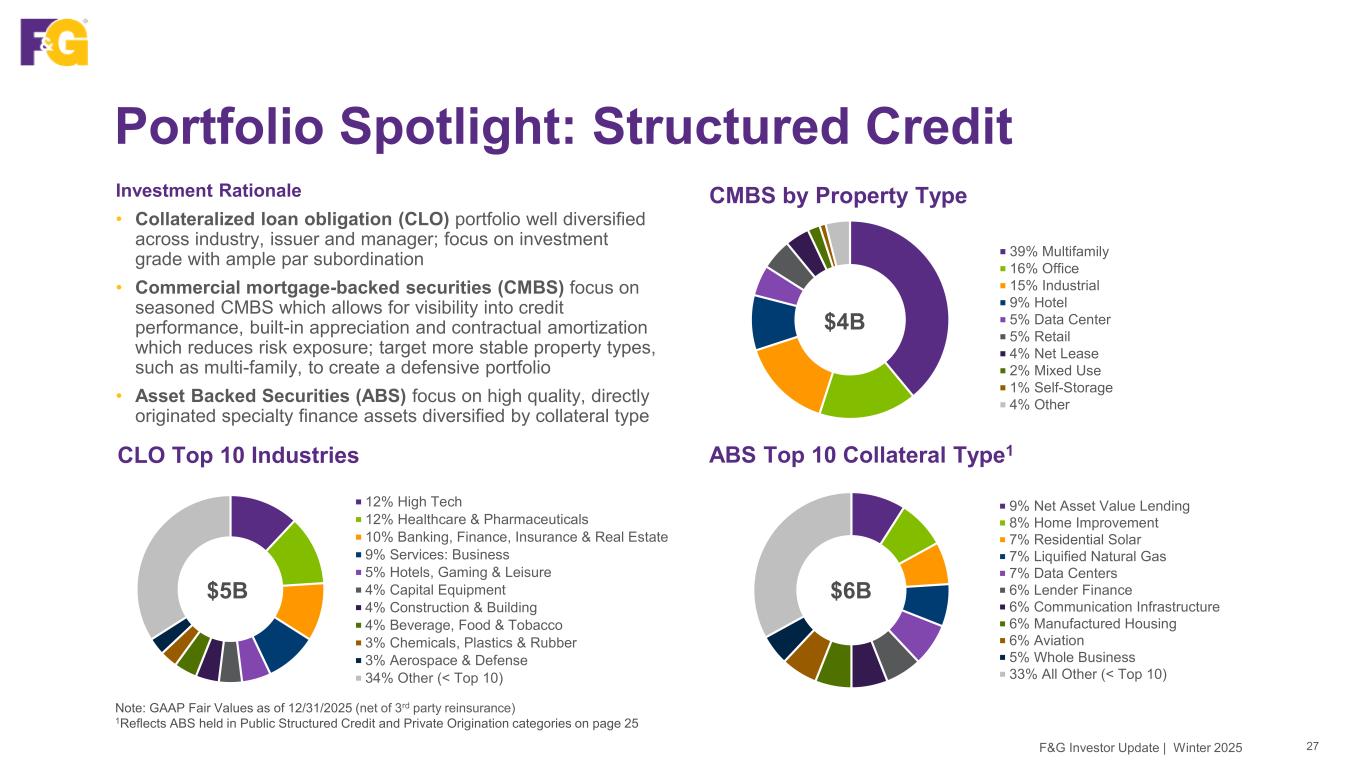
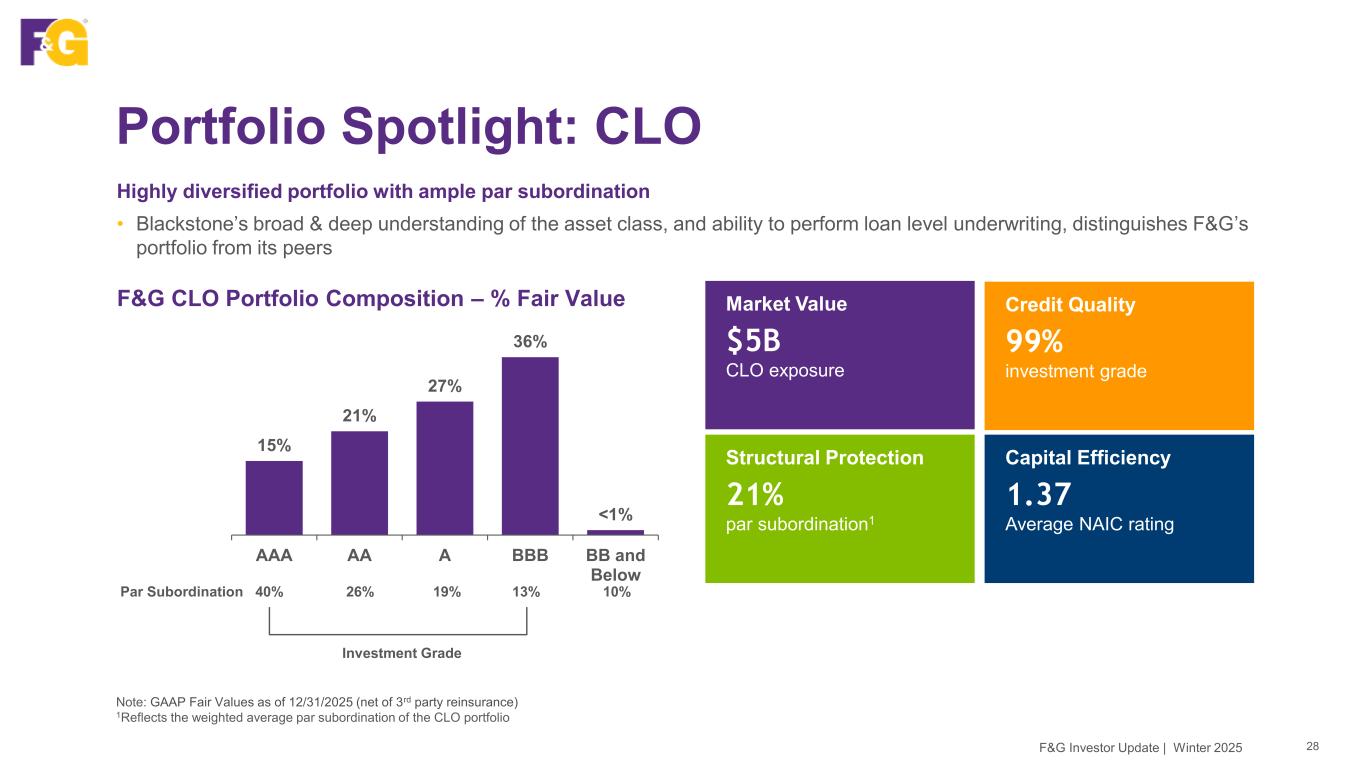
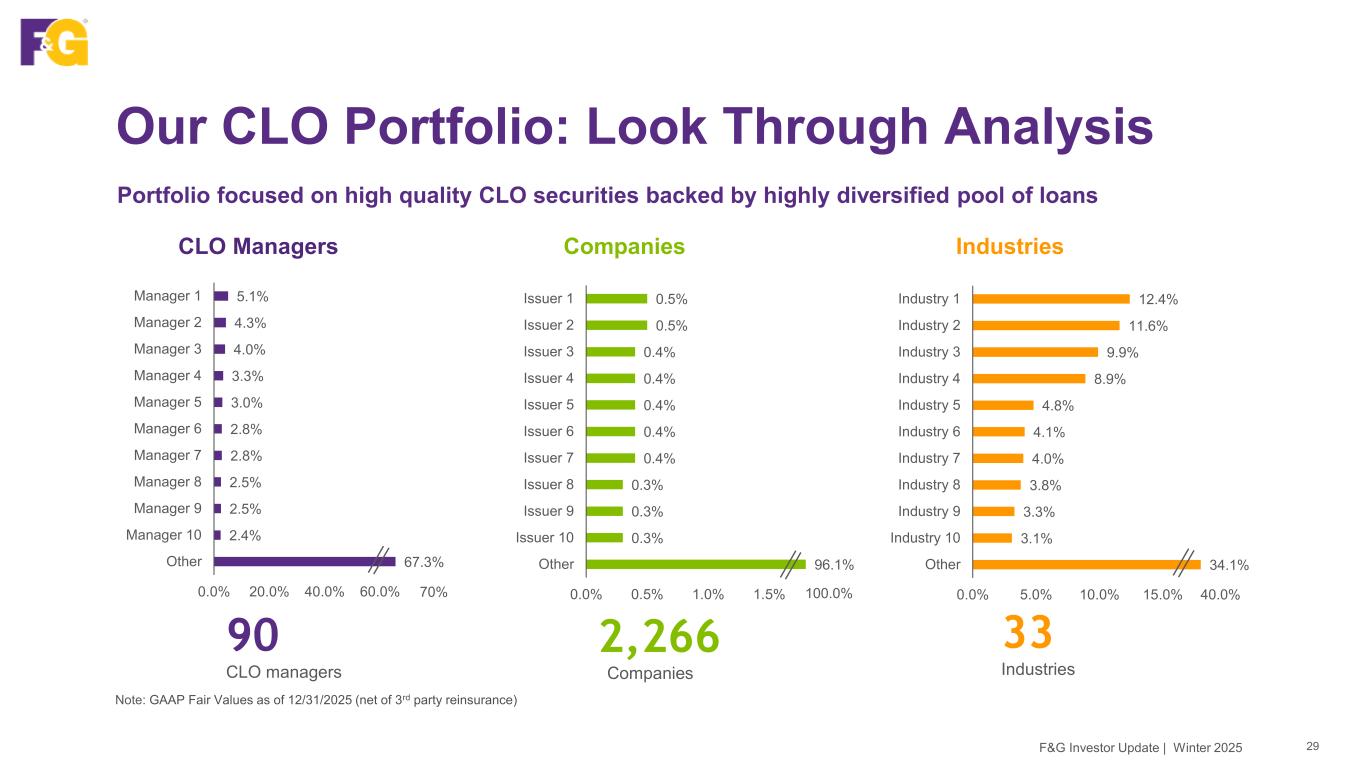
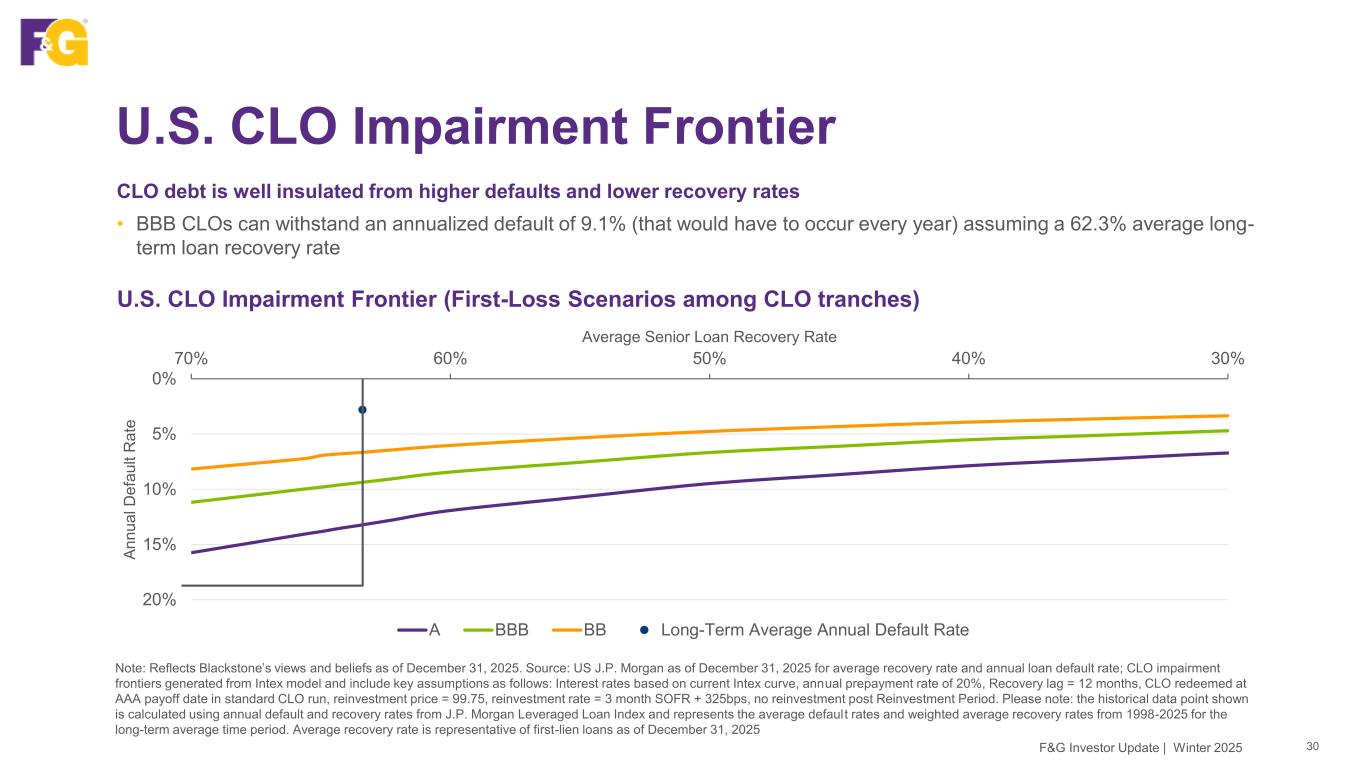
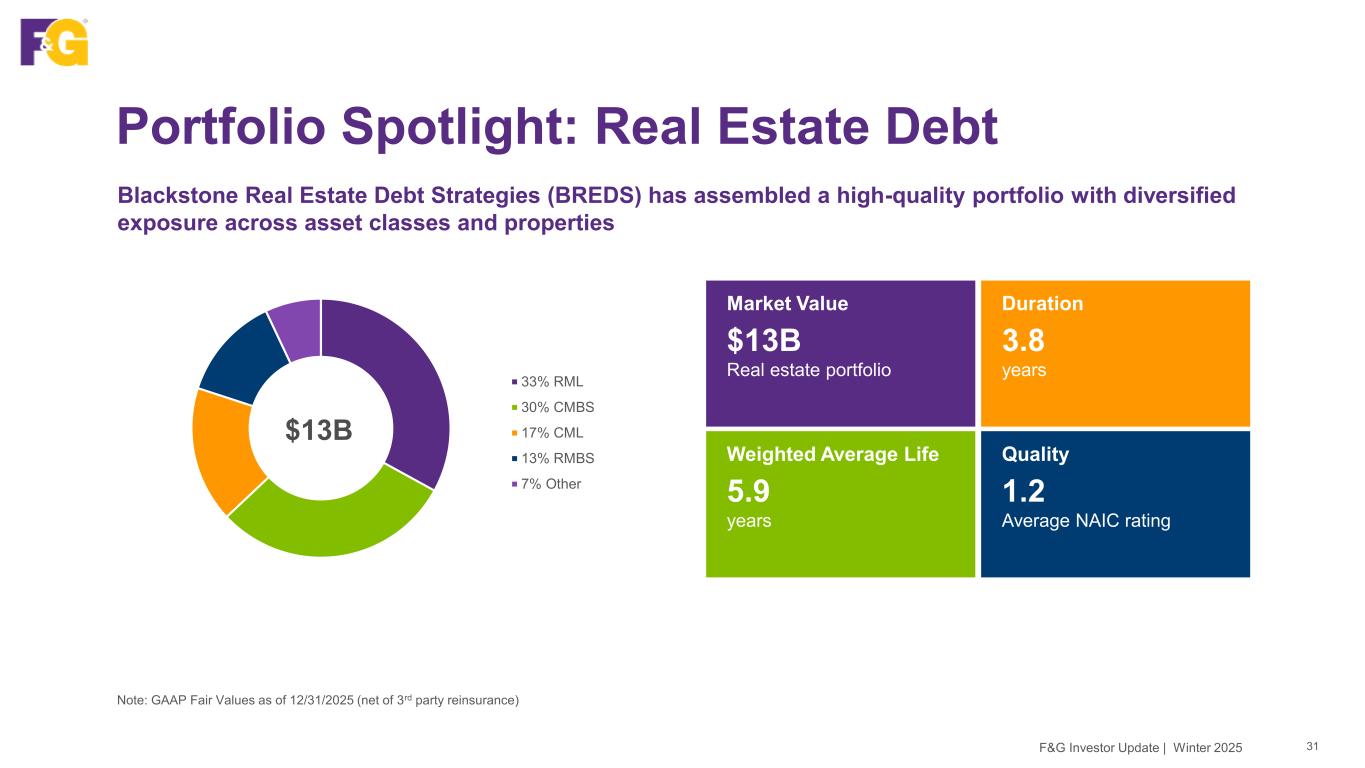
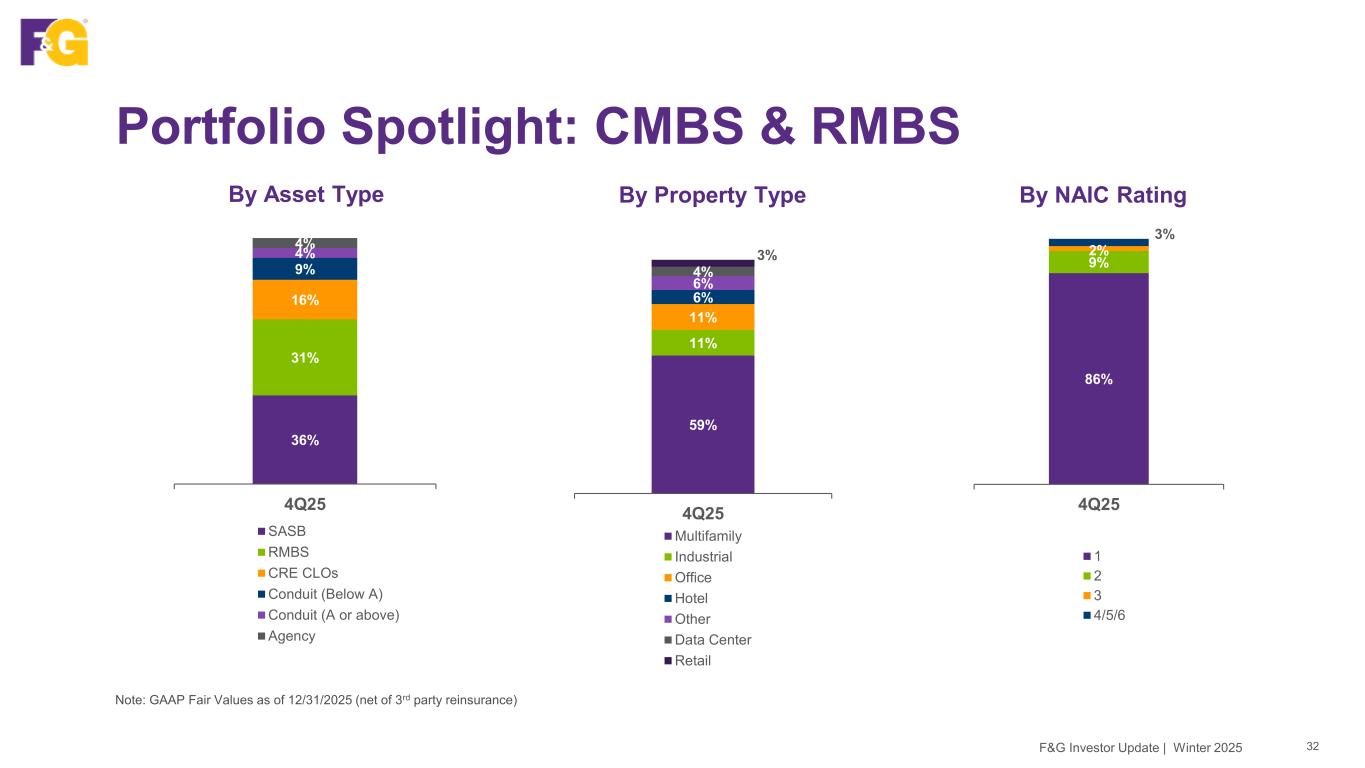
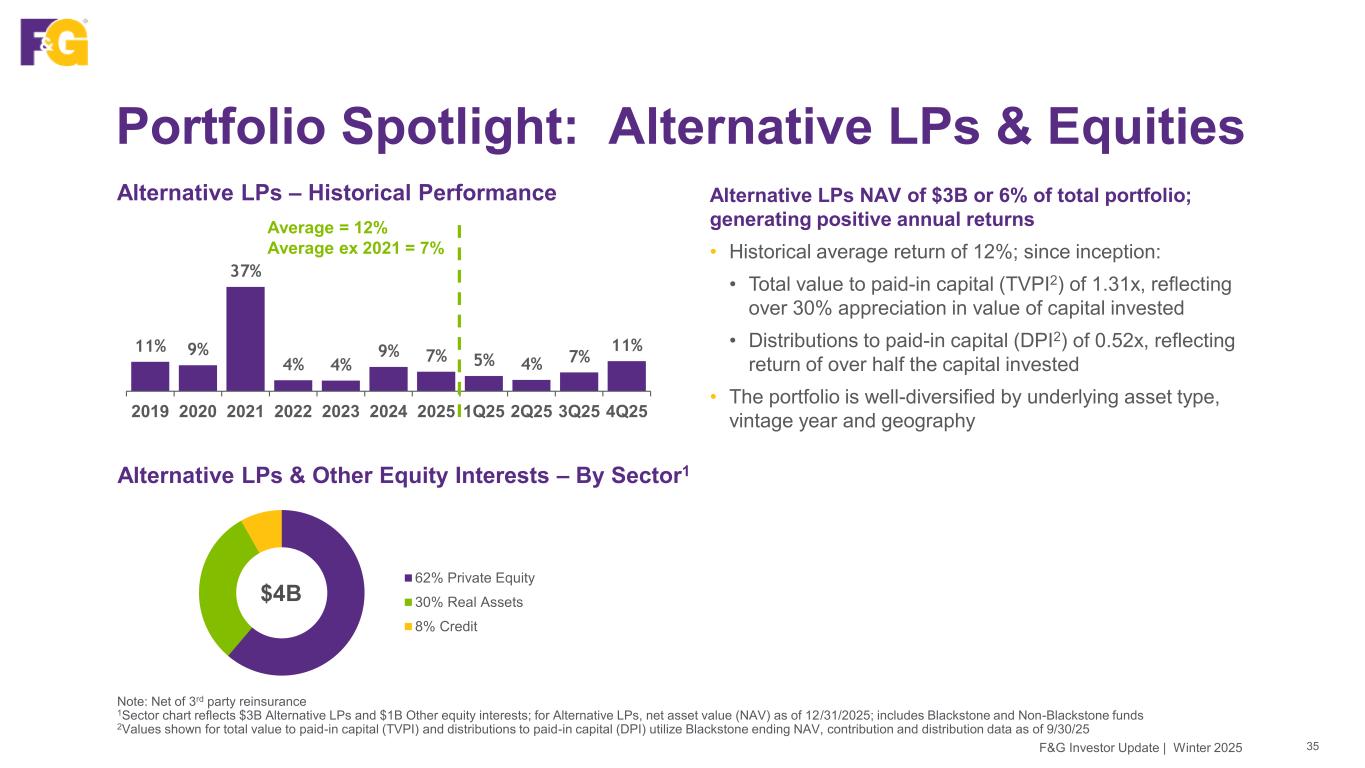
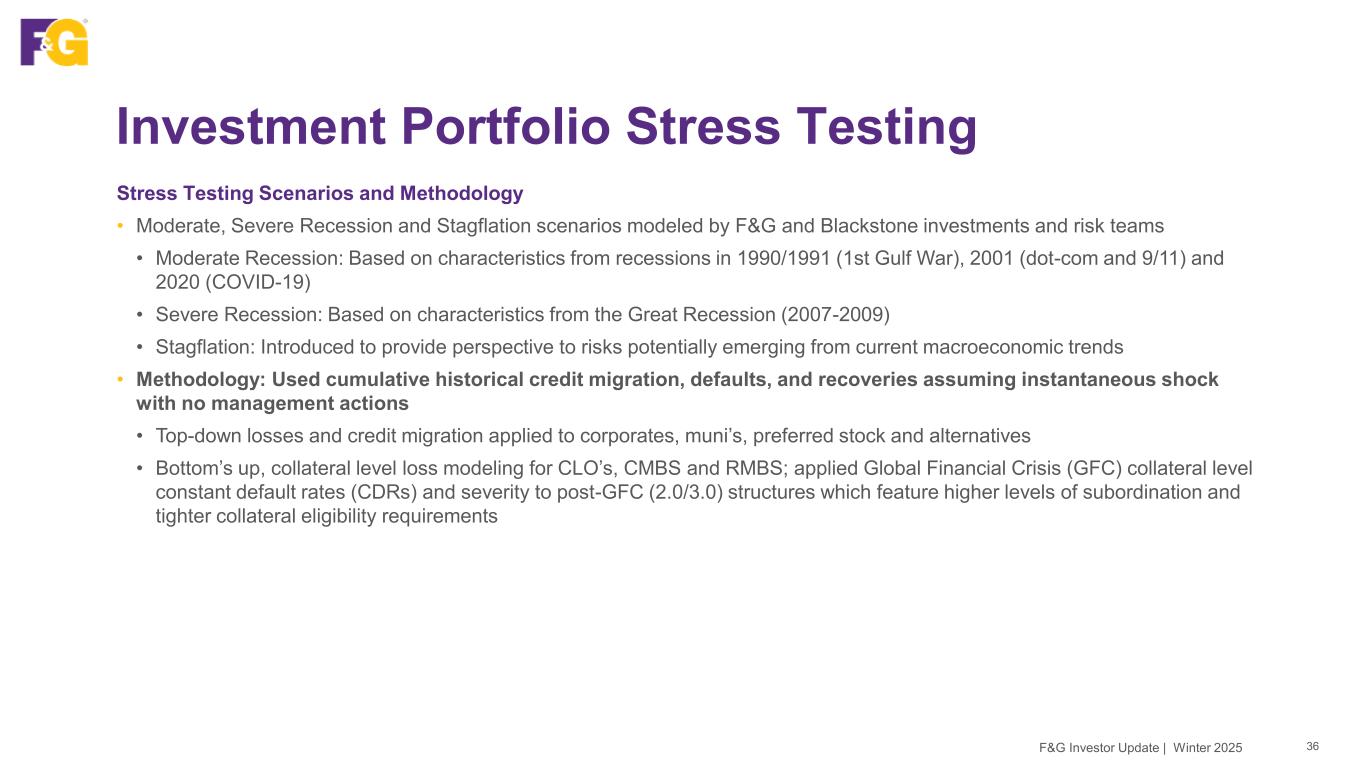
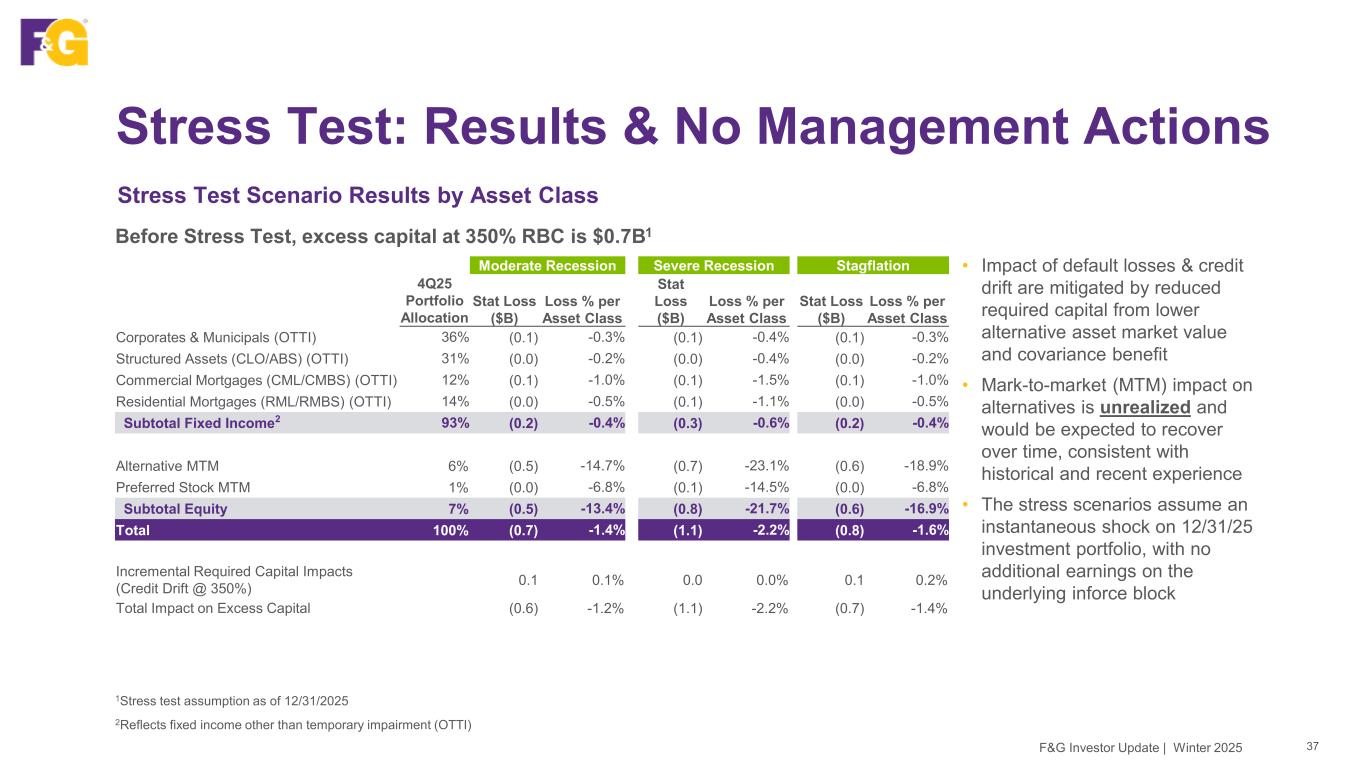
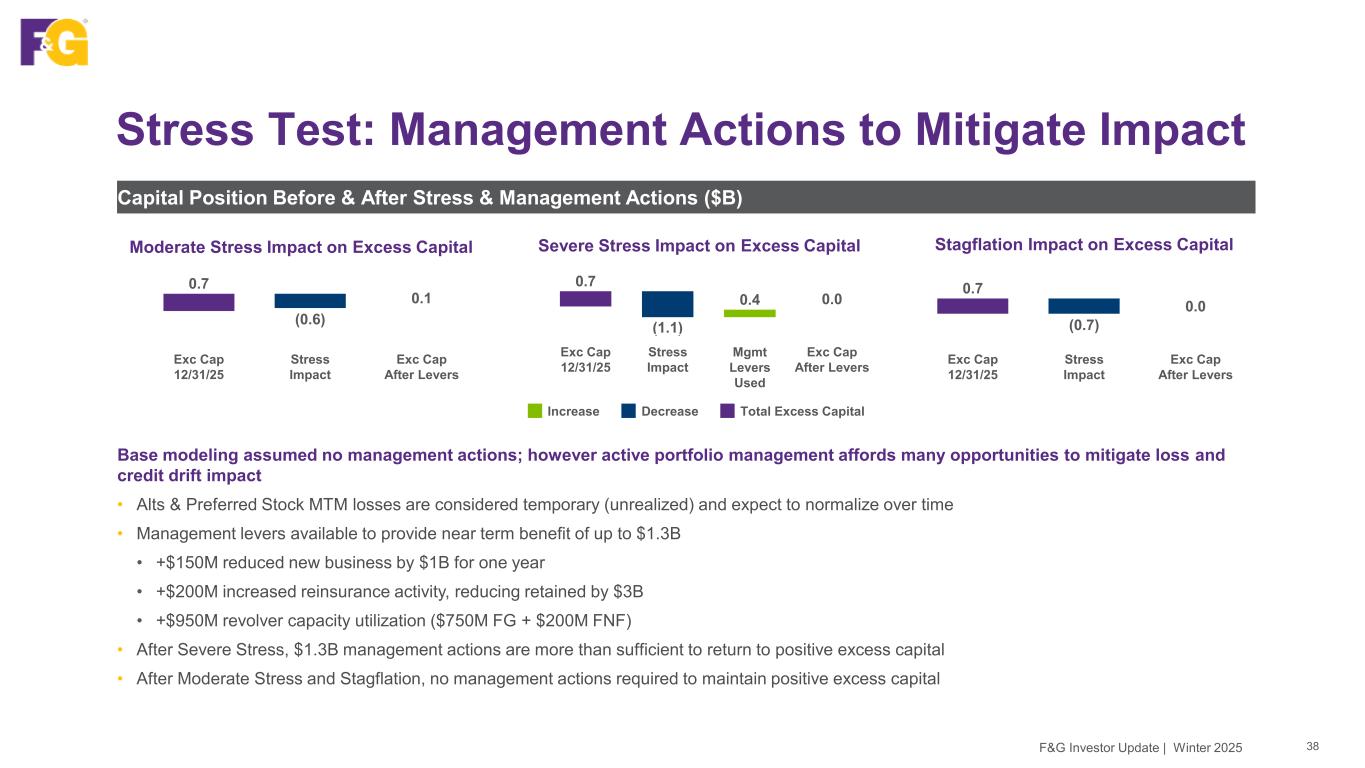
Good morning, and thanks for joining today's call. We delivered a strong finish to an outstanding year through disciplined growth and the proven ability and flexibility of our business model as we transitioned to be more fee-based, higher margin, and less capital intensive, and we've remained focused on creating long-term shareholder value. We are executing on our strategy and made further progress toward our 2023 Investor Day targets as we achieved record AUM before flow reinsurance fueled by one of our best years of sales, excellent performance in our high-quality diversified investment portfolio, strong performance across our business balanced with diligent expense management, and a healthy financial and capital position. I'd especially like to thank our employees. Their hard work and dedication are truly the foundation of everything we achieve for our business and for our customers. Now, looking at our results more closely, we achieved record AUM before flow reinsurance of $73.1 billion, up 12% over year-end 2024, as well as record retained AUM of $57.6 billion, up 7% over year-end 2024. This record AUM was driven by $14.6 billion of gross sales, our second highest year on record. 2025 demonstrated our commitment to manage growth for the long term, as we prioritize pricing discipline and capital allocation to the highest return opportunities. For the full year, we delivered $9 billion of core sales, including indexed annuities, indexed universal life, and pension risk transfer, and $5.6 billion of opportunistic sales, including MIGA and funding agreements. Connor will provide more details on sales later in the call. Next, turning to the investment portfolio, our high-quality diversified portfolio is performing very well. The retained portfolio is high quality with 97% of fixed maturities, being investment-grade at year-end. Since 2020, we have selectively repositioned over $2 billion of assets to optimize, de-risk, and position the portfolio to perform in varying market conditions while also improving credit quality. Credit-related impairments have remained stable at eight basis points in 2025, well below our pricing assumption. This brings our five-year average since 2021 to six basis points, which is exceptionally low. Our fixed income yield was 4.65% in the fourth quarter, up six basis points over the fourth quarter of 2024. As a reminder, our fixed income yield excludes alternative investment income as well as variable investment income, which we define as prepayment fees. Looking at our alternative investment portfolio, our annualized return was approximately 7% in the fourth quarter as compared to our 10% long-term expected return. At year end, approximately 40% or $4 billion of our $11 billion alternative investment portfolio was comprised of equity interests, including limited partnerships, with the remaining 60% being investment-grade fixed income debt with more predictable levels of investment income. Starting in the first quarter of 2026, we are updating our long-term expected return for alternative investments to reflect only the 40% or $4 billion of equity interests. We will reclassify the remaining 60% or nearly $7 billion into our fixed income yield and AUM, as shown in the investment income and yield table on page 8 in our financial supplement. We believe this will more appropriately delineate between the fixed income portfolio and alternative investments while also improving comparability to others in the industry. This disclosure refinement will not have any impact to adjusted net earnings on an as-reported basis. We're often asked about the effect of short-term interest rates on our business following the recent Fed rate cuts. Given the nature of our spread-based business, longer-term rates and the shape of the yield curve are more significant to us than short-term interest rates. We do not have significant exposure to changes in short-term interest rates as we have hedged a majority of our floating rate portfolio to lock in higher rates over the past couple of years. Our floating rate exposure is now only $2.8 billion, or approximately 5% of our total portfolio net of hedging. Another consideration is variable investment income. We reported $7 million of pre-tax prepayment fees in the fourth quarter. This brought the full year to $56 million in line with full year 2024. As a reminder, prepayments fluctuate quarter to quarter and could present a headwind in 2026 if bond prepayments vary from 2025 levels, depending on market conditions. As far as our asset managers go, we really think we have the best of both worlds in terms of our competitive positioning and flexibility. We are now in the ninth year of our strong and seasoned relationship with a world-class manager in Blackstone, and we have the flexibility to work with other asset managers, whether for flow reinsurance or specialty asset classes that complement Blackstone's capabilities. Blackstone employs a robust and thorough underwriting approach by developing its own forecasts based on conservative macroeconomic views and historical sector performance. Next, turning to private asset origination, which is a key component of our investment strategy and represents 20% or $11 billion of our retained portfolio. Here, we utilize Blackstone's best-in-class origination, underwriting, and structuring teams to source high-quality pools of physical and financial assets. These include corporate and commercial lending, consumer loans, real estate, and other real asset exposures. When it comes to private asset origination, most of these directly originated asset classes have been in existence for decades within the bank channel and have long performance histories over multiple market cycles, providing observable data for thorough underwriting. Private asset originations allow us to mitigate our credit risk in a couple of ways. They provide diversification to investments that we can access through public markets, and the bilateral nature of these private origination transactions allow us to perform comprehensive analysis on an asset-by-asset basis and incorporate stronger covenant protections relative to the public markets. From a ratings perspective, our private asset origination portfolio has a strong credit profile. Approximately 92% of the private origination debt portfolio as investment grade, and included within the 97% investment grade for our total fixed income portfolio. We primarily use the top five nationally recognized statistical rating organizations. Approximately 90% of the private origination debt portfolio and 94% of our total fixed income portfolio are rated by a combination of the top five agencies, including Moody's, S&P, Fitch, Kroll, and DBRS. Egan Jones ratings are de minimis at less than 1% of our total retained portfolio. And private letter ratings account for approximately 17% of our total retained portfolio and undergo the same analytical rigor as public ratings. The combination of Blackstone's structuring talent, our ability to complement Blackstone's ability with other asset managers. The track record of these assets and our thorough due diligence has helped generate attractive risk-adjusted returns for F&G that have performed very well to date and through stress environments like the COVID pandemic. We have refreshed our annual portfolio stress test, which is conservative and assumes no management action. Once again, the stress test has confirmed that our portfolio is well positioned to withstand a sharp downturn in the economy. In summary, we feel comfortable and confident in the credit soundness of our investment portfolio. Please see our winter 2025 investor presentation for further details on our stress test. Next, I'd like to provide an update on our strong progress toward our 2023 investor day medium-term financial targets now that we are at the midpoint of our five-year horizon. We have grown AUM before-flow reinsurance from the $51 billion baseline to $73 billion at year-end 2025, a 44% increase at the midpoint mark as compared to our target of 50% in five years. We have expanded ROA, excluding significant items from the 110 basis point baseline, and made significant progress toward the lower end of the 133 to 155 basis point targeted range. And we have increased ROE, excluding AOCI and significant items from the 10% baseline, and are closing in on the lower end of the 13 to 14% targeted range. The preferred stock investment from FNF in 2024, combined with our own internal capital generation, enable us to grow significantly faster than originally projected when we set our investor date targets. On December 31st, F&F completed the distribution of approximately 12% of the outstanding shares of F&G's common stock to F&F shareholders. Following the distribution, F&F retains control and a majority ownership with approximately 70% of the outstanding shares in F&G. This has increased F&G's public float from approximately 18% to approximately 30% after the distribution, strengthening F&G's positioning within the equity markets and facilitating greater institutional ownership. This distribution reflects F&F's confidence in F&G's long-term prospects and is intended to unlock shareholder value by enhancing market liquidity and broadening investor access to F&G shares. On a standalone basis, we reported GAPCOM and equity excluding AOCI of $6 billion at year end, and we have grown book value per share excluding AOCI to $44.43, up 62% since the 2020 acquisition. In summary, F&G finished the year strong. I'm excited about the future and our ability to continue to deliver long-term shareholder value. Looking ahead, F&G has differentiated capabilities and is uniquely positioned in the industry. We have made significant progress executing on our strategy, leveraging the strength of our distribution partners to continue to grow our spread-based business, alongside our growing sources of fee-based higher margin and less capital-intensive earnings through our flow reinsurance, middle market life insurance, and own distribution strategies, all of which is showing up in our results as expected. Let me now turn the call over to Connor to provide further details on F&G's fourth quarter and full year highlights.
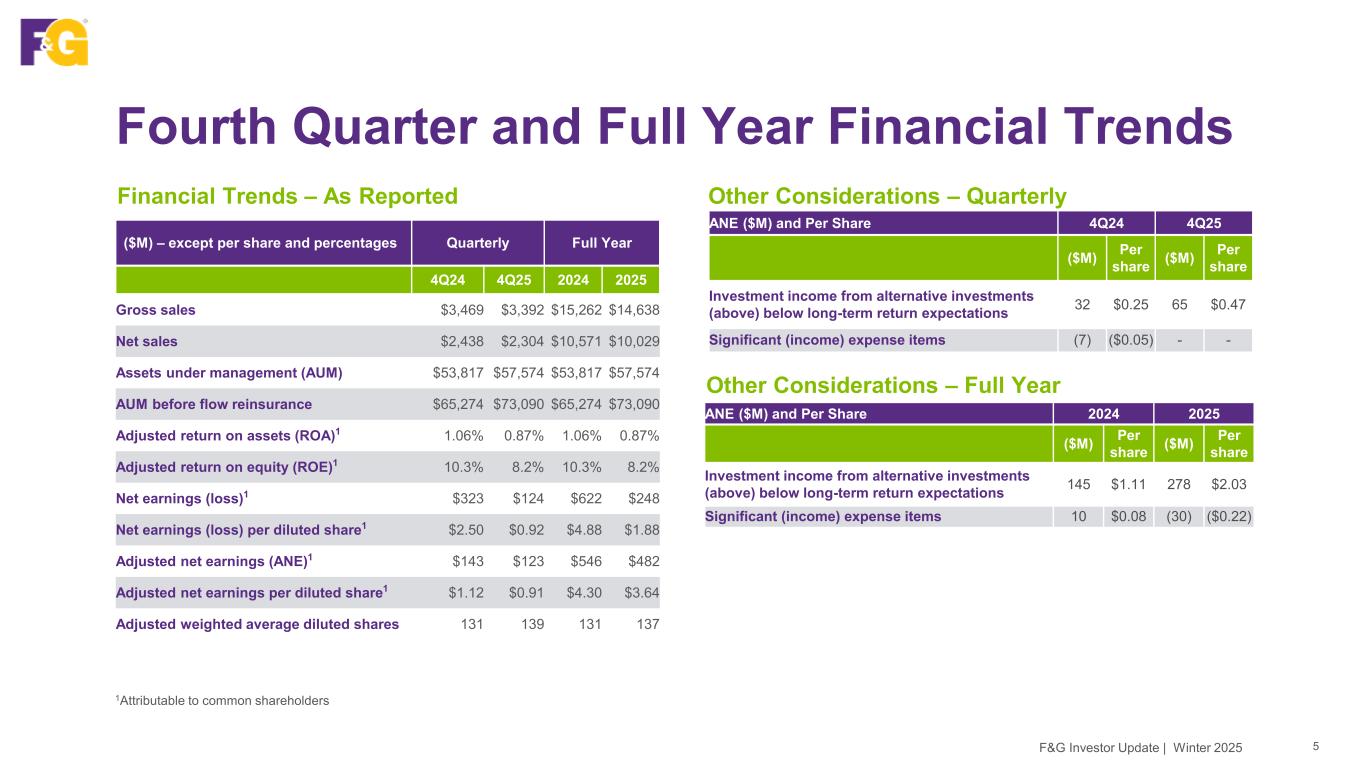
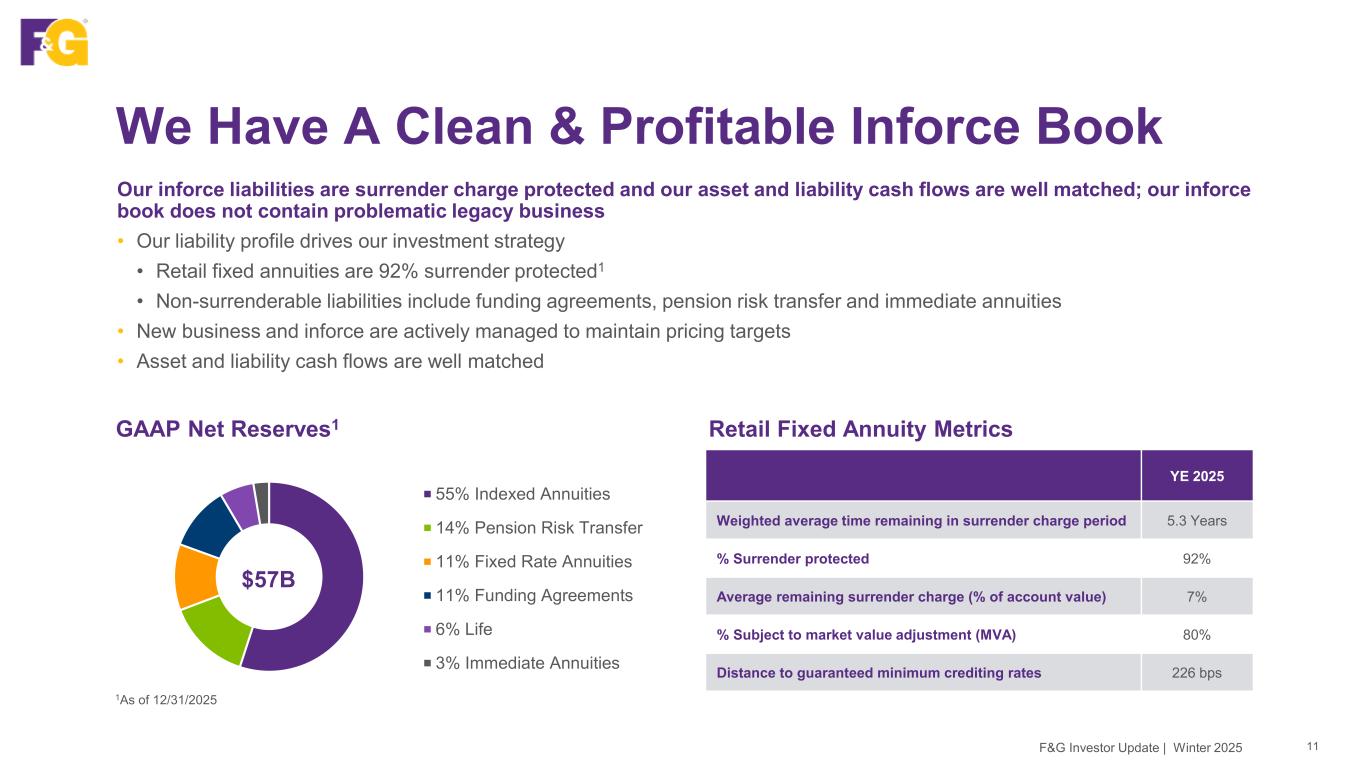
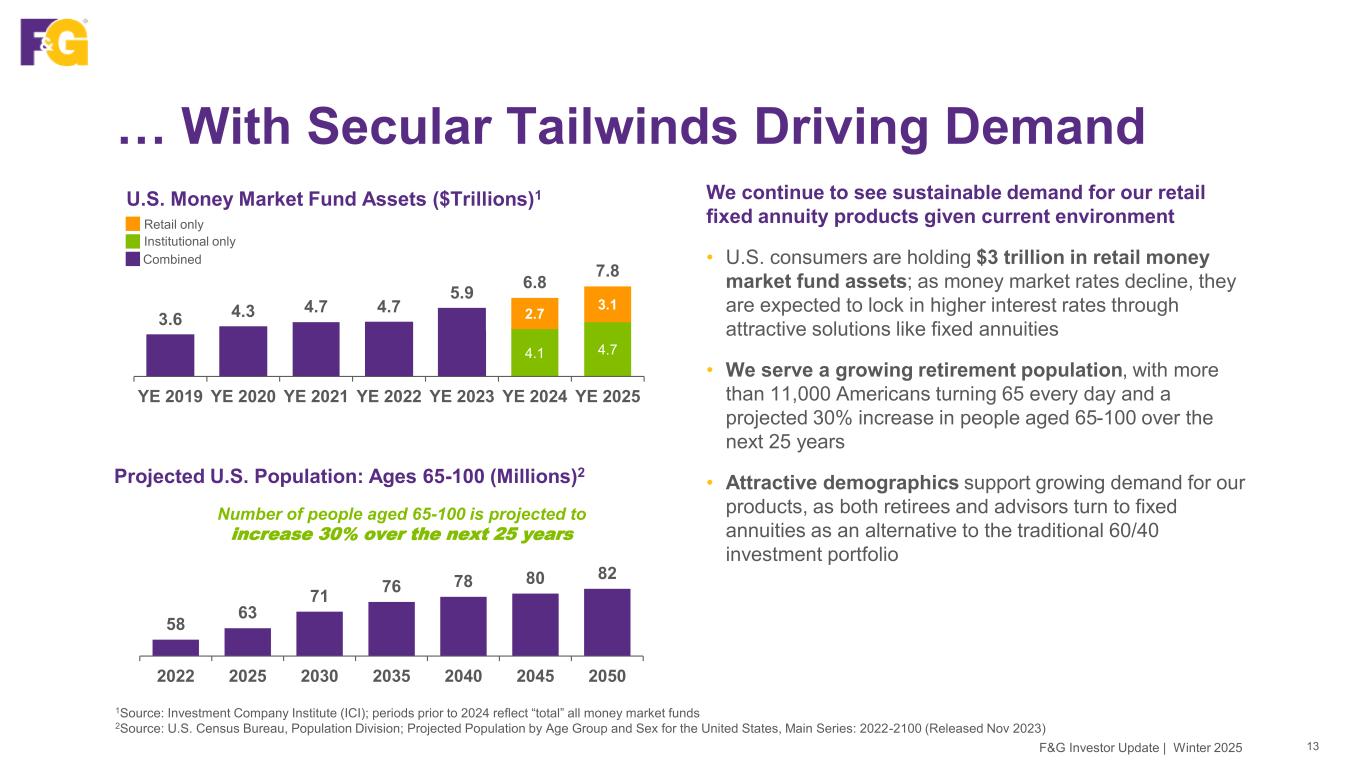
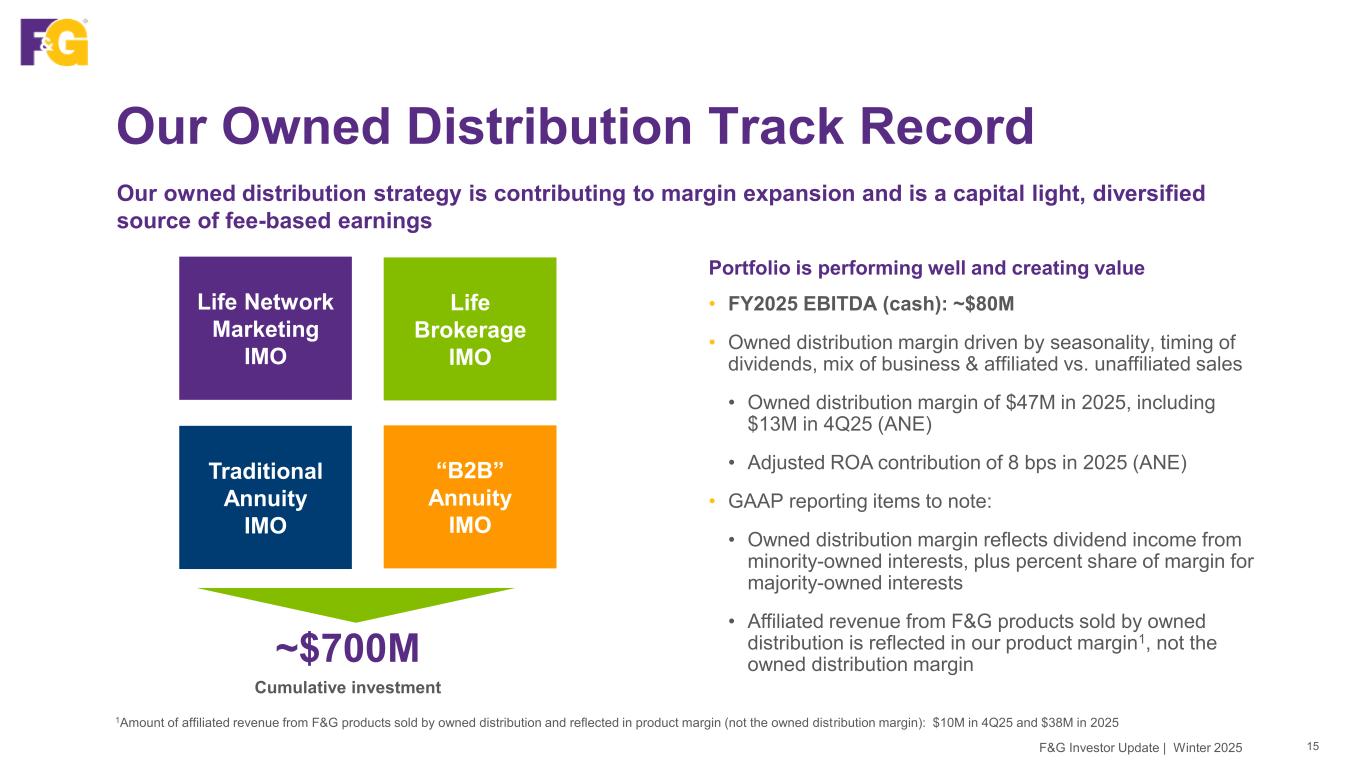
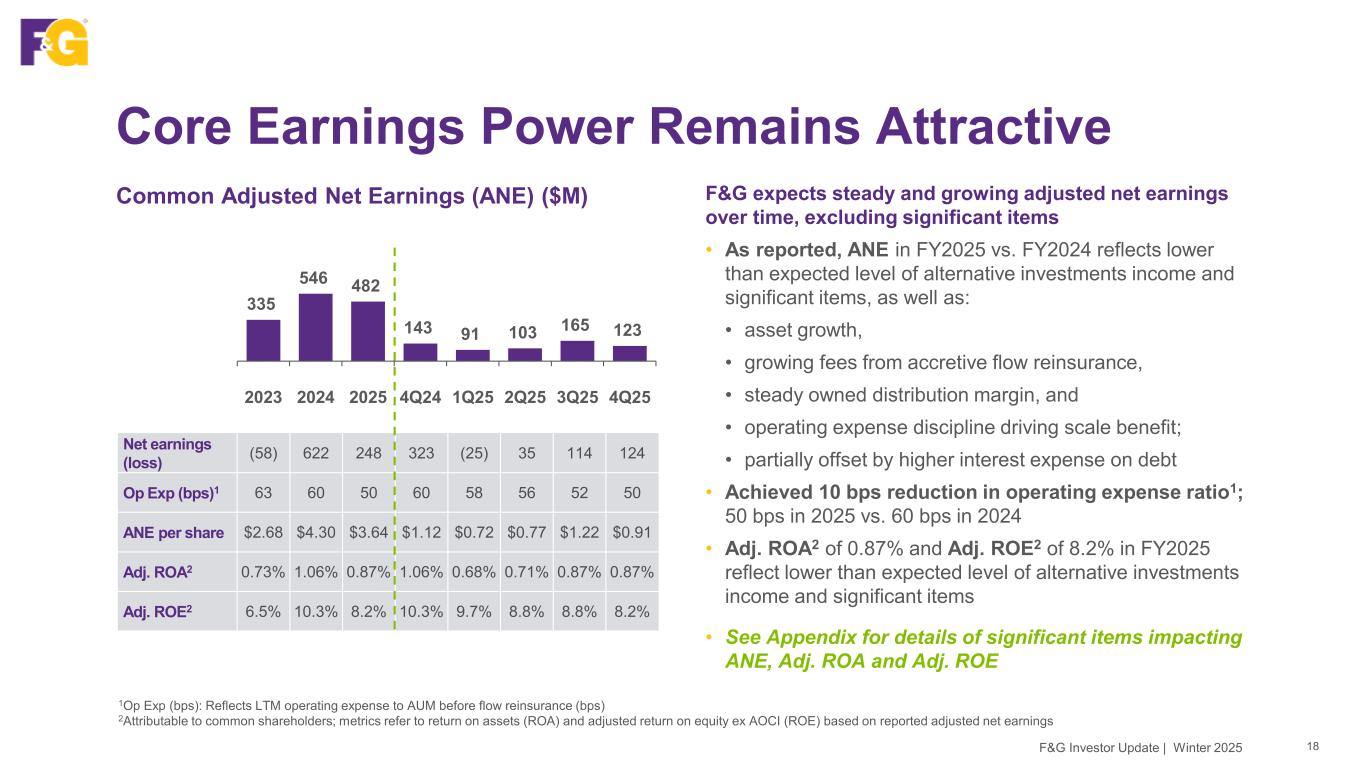
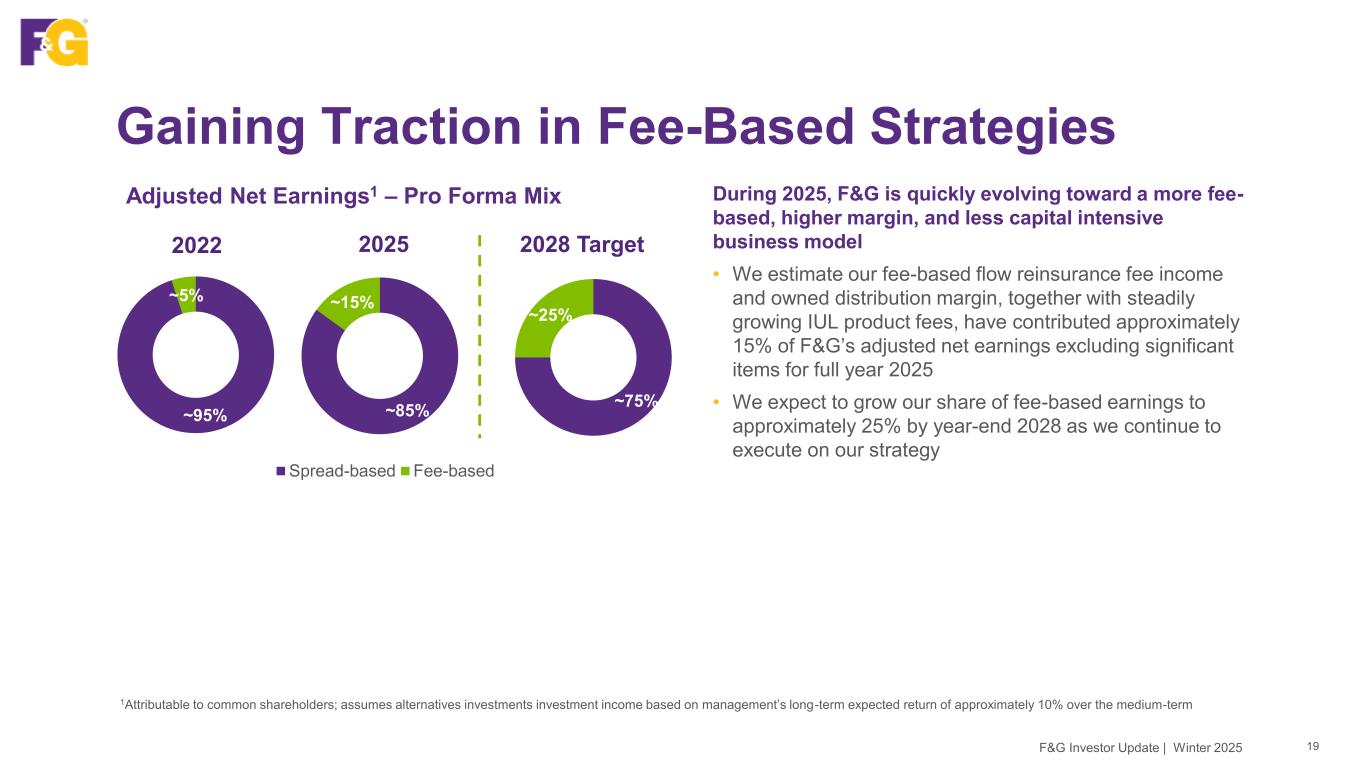
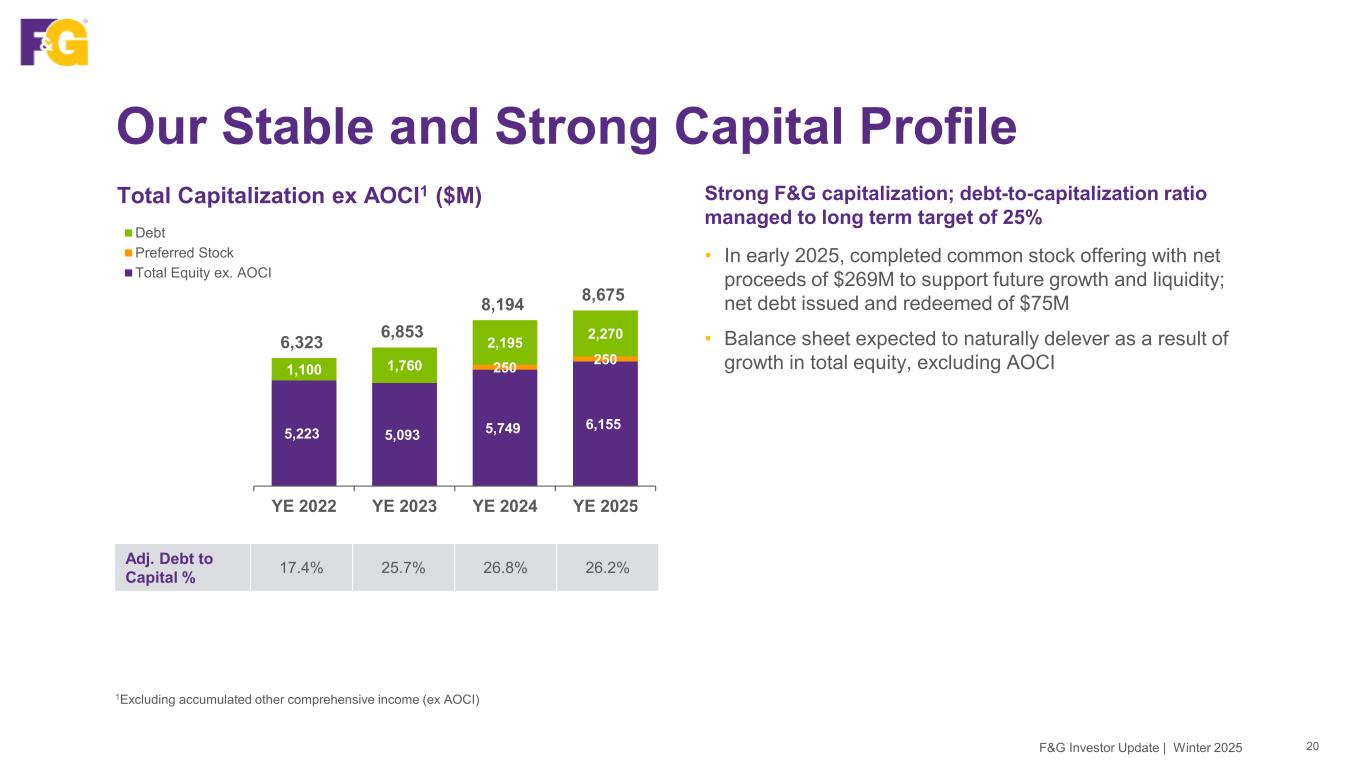
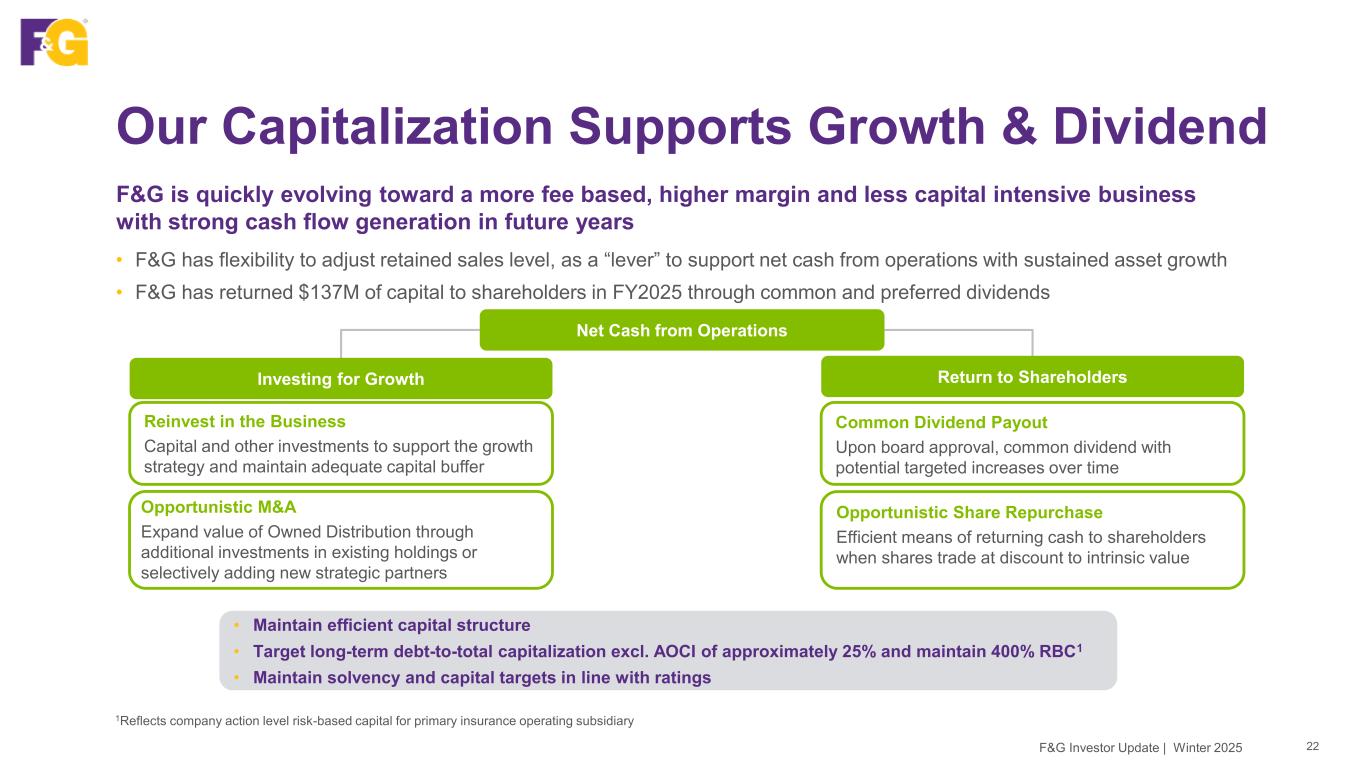
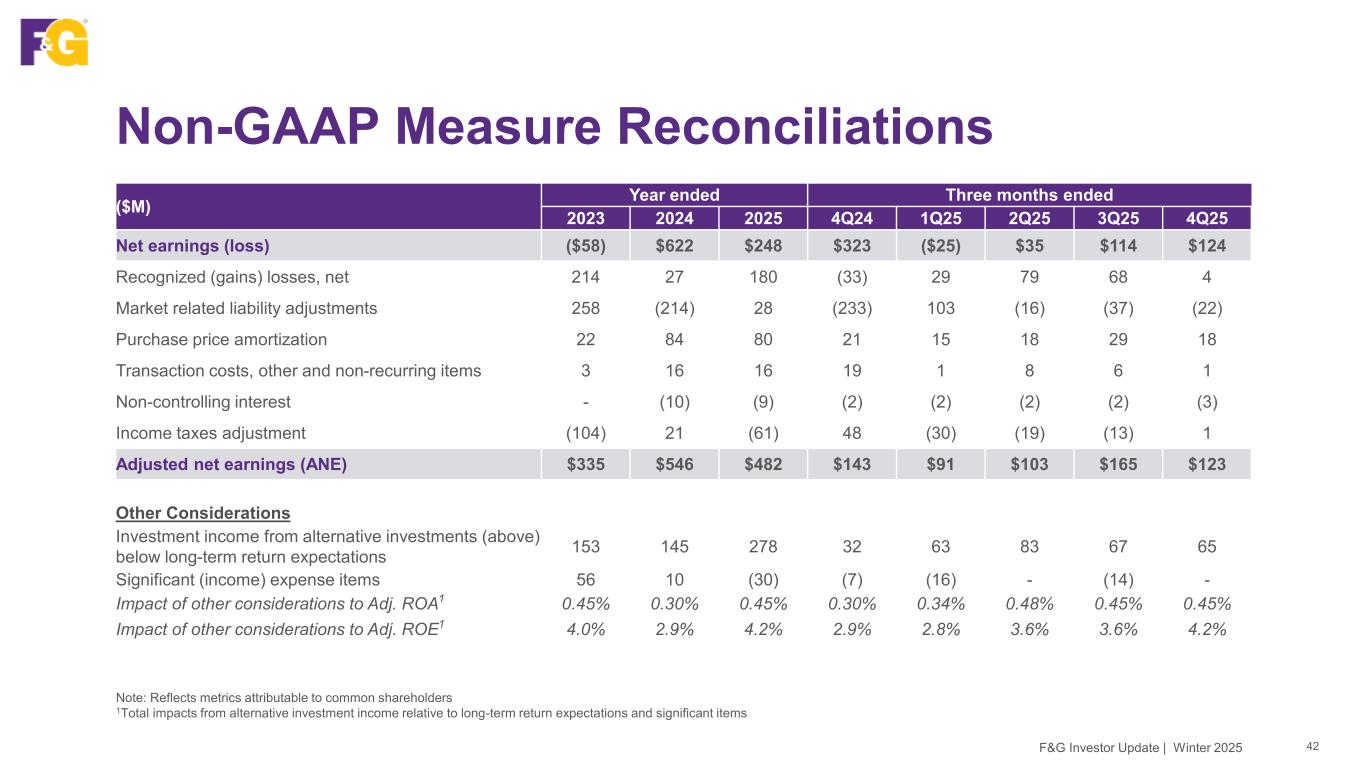
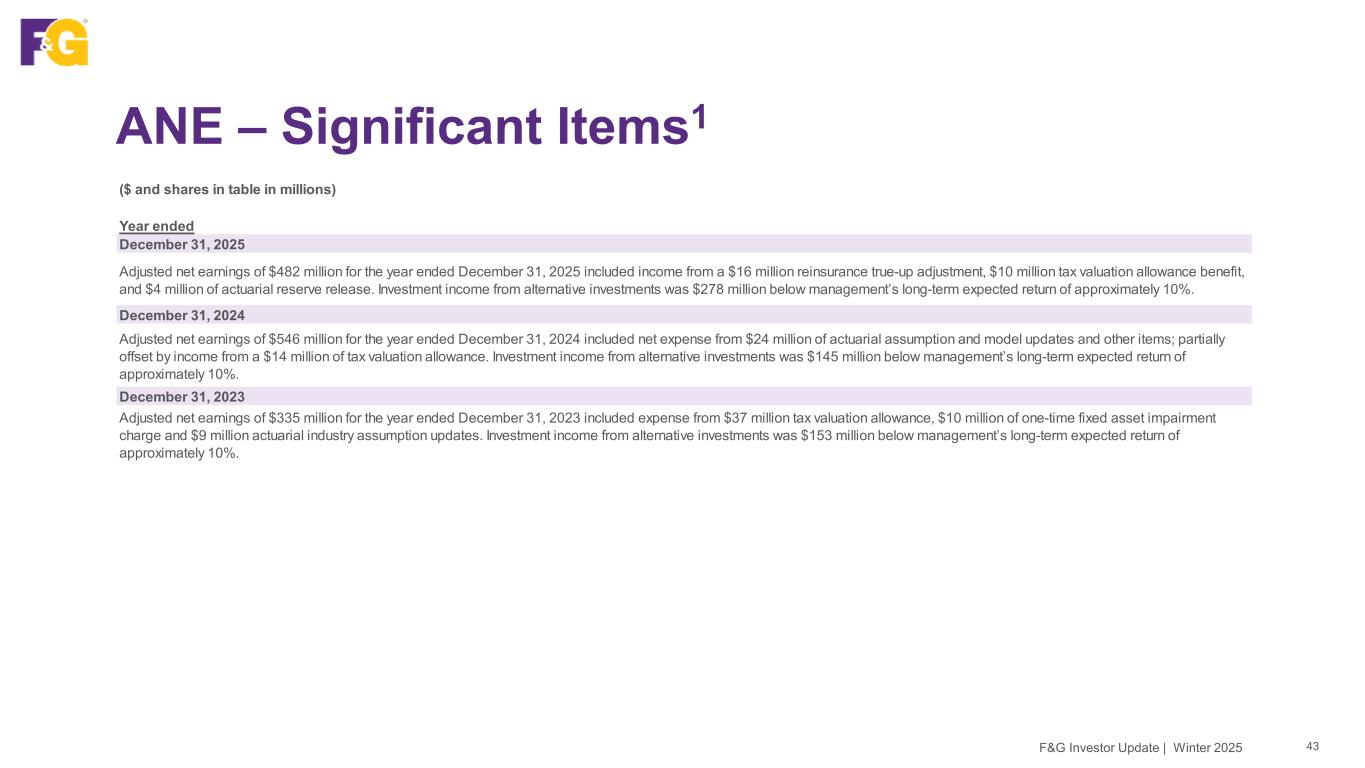
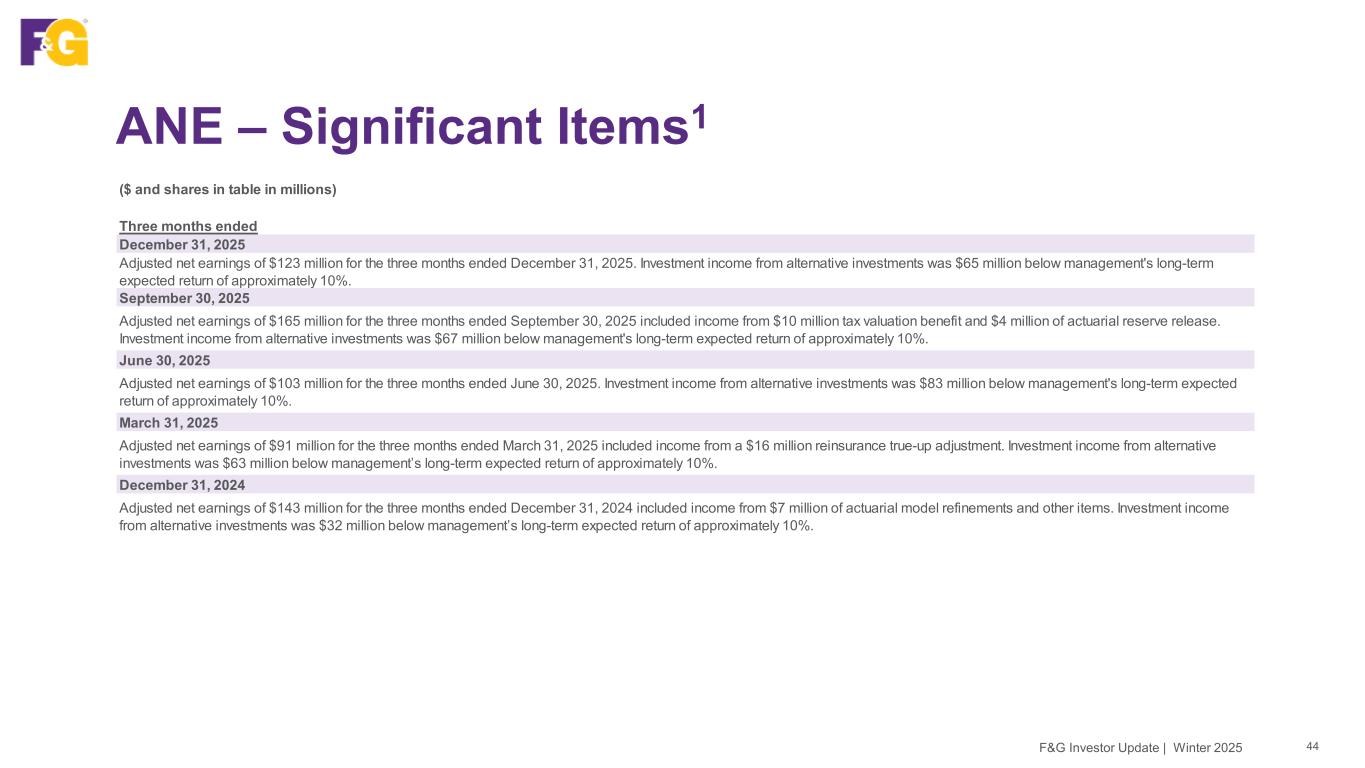
Thank you, Chris. This morning, I will provide some additional details of our sales, fourth quarter and full year earnings and performance drivers, and our strong capital positions. Starting with sales, as Chris mentioned at the beginning of the call, we generated $14.6 billion of gross sales for the full year, including $3.4 billion in the fourth quarter. We had $9 billion of gross sales of our core products, including indexed annuities, indexed universal life, and pension risk transfer. For the full year, this was our second year of more than $9 billion in core sales. This includes $2.8 billion of core sales in the quarter, in line with the fourth quarter of 2024, and up 27% over the sequential third quarter. To provide a few highlights of our core sales, indexed annuities were $6.7 billion for the full year, which was in line with full year 2024, and included $1.9 billion of indexed annuities in the quarter, up 12% over the fourth quarter of 2024. This is a strong result in a competitive environment and coming off a record 2024 for fixed indexed annuity sales for both F&G and the industry. FIA is our largest contributor to indexed annuity sales and progressively increased during 2025, with modest but increasing RILA sales throughout the year. IUL sales were $190 million for the full year, including over $50 million in the quarter, and reflect a 14% increase over full year 2024. Our life insurance solutions are meeting the needs of the underserved multicultural middle market, which is driving continued steady growth. ERT sales were $2.1 billion for the full year, including over $800 million in the quarter. This result marks our third consecutive year attaining $2 billion or more in PRT sales and landed squarely in our $1.5 to $2.5 billion targeted annual range. We continue to see a robust PRT pipeline for midsize deals up to $500 million, where F&G competes well. Gross sales of our opportunistic products, including funding agreements and multi-year guaranteed annuities were $5.6 billion for the full year, including over $600 million in the fourth quarter. Opportunistic sales volumes fluctuate quarter to quarter, depending on economics and market opportunity. To provide a few highlights, funding agreements were $1.8 billion for the full year, up nearly 80% over the $1 billion in full year 2024. This included nearly $300 million of funding agreements in the quarter, as compared to no funding agreements in the fourth quarter of 2024. As we enter 2026, we took advantage of an attractive market window and successfully executed a 750 million FABN issuance in early January as we continue to expand our high-quality investor base. MIGA's sales were $3.8 billion for the full year, including over $350 million in the quarter, as compared to $5.1 billion in 2024, including nearly $650 million in the fourth quarter of 2024. We have intentionally moderated MIGA volumes from the prior year level given market conditions, competitive dynamics, and flow reinsurance optimization as we continued pricing discipline and allocating capital to the highest return opportunities throughout the year. F&G's net sales retained were $10 billion for the full year 2025 as compared to $10.6 billion in full year 2024. This included $2.3 billion of net sales in the quarter, done slightly from the fourth quarter of 2024. Stepping back, 2025 showcased the diversity of our new business engine, allowing us to flex across our products and channels to source the most attractive liabilities in a given environment. We are also uniquely positioned with our third party MIGA flow reinsurance partners to dynamically adjust volumes up and down as the market economics change. This is now supplemented by our reinsurance sidecar, and we expect our mix of sales to shift more toward FIA over time. As one of the industry's largest sellers of annuities and life insurance, our model is sustainable and allows us to optimize and position the business for long-term success. This aligns our interest well with the continued strong secular demand by consumers and financial advisors for retirement saving solutions, including our core indexed annuity and indexed life products. Turning to earnings, on a reported basis, adjusted net earnings were $123 million, or $0.91 per share in the fourth quarter. Alternative investment income was $65 million, or $0.47 per share, below management's long-term expected return for the quarter. For the full year, on a reported basis, adjusted net earnings were $482 million, or $3.64 per share. Alternative investment income was $278 million, or $2.03 per share, below management's long-term expected return for the year. Full-year adjusted net earnings included three favorable significant items totaling $30 million, or $0.22 per share, which are detailed in our financial supplement overall as compared to the prior year adjusted net earnings reflect asset growth growing fees from accretive flow reinsurance steady owned distribution margin and operating expense discipline driving scale benefit as chris mentioned our results have generated sustainable returns our fee income from accretive flow reinsurance has grown to 56 million for the full year 2025 up 37% over $41 million in 2024. Our fee income from own distribution margin contributed $47 million for the full year 2025, up 2% over $46 million in 2024. Our fee-based strategies, including flow reinsurance fee income and own distribution margin, together with steadily growing IUL product fees have contributed approximately 15% of S&G's adjusted net earnings, excluding significant items, for the full year 2025. As we continue to execute on our strategy, we expect our share of fee-based earnings to grow to approximately 25% of our total earnings by year-end 2028. From a flow reinsurance perspective, we continue to expect to reinsure the vast majority of MIGA sales depending on economics. And as discussed on last quarter's call with the reinsurance sidecar, we expect to evolve toward 50-50 retained versus flow for FIA sales. Importantly, we will continue to grow retained AUM as we balance retaining business versus optimizing flow reinsurance and preserving capital flexibility. Our own distribution portfolio is performing well and creating value. We have invested nearly $700 million in our four-ohm distribution investments and generated $80 million of EBITDA for the full year 2025. Our holdings are diversified by product and market and reflect growing businesses with strong leadership. Two of our holdings are Life IMOs that produced about 30% of F&G's IUL sales in full year 2025. The other two holdings are Annuity IMOs that produced approximately 10% of F&G's total annuity sales for the full year. In the future, we have opportunities to expand the value of own distribution through our existing holdings. As F&G grows, we are benefiting from increased scale as our ratio of operating expense to AUM before flow reinsurance has decreased to 50 basis points at year-end 2025, down from 60 basis points at the end of 2024, meeting our targets through a combination of growth in AUM and expense actions we've taken. As AUM grows and we continue to manage expenses, we expect the operating expense ratio to improve to approximately 45 basis points by year-end 2027 for a cumulative 15 basis points or 25% improvement over the three-year period. F&G is uniquely positioned in the industry with a profitable and growing $57 billion an in-force block that does not contain any problematic legacy business. Our asset and liability cash flows are well-matched. Our retail fixed annuities are 92% surrender protected and non-surrenderable liabilities include funding agreements, pension risk transfer, and immediate annuities. Over the past couple of years, both F&G and the industry have seen elevated terminations on annuities, which provide a boost to earnings from higher surrender charge fees when they occur. Beyond that initial benefit, terminations can temporarily pressure near-term spreads. As we move into 2026, this is a potential source of quarterly variability, and we feel that we benefit either way over the long term. If terminations flow from the current pace, we forego the incremental surrender charge fee income, but benefit from retention of the underlying retained assets and profitable in-force liabilities. If terminations hold at the current level, we continue to benefit from higher surrender charge fee income and freed up capital to deploy to new business with renewed surrender chargers and longer surrender periods, resulting in stickier in-force liabilities that generate significant margins over time. Next, I want to spend a few moments highlighting a capital transaction. We are on track to close a transaction during the first quarter with an investment firm, Ancient Financial Holdings LP to sell F&G Life Re Limited, our Bermuda-based legal entity with affiliate-only reinsurance, effective March 1st. In preparation for the sale, our Iowa operating company recaptured approximately $900 million, or one-third of F&G Life Re's affiliated statutory liabilities at year end. Approximately $600 million of this was ceded to an existing third-party reinsurance partner at year end we expect to receive net proceeds of approximately 300 million from the sale of the legal entity and the remaining runoff in force block including a return of capital in the form of a 200 million dividend of assets at year end 2025 from our bermuda entity to our iowa operating company blackstone will retain asset management for the in force assets and Ancient will manage assets under a new flow reinsurance treaty for MIGA new business. After the transaction closes in the quarter, we expect AUM to decrease by $1.9 billion. The foregone annual adjusted net earnings are expected to be approximately $10 million per quarter before deployment of proceeds and future flow reinsurance fee income. The transaction provides a number of benefits to F&G, including the transfer of capital through the dividend at year-end, and the opportunity through F&G's disciplined execution of risk transfer options to dispose of a valuable asset that we no longer need to support our reinsurance strategy. The transaction also provides counterparty diversification for MIGA flow reinsurance in the future, as we are always looking to expand with high-quality flow partners. As a reminder, F&G remains a U.S. domicile company. We are a full U.S. taxpayer, and all new business is originated in our U.S. subsidiaries. Turning now to our strong capital position, we remain committed to our long-term target of approximately 25% debt-to-capitalization, excluding AOCI, and we expect that our balance sheet will naturally de-lever over time. We continue to target holding company cash and invested assets at two times interest coverage. Our annualized interest expense is approximately $165 million, or roughly a 7% blended yield, on the $2.3 billion of total debt outstanding. We ended the year with an estimated company action-level risk-based capital, or RBC, ratio of approximately 430% for our primary operating subsidiary, above our 400% target, and boosted by the year-end recapture from the Bermuda legal entity. Importantly, F&G maintains strong capitalization and financial flexibility across all of our statutory balance sheets, including our offshore entities, which we conservatively manage to the most stringent capital requirements of our regulators and four rating agencies. From a capital allocation perspective, during 2025, our capitalization supported sustained asset growth, and we returned $137 million of capital to shareholders through common and preferred dividends. Notably, we increased our quarterly common stock dividend by 14% in the fourth quarter, as supported by our strong cash generation. to wrap up as i reflect on the past year we have extended our proven track record and positioned fng for long-term growth to recap some highlights we have executed on our strategy as we made continued progress toward our 2023 investor day target and improved our operating expense ratio by 10 basis points maintained a disciplined focus on our core products including indexed annuities indexed universal life and pension risk transfer allocating capital to the highest return opportunities significantly expanded in the earnings contribution of our fee-based flow reinsurance middle market life insurance and owned distribution strategies alongside continued growth and our spread based businesses enhanced our strong capital position to fund our organic growth, now supplemented by the launch of our sidecar that provides long-term, on-demand capital, created flexibility to monetize the intrinsic value in our own distribution strategy in the future, and we expanded our public float from 18% to 30%, enhancing market liquidity and broadening investor access to F&G shares. As I look ahead to 2026, we remain focused on growing our core business and delivering long-term shareholder value by continuing to increase our assets under management, primarily through our core products, generating additional incremental scale benefit, expanding ROE, excluding significant items, and moving further toward a more fee-based, higher margin, and less capital-intensive business model, leveraging our position as one of the industry's largest of sellers of annuities and lax insurance.
This concludes our prepared remarks, and now let me turn the call back to our operator for questions.
Operator
Thank you. If you'd like to ask a question at this time, you may press star 1 from your telephone keypad, and the confirmation tone will indicate your line is in the question queue. You may press star 2 if you'd like to withdraw your question from the queue. For participants using speaker equipment, it may be necessary to pick up your handset before pressing the star keys. One moment, please, for our first question. The first question comes from the line of John Barnage with Piper Sandler. Please receive your questions.
Appreciate the opportunity and hope you're all well. My first question, can you talk about software exposure in the investment portfolio? If you're underexposed to that area, where's some overexposure where you believe there is a strength? Thank you.
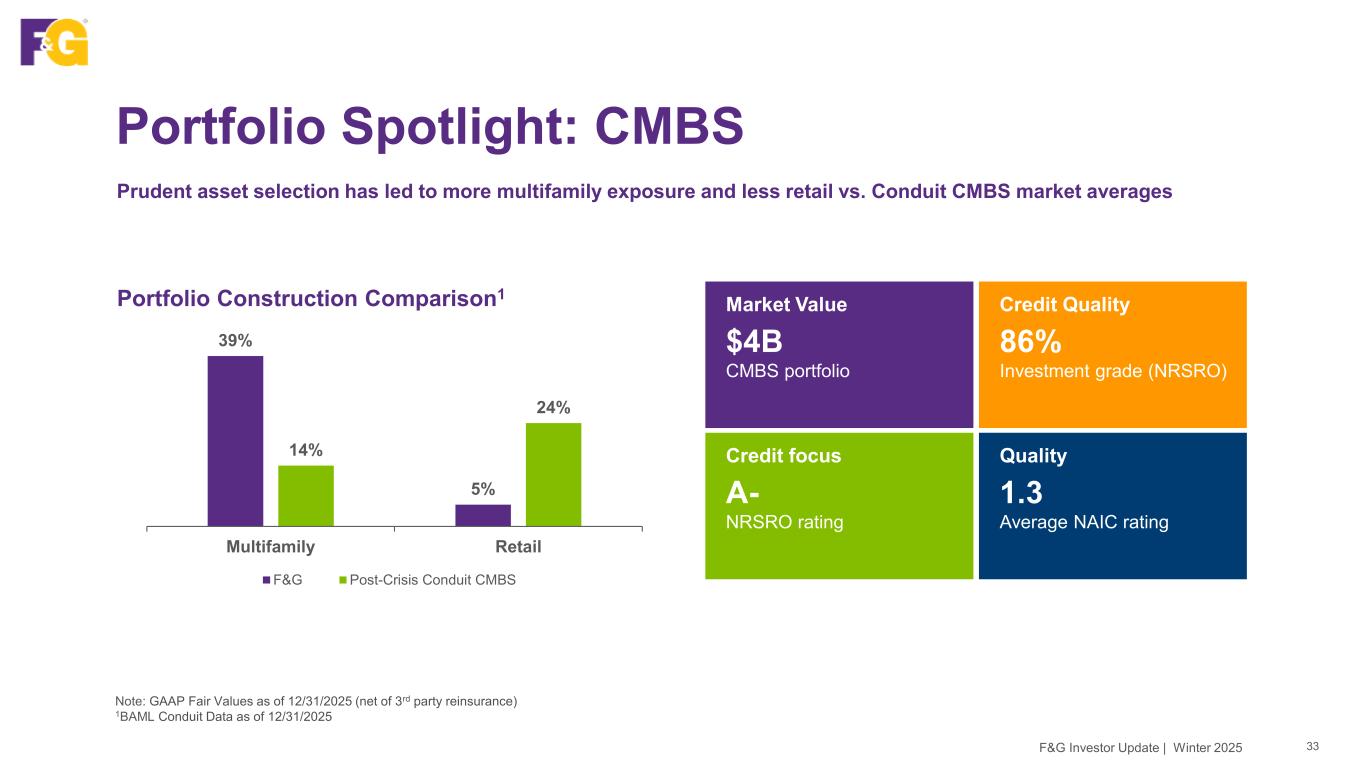
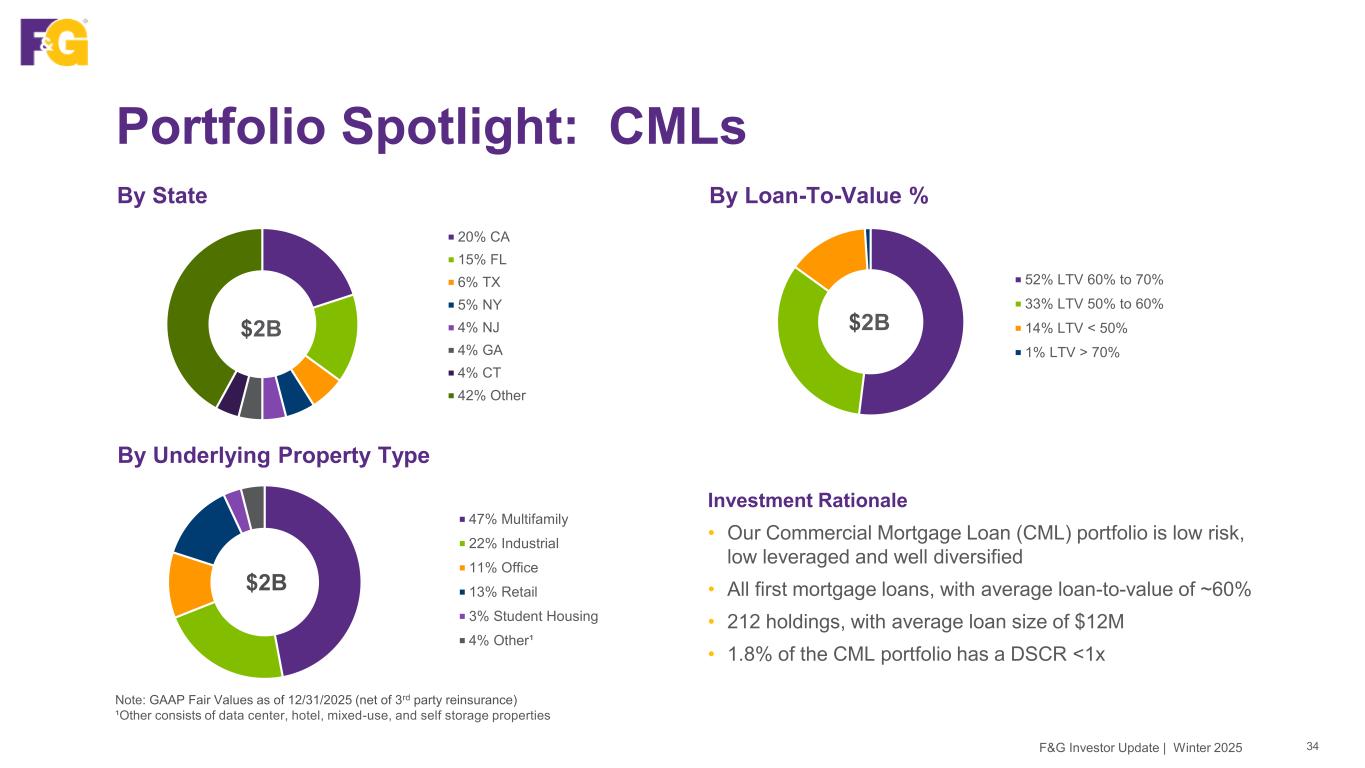
Hey, John, it's Chris. Happy to start with that. Yes, the software exposure for us is quite manageable. It's less than 5% of the total portfolio. If you break that down further, obviously, that's a huge category. We think it's less than 1% that has some potential for disruption or disintermediation risk. Obviously, underwriting for AI risk is not a new topic for Blackstone. They've been on this theme for probably a decade now and really have been focused on companies with durable use cases, high switching costs, structural moats, et cetera. So we feel really good about that exposure. Same thing on commercial real estate where we have, I guess, tenants that you would loosely call software tend to be the hyperscalers, and these are long-term leases with cash flows and low LTVs, et cetera. So we think we're in really good shape there. I do think there's tremendous upside in the private equity portfolio because, again, this is not a new theme. So, you know, disruption cuts both ways, but I would say manageable on the credit side with some pockets of upside in the private equity portfolio.
My next question, can you maybe talk about your near-term outlook for variable investment income, given it kind of underperformed in the quarter?
Yeah. So, John, at this point, I would say it's the same.
We have a blended return on the current basis of approximately 10%. And as we mentioned in Chris's prepared remarks, we were in that sort of seven, seven and change, seven, seven and a half type range for the quarter, seven blended for the year. So it remains the same. We feel very confident in what's in our portfolio. we I don't expect we did talk about we're going to do a geographic shift if you will in Q1 but I do not anticipate that there would be a commensurate change in the outlook and not that should be all that that should all that should not add to the same overall blended return so no real change and I think there's I think there's probably an air of optimism relative to where we are, but we're trying to be a little careful on that. I think others had maybe similar perspectives with their fourth quarter returns, and as they look into the beginning of 2026.
Yeah, I think Connor hit it. The only thing I'd add, John, is that from a planning perspective, we plan for, I would say, continued mediocre returns, because I think that's the prudent thing for us to do. But there are some encouraging signs.
We're starting to see more IPOs, more transaction activities so hopefully that continues but um you know our job is to not build a business plan around that it probably would also mention i think as you know obviously blackstone are our partner for this they have a good history of being a little on the conservative side too and having an increased value upon realization so as this continues we still feel very we still very still feel very good about our portfolio thanks for the answers if i could ask one more um as i look at your supplement you have a list of a number of your reinsurance partners and I see Somerset Rhee in there who has a relationship with the entity that's acquiring Bright House can you talk about your diversified panel your outlook for continued participation there by the existing partners and general demand in the market thank you yeah sure John thank you um well let me first well say yes i acknowledge obviously the relationship between somerset and aquarium um no indication of any kind uh from somerset or aquarium that anything would change with that relationship so let me let me be clear on that but um we have a we have a suite of um partners here in addition obviously to the sidecar with blackstone um we've got another one that we just told you about today with ancient so pleased about that there are others um we have um we have a lot of people who show up at our doorstep who want to be our reinsurance partners. And honestly, individual appetites at these companies ebb and flow. So you have to be prepared with a nice suite of partners. So no concerns at all. In fact, we probably have more partners than we can handle at the moment or could have more partners than we could handle. So feeling very good about that. And obviously happy to have another significant partner join us here on March 1st.
Operator
Thank you. The next question is from the line of Alex Scott with Barclays.
Operator
Please receive your question.
For the first one, I was hoping you could talk a little bit more about the transaction you mentioned and I think it sounded like you'd already gotten 200 into the statentity from that and maybe another 100 coming. I just wanted to check to make sure I have that right and also just get your thoughts on uses of that capital.
Hey, Alex, this is Chris. I'm just going to start with a little history of, you know, we set this up, I want to say six, seven years ago. And at the time, we thought we might have a path to be a flow reinsurer ourselves. And so there were some advantages to having a Bermuda operation. Our strategy is our organic business took off, our PRT business took off. We just didn't see that in our future. So it had effectively become just a runoff block of assets. Yet we knew it was a pretty valuable entity, had a multi-year track record, audited financials, a team, et cetera. So, yeah, being approached by the folks at Ancient who we thought were very credible potential partners, this looked like just a good opportunity to jettison an operation that really wasn't part of our go-forward strategic plans and pick up another partner. But I'll let Connor talk about some of the details behind it.
Yeah, just the pieces building towards your question. So as we mentioned, we recaptured a third of it, reinsured 600 of that 900. We've got 1.9 billion of AUM moving across. So, proceeds of 300, of which 200 essentially has already been included in that RBC number at the end of the year. So, part of why the RBC number is in the 430 range. I think last year we were sort of 410. So, we don't obviously expect to continue to run the company at a 430 range. So, that's in capital flexibility. Remaining, therefore, just mathematically proceeds at 300, 200 already. So there's another 100 to come. I would describe that towards general uses, sales, growing the business, very focused on growing AUM. But I would also take the chance to reiterate, we're going to stay very disciplined. So as we will write great business when the opportunity arises, if the margins are not there, we'll be a little patient. And if that means we have more cash and more capital along the way, then I think that's probably a good thing as well.
Thanks. I wanted to also circle back on the crediting rate, or sorry, the surrender fees and how they're contributing to the crediting rate and just think through that a little. We've seen this at some other spread-based companies where there's been a temporary drag of sorts that surprise people. Where are the surrender fees? Where do you expect them to go to? I just want to make sure I'm understanding and incorporating in my estimates enough ROE pressure because, you know, we're forecasting your ROEs going up because you have this plan to send it up. I just want to understand if that's going to take a little more time because of this dynamic. Can you help us understand that?
So there's quite a number of pieces to that, but if I maybe put it into an ROA context or the surrender fee income, we mentioned a little bit of this coming into the call. Obviously, it's been contributing to ROA, but specifically to your question, we would expect that the volume of surrenders and therefore the related surrender fee income to be lower in 26 than 2025. Now, from an ROA perspective, there are other components as well. We've highlighted the fact that we expect that the investment ratio will continue to improve. So I think all in all, I would imagine in the very near term, that's maybe, you know, we might be kind of around where we are. We may be in some element of a plateau. But I think you're thinking about it the right way, right? If surrenders come down, when we have more assets, and honestly, I think we would rather have the assets. And if that meant a less muted expansion of ROA, but higher AUM, we would be good with that. But I think, yeah, I mean, I would argue, I think that both the, I would say the prepayment number, probably a little higher in 25 than we might see in 26, that's pretty modest. But I wouldn't be surprised if we saw surrender related fees on, you know, 20% roughly from where they are would be kind of where my head is thinking. But obviously, a lot of that depends on external factors and interest rates and suitability rules at other companies and everything about. So it's hard to tell, but that frames the way we're thinking about it.
Yeah, Alex, the only thing I would add to that, what Connor said, is just to link a couple things, because it's hard to isolate just one metric. So there's no doubt ROA has been pumped up a little bit through excess surrender fees. But the same phenomenon that has caused that has also caused muted realizations in the PE portfolio. And that means that we've had to operate with significantly less capital, you know, getting 7% versus 10 on 10 billion of AUM that goes directly to capital. So seeing surrender fee income drop off a cliff would probably be driven by a pretty sharp move down in interest rates, which I think would have some offsetting positives for us. So obviously, it's all linked. So another way, ROA would undoubtedly be lower if not for all the excess surrender fees. But my guess is AUM would be significantly higher than it is at this point, too.
That's helpful. I have a couple more, but I'll recue. Thanks.
Operator
Our next question is in the line of Mark Hughes with Truist Securities. Please proceed with your question.
Yeah, thank you. Good morning. Connor, the 15 basis points of improvement over three years, could you refresh us on how that's going to break out?
What are those specific big pieces that are going to contribute to that um well really it's it's it's expense so it's obviously the ratio is AUM to expenses but essentially what I would say is that we will keep our overall expenses about we actually aim to keep our expenses entirely flat year over year 25 into 26 if you were going to peel into that a little bit between kind of the fixed and variable I would say that while we continue to grow, we'll pull our fixed costs down a few percent in order to fund the variable, you know, the offsetting few percent on the other side. So I want to make sure I'm answering your question, but that's really the overarching way is that we'll continue to grow, but we won't grow expenses. We mentioned, you know, getting another, you know, so it's going to be another 10 percent, another five basic points. And, you know, we'll do everything we can to do that as quickly as we can. Good.
And then what's the latest thoughts in terms of the trajectory on Ryla sales? I think you're describing a steady improvement, still off of a small base. How do you see that over the next couple of years?
Yeah, we feel very good. We combine our Ryla. So far, we still combine our Ryla with our FIA. But, you know, that's the... We talk about a lot of core products, but that might be the most core, if you will, the combination of FIA and Ryla. So we're very pleased with Ryla, but it's off a small base, right? We haven't been in the space that long. And as you know from everybody else, it takes a little while to get going. But we're really, really happy with where the Ryla is going. And I would maybe just also echo really happy with where... FIA and IUL are going. PRT, obviously, a bit seasonal. That's the other core one. You tend to do a lot more in the back half of the year than the front half. And then we'll remain opportunistic on FABN and MICA.
Operator
Appreciate that. Thank you. Thanks, Mark.
Operator
The next question is coming from the line of Wilma Burtis with William James.
Operator
Please receive your questions.
Hey, good morning. You said a little bit lower FABN quarter over quarter 4Q. That was pretty similar to other issuers. Maybe just talk a little bit about any causes of the slowdown in the quarter and what is causing the bounce back in demand so far in 1Q26. Thanks.
Honestly, I think for us too, that is, to repeat myself a little bit, it's opportunistic for us. So we were very happy with what we wrote in terms of just deploying capital and find that really just the balance in total between volume and return. And in the third quarter, we had the opportunity to write an FABN where we had, I would say, an increased interest from the big, big asset managers, which helped pull in our credit We were many, many times oversubscribed. And I think it's been a good market, in fairness, for others as well. We came into the new year with a view of, well, let's see if that's still good or perhaps even better. And honestly, it just it was. It was a really good time. We came in right at the end of the beginning of the year, January 6th. It was a really good time to come into the market. It felt like a nice amount to put to work. We could have written more than the 750, but you're trying to do the balancing act of getting the price where you want as well. So you want to pull in your spreads, you want to be oversubscribed, and you want even more of the big asset managers. At this stage, we have essentially them all. So really very pleased with that. And now we sit back. I think you're probably aware at this stage now we have to wait until after all the statutory filing and stuff are done. So we won't even have an opportunity until late in the second quarter. But we won't – FABMs are not something we'll do every quarter. We'll come in and out just as we see the prevailing trade winds being very effective. So I would have a reasonable expectation we'll do more during the year, but as to exactly which quarter it will fall into, we'll be very much market dependent.
Thank you. And then maybe you could talk a little bit about MIGA sales. It seems like there's been a bit of a pivot towards the index products. Is that something you expect to continue to see, given the interest rate environment is changing a little bit? Maybe just give us a little color there. Thanks.
Yeah, I'll be careful here because each entity, each company has maybe a slightly different view here, and I'll speak specifically about ours. We are seeing better relative returns elsewhere. uh meaning across the other the core product so look we will we're still in the miga business we will continue to write miga but we'll be a little more selective about it so we are entirely prepared to write less here and and and deploy that capital in in other places and and that's right now like we are there are there are times even last year there's quite quite a i think a significant fluctuation between q1 and q2 but a quiet first quarter a big second quarter and i think the rest of the year. We're kind of in between those bookends. But yes, to be even more specific, we continue to view the opportunities as being better in other products, even as we head into early 2026 here as well.
The only one that's, Chris, the only thing I would add to what Connor said is I wouldn't call it a pivot. I think for seven years now, our number one priority has always been grow FIAs, right? Then we added RILA, PRT. And if the returns are there, MIGA, we reinsure the vast majority of our MIGA out. So if the returns and the demand from the reinsurers are there, we will certainly write it. If they're more attractive places to put capital, we will do that. So it just happened to be that I think FABN in particular was more attractive from a return perspective than writing extra MIGA at the margin.
Hopefully I mean, we have been seeing over the last few years a top 10 rider in all of these, in FIA, in IUL, in PRT, and in MIGA. So, you know, we'll move up and down that scoreboard a little bit or that leaderboard a little bit as the opportunities shift.
Operator
As a reminder to ask a question, you may press star 1 from your telephone keypad. The next question is a follow-up from the line of Alex Scott with Barclays. Please receive your questions.
Hey, thanks for taking the follow-up. So I wanted to ask you a bit about just sort of high-level view on valuation. You know, I heard you on de-risking some of the fixed income. I thought that was interesting. I think, you know, one of the things that maybe holds people back from giving you credit for the fee-based business you have It's just the sheer magnitude of the non-investment income that comes from your alternative investments and like the other parts of the non-fixed income portfolio. So is there anything you can do there to, you know, sort of ease some of the tension there with shareholders or the way investors are viewing it? I mean, is that something that you guys contemplate?
Yeah, this is Chris. I'll start and just say, you know, from a valuation standpoint, we're trading at 62 cents a book value. So you tell me, like historically that is associated with companies with massively toxic liabilities, not a pristine fixed book of surrender charge protected FIAs and non-surrendrable liabilities. So yeah, it's extreme, the valuation difference right now. We've tried to give a lot more disclosure this quarter around credit and specifically what's in the private credit portfolio. So hopefully that helps, including refreshed, stressed test numbers. So yeah, the stock is trading as though there are billions and billions of credit losses coming. It's pretty inexplicable to me, to be quite honest. I would say we have two other assets that are quite undervalued. One is our middle market, cultural market life insurance business, which is a quite valuable asset. And then the other is own distribution, which we spent quite a bit of time on, which I think we have multiple avenues to monetize that business over time. So, yeah, I think it is extreme. I will defer to Connor on alternatives. It's one of the reasons we have split out the equity component because we were sort of capturing and defining alternatives as anything that showed up on a certain schedule. It's not the right way to think about it. You know, the majority of that portfolio is investment grade and in most cases, in the vast majority of cases, investment-grade fixed income. But, Conor, I'll defer to you if there's more you want to add to that EII discussion.
Yeah, I'll say a couple of things. I mean, broadly speaking across the portfolio, I mean, it's been pretty pristine. I've heard others be very proud of their low double-digit impairment-related numbers over the last few years, and we're half of that. So, you know, I get why people are concerned, but in terms of what's in our portfolio and how well it's been performing, it has been very noteworthy for us. We did – there's definitely an attempt. I mean, I feel that there's kind of a lowest common denominator, you know, we're viewed perhaps as a single business that's heavily spread rather than kind of component parts like life or own distribution, et cetera, as Chris alluded to. And that was why there was a significant attempt to help rectify that with this new disclosure around the fee versus spread, because we wanted to demonstrate that we have actively made a very significant shift here. And we've talked about an expansion from, I think, in the disclosures, we talked about going from less than 5% to 15%. I would actually argue it's probably closer to like zero to 15, because if you did a full attribution of expenses and debt to that, what was essentially the life business back three years ago, it would have been it would have been very small. So now that 15 percent of our earnings are coming from the fee business and you can see that we have an expectation that that will grow to 25 just organically without without anything else over the next three years, over the three years of the plan cycle. So that's definitely a step in that direction. We're going to continue to talk about it. It will increase our exposures and perhaps even related educations around those businesses, the own distribution business, the life business as we go here. And hopefully that will help. Obviously, we need the old portfolio. I think the disclosure changes we'll make next quarter will help as well. But at the end of the day, obviously, as Chris said, we have an expectation, near-term expectation that we're not going to get to that 10% quite yet. But obviously, that will help a lot. and, again, absolutely pristine set of liabilities. I mean, there's nothing. It's a young, clean book of business, so there's really nothing to be concerned of there. Very well-surrender-protected, performing very much in line with our expectations. So we'll see.
Maybe a follow-up to that is, you know, when I think about the last couple years, even the non-fixed income just being closer to 7%, percent to hit the funding requirements for your growth you know i think in in both the last two years there were you know things that happened right like there's an equity raise one of the years and then this year there's the selling of uh legal entity which is you know it's good could you have that tool this year for sure um but you know the private equity returns have to be 10% plus for you guys to be self-funding? Is that an incorrect takeaway from that? How would you describe this?
All right. I'm going to start with thank you. I'm actually really glad you asked the question that way. No. So you're right. You tell me, but I have a sense that the equity rates perhaps raised concerns that we either needed to continue to rely on F&F or the equity market to have the capital to write the business. And that's not the case. And we've done everything we can to allay those fears in the quarter since then. And I will reiterate today that we are capital independent. We have the capital we need to continue to grow AUM, continue to write business, et cetera. I mean, at this stage, the book is essentially throwing off all of the capital that we would need to write all the business that we would want to write. So that is not the case. And I would also suggest, too, that, yes, I mean, we would like, on average, over the long term, we expect these returns if they are delayed in coming. We have been measured in our expectation through the, you know, and even in our plan cycle as well. So, in a scenario, like, if the scenario is that it remains at more of a seven-ish range, we're absolutely fine. We might ride at the lower end of our sales target volumes. But again, I think our sales volumes are going to be tied more to market opportunity and the best uses of capital. So I do not feel that capital is a constraint sitting here with my CFO hat on. I think the constraint a little bit is just what will the earnings opportunity be in the marketplace and therefore we'll decide how much we want to write and where we want to put them. But absolutely, from a capital point of view, we are capital self-sufficient, capital independent.
We're all good. Thanks for all the responses.
Operator
Thank you. And this will conclude our question and answer session. I'll now turn the conference back over to CEO Chris Blunt for closing remarks.
Great. Thanks again, everyone, for joining the call this morning. We delivered a strong finish to an outstanding year and continue to execute on our strategy toward a more fee-based, higher margin and less capital-intensive business model. Looking ahead to 2026, we remain focused on continuing to grow our core business and delivering long-term shareholder value. We appreciate your interest in F&G and look forward to updating you on our first quarter earnings call.
Operator
Thank you for attending today's presentation. The conference call has concluded. You may now disconnect.