Operator
Hello, and welcome to WP Carey's first quarter, 2026 earnings conference call. My name is Diego, and I will be your operator today. All lines have been placed on mute to prevent any background noise. Please note that today's event is being recorded. After today's prepared remarks, we will be taking questions via the phone line. Instructions on how to do so will be given at the appropriate time. I will now turn the program over to Peter Sands, Head of Investor Relations. Mr. Sands, please go ahead.
Good morning, everyone, and thank you for joining us for our 2026 First Quarter Earnings Call. Before we begin, I need to remind everyone that some of the statements made on this call are not historic facts and may be deemed forward-looking statements. Factors that could cause actual results to differ materially from W.P. Carey's expectations are provided in our SEC filings. An online replay of this conference call will be made available in the Investor Relations section of our website at wpcary.com, where it'll be archived for approximately one year and where you can also find copies of our investor presentations and other related materials. And with that, I'll hand the call over to WP Carey's Chief Executive Officer, Jason Fox.
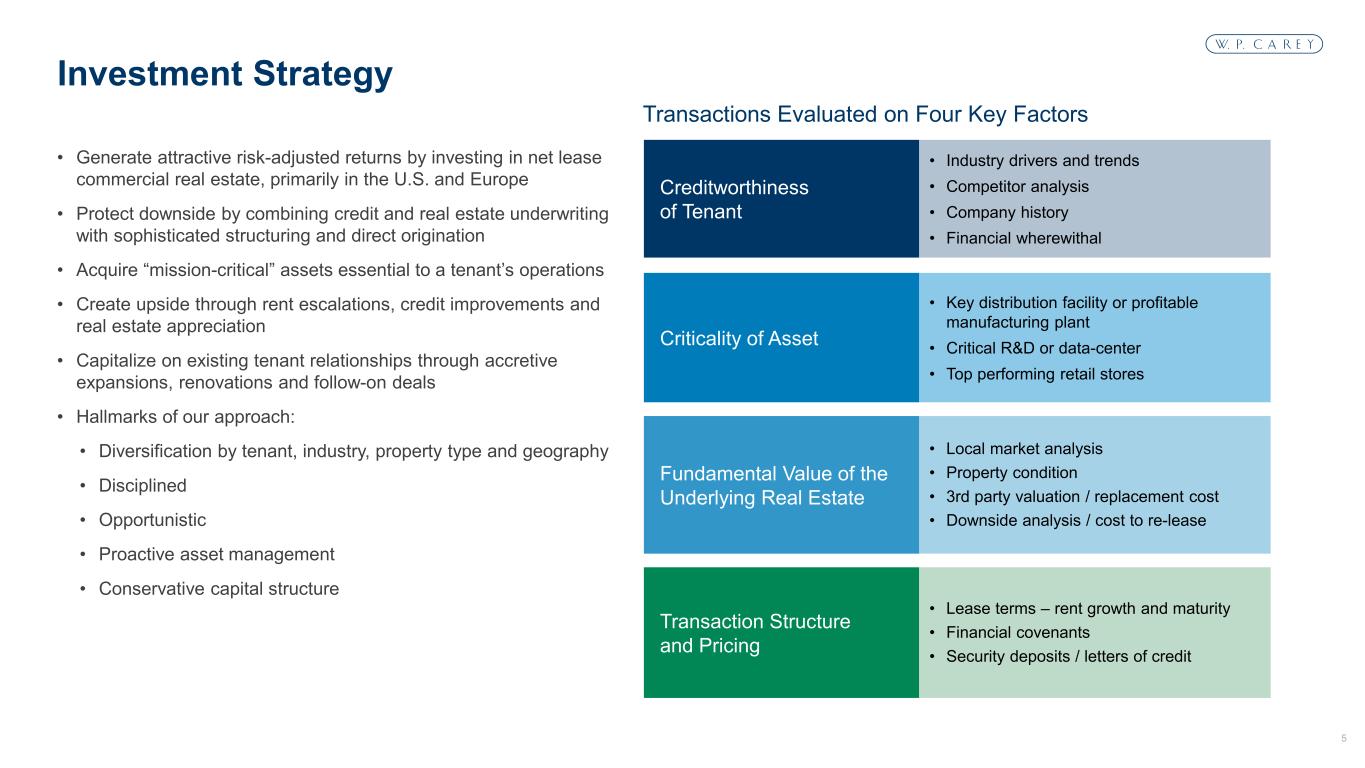
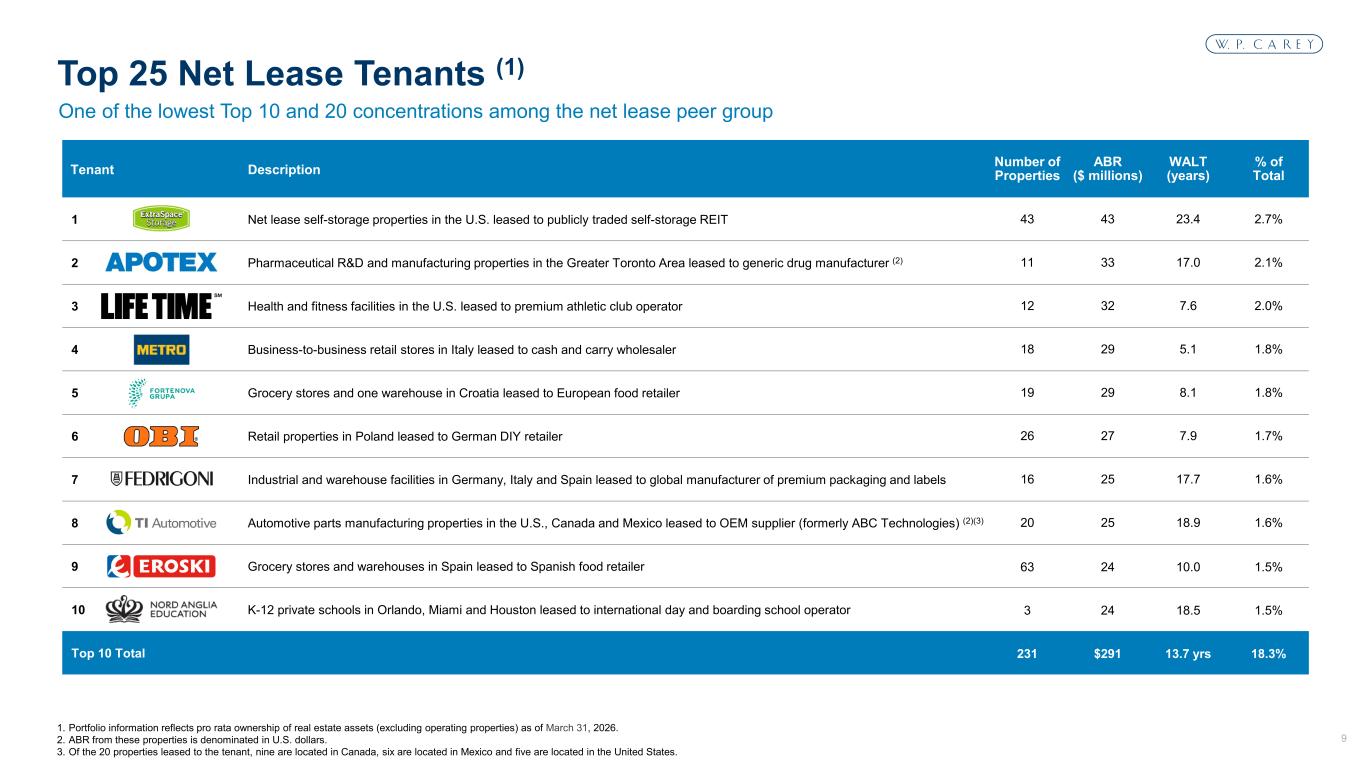
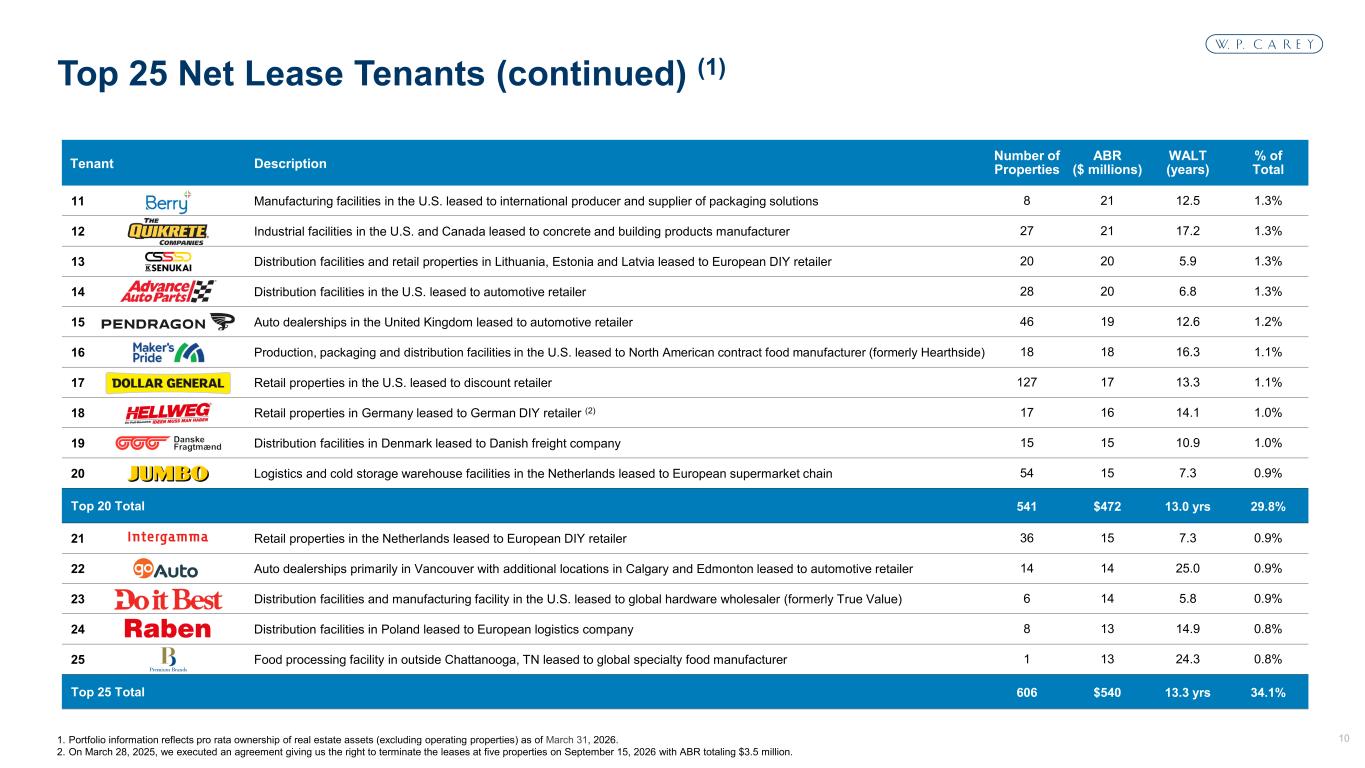
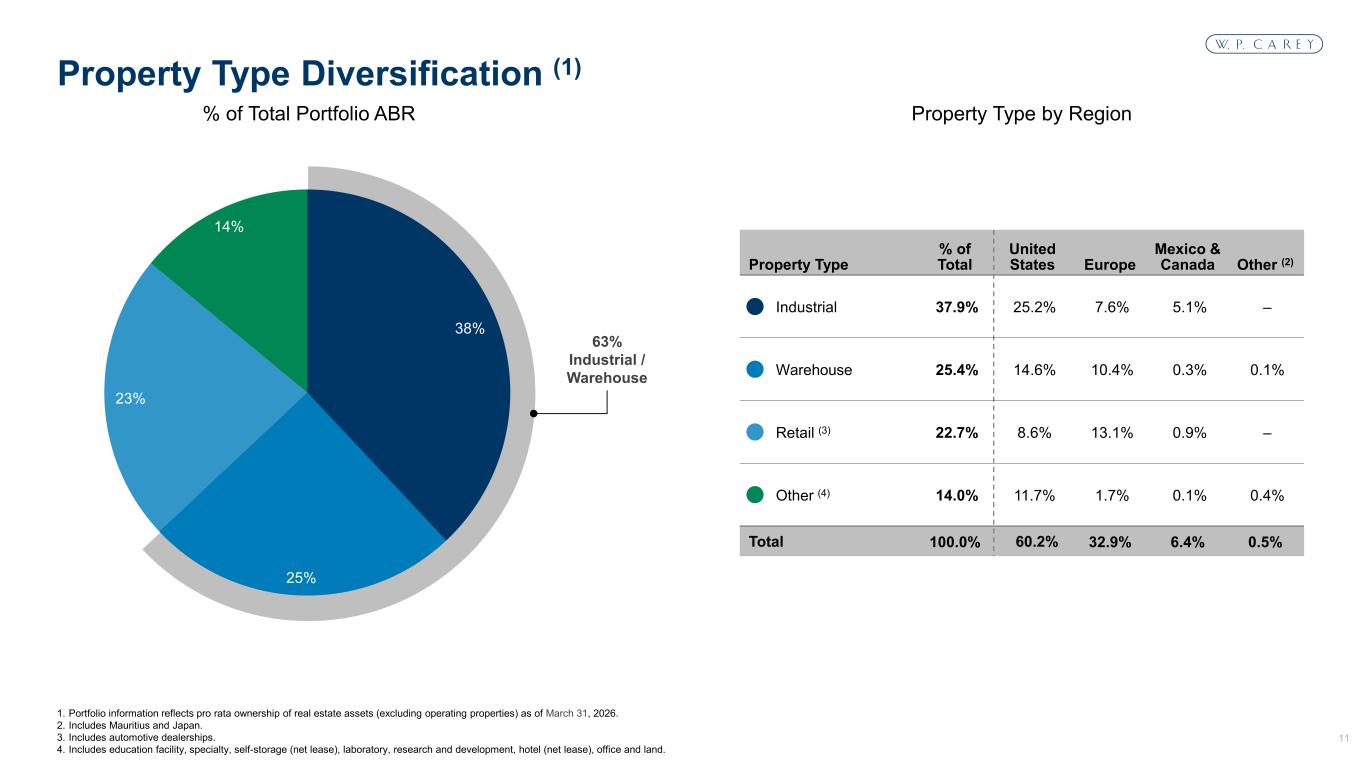
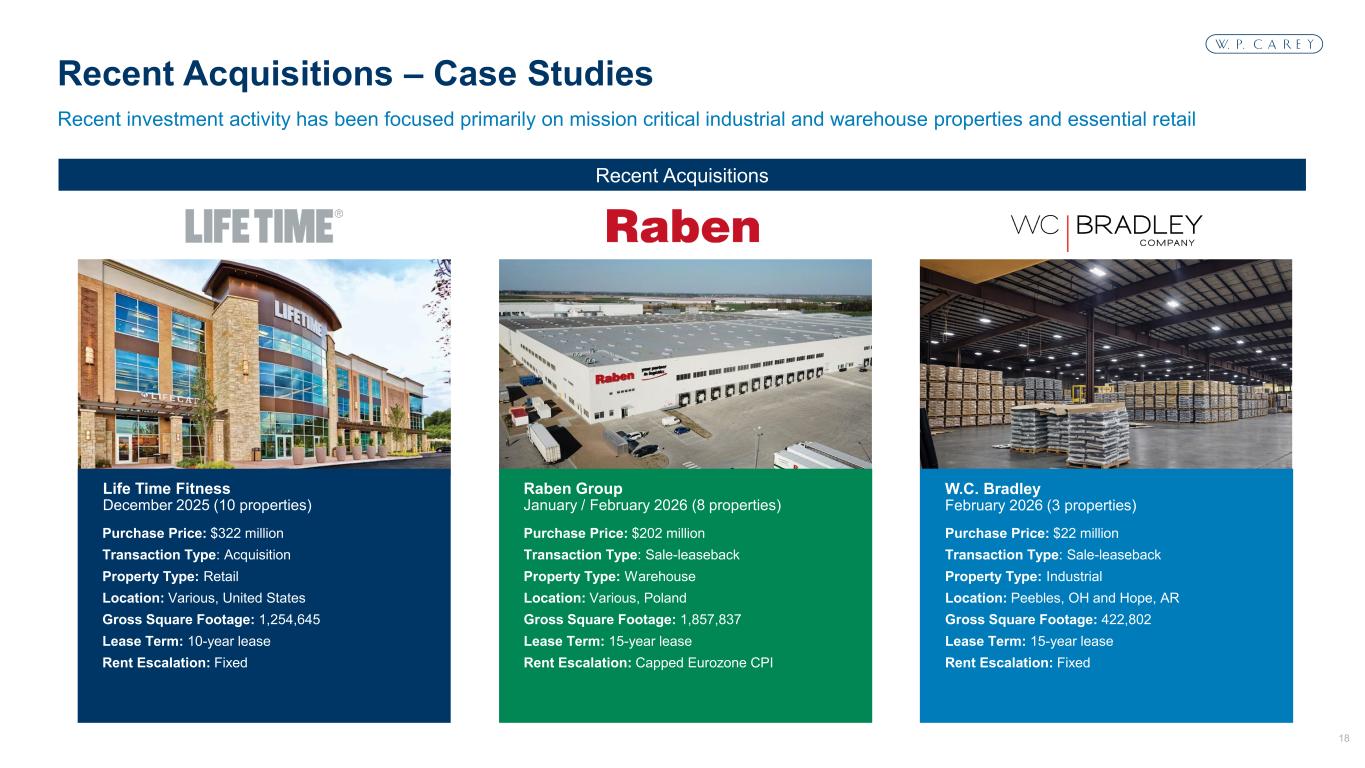
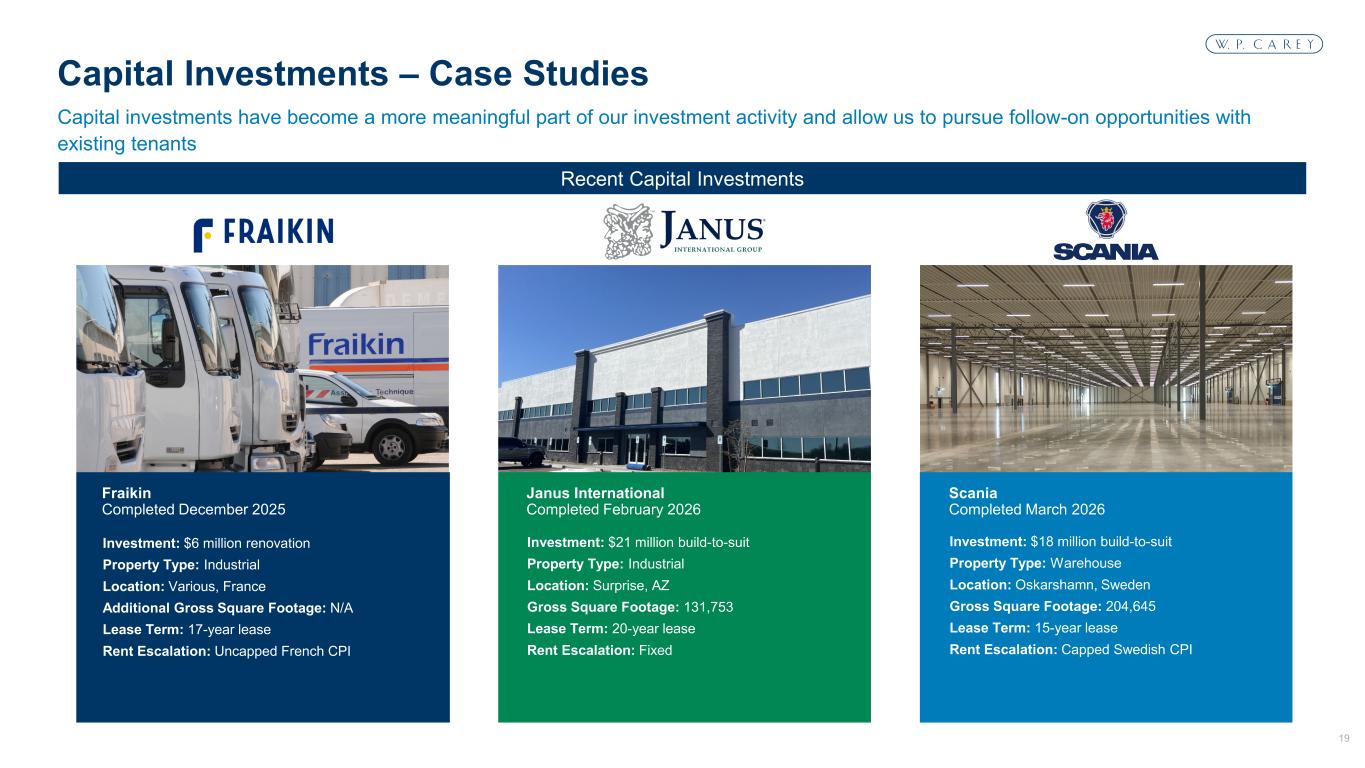
Thanks, Peter. Good morning, everyone. I'm pleased to say we've started the year with continued strong execution across the business, particularly in our investment activity and capital raising, building on the foundation we've established for attractive, sustainable growth. Given our performance to date, we're raising our full-year guidance for both investment volume and AFFO per share, reflecting the investments we've completed to date, the strength of our pipeline, and a more favorable outlook for estimated rent loss. This morning, I'll briefly recap some of the highlights from the quarter, focusing on our investment activity. Tony Sanzone, our CFO, will then take you through the details behind our results, balance sheet, and guidance. We're joined by Brooks Gordon, our head of asset management, to help answer your questions. Starting with our investment activity. So far this year, we've completed investments totaling approximately $680 million. Our pipeline remains very strong, with over half a billion dollars of deals currently at advanced stages, including the sale-leaseback of a large industrial portfolio that's in the final stages of closing. That gives us clear visibility into well over a billion dollars of investments. Importantly, we've continued to see strong momentum in our deal flow, with no noticeable impact on transaction activity to date from recent geopolitical tensions. Given our activity and outlook, we've raised our guidance range for full-year investment volume by $250 million to between $1.5 and $2 billion. Factoring in what we've already closed, Our current pipeline and the capital projects we have delivering this year results in an average cap rate of approximately 7.5%, and for the full year, we expect to remain around that level. We continue to transact across a range of cap rates, and the deals we've closed year-to-date have generally skewed toward the low end of our target range and below where our pipeline is pricing, with closed transactions averaging 7.2%. This largely reflects timing as it includes some of what we expect to be our tightest cap rate deals over the first half of the year. I'd also highlight that our investment activity to start the year has been mostly weighted towards Europe and Canada, where we secured lower cost debt during the quarter, including a two-tronche Euro bond offering at a 3.5% average coupon and a Canadian dollar term loan at just over 3%, helping maintain attractive spreads to our going in cap rates. We also continued to originate deals with fixed rent bumps, averaging in the high 2% range, or with CPI-based rent escalations. As a result, we're still achieving average yields of around 9% over long lease terms. During the first quarter, we allocated the majority of our capital to warehouse and industrial properties, which accounted for approximately 60% of investment volume. Retail represented the remaining 40%, driven largely by the sale-leaseback we completed with GoAuto, for a portfolio of auto dealerships with strong site-level coverage, concentrated in the greater Vancouver area. GoAuto is the second-largest automotive dealership group in Canada and now ranks among W.P. Carey's top 25 largest tenants by EBR. We completed four capital projects during the quarter, totaling $68 million, which are included in our year-to-date investment volume, and added a handful of small projects scheduled to deliver later this year. In total, we have 11 capital projects totaling approximately $280 million delivering over the next 12 months. These projects are generating cap rates incrementally higher than both our year-to-date investments and our full-year expectations, providing attractive risk-adjusted returns. As I've discussed on prior calls, these projects, particularly the expansions, frequently deliver above market yields, while also extending lease terms and enhancing the strategic importance of the assets involved. Given the size of our portfolio and our long history in this area, further supported by our recent Cary Tenant Solutions Initiative, we believe we're well positioned to expand this highly attractive proprietary source of deal flow. Our internal growth also remains strong and continues to trend higher on new investments. And if inflationary pressures from higher energy prices persist, our portfolio is uniquely positioned to benefit, given the high proportion of ABR with rent escalations tied to CPI. Lastly, turning to our sources of capital, our investment activity continues to be supported by well-executed capital raising, driven by the debt issuance and forward equity sales we completed in February. In addition to further strengthening our balance sheet, these actions have effectively pre-funded our investment needs for 2026. We've also locked in attractive pricing and meaningfully reduce our exposure to potential further capital markets volatility this year. As a result, we're confident we can continue deploying capital throughout 2026. As a reminder, we also expect to generate around $300 million of retained cash flow this year, providing an additional source of equity capital. And while additional asset sales are not a core part of our funding strategy, we continue to have the flexibility to pursue additional accretive dispositions at attractive cap rates if needed. Let me pause there and hand the call over to Tony to discuss our results, balance sheet, and guidance in more detail.
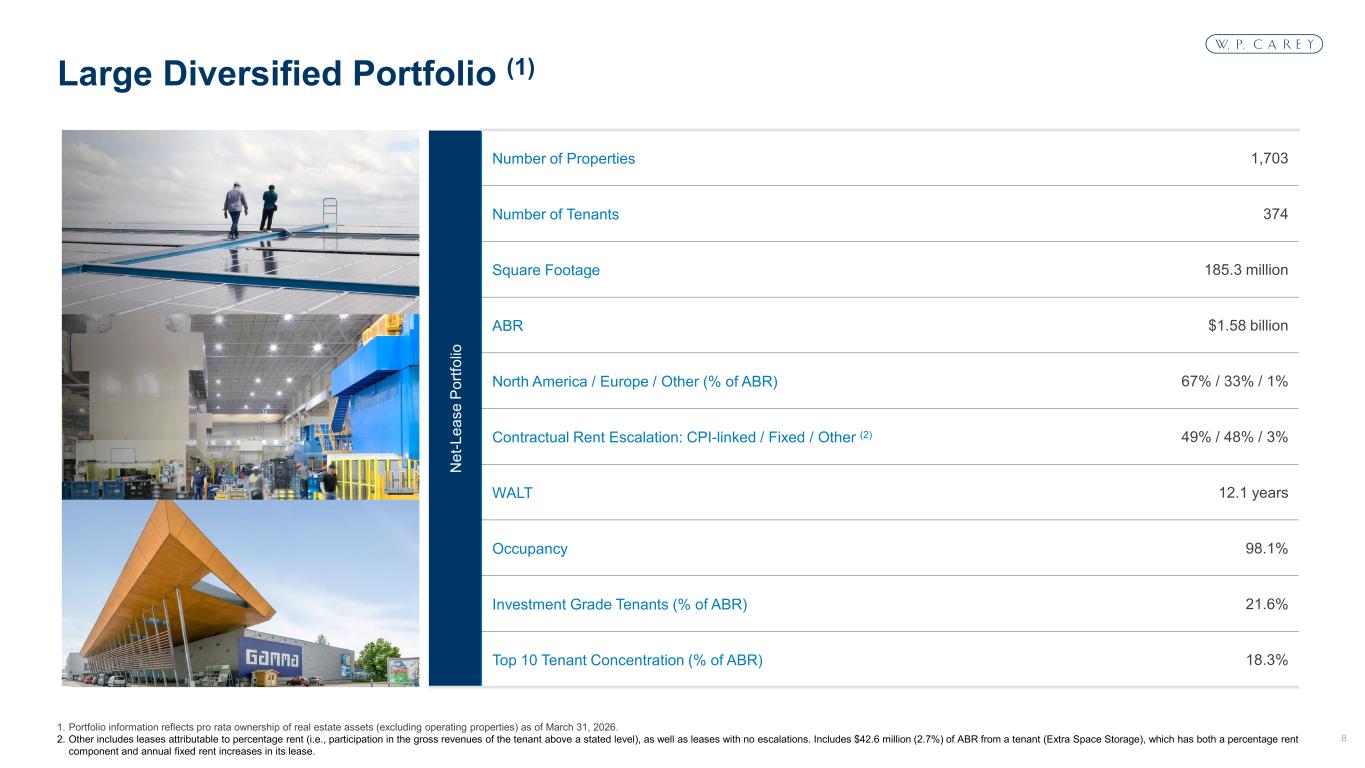
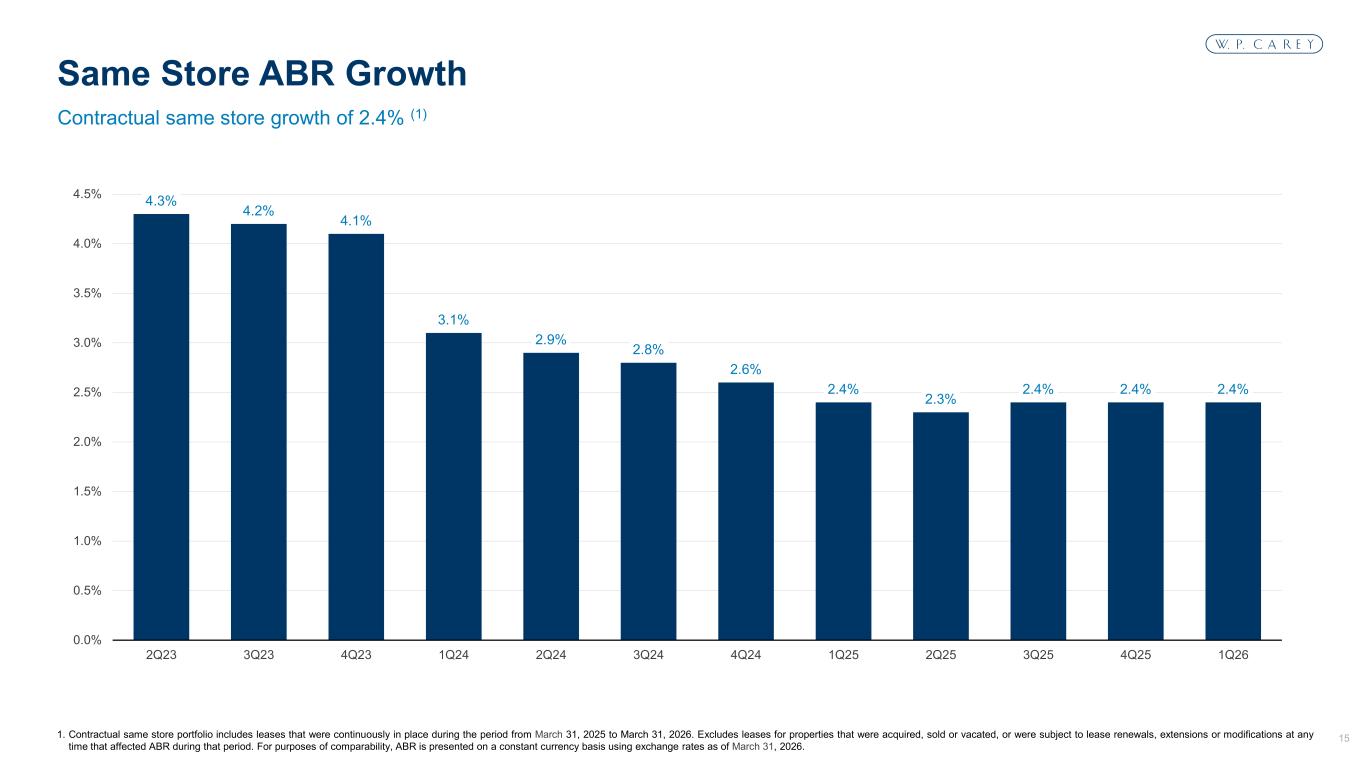
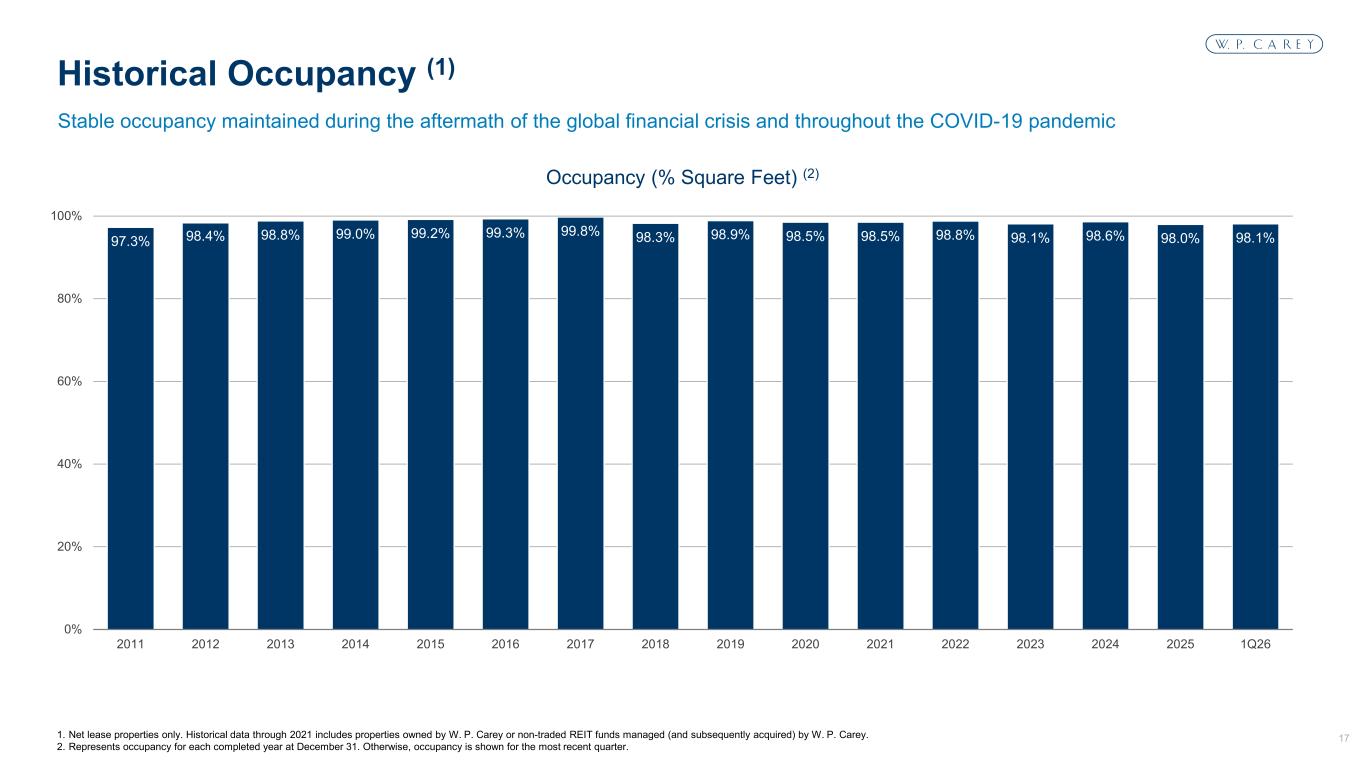
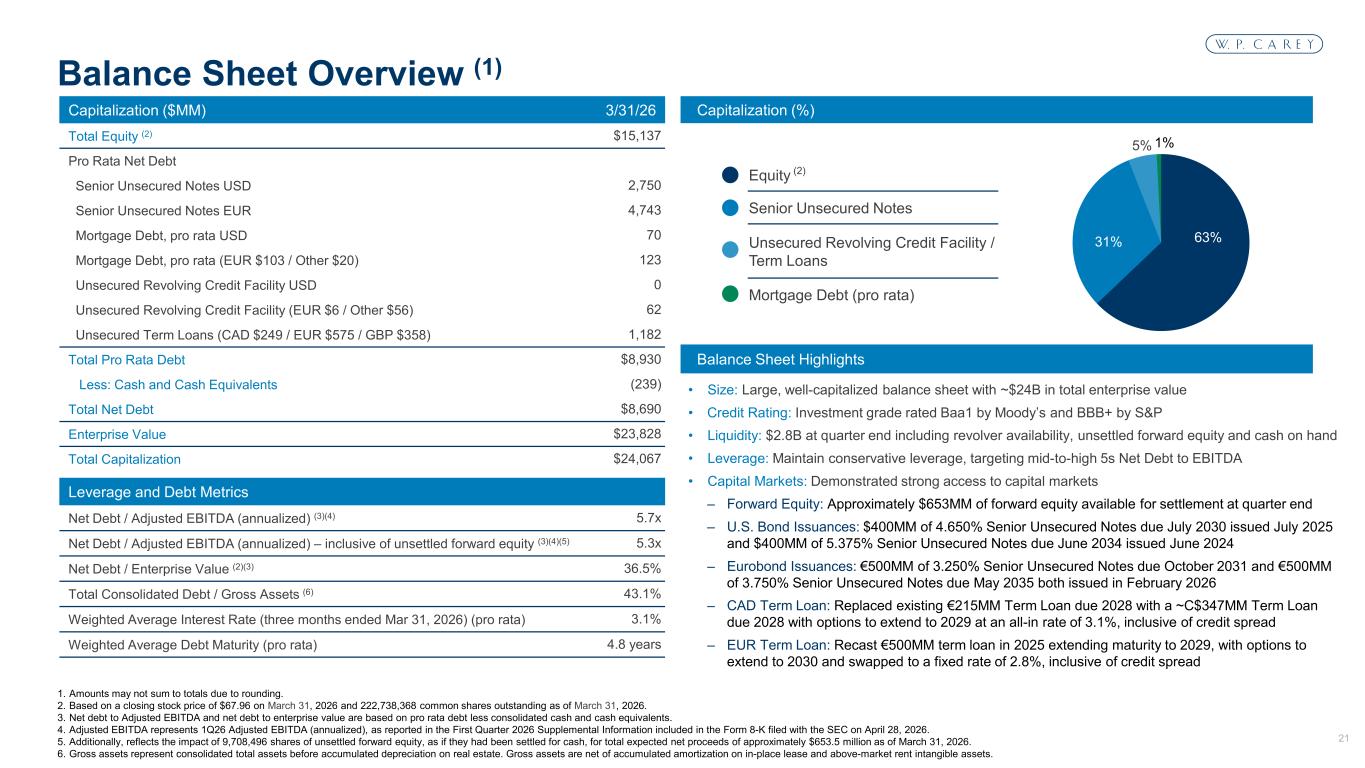
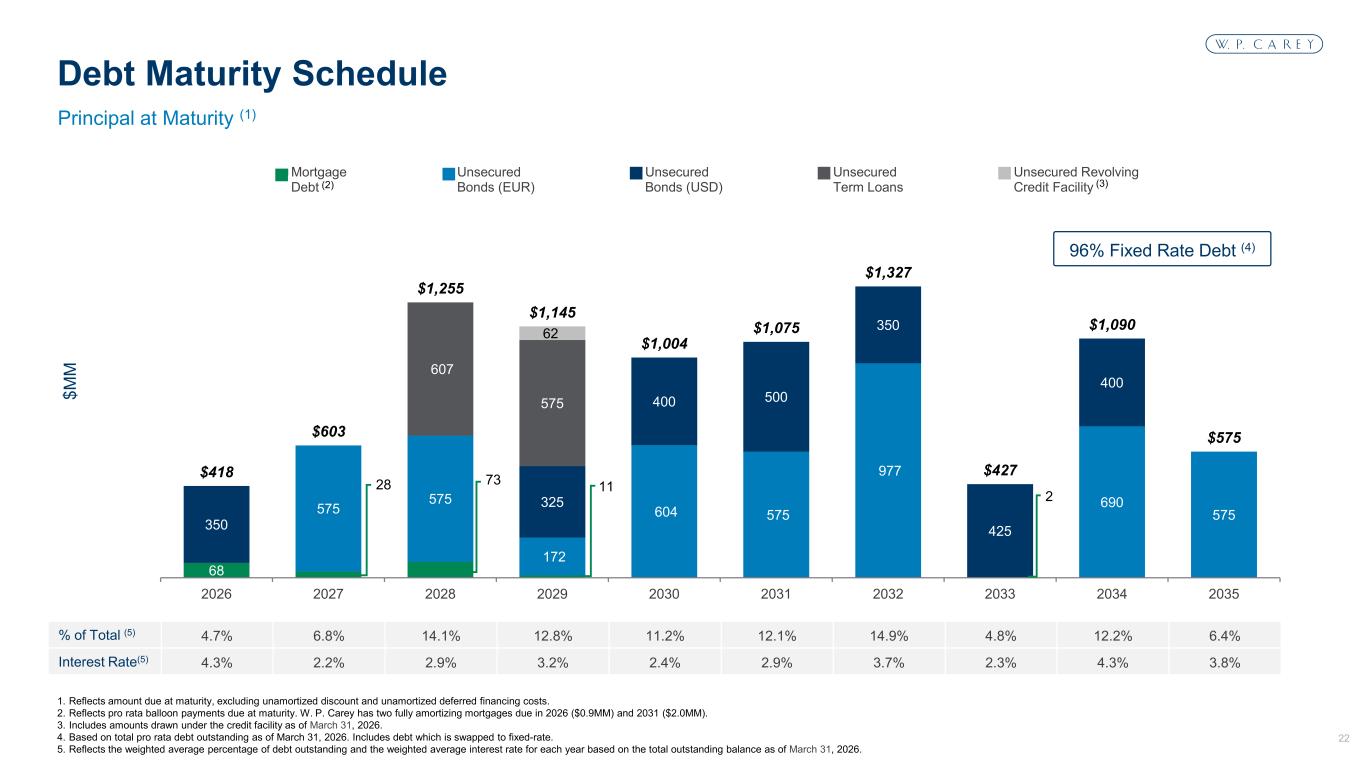
Thanks, Jason, and good morning, everyone. Starting with earnings, AFFO per share was $1.30 for the first quarter, which represents a 13-cent or 11.1% increase compared to the first quarter of last year. Accretive investment activity continues to drive our year-over-year growth, having closed $2.8 billion of investments since the start of 2025 at accretive cap rates and healthy spreads to our funding sources. As mentioned, given the pace and volume of our investment activity to start the year, as well as the strength of our pipeline, we've raised our expectations for both full-year investment volume and AFFO per share. As outlined in our earnings release, we've increased our investment volume guidance to a range of $1.5 to $2 billion which together with lower estimated potential rent loss results in an aggregate $0.03 increase to our AFFO per share guidance at the midpoint. For 2026, we therefore currently expect AFFO per share to total between $5.16 and $5.26, implying 4.8% growth at the midpoint. Turning to our portfolio, starting with dispositions. First quarter asset sales generated gross proceeds totaling $163 million. This included the sale of the 11 remaining operating self-storage properties in our portfolio for $75 million. With that, we've now completed our exit from operating self-storage, further simplifying our business and generating aggregate proceeds of approximately $860 million at an average cap rate just below 6%, which we've recycled accretively into higher yielding investments. Contractual same-store rent growth for the quarter was 2.4% year-over-year, with both fixed and CPI-linked rent escalations averaging 2.4%. For the full year, we continue to expect contractual same-store rent growth to average in the mid-2% range. We continue to achieve strong rent escalations on our new investments. About three-quarters of our investment volume during the first quarter had leases with rent increases tied to CPI, while the other one quarter had fixed rent escalations, averaging 2.8% annually. Comprehensive same-store rent growth for the quarter, which takes into account the impacts of releasing, rent collections, vacancies, and lease restructurings, was 1%, with the variance to contractual driven largely by the impact of vacancy during the quarter. Given the nature of this metric, comprehensive same-store rent growth can vary from period to period, often due to one-time items or properties moving in and out of the same-store pool. Historically, our comprehensive same-store rent growth has trailed contractual by approximately 100 basis points on average, and we believe that's a reasonable estimate for the portfolio over the long term. Portfolio occupancy at the end of the first quarter was 98.1%, up slightly from the fourth quarter, and is expected to improve further as we continue to re-tenant or dispose of vacant assets. Our portfolio continues to perform well with no new material changes in credit throughout the portfolio so far this year. We've therefore lowered the potential rent loss assumption embedded in our AFFO guidance to between $8 and $12 million, or about 50 to 75 basis points of ABR, down from our prior estimate of $10 to $15 million. And based on what we see today, we would still characterize our revised assumption as conservative. Our first quarter releasing activity resulted in the overall recapture of 103% of prior rents on 1.4% of portfolio ABR, and added just over five years of weighted average lease term. Other lease-related income for the first quarter was $10.5 million, in line with our expectations, and includes termination income related to redevelopment work that commenced this quarter. Based on our current visibility, we expect other lease-related income for the second quarter to be in line with the first quarter and to total in the low to mid $30 million range for the full year as we continue to proactively manage our portfolio. Non-reimbursed property expenses totaled $14.6 million for the quarter, which includes approximately $1.2 million of demolition costs related to redevelopment work, as we discussed on our last call. We expect to incur additional demolition costs in the second quarter, which would increase non-reimbursed property expenses further, before resuming to a more normalized run rate in the back half of the year. For the full year, we continue to expect non-reimbursed property expenses to total between $56 and $60 million. G&A expense totaled $27.3 million for the first quarter, in line with our expectations, since the first quarter tends to be the highest of the year for G&A, given the timing of payroll taxes. For the full year, we continue to expect G&A to total between $103 and $106 million, with the second quarter resuming a more regular run rate. Moving to our balance sheet, we were very active in the capital markets during the first quarter, accessing close to $2 billion of capital across a variety of sources, taking proactive steps to further strengthen our balance sheet and ensure we're well-positioned to fund our projected investment activity. In February, we issued 1 billion euros of senior unsecured notes, comprising two 500 million euro tranches, with coupon rates of 3.25% on a long five-year maturity and 3.75% on a long nine-year maturity. We executed during a particularly attractive window, with proceeds used to address our April euro bond maturity, which we repaid in March, to retire a 215 million euro term loan and to increase our overall liquidity to support externally driven growth. In March, we amended our credit agreement, replacing the euro term loan I just mentioned with a new Canadian dollar term loan at a current all-in rate of approximately 3.1 percent, with proceeds used to fund our Canadian investment activity. At the same time, we were able to improve our overall revolver pricing grid by five basis points at all levels, incrementally lowering our cost of debt. We also successfully executed in the equity markets during the quarter, selling 6.9 million shares on a forward basis, representing total gross proceeds of $497 million. This combined with the forward equity we sold under our ATM program in the second half of 2025 gives us enough runway to execute investment volume above the top end of our current guidance range. At the end of the first quarter, we settled 3.45 million shares under forward sale agreements for net proceeds totaling $247 million, leaving us with 9.7 million shares remaining to be settled, representing anticipated net proceeds of $653 million as of the end of March. Driven by our capital markets activity, we ended the first quarter with substantial liquidity totaling approximately $2.8 billion, including availability on our credit facility, cash on hand, and unsettled forward equity. Our remaining debt maturities this year are minimal, primarily comprising the $350 million of U.S. bonds we have maturing in October. The weighted average interest rate on our debt remains low at 3.1% for the first quarter and is expected to remain in the low to mid-3% range for the full year after taking into account our recent bond issuances. Net debt to adjusted EBITDA ended the quarter at 5.3 times, inclusive of unsettled forward equity. Excluding the impact of unsettled forward equity, net debt to adjusted EBITDA was 5.7 times, down from 5.9 times at year end, and well within our target range of mid to high five times. Lastly, on our dividend, in March we increased our quarterly dividend 4.5% year-over-year to $0.93 per share, maintaining a healthy payout ratio of 72%. Based on our current stock price, that equates to an attractive annualized dividend yield of over 5%. We expect our dividend to continue to grow in line with our AFFO growth while maintaining a conservative payout ratio. And with that, I'll hand the call back to Jason.
Thanks, Tony. In closing, we're pleased with our performance year-to-date, driven by the continued momentum in our investment activity, the strength of our pipeline, and our capital markets execution, all of which position us well to continue executing going forward. As we look ahead, we remain confident we're on track to deliver double-digit total shareholder returns again in 2026, and that's before any multiple expansion. Our projected earnings growth compares favorably across the net lease sector, and over time, we would expect that to be further reflected in our trading multiple. That concludes our prepared remarks, so I'll pass the call back to the operator for questions.
Operator
Thank you. At this time, we will take questions. If you would like to ask a question, simply press star, then the number one on your telephone keypad. If you would like to withdraw your question, press the star, then the number two. Your first question comes from Michael Goldsmith with UBS. Please take your question.
Good morning. Thanks a lot for taking my questions uh first you know you have a third of the portfolio in europe you know you continue to acquire there are you seeing any impact of the portfolio or is there any worry that you have just given some of these global macro events and and and also just the conflict in iran is that is that having any impact on your portfolio in europe no you know i guess there's a little bit more potential for uncertainty in Europe, you know, given, you know, higher energy prices there, but it hasn't impacted us.
And if you think about our portfolio, it's diversified. We, you know, mainly have very large companies that can, you know, ride through, you know, the different cycles. And we've shown that in the past. So, you know, there's not big concerns there. We feel good about, you know, the portfolio. We haven't seen anything yet. I think that's That's certainly something I can say definitively.
Thanks for that, Jason. And my follow-up question is, you said in the prepared remarks you've effectively pre-funded your investment needs for 2026. I guess, how are you thinking about just funding going forward? Do you sit back and just kind of wait to see what comes to you and be opportunistic with your fundraising? or is this the time where you can be a little bit more aggressive, start to pre-fund 27 and then if the volumes continue to pick up in 26, it gives you the position to be more aggressive, to try to get an understanding of your thoughts in the funding environment and what's next there. Thanks.
Yeah. Yeah. I mean, we're sitting on $650 million of forward equity right now. It's left to be settled. We have lots of liquidity, as you pointed out. In terms of more equity, I would say if there's good opportunities to get ahead of our needs for 2027 and raise more equity, I think we'll always consider that. But we're certainly comfortable where we are today, and a lot of it will depend on the investment opportunity set and what that looks like. That's probably going to be the biggest driver, but bottom line is we really don't have any visible needs right now, so we can be, I think your words were opportunistic. thank you very much good luck in the second quarter thanks you're welcome your next question comes from jana galan with bank of america please take your question morning this is dan could you please provide any updates on the carry tenant solution platform yeah sure i mean we talked about this in some detail on last quarter's call and you know these are the types of construction projects that we've been doing for quite some time, you know, dating back several decades. They include build the suits and expansions and redevelopments. And, you know, the reason why we've been more deliberate about talking about it is to make sure that people understand that this is part of our business and it's maybe another part of our business that we think we can grow. And, you know, part of, you know, the branding around it is to, you know, formalize it and maybe be a little bit more holistic in our outreach to our tenants. If you look at historically what we've done, it's probably been around $200 million per year. That'll vary from year to year, but that's probably a decent average. And we think that can perhaps get bigger. And one of the benefits of being a large REIT like we are, we have built up a very capable in-house project management team. And so that's a real competitive advantage. and what we found in our outreach to tenants and when we can offer them various development services and other solutions that can lead to follow-on deals. Currently, and we provide a lot of detail on our sub around this, we have about $280 million of projects in process and about 180 of that 280 will complete this year. And beyond that, there's a really active pipeline of potential projects that we would expect to move along over the coming quarters.
Thank you. And then also, with the self-storage operating assets dispositions now completed, what additional assets are you targeting to meet your full-year disposition guidance and any plans on the other five operating assets? Brooks, you want to take that?
Sure. As Tony mentioned, we maintain a pretty flexible disposition strategy for the year, this early in the year, a range between $250 and $750. And so we really value that flexibility. In terms of other operating assets, we have a few hotels and one student housing property that we are evaluating for dispositions, potentially the back half of this year, but also potentially into next year. So something we're looking at. But again, we maintain a lot of flexibility from a liquidity and capital perspective. So that'll really investment pipeline will help drive kind of where we land in that range.
Operator
Your next question comes from Anthony Paolon with JP Morgan. Please say your question.
Great. Thanks. Good morning. Can you talk about the investment pipeline and what the geographic skew looks like at the moment and also the property type kind of buckets where you're seeing more or less and just where the dispersion around that mid-seventh cap rate resides.
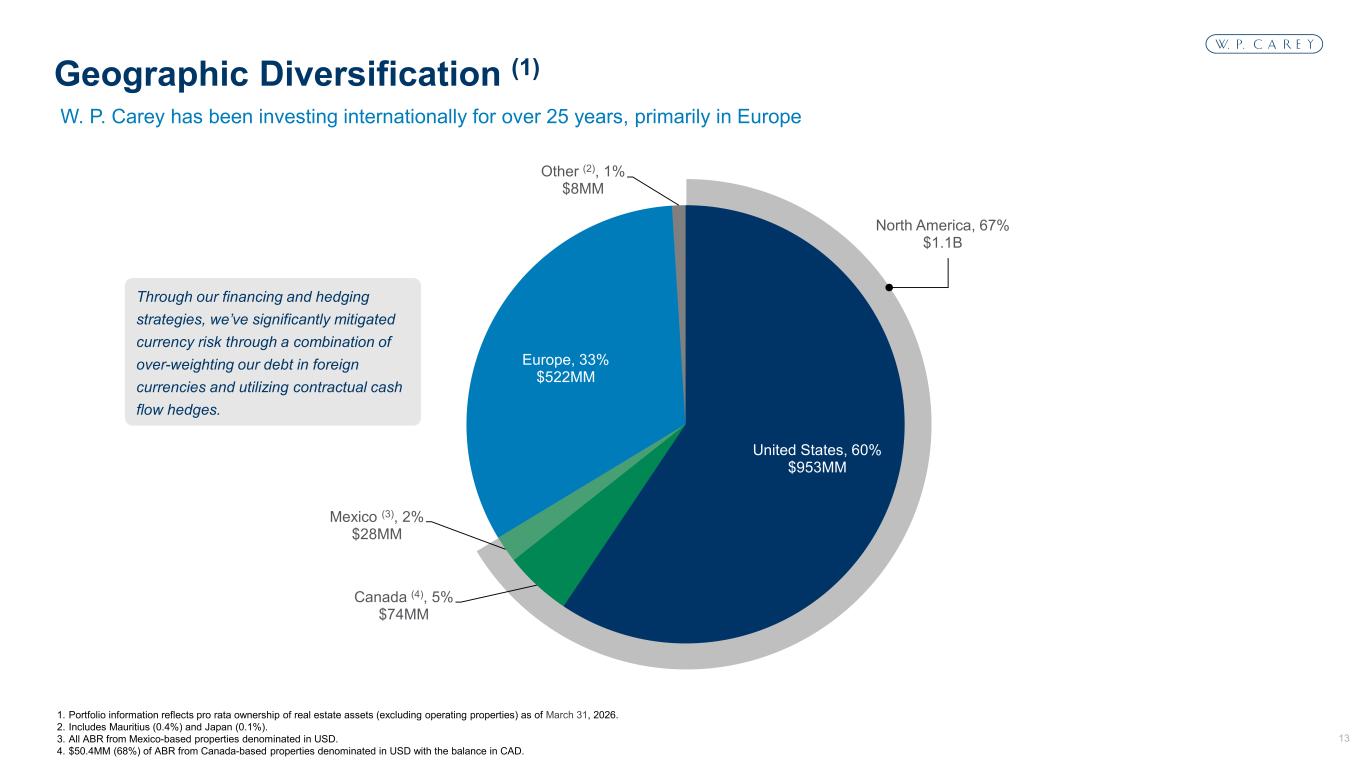
Yeah, sure. And pipeline remains strong. I mentioned earlier that includes over a half a billion of identified transactions, some of which are in advanced stages. And it includes one larger sale leaseback of a sizable industrial portfolio in the US that should close over the next couple of weeks. And then we mentioned also that we have around $180 million of cap projects that are scheduled to complete this year. So that's all part of the visibility into the deal volume that we have this year. In terms of geography, Europe continues to ramp. I think of the deals closed year to date, about half of those were in Europe. A deal in Poland, Robin was the largest. Another 30% of that was in Canada, and the range was in the US. But yeah, but for Europe, we see a continuation of the increased activity that we started seeing in the second half of last year, but that doesn't mean that U.S. is slowing. I think the pipeline is roughly back in line with our ABR mix. It's about two-thirds in the U.S. and one-third in Europe right now. And then property types, I think this is a consistent theme for us. We continue to see interesting opportunities in industrial, and that's both manufacturing and And warehouse, year-to-date, about 60% were industrial, and two-thirds of that were warehouse. And then we also saw pickup in retail. A lot of that was driven by the GoAuto deal that we talked about earlier. And then the pipeline is more heavily weighted towards industrial. That's probably 80% right now. But there's a lot of opportunities at the top of the funnel that will come in as well.
Okay. Okay. And then just second question, you all have historically had a strong tie in with private equity. And I was wondering if you've seen sort of some of the challenges on the private credit side have any implications on your deal pipeline, either making sale leaseback more attractive or just generally having any impact on your tenant base?
Let me start on the deal impact. I think our expectations are that potentially sale lease backs could become a more interesting opportunity for some of the private equity-backed companies that maybe there's a void with private capital to the extent underwriting or capital flows tighten up there. I wouldn't say that's a theme we're seeing right now, but certainly it's a possibility that that emerges more. Brooks, I don't know if you're seeing anything within our portfolio related to private credit?
No, we haven't seen really discernible specific impacts. Something we'll continue to watch out for, but that hasn't been a factor as of yet.
Operator
Your next question comes from Smeeds Rose with Citi. Please state your question.
Hi, thanks a lot. I wanted to ask you just a little bit about in the past, you've spoken about leaning into retail more. You obviously completed some in Canada this quarter. I just wanted to ask you, how do you think about kind of the rent escalators in that segment versus maybe in other asset classes?
Yeah, sure. I mean, yeah, there is a difference. I think market standards for retail tend to be lighter bumps than what we're able to negotiate in industrial and warehouse. I think that makes sense. I think the warehouse market generally has grown substantially over the last couple of years in terms of rent growth. And, you know, a lot of the bumps we put into our leases are meant to be a proxy for market rent. And, you know, the rents for warehouses or manufacturing plants for industrial companies tend not to be a big part of their cost inputs, whereas retail, you know, rent typically is their biggest expense. So there's more of a focus on that. And I think that's why historically we've seen flatter leases. I think where we target, which is sub investment grade retail, you know, bump structures are probably in the, you know, on average, maybe the one and a half to two percent range compared to industrial. We're seeing probably more like two and a half, three or even above that. I think once you get into investment grade retail, which which we view as the commodity segment of of net lease and tend not to to participate in that all that much. You know, those leases tend to be even flatter. And really the only way to differentiate yourself when investing there is is through pricing. So, you know, that's kind of the you know, there's meaningful differences there, I think, between between the two in terms of bump structures.
Thanks. And then I guess I just wanted to ask you, too. I mean, you mentioned some tighter cap rate spread deals. I think you're looking at in the first half of 26. I mean, does that pertain to the larger kind of industrial type portfolios that you're looking at? Or is it more for one-off opportunities or maybe just commentary on kind of the pricing, you know, across like larger deals versus smaller deals?
Yeah, it's not related to larger, smaller deals. And really the reference to the tighter cap rates was to the deals that we've closed year to date. It's about $680 million. Those deals blended towards the lower end of our target range, 7.2%. And my expectation is that those will be some of the tighter cap rate deals we close this Those also, I think maybe it's important to note, and we talked about this earlier, that the bulk of those deals were done in Europe and Canada, where our borrowing costs are meaningfully cheaper than that in the U.S. So despite the lower cap rate, we did see attractive spreads on those deals. And then I think the other half of this is our pipeline, in addition to our capital investment projects delivering this year, those are more in the upper end of our target range, which helps us to blend to the mid sevens for the year. So I think overall, it feels like cap rates have been relatively stable for the year, despite the macro volatility. Hard to predict, of course, what's going to happen the second half of the year. But because we transact across a wide range of cap rates, sometimes the timing or the mix will create some dispersion there. But I don't think it's any read-through to any market trends or specific geographies or asset classes.
Great. Thank you. Appreciate it. You're welcome.
Operator
Your next question comes from Ryan Caviola with Green Street Advisors. Please see your question.
Good morning. Thanks for taking my question. Just a quick one on on-shoring. Obviously, this trend should be helpful for the in-place industrial portfolio. Do you think those tailwinds will lead to more competition in bidding tents with new buyers interested in industrial net lease? And would this lead to a continued focus on industrial acquisitions in Europe? Or do you see it just being an overall benefit for all buyers in that space? Thanks.
Yeah, I think it's the latter. I think that to the extent there is more onshoring or reshoring, I think we stand, certainly within our portfolio, stand to benefit substantially. We're one of the larger owners of industrial properties, especially manufacturing. And to the extent it increases demand on the types of buildings that we own, we think that's good for rent growth. We think that's good for the criticality factor that we tend to underwrite in the buildings that we own. Could it attract more competition? Perhaps. I mean, if a particular end of the market becomes more attractive, I think you could see some capital flows in there. But it's a big market, And I think the deposits that have certainly, you know, would outweigh any kind of increased competitive cash flow or capital flows.
Thank you. And then on the just the mix between new deals in terms of embedding in inflation based increases in the lease or focusing on higher fixed escalators. Could you just update us on where that stands and if this has any differences, whether it be by country or industry?
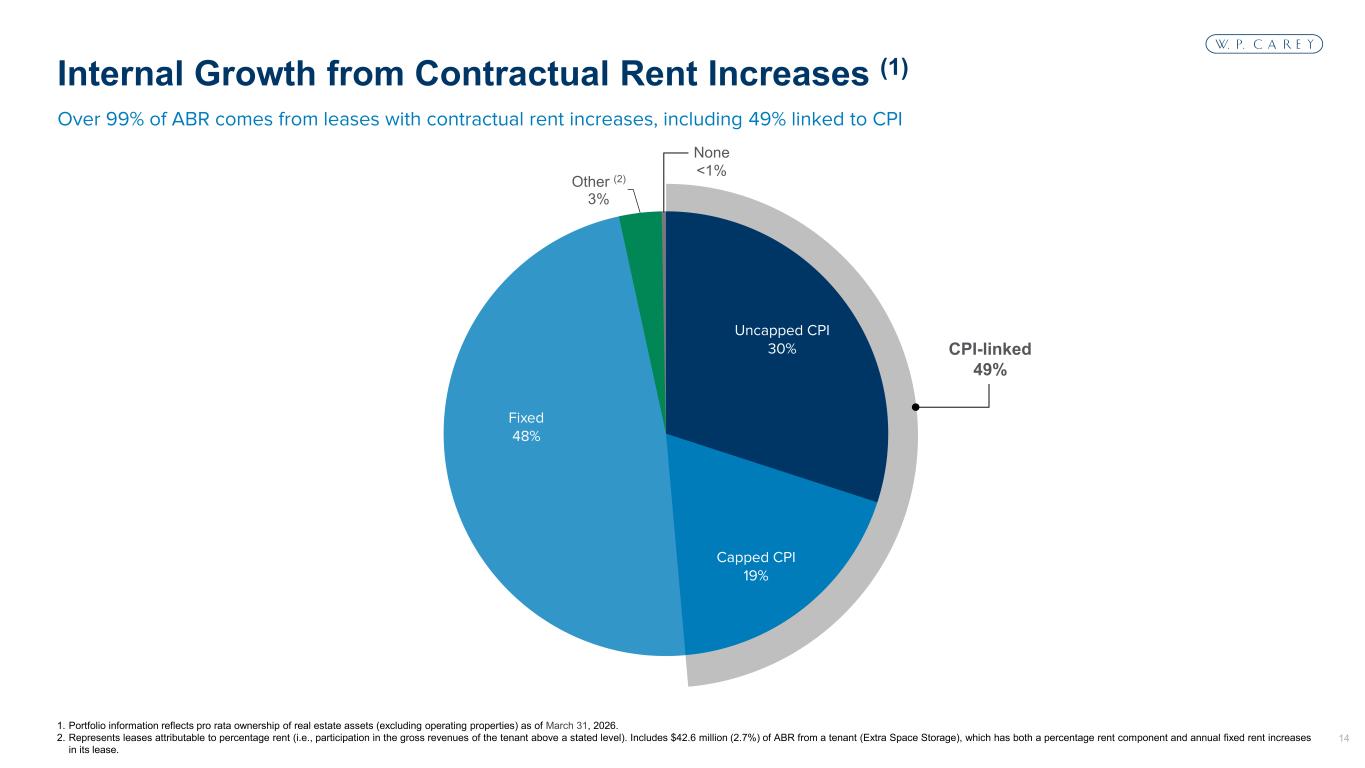
Yeah, sure. I mean, since the spike in inflation, you know, four or five years back, the CPI-based leases have gotten to be a little bit more difficult to negotiate into new deals. And that's, I guess, particularly in the US. In 2025, last year, about a quarter of our deals had CPI-linked increases. But so far this year, it's actually the opposite. It's about three quarters of deals close to date were CPI-based. And I think to your point, I think that's a function of geography more than anything else. Europe leases, it's still customary to have inflation-based increases embedded in there. And so year-to-date, as we mentioned, there's been more of our deals have been in Europe. I think the GoAuto deal in Canada, that's also a CPI-based increase negotiated in there, something that we certainly value having that inflation hedge built into our portfolio. It's important to get, but when we don't get inflation-based increases, the effects of higher inflation have still kind of flowed through to our fixed increases, where historically our average fixed increase is probably closer to 2%, whereas the last three or four years, we're probably 50 to 100 basis points above that on new deals with fixed increases. So we're still seen some of the benefits there. And it's probably a good reminder of the, and we talk about this a lot, about the differentiation of our portfolio compared to many of our net lease peers where we have substantial internal growth built into our model as opposed to just relying on spread investing and external growth.
Thank you. That was very helpful. Okay.
Operator
Your next question comes from Mitch Germain with Citizens Bank.
Operator
Please state your question.
So, Jason, just following up on that topic, is it more standard to have a CPI-based lease in Europe versus kind of what the acceptable rate is here in the U.S.?
Yeah, it is. It's definitely more standard and more customary in Europe. I think that we've always made it part of our model to the extent we can in the U.S. And, you know, this dates back to, I mean, we've been around for 50, you know, something years at this point in time. And a lot of this dates back to, you know, the 80s on the themes of trying to create an inflation hedge, you know, within a fixed income type stream that net lease can sometimes be. And we think we've done a good job of that.
Got you. And clearly there's a lot of momentum in the business. I'm curious, though, if you're seeing some of the buyers that, you know, for the last couple of years have been on the sidelines reemerge and is any real change in the competitive balance within the investment sales markets?
Yeah, I mean, the net lease market has always been competitive, and that's especially in the U.S. I would say there have been some new entrants over the last couple of years. It's a lot of the names that we read about. Some of the big asset managers have, you know, acquired other platforms. And I mean, one of the things that we've observed, and we've heard this from some bankers as well, is it doesn't necessarily mean there's new kind of incrementally new players in the business. You know, many of them have just changed brands for being independent to be part of a big asset manager. Regardless, it doesn't feel like it's been all that impactful. And I think ultimately the results speak for themselves as we continue to generate substantial deal volume at attractive pricing and spreads. And that's irrespective of competition. You know, and I think beyond pricing, I mean, we have a lot of competitive advantages. We've been doing this for a long time. Experience and execution really matter, especially when we're focused on more complex sale-lease And I think our track record and reputation in the market are something that helps differentiate So it all seems manageable. And again, it's not showing up in the numbers, that's for sure.
Congrats on the corner. Great.
Operator
Your next question comes from Eric Borden with BMO Capital Markets. Please state your question.
Hey, good morning. Thanks for taking my question. I just understand that the spread between contractual and comprehensive growth can fluctuate from quarter to quarter. And over the long term, the average spread has been around 100 basis points. But just curious what your expectation is for that spread for the remainder of the year as it sounded like you may have some vacancies to address.
Tony, do you want to take that?
Sure. Yeah, I think you covered kind of the highlights there. I think as, you know, we've mentioned the contractual side, we're expecting around mid 2% growth from our contractual base lease escalations. And then on the contract, on my comprehensive side, again, factoring in vacancies, probably the biggest impact we see over the course of this year. As you mentioned, it does move around from quarter to quarter. That can be, you know, collecting rents, recovery of rent in any one period. We could see that move. I think the 100 basis points, you know, it's a good round number we use in terms of kind of our historical average, but really is a good estimate over the long term. I think factoring that in, we could certainly see the range for this year being between 1% and 2% on the comprehensive side, but it really does depend on how soon we address vacant asset dispositions and, like I said, timing of things like rent recoveries.
Okay, that's helpful. And then, Jason, just going back to your comments around your well-capitalized European tenant base who can absorb oil shocks in supply chain volatility. But do you have any exposure to maybe less capitalized tenants or tenant categories with higher sensitivity to commodity price swings? And how are you underwriting or monitoring that risk today?
Yeah. Brooks, do you want to take that as kind of a, I guess, a broad question?
Yeah. I mean, I think the key point in there is what Jason mentioned is that the broad diversification, long-term leases, and high criticality. I mean, we transact with businesses of all sizes from the biggest in the world to smaller companies The bulk of our companies, by large margin, are large, well-capitalized companies, and that remains true in Europe as well. So, you know, our overall view of oil shock is it's a risk we need to monitor very closely. But we haven't thus far seen direct impact. It's something we'll pay very close attention to. But again, our portfolio is really constructed intentionally to absorb any types of shocks or headwinds. And we've seen that a number of times over the decades. So, you know, we're confident in that. And, you know, I think that diversification really is key there.
Thank you very much. Appreciate the time.
Operator
Your next question comes from Jim Kammer with Evercore ISI.
Operator
Please state your question.
Good morning. Jason or team, are you willing to provide a little bit of color on terms of financial data regarding, say, Robin and GoAuto, both from their websites look to be pretty substantial companies? but I think they're both privately owned, if I'm not mistaken. I'm just curious if you can provide a little sort of financial flair or color around the size and the scope of those companies.
Yeah, sure. They are private companies, so I think we are under some restrictions in terms of talking about financial details. With GoAuto, we talked about earlier that they're the second largest auto dealership platform in Canada. You know, they're diversified across pretty much all the OEMs or the brands, and they have, you know, a proven tracker to grow through, you know, over many years at this point in time. I think sales for them are greater than $3 billion. I think Robin, also a large company. They are a Dutch company, but one of the largest 3PL operators in Poland. I don't think we can talk about kind of revenue or EBITDA, but they're one of the market leaders in the pull-in market from a 3PL standpoint.
That's helpful. And then sort of derivative of the first question, it seems like you've knocked out a growing list. I mean, lifetime, we just talked about Robin and GoAuto, kind of $200 million-plus transactions. Is that just happenstance, or is there some message to read into that in terms of your investing efficiency and where you're spending your time on the external side?
Yeah, sure. I mean, look, it's, I guess I would say the majority of our deals typically fall within the, you know, call it $25 to $100 million deal size range. Average transaction is maybe around $50 million, perhaps a little bit bigger than that. But we do consistently see larger deals. They're part of our regular deal flow. On any given year, we would expect on a bid on a number of these larger sale, these backs, you know, call it $200, $300 or even larger deals. You mentioned GoAuto and Robin and last year, Lifetime. So, you know, we do tend to complete several of these larger deals each year. And I just mentioned earlier that we have one larger sale lease back in the pipeline, an industrial deal in the U.S. that should close over the next week or two. So, yeah, so it's part of the deal flow. And look, we're one of the largest net lease REITs. So I think one of the benefits of our scale is that we can do larger deals in the other regular part of our business.
All right. Thank you, Jason.
Operator
Team, thank you.
Operator
Thank you. And your next question comes from John Kilachowski with Wells Fargo. Please do your question.
Hi, good morning. Thanks for taking my question. My first one is just on the new credit loss guide. I know last quarter you talked about there wasn't any maybe specific items that you were looking into. Is there anything now this quarter that you have some sense of this is where credit's going to turn out, or is the 8 to 12 number still more of an open-ended space just for things that may come up in the rest of the year?
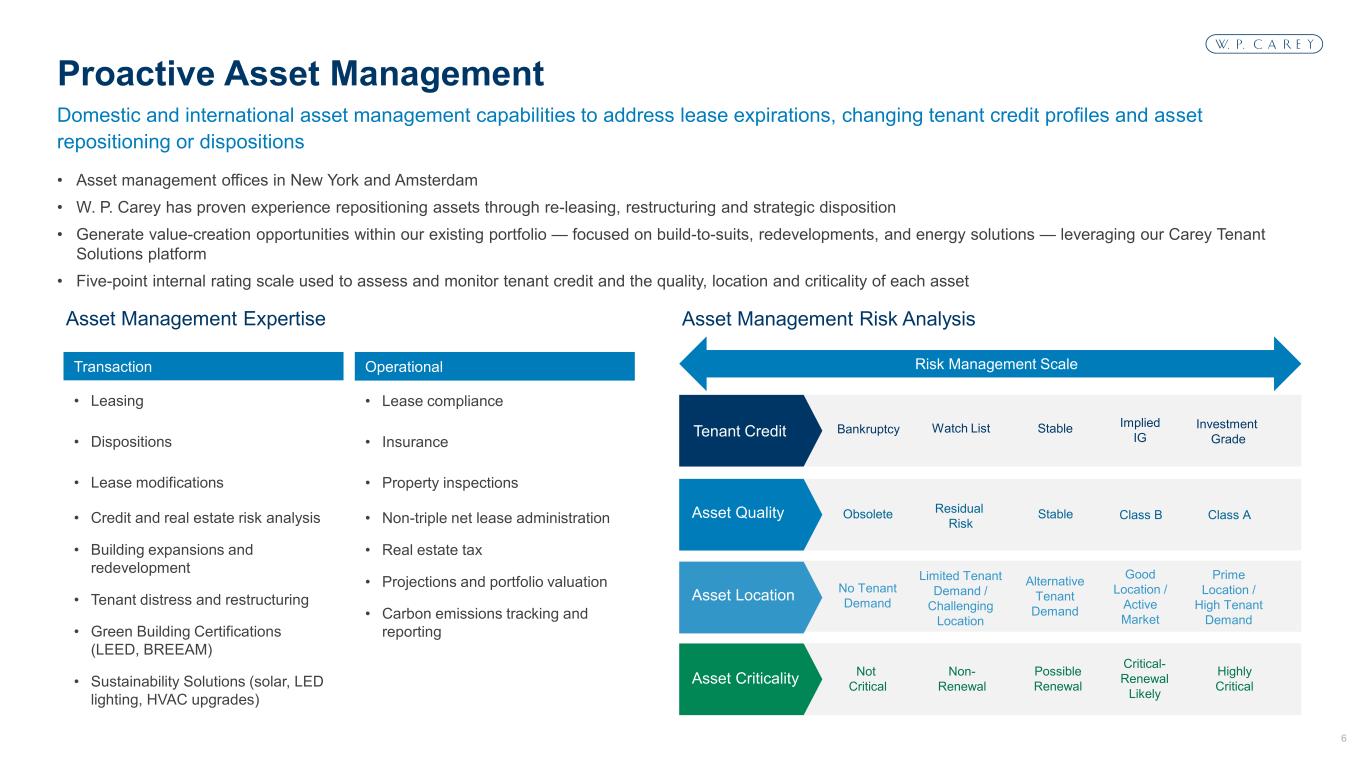
Tony do you want to just touch on kind of the the range and how that's changed and then maybe Brooks you can just give a little bit of color on on credit watch yeah I'd say it's more the latter I would say we've not really seen any material credit change in the portfolio since the start of the year and that's really amongst our watch list and more broadly so really with four months of good rent collections behind us and our current view of the tenants we did feel comfortable bringing down the range. The range is still larger than our typical historical losses. You know, but again, that's more about being prudent in this uncertain macro environment and really ensuring we're covered in any number of scenarios rather than anything that we're seeing currently in the portfolio.
Yeah. And then just on credit watch and credit quality generally, you know, as Tony mentioned, it's pretty stable. You know, as you noted, we lowered the rent loss assumption range, which is sort of the most direct tool we can offer you there. Watch list came down slightly as well. You know, some color commentary on the watch list is Hellwake remains the biggest exposure there. It's about 1% by ABR and coming down quite quickly. We're on track to have that out of our top 25 in the first half or around mid-year, I should say. The only other tenant to note is Cornerstone, which is about 60 basis points of ABR. They're of the largest exterior building products manufacturer, very large company, over $5 billion in revenue. They've been on watch. We expect they'll restructure at some point. Their balance sheet is over levered, but we own very critical real estate. Don't expect any impact there, but that's the only one of size. The rest of the credit watch list is really diversified and much smaller tenants.
Okay. That's helpful. Thank you.
And then on the second one earlier, you gave some helpful color around some operating assets that you may consider selling the rest of the year i was just hoping if you can give maybe some idea of the buckets of capital that you're considering selling and then and then maybe to add on to that the cap rates that you you know you think you could blend to for the rest of the year brooks you want to take that yeah so as i meant yeah so you know again as i mentioned it's a little difficult to pin down with precision because we are maintaining a lot of flexibility there in the disposition plan um you know roughly at the midpoint you can kind of view it as a split in two buckets um the first is a non-core uh kind of creative exit so the primarily operating properties um the the final tranche of storage was the biggest piece of that um we're evaluating one student housing property and uh several hotels for the second half too early to determine exactly timing on those um a few other non-core opportunities um including we exited recently post quarter um our only remaining uh asian asset for a very good price um so that's kind of your first bucket um the balance is kind of your risk mitigation and vacancy um that's um transactions such as the joanne former joanne warehouse we sold uh which we i think we discussed last call but sold a very very attractive cap rate mid-five cap rate on the prior rent um also some hellwigs we've been exiting and a few warehouse assets um so from a pricing perspective again tricky to pin it down with precision i'd say that first bucket um would be kind of in your mid sixes cap rate range um really depends exactly on what closing what closes but in that in that universe um on the second bucket harder to pin down at this point in the year but um you know considering that there's some vacancy embedded in that it's going to be a nice earnings tailwind in any event so hopefully that helps from color perspective, but a bit premature to nail it down.
Operator
And before I take the next question in queue, a reminder to the audience to ask a question, just press star 1 on your phone now. And we are also accepting additional questions from those who have already asked one. So if you just would like to ask any additional questions, you could press star 1 on your phone now.
Operator
Your next question comes from Greg McGinnis with Scotiabank. Please state your question.
Jason, how are you thinking about geographic diversity and density in certain countries in Europe? With Poland, now is your number one international exposure following the Robin acquisition. Do you expect to see further increase in exposure there? Or is there a limit at a country or regional level that you think is best for the portfolio?
Yeah, I mean, there's no specific cap or maximum exposure. But I think, you know, we're certainly very mindful diversification, you know, at the same time, you know, given our scale, it would take, you know, some meaningful size Poles transactions to really move the needle there. You know, we've been investing in Poland for a long time now. It's over over two decades and it's really become a core piece of the broader European net lease market. I think people that don't follow Europe as closely, you may not know it, but it's the sixth largest economy in the EU. It's also top 20 economy globally. It's one of the fastest growing economies in the EU as well. Projected growth is about 3.3% this year. So, yeah, it's an attractive market for us. I mean, the bulk of what we own there supports supply chains for large multinational companies, both manufacturing and, you know, logistics assets that, you know, it kind of serves as a low cost, you know, manufacturing and distribution hub into Western Europe. So, yeah, good market for us. I think we'll stay active there, but we're certainly mindful that it's become about 5% of our portfolio. It's not, you know, huge exposure, but we certainly keep an eye on that.
Yeah, thanks for the color there. That's helpful. And then with visibility into over a billion dollars of deals at this point of the year, do you see investment guidance as conservative or is there some expectation for deals to slow into your end?
I mean, look, we're confident that we'll continue generating higher deal volume throughout the year as we did last year. I think from a guidance perspective, and we did this last year, we want to take a measured approach. I think last year that led to a series of increases, and that's kind of the preference going forward. Last quarter, our initial guidance we talked about, that is a starting point, and obviously we just increased that by $250 million at the midpoint. And the expectation is as we progress through the year and get more visibility into the back half of the year, we'll refine that range and hopefully raise it further. And we're off to a good start. You mentioned the billion dollars of visibility, and that includes almost $700 million of closed investments to date. So I think the elements are there for us to have another strong year. And, you know, I think we'll kind of reflect that in our guidance as appropriate and as the year progresses.
Operator
Your next question comes from Jason Wayne with Barclays. Please state your question.
Just looking at the lease expiration schedule, kind of quarter over quarter, lease expirations came down as a percentage of ABR this year and next year.
I guess how much of that is due to, you know, looking at upcoming maturities proactively, you know, versus just changes in the portfolio?
Operator
Brooks, you want to take that?
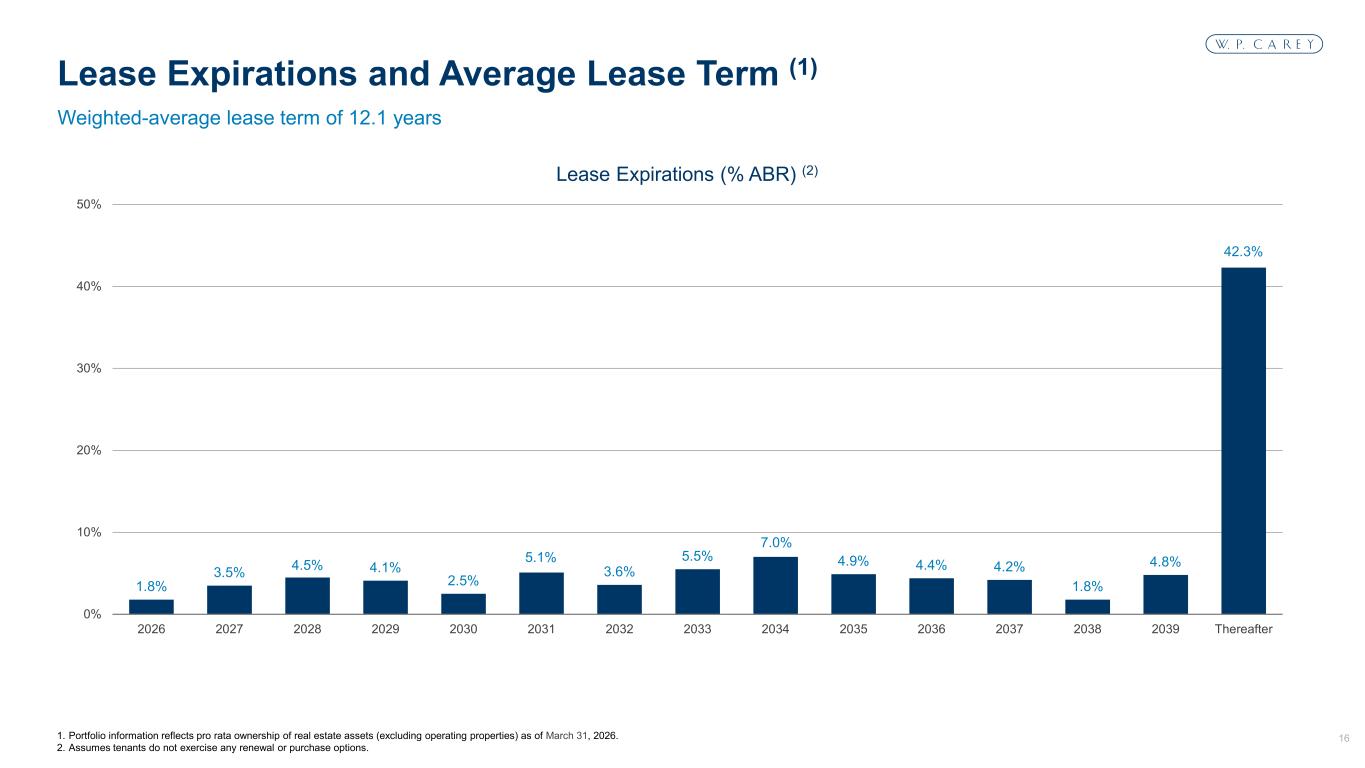
Yeah. So, as you noted, we've been making a lot of progress on lease expirations. I'd say that cadence is pretty normal for us. The track record over the past 10 or so years has been very good on rent recapture, around 100% and very low TIs. So, you can kind of see that flowing through our disclosure numbers there. In other cases, we've noted a few assets That's where we're looking to release. So we're working through those. That's part of it as well. From a lease expiration outlook perspective, 2026 is very manageable. It's about 1.8% by ABR. That's coming down pretty quickly. And so we're making good progress on that. We have a couple of non-renewals expected in Q4. These are really high quality warehouses, below market rents. So we're optimistic that we're going to be able to push rents higher on those. But those are sort of towards the end of the year, so not impactful to 2026. In 2027, we've got about 3.5% expiring. That's actually come down a little bit subsequently as well from some renewals we've achieved post-quarter. You know, manageable year. You know, one item to note is we have the expiration of the final tranche of net-leased Marriott in 2025. That's around $5 million of ADR. um we'll exit those in in in due course but uh you know important to note there's coverage there so there's no earnings impact but that's that's something we'll look to address in 2027 um but all in all making good progress on the lease expirations um and those assets that that do have some non-renewal we're quite optimistic about our ability to push rent higher there all right thank you all thank you at this time i am not showing any further questions I'll now hand the call back to Mr. Sands.
Great. Thank you. And thank you, everyone, for your interest in WP Kerry. If there are additional questions, please call Investor Relations directly on 212-492-1110. And that concludes today's call. You may now disconnect.