Operator
Hello and welcome to WP Carey's second quarter 2026 earnings conference call. My name is Diego and I will be your operator today. All lines have been placed on mute to prevent any background noise. Please note that today's event is being recorded. After today's prepared remarks, we will be taking questions via the phone line. Instructions on how to do so will be given at the appropriate time. I will now turn today's program over to Peter Sands, Head of Investor Relations. Mr. Sands, please go ahead.
Good morning, everyone, and thank you for joining us for our 2026 second quarter earnings call. Before we begin, I need to remind everyone that some of the statements made on this call are not historic facts and may be deemed forward-looking statements. Factors that could cause actual results to differ materially from WP Carey's expectations are provided in our SEC filings. An online replay of this conference call will be made available in the Investor Relations section of our website at wpcarey.com, where it'll be archived for approximately one year and where you can also find copies of our investor presentations and other related materials. And with that, I'll hand the call over to W.P. Carey's Chief Executive Officer, Jason Fox.
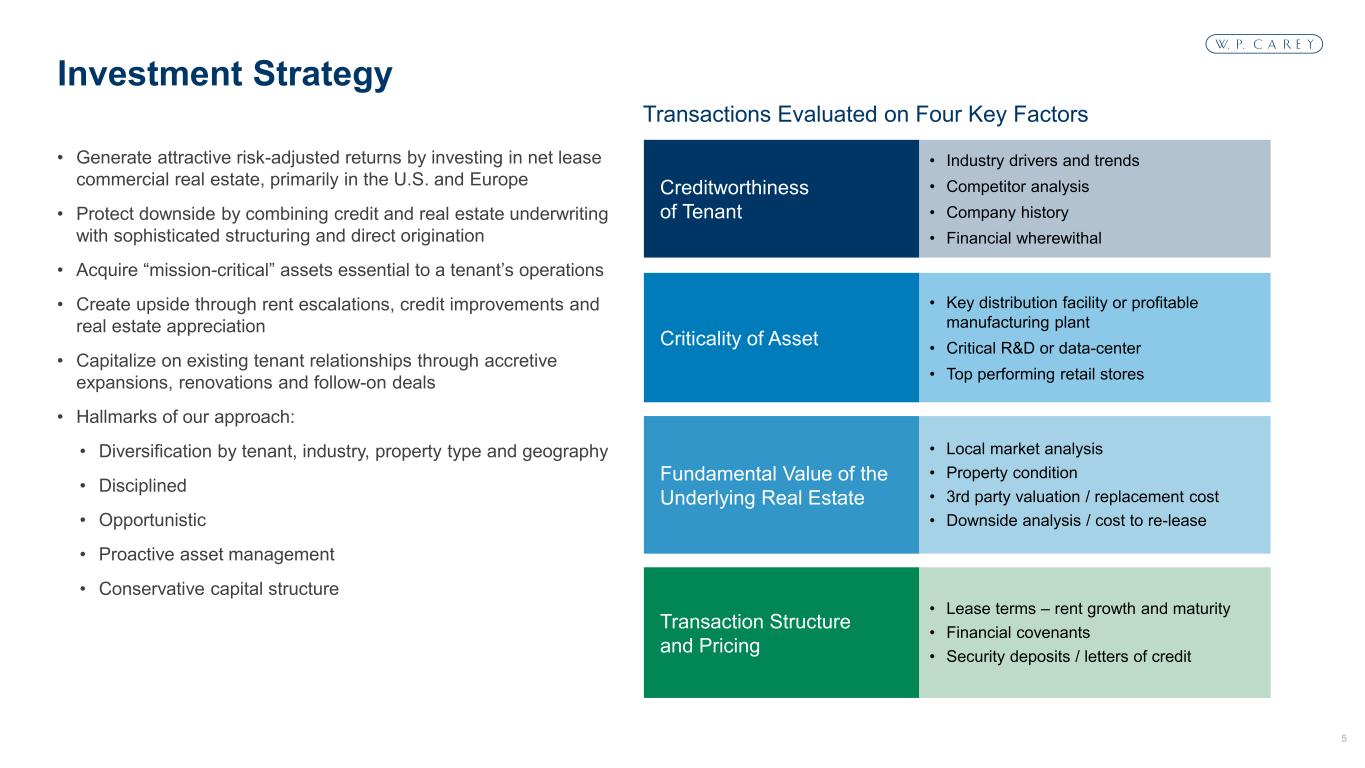
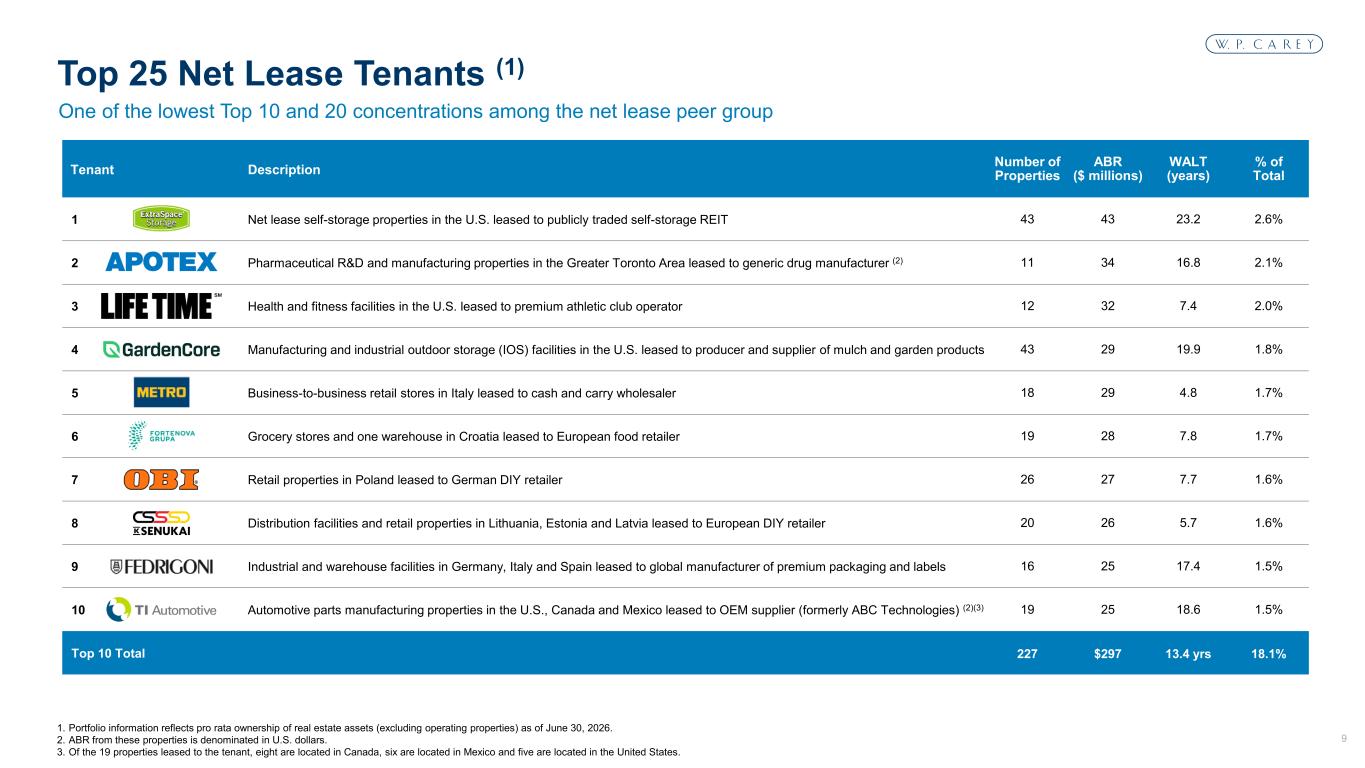
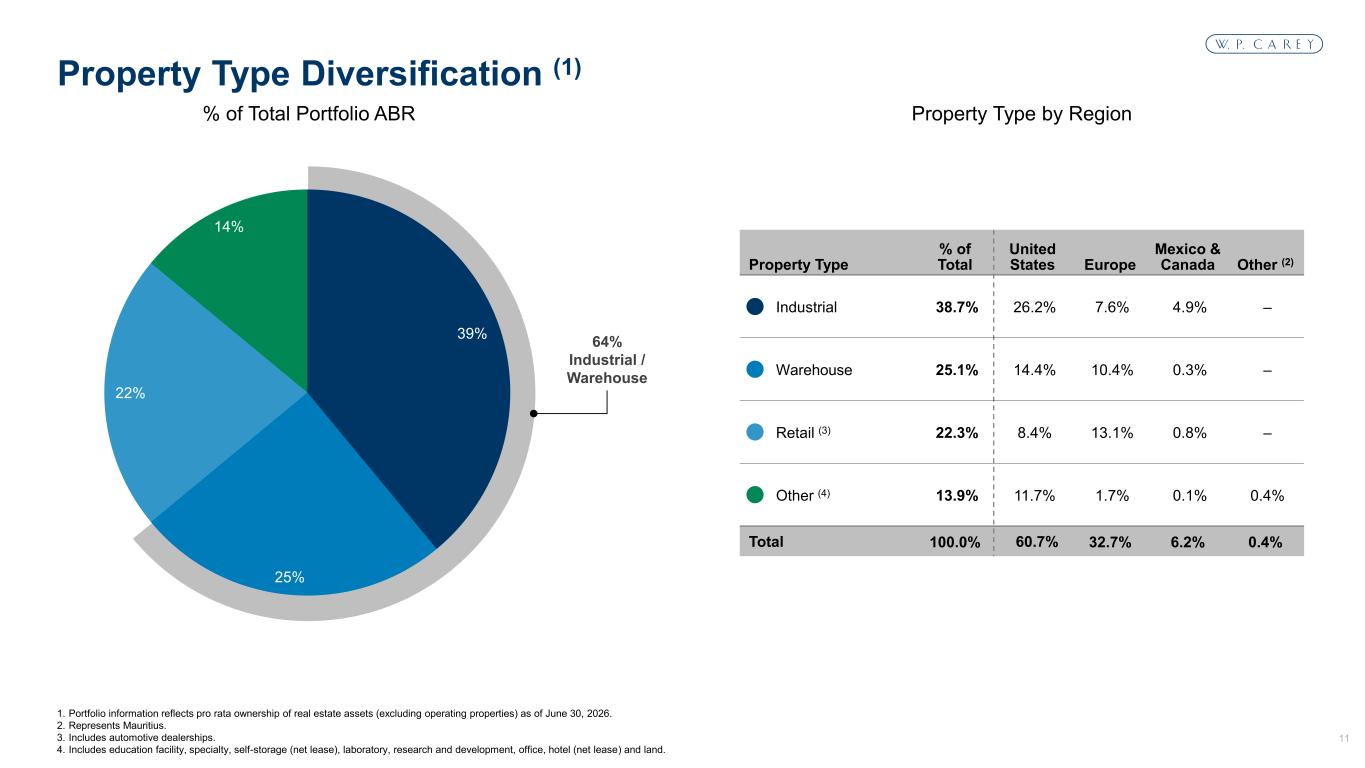
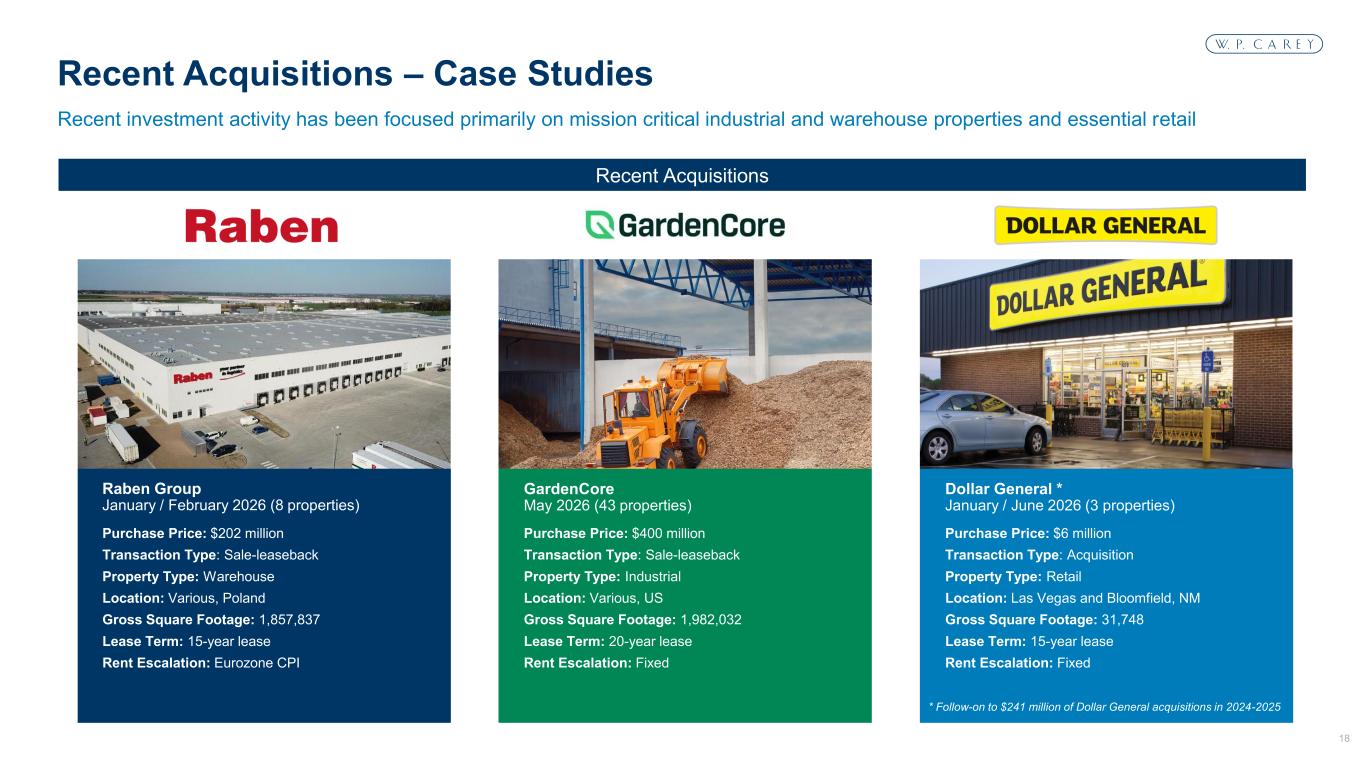
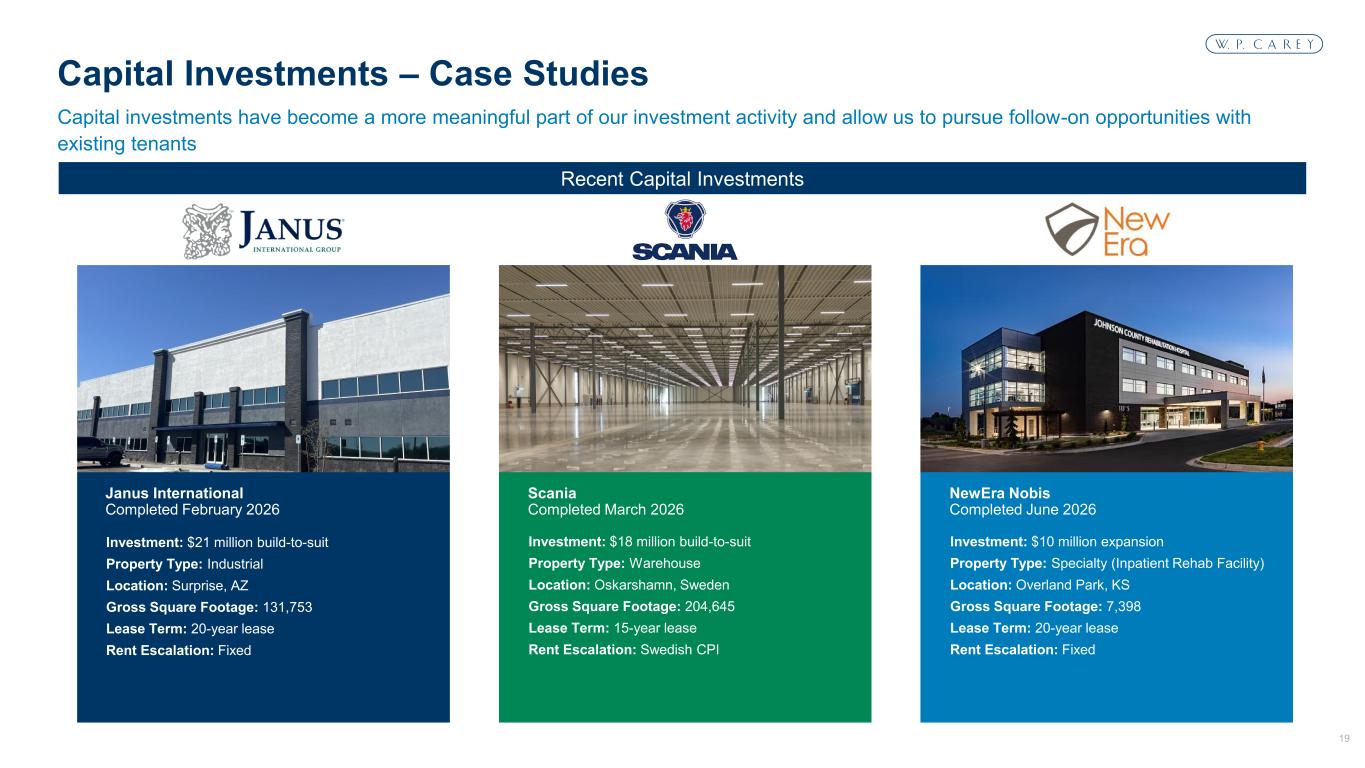
Thanks, Peter. Good morning, everyone. The strong momentum we established last year has continued over the first half of this year, driven by execution across both investments and capital markets. And I'm pleased to say we're once again raising our full-year outlook for both investment volume and AFFO per share. This morning, I'll focus primarily on our investment activity, which remained strong over the first two quarters, and how we're particularly well positioned from a capital perspective to continue investing over the second half of the year. I'll also touch upon how we've substantially mitigated the risks associated with Helvig. Our CFO, Tony Sanzone, will take you through our results, balance sheet, and guidance, and our head of asset management, Brooks Gordon, joins us to answer your questions. Starting with our investment activity. The transaction environment during the second quarter remained largely unchanged from the first, both in the U.S. and Europe. And to date, we've not experienced any noticeable impact on transaction activity from the ongoing tensions in the Middle East. Cap rates on our closed deals were a little higher during the second quarter versus the first, but that was mostly a function of the timing of specific deal closings rather than any change in market conditions. We expect cap rates for the full year to average in the mid to low 7% range, consistent with our view at the start of the year. The vast majority of the investments we closed during the second quarter were warehouse and industrial properties, with the mix between the U.S. and Europe broadly in line with our long-run average. We completed a little over $700 million of investments during the second quarter, which brings our investment volume year-to-date to $1.3 billion, at a weighted average initial cash cap rate of 7.4%. Factoring in rent escalations and an average lease term of 18 years on new investments, this translates to an average yield over 9%, which remains one of the highest in the net lease sector and continues to provide an attractive spread to our cost of capital. The largest transaction we completed during the second quarter was the $400 million sale leaseback with GardenCore, which is a leading U.S. manufacturer of lawn and garden consumables, and now ranks as our fourth largest tenant. The portfolio comprises 43 manufacturing, packaging, and iOS facilities across 24 states, which are under a 20-year triple net master lease with fixed rent escalations. This transaction was compelling for several reasons, including the defensive nature of the underlying business, the mission-critical nature of the real estate, and the attractive rent growth it provides over a long lease term. looking ahead our near-term pipeline currently includes several hundred million dollars of investments at various stages of completion in addition we have 133 million dollars of capital projects delivering over the second half of this year part of 10 projects we're currently working on that will add approximately 300 million dollars to our investment volume over the next 18 months supported by our carry tenant solutions initiative i'm pleased to say that the strong piece of investment activity so far this year has enabled us to raise our guidance range for full year investment volume to between 1.7 and 2.1 billion dollars. While deal closings could slow somewhat during the summer, which is fairly typical, especially in Europe, and it's too early to have clear visibility into the fourth quarter, our pipeline remains active and we believe we're well positioned to be in the top half of our guidance range, particularly if fourth quarter activity is in line with recent years. Our overall AFFO growth continues to benefit from our sector-leading rent growth. Given the high proportion of ABR generated by leases with rent escalations tied to CPI, we remain uniquely positioned to benefit from the inflationary pressure stemming from higher energy prices. And we expect to see those tailwinds increasingly flow through to rents over the second half of the year and trend even higher in 2027. them. Turning to capital markets, our investment activity continues to be supported by well-executed capital markets transactions, with nearly $900 million of forward equity sold and approximately $1.5 billion of bonds issued so far this year. With the forward equity we sold during the second quarter, we ended the first half of the year with nearly $700 million available for settlement, and in early July, we completed a U.S. bond issuance that addressed our only remaining 2026 bond maturity. Our balance sheet is in excellent shape with ample liquidity, leverage at the low end of our target range, and no near-term debt maturities. We've comfortably pre-funded our anticipated investment activity through the end of 2026, with the flexibility to continue deploying capital well into 2027 without needing to access the capital markets. And that's before considering the approximately $300 million of annual retained cash flow we generate, as well as additional accretive disposition opportunities. Looking further ahead, our lineage shares could also be another source of equity capital beginning in late 2027. Lastly, regarding Helbig, we've proactively reduced our exposure over the past two years from 35 stores to 16 through lease terminations, releasing activity, and asset sales. Importantly, Helbig's recent insolvency filing may help accelerate the process of taking back the remaining stores and bringing the situation to a close. Our remaining gross exposure is now just 90 basis points of ADR, with Helwig no longer a top 20 tenant. We already have springing leases in place on half of the stores at rents comparable to what Helwig was paying, and for the remainder, we're in active discussions with potential tenants and buyers and expect to have lease agreements or asset sales lined up by year end. The bottom line is that Helwig has a negligible impact on our 2026 earnings outlook, which is clearly reflected in our decision to raise AFFO guidance this quarter. So let me pause there and hand the call over to Tony to discuss our results, balance sheet, and guidance in more detail.
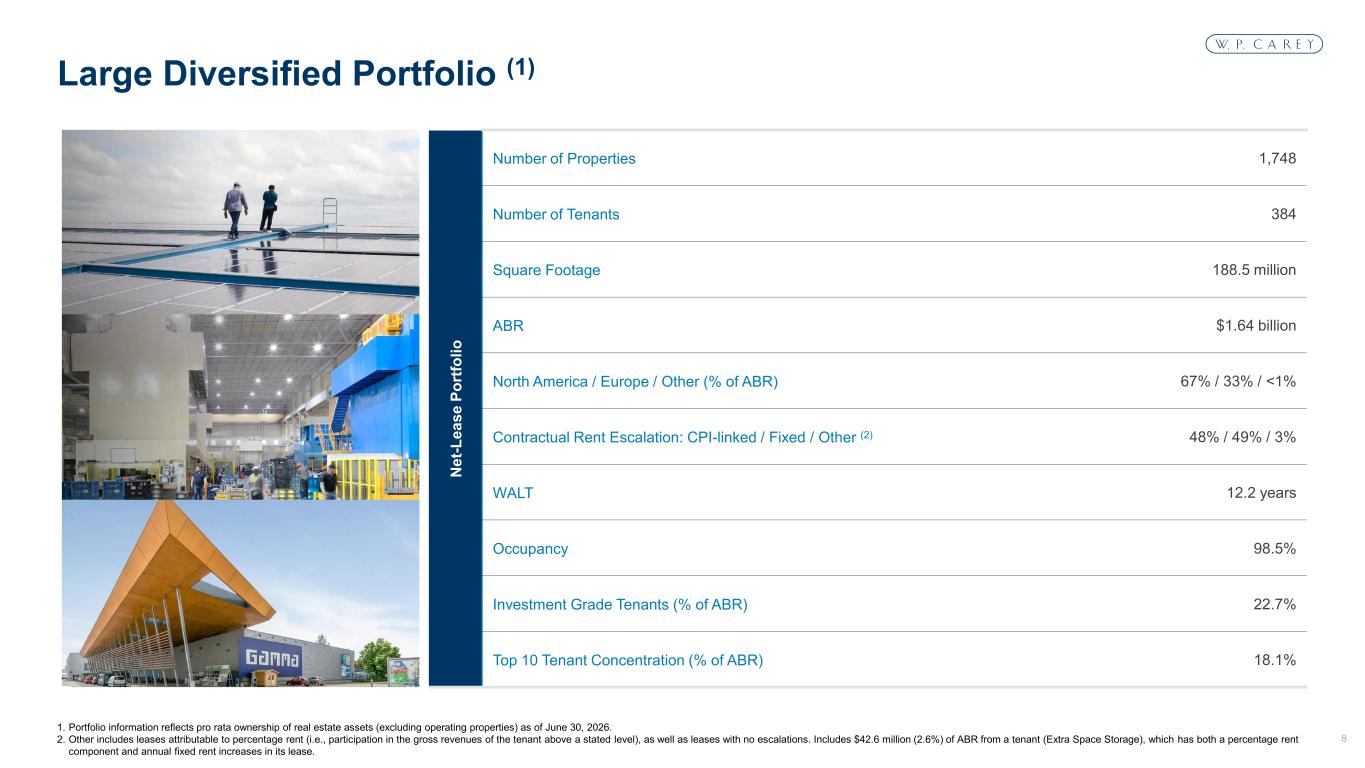
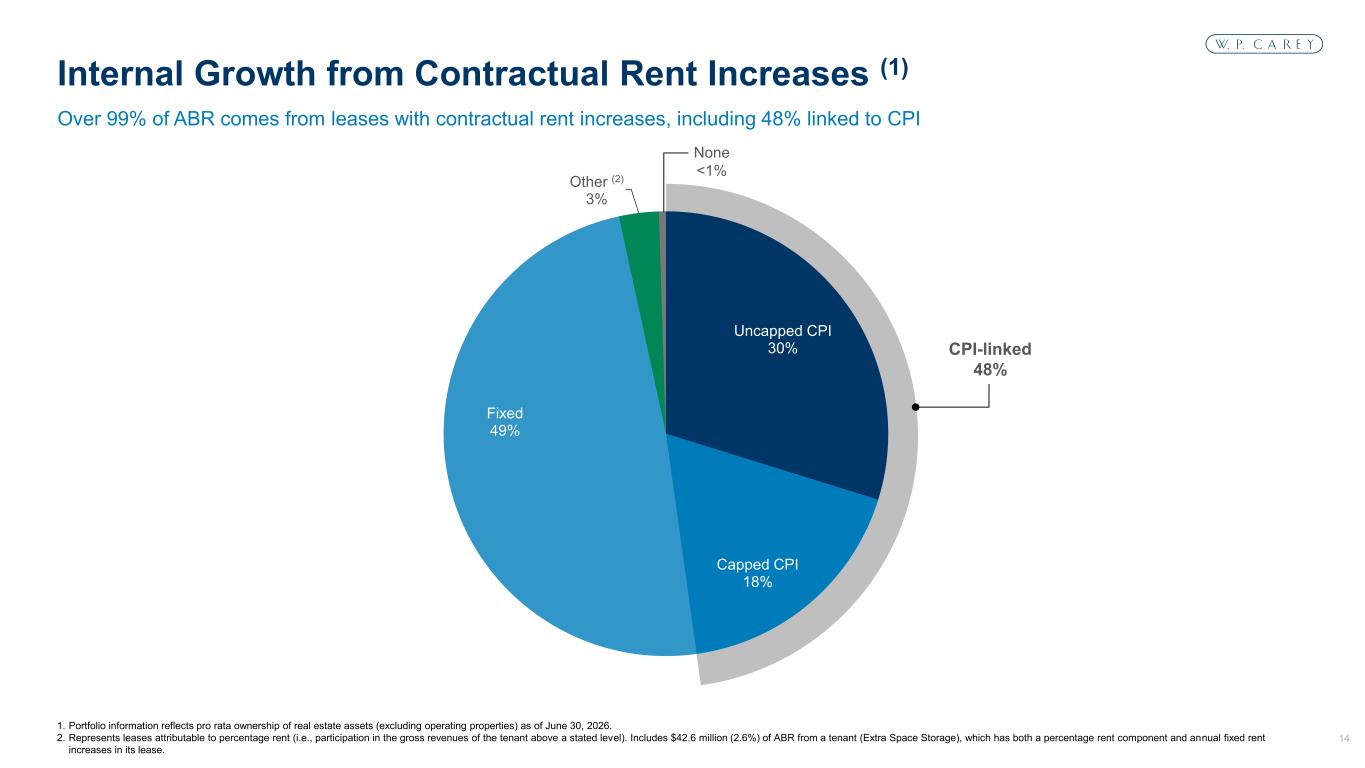
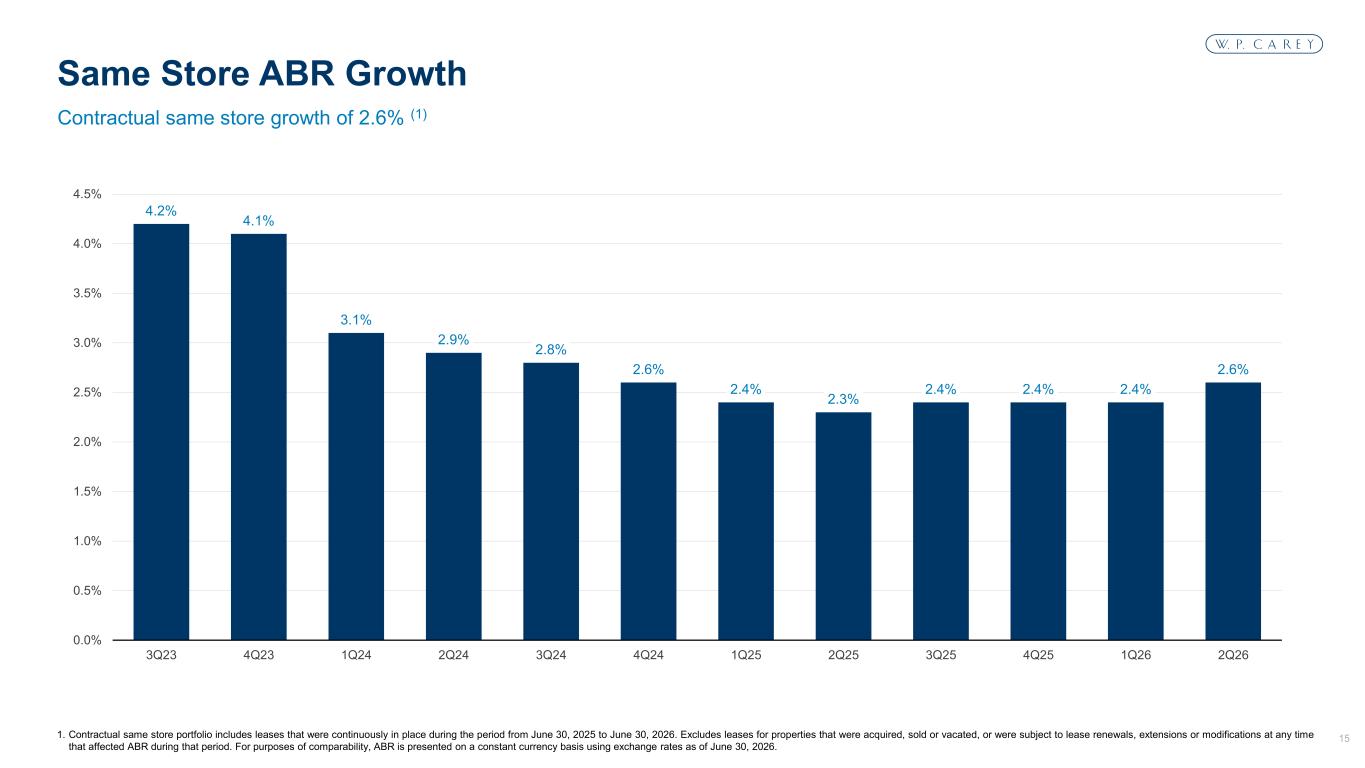
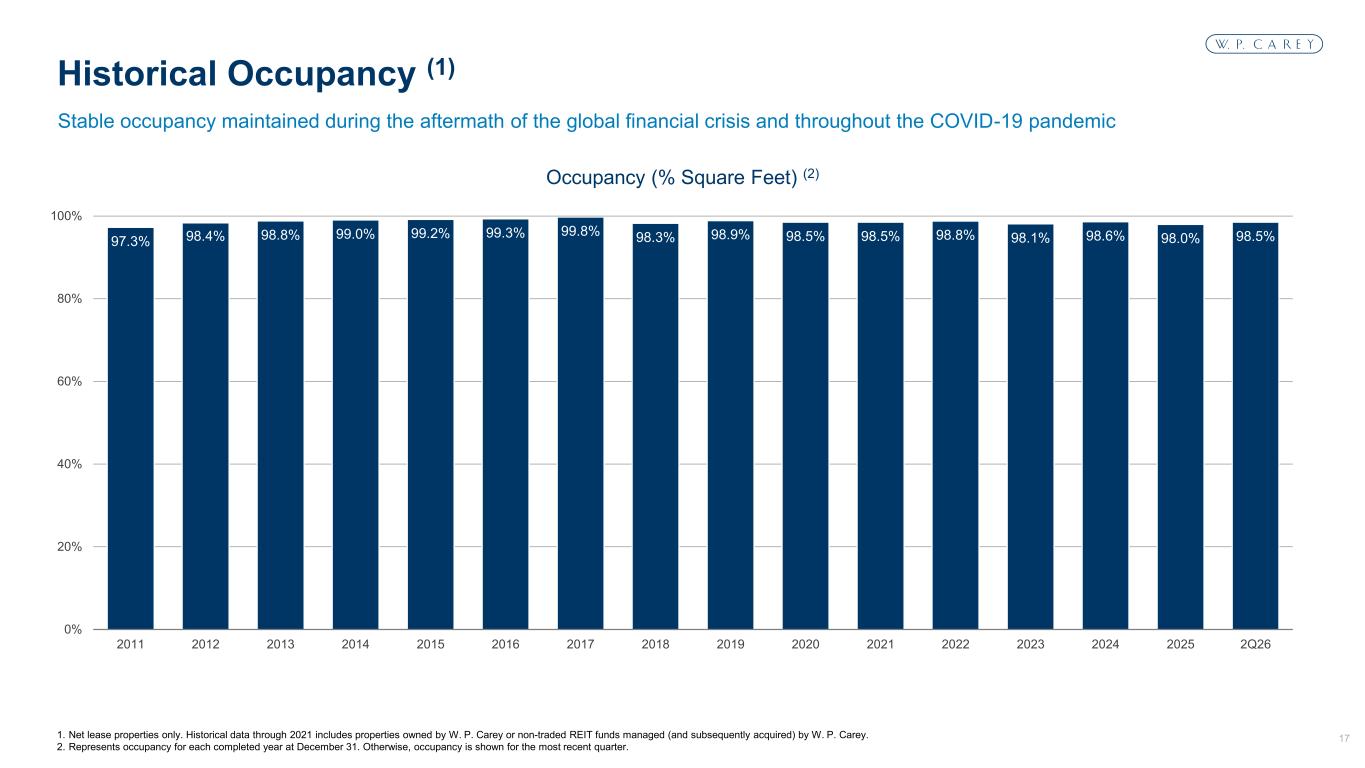
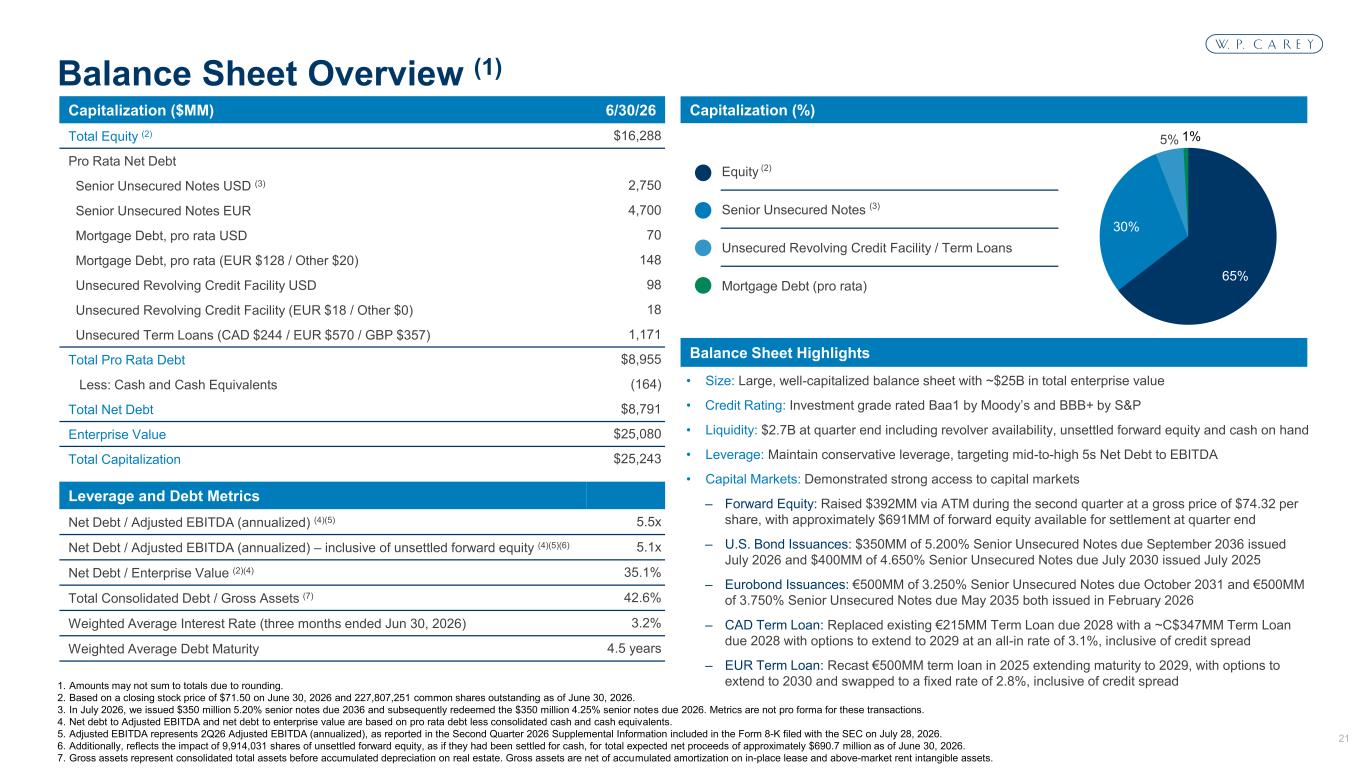
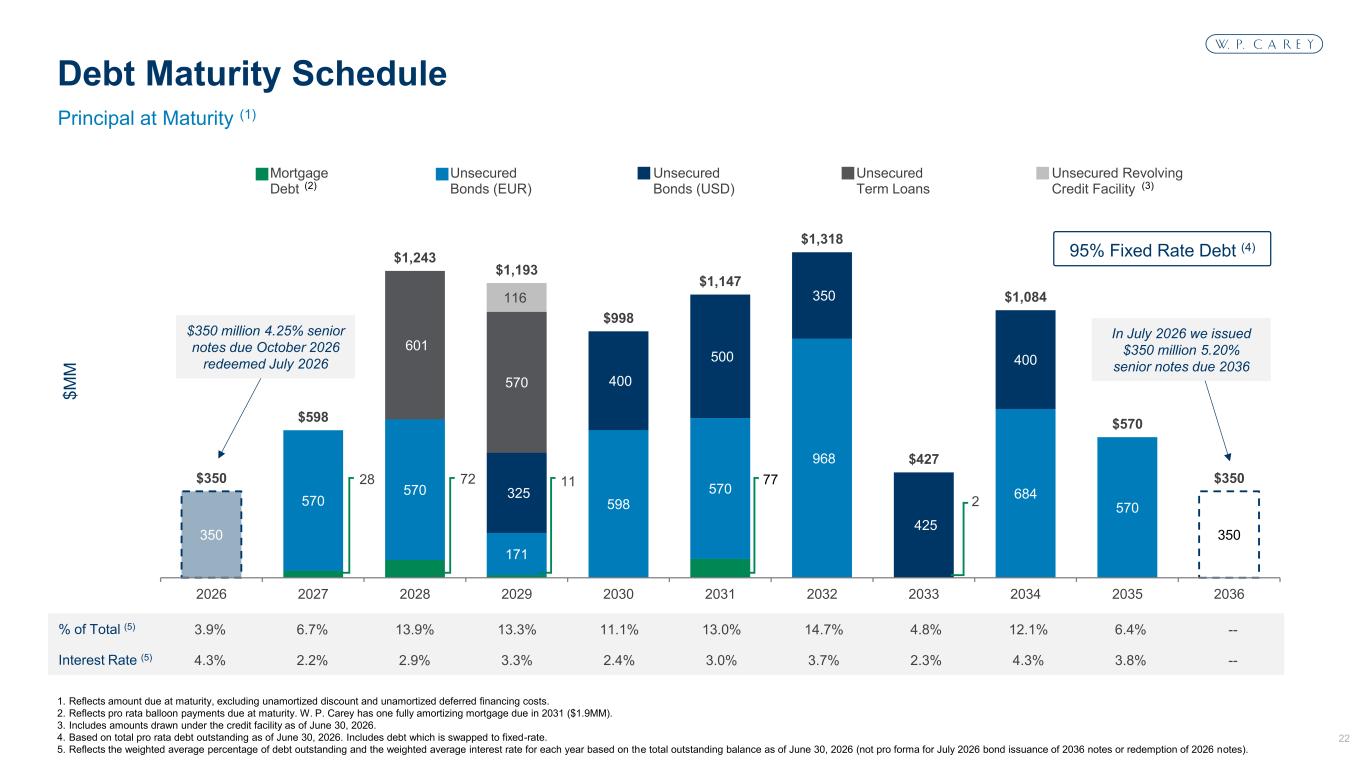
Thanks, Jason, and good morning, everyone. Starting with earnings, AFFO per share for the 2026 second quarter was $1.34, up $0.06 or 4.7% year over year. Investment activity continues to be the primary driver of our growth, having closed over $3 billion of accretive investments since the first quarter of 2025, including the $1.3 billion we've completed so far this year. Our second quarter results are also benefiting from the timing of elevated other lease-related income, which was previously anticipated, minimal rent disruption, and a one-time tax benefit, all of which I will cover in more detail shortly. Looking ahead, we've raised and narrowed our guidance range for full-year AFFO per share to between $5.19 and $5.27, which increases the midpoint by $0.02 and implies 5.2% year-over-year growth. Our guidance raise is driven by a combination of factors. In addition to higher lease revenues, reflecting stronger net investment activity, the beginning of higher CPI flowing through our leases, as well as a more favorable outlook for potential rent loss, we also now expect lower property and tax expenses. Partly offsetting those benefits is the impact of the forward equity we've settled during the second quarter, which also had the effect of reducing leverage to the low end of our target range. As Jason discussed, our revised guidance assumes higher investment volume totaling between $1.7 and $2.1 billion for the year, up from our previous range of $1.5 to $2 billion. During the second quarter, we completed dispositions totaling $84 million, bringing the total proceeds from dispositions over the first half of the year to $246 million. Based on our current visibility, we've narrowed and lowered our disposition volume range for the full year to total between $350 and $550 million, down from our initial range of $250 to $750 million. Moving to our portfolio, rent increases also contributed to our results, with contractual same-store rent growth of 2.6% year-over-year, driven by the continued strength of both our CPI-linked and fixed rent escalations. CPI-linked increases, which represent 49% of our same-store leases, averaged 2.7% for the quarter, as we are beginning to see the impacts of higher inflation flow through our lease revenue. Fixed rent escalations, which represent 48% of our same-store leases, average 2.5%, in part due to our ability to achieve higher fixed rent increases over recent years. The new investments we've closed year-to-date just over half had fixed increases, averaging 2.6%. Looking ahead, we expect contractual same-store rent growth to trend marginally higher in the second half of the year as certain multi-year fixed rent escalations and higher inflation-linked increases flow through lease revenues. Our expectation for contractual same-store rent growth for the 2026 full year has increased to 2.6% and is expected to trend higher in 2027 based on current inflation expectations both in the U.S. and Europe. Comprehensive same-store rent growth for the quarter was 20 basis points, with approximately 90 basis points of the variance to contractual growth attributable to a rent recovery in the prior year period. The remaining variance primarily reflects uncollected June rent from Helwig, along with the impact of vacancy and leasing activity. As a reminder, one-time items or properties moving in or out of the same-store pool can cause this metric to move around from one period to the next. Based on our current visibility, we expect comprehensive same-store growth to average between 1% and 1.5% for the full year, depending on the timing of leasing activity and dispositions, as well as the amount of rent loss that materializes. We're lowering our estimate of potential rent loss from tenant credit events to between $7 and $10 million, or about 40 to 60 basis points of ABR, down from our prior estimate of $8 to $12 million dollars. Through the end of June, rent loss across the entire portfolio, including Helwig, has been minimal, totaling 1.7 million dollars, which factors in certain rent recoveries. Helwig did not make its June rent payment, totaling approximately 1.2 million dollars, but has since paid its July rent in full as they work through the insolvency process. While Helwig may make additional rent payments throughout this process, our updated rent loss assumption assumes that we received no additional rent from Helvig this year, and that we recognized the full benefit of the three-month bank guarantees, resulting in a net rent loss of approximately $3 million from Helvig in 2026. Overall, our portfolio continues to perform well, and portfolio occupancy at the end of the second quarter was 98.5%, up 40 basis points from the first quarter, driven mainly by the disposition of vacant properties. Moving on to other lease-related income, which totaled $11.2 million dollars for the second quarter. This was in line with our expectations and brought the total for the first half of the year to twenty one point seven million dollars, including termination payments, deferred maintenance, and other lease related settlements as we continue to proactively manage our portfolio. Certain payments were more material in the first half of the year and we therefore expect the total for this line item to decline over the remaining two quarters. For the full year, we continue to expect other lease related income to total in the low to mid $30 million range. That brings me to expenses and non-operating income. G&A expense totaled $25.9 million for the second quarter, bringing the total for the first half of the year to $53.3 million. For the full year, we continue to expect G&A to total between $103 and $106 million unchanged from our previous range. Non-reimbursed property expenses totaled $15.2 million for the second quarter and 29.8 million for the first half of the year, including approximately 2.1 million of demolition costs related to redevelopment work. With greater visibility into the timing of redevelopment work, releasing activity, and lower vacant asset carrying costs, we're reducing our full year estimate for property expenses to between $54 and $58 million. Tax expense on an AFFO basis, which primarily reflects our current taxes on our international assets totaled $10.5 million for the second quarter and included a one-time tax benefit that was not anticipated in our initial guidance. Accordingly, we're lowering our full-year guidance assumption for tax expense by $2 million to between $43 and $47 million. Non-operating income totaled $4.2 million for the second quarter, which we view as a reasonable quarterly run rate for the remainder of the year. This line item primarily reflects the $2.9 million quarterly dividend on our equity stake and lineage, along with interest income on cash deposits, and realized gains and losses on foreign currency hedges. As a reminder, while changes in FX rates may impact realized hedging gains and losses, those impacts are generally offset by changes in foreign denominated revenues and expenses, resulting in no material impact to AFFO. Moving now to our balance sheet. As Jason touched upon, we've remained active in the capital markets this year, enabling us to stay well ahead of our capital needs, including funding our projected investment activity and prepaying our October bond maturity. During the second quarter, we sold 5.3 million shares on a forward basis, representing gross proceeds totaling $392 million at an average price of $74.32 per share. We also settled 5.1 million shares under forward sale agreements for net proceeds totaling $345 million. As a result, we ended the quarter with 9.9 million shares remaining to be settled, representing anticipated net proceeds of $691 million. Our capital markets activity, together with our $2 billion credit facility, which was largely undrawn at the end of the quarter, saw us end the quarter with substantial liquidity, totaling approximately $2.7 billion. We therefore continue to have ample runway to fund investment volume above the top end of our current guidance range, as well as into 2027. We've also continued to proactively manage our debt maturity profile. At the end of June, we priced the issuance of $350 million of 10-year U.S. dollar bonds with a coupon rate of 5.2%, which settled in early July. Proceeds will be used to prepay our October bond maturity with no associated prepayment costs. As a result, we have no debt maturities remaining this year with our next maturity being the 500 million euro-denominated bonds due in April of 2027. The weighted average interest rate on our debt remained low during the second quarter, averaging 3.2 percent, which is expected to increase marginally over the second half of the year, reflecting our recent bond refinancing. For leverage, net debt to adjusted EBITDA ended the quarter at 5.1 times, inclusive of unsettled forward equity, excluding the impact of unsettled forward equity, net debt to adjusted EBITDA was 5.5 times, which is at the low end of our target range of mid to high five times and down from 5.7 times at the end of the first quarter. Lastly, regarding our dividend, in June, we raised our quarterly dividend 4.4% year-over-year to $0.94 per share, maintaining a healthy payout ratio just over 70%. At our current share price, that provides an attractive annualized dividend yield close to 5%. And with that, I'll hand the call back to Jason.
Thanks, Tony. A few final comments. Overall, first half of the year has reflected a continuation of the momentum we established in 2025. Deal volume has remained strong, while our cap rates and average yields on new deals remain compelling relative to our cost of capital. The balance sheet is in a very strong position, with all maturities in 2026 fully addressed, and leverage now sitting at the low end of our target range. Significant forward equity has already been raised, enabling us to fund deals accretively well into 2027, and our portfolio is set up to further benefit from inflation through our CPI-based leases. Our expectations for earnings in 2026 continue to trend higher, despite the headlines from Helbig. We don't believe the recent stock performance relative to peers is fully reflecting how well we've executed. We also believe we will continue to be positioned towards the top end of the sector on both AFO growth and total return, factoring in our dividend yield. With that, I'll hand the call back to the operator for questions.
Operator
Thank you. At this time, we will take questions. If you would like to ask a question, simply press star, then the number one on your telephone keypad. If you would like to withdraw your question, press star, then the number two. And our first question comes from Spencer Glimcher with Green Street Advisors. Please state your question.
Thank you. Can you guys just walk us through your capital allocation priority list, just as it relates to build issues, expansions, and wholly owned acquisitions? I'm just trying to understand where you guys are seeing the best returns today.
Good morning, Spencer. I mean, it's really, I would say, across those categories. I wouldn't say that there is a priority in any of those. It's more about where do we see the best deal opportunities and the right return dynamics. I mean, I think we're active on all fronts. We've done a billion three of total deal volume for the year. And that includes, say, leasebacks. It includes buying existing leases. We've had deliveries of build-a-suits as well as expansions within there. So it's across the board. I think when we think about carry 10 solutions or the build a suit and expansion component of our asset management team, I mean, those are typically, you know, some of the highest quality deals because they're captive. So to the extent we can generate more opportunities there, I think that would certainly be welcome, but it won't be at the expense of doing deals in other areas of our target market.
Okay, thanks. That's really helpful. And then you guys continue to source a lot of industrial deals abroad. I was just curious if you could provide some color on the state of that property sector in Europe. I know it spans different countries, but just broadly speaking, if there's anything you can share on competition for those assets, demand for capital from the client's perspective or pricing.
Yeah, sure. I mean, competition, I would say Europe has historically always been less crowded from a competitive standpoint. You know, we're seeing, you know, I would say more or some more U.S. companies pop up there for competition. And and, you know, maybe it's worth noting that entering Europe and doing it well is probably easier said than done. And we've been on the ground there now in investing for almost three decades. We have 50 people spread across our London and Amsterdam offices. We have a lot of deep relationships across the market. We have a very good brand and track record. We do know the markets well. We have Europeans that are, you know, operating the platform across Europe for us. So we do have our advantages. And, you know, there is more competition maybe than there was five years ago, but it's a big fragmented market. Activity levels have been increasing over the past year, year and a half. So I think we do see good opportunities for more deal volume there. And look, there's a lot of different markets there. That's part of the challenge of covering it well and having experience. So they're each – obviously, there's overlap there in terms of fundamentals, but it does vary from market to market.
Awesome. Thank you, guys.
Operator
Your next question comes from Jamie Feldman with Wealth Fargo. Please take your question.
Great. Thanks. I'm sitting in for John Kilachowski today. So I guess, you know, for this quarter, we saw the straight-line rent adjustment step down without a commensurate move in gap rent revenue. Can you tell us what's driving that?
Well, the gap rent revenue did move down in relation to these specific adjustments and what you saw there. There's certainly other movements and growth that we saw in terms of our rental increases. But I think when you're specifically talking about the straight line rent add back, we did see an acceleration of straight line rent associated with two separate transactions on the leasing side. So we assigned two leases where there's no impact on the cash side. cash rent continues, and we write off the straight line rent balances for accounting purposes and reset those. So there's really no net impact on AFFO there. There's a lowering of the gap revenue and a reduction in the add-back.
Okay. And was there any type of termination activity that might have impacted it? Or no, pretty clean this quarter?
No. I mean, we have some rent recovery in there as well as kind of our normal recurring rent growth, but, you know, I think, you know, it's all part of the general growth for the year.
Okay. And then on the investment front, can you talk a little bit more about, you know, the cap rates you're getting across, you know, the difference between U.S. and Europe, and then maybe even broader question, just the investment landscape. It just seems like there's more capital coming into commercial real estate, debt markets are tightening up. Any thoughts just on the competitive landscape and if you think that'll put any more pressure on your ability to hit some year numbers?
Yeah, I mean, the U.S. net lease market has always been competitive. We have had some new entrants over the last couple of years. Some of the big asset managers have formed some funds, many of which are non-traded. So that's likely put some pressure on cap rates, but it's hard to quantify. And I wouldn't say it's been overly impactful on us, certainly the type of deals that we target. We've continued to generate substantial deal volume at what we think are very attractive pricing and spreads irrespective of competition. So yeah, more competition, but I don't think it's been all that impactful as of late. In terms of cap rates, we continue to transact across a wide range of cap rates with expectations that will average somewhere in the mid to low sevens for the year, which is similar to where at least our expectations when we started the year. And so I would say overall, cap rates have been fairly stable, and that's despite having treasuries moving meaningfully since the beginning of the year, up and down for that matter. And look, if the treasuries stay in the 4647 zip code, and let's also see what the Fed does today, I could see cap rates begin to adjust higher at some point. But as I just mentioned, there are some competitive pressures that may limit or offset that. But we're in good shape. We've raised a lot of capital already that can get us through 2026 and well into 2027, so we feel quite comfortable we can continue to deploy capital in that mid to low sevens range. And maybe last point is, you know, we frequently remind people that that's one metric that we look at, but we also, you know, want to make sure that everyone's focused on our bump structures and lease terms, which when you factor that into mid to low seven cap rates, that equates to an average yield in the nines, which we believe is among the strongest or highest in the net lease sector. And that's an important metric as well.
Thank you for that. If I could just throw in a quick follow-up. So with higher rates, I mean, how are you thinking about just underwriting assumptions and exit cap rates? And how are you just changing your view of the world as you put capital to work?
Yeah, I mean, certainly, you know, if we have higher rates and we think that's going to flow through to cap rates ultimately, and there's not always perfect correlation there, but over long periods of time, that should do that. Yeah, then I would expect in our underwriting models, we would flow some of that increase in cap rates into the exits that we assume. We're generally quite conservative on residual values in how we look at transactions and model them. So I think we're building in pretty good cushions for residual values at whatever point in time we feel like we want to model an exit.
Operator
Your next question comes from Mitch Germain with Citizens Bank. Please state your question.
Thank you. Jason, it's been a couple of quarters in a row where you've had some pretty sizable sale, leaseback activity. You're pretty positive about the state of your pipeline. Are you seeing a recurrence of these kind of bulkier transactions in the continuation? Do you see that happening?
I mean, the majority of our deals fall within, call it the $25 to $100 million size range with the average probably around $50 million. But we do consistently see larger deals. They're part of a regular deal flow. Any given year, I think we can expect a bit on a number of these larger sale leasebacks, call it $200, $300, or even larger deals. And as you noted, this year, we have completed several larger transactions, including the $400 million garden core deal I mentioned earlier. And I think the other thing that's important. We're one of the largest net lease REITs. So one of the benefits of our scale is that we can do some larger deals and it's part of our business and I would expect that to continue. I mean, some of it is going to be dependent on what's out in the market, but when they're there, we're going to be quite competitive.
Great. And then maybe one for Tony-Ann. Can you provide the building blocks that of the one-time items in QQ that should be eliminated when we're thinking about 3Q earnings?
Sure, yeah, I'll kind of recap there. I think maybe I'll just start by saying that really despite there being some variability in certain of the items from quarter to quarter, we are expecting strong overall AFFO growth for the year above 5%, and that's really coming from our core growth investing and within the portfolio. There are a few factors that impact first half versus second half comparisons, and the largest of which is the other lease-related income, which I mentioned. Fluctuations in this item are expected from quarter to quarter, so we don't really view this as any kind of deceleration in growth. The first half, we had about $22 million of other lease-related income. We're expecting the total for that line item for the year to be in the low to mid $30 million range, which really implies a drop-off in Q3 and Q4. In addition to that, we'll see the impact of the timing of our capital markets activity. So with interest expense expected to increase, with the refinancing of maturing bonds this year, That will come through in the third quarter and towards the second half of the year. And then I think lastly on the rent loss side, I mentioned on my remarks that year to date we've incurred about $1.7 million of rent disruption. That includes Helwig's June rent payment and some recoveries in the second quarter. We have lowered our overall rent loss range to $7 million to $10 million for the full year. So that implies that our guidance assumes we see the majority of that being used in the third and fourth quarters. You know, we did highlight our expected losses from Helwig. That's our most material exposure. So there is likely some conservatism in that in our revised range as we approach the latter part of the year. But that's a little bit more of the timing difference. So those are really three of the largest factors that are going to contribute to that change.
Great. If I could just add, just what was the one-time tax benefit? What was that, $2 million, I believe? Or no?
Well, we reduced guidance by about $2 million on that line item. I think the impact is a little over $1 million in the quarter specific to that. And, you know, it's really just the application of net operating loss that we were able to utilize against some current income on an international asset. So, you know, not really recurring in nature, but it helps and benefits us for AFFO this year.
Operator
Your next question comes from Yana Galan with Bank of America. Please see your question.
Thank you. Good morning and congrats on a great second quarter. I'm curious, just following up on the potential rent loss estimates, curious if there's any, you know, in any specific industries, regions, anything to kind of call out on how you're kind of, you know, being conservative, but thinking about potential issues, or is it all kind of idiosyncratic kind of one off?
Yeah, I think I think you cover that. Or go ahead, Tony, you can jump in.
Yeah, I think the rent loss in general, maybe just to recap here, I highlighted, you know, our expected losses from Helvig, a really maximum loss we expect this year could be around $3 million of rent. So that's $3 million of the 7 to 10 in our range. I mean, outside of that, you know, there's no real themes across any industries. I would say we have a small handful of tenants that have some partial rent disruption. You know, I don't think there's any themes Brooks worth highlighting, but, you know, I think we're still viewing some conservatism into the back half of the year, as I mentioned. So, you know, that's more about the macro environment and less about anything specific we're seeing in our asset tenant base. There haven't really been any new material rent disruptions in the existing portfolio.
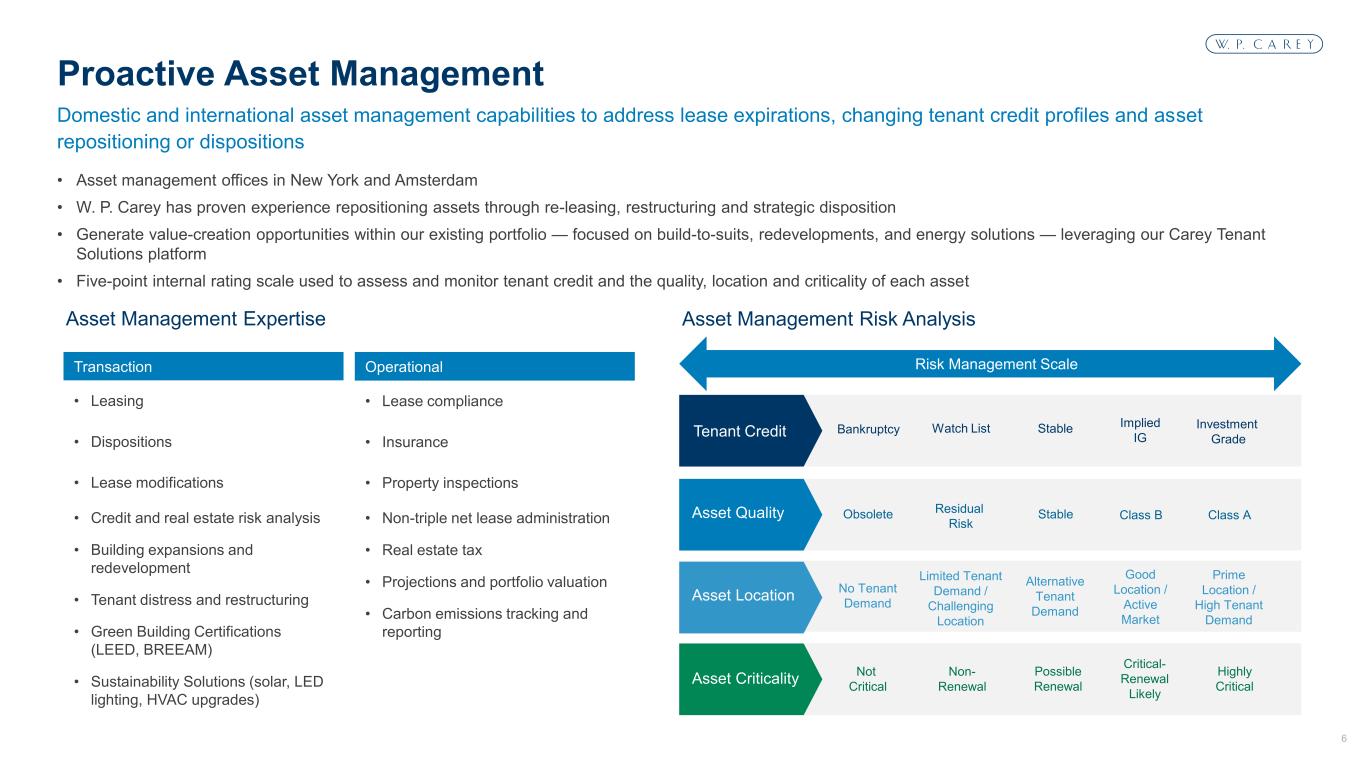
Yeah, nothing to add to that. And, you know, Credit Watch broadly is very stable. No really new ads. And some have come off. So, that's coming in a bit. And so, that's reflected as well in our lowering net rent loss assumption.
Your next question comes from Jason Wayne with Barclays. Please state your question.
Thanks for the question. You said that CPI length escalators are more customary on European assets. So just wondering, what's a blended growth, kind of CPI growth there that you're simulating in leases?
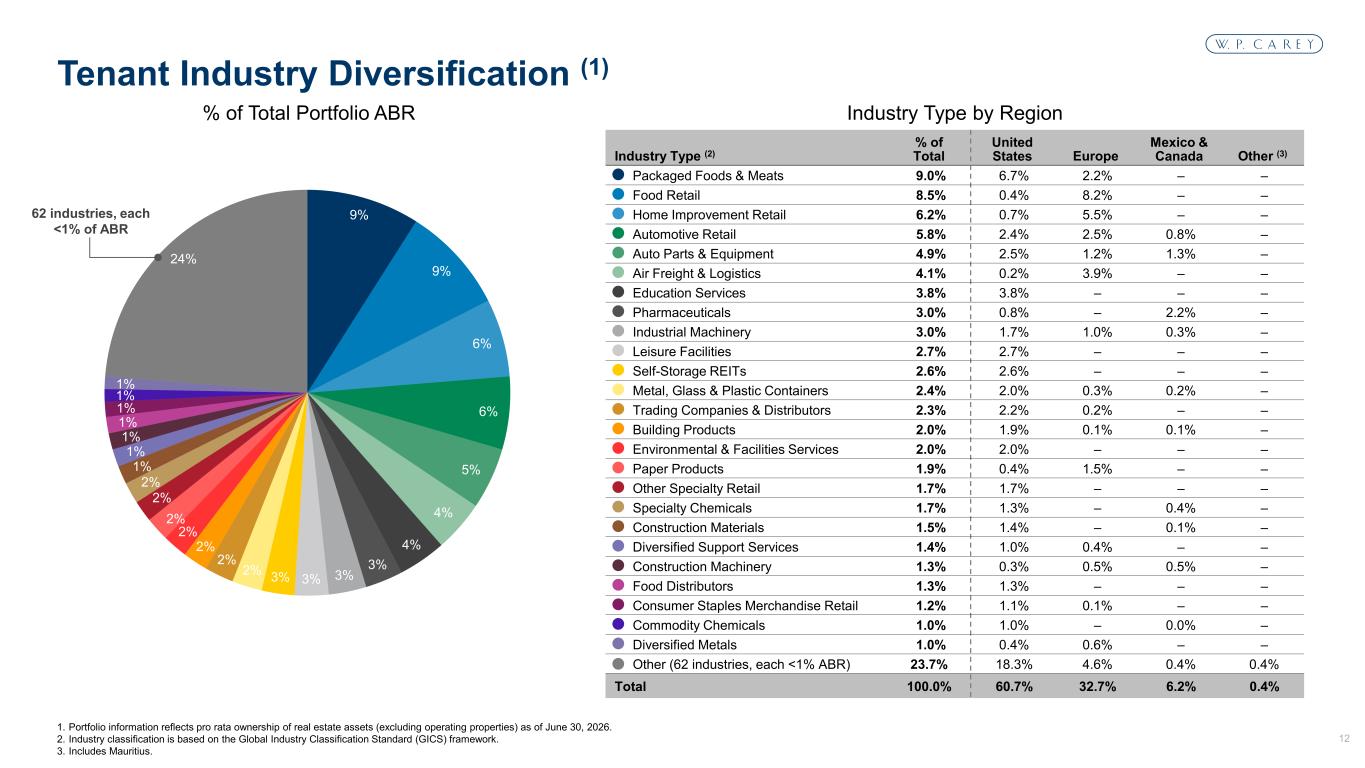
In terms of new transactions that were originating, or I'm not sure if we disclose this or if it's in our stuff, the breakout between Europe and U.S. and the expectations around same store. right yeah yeah but kind of both of those yeah maybe i'll start with the first one and tony if you have the information on the second one i mean on new deals yes um uh it is more customary in europe to have cpi increases um and you know we've mentioned this before since the spike in inflation a couple years back cpi has generally gotten a little bit more difficult um to get especially in the U.S., but in Europe, maybe there's some discussions or negotiation around that as well. But that said, so far this year, about half of our deals closed to date have included CPI-based leases. A lot of that is driven by an increase in European deals and our larger Canadian deal at the beginning of the year was also a CPI-based transaction. The pipeline also has a fair amount of CPI. I think it's close to half as well. Again, a function of doing some more deals in Europe. And we've talked about this as well. When we're not getting CPI-linked increases, we're seeing the effects of higher inflation on our ability to negotiate higher fixed increases. So historically, those have averaged, call it around 2% per year. And more recently over the last four or five years, they are 50 to 100 basis points higher than that. For example, our 2026 closed deals that have fixed increases, those averaged around 2.6% per year. I think the pipeline is maybe even slightly higher than that. So inflation has kind of flown through both components of our leases.
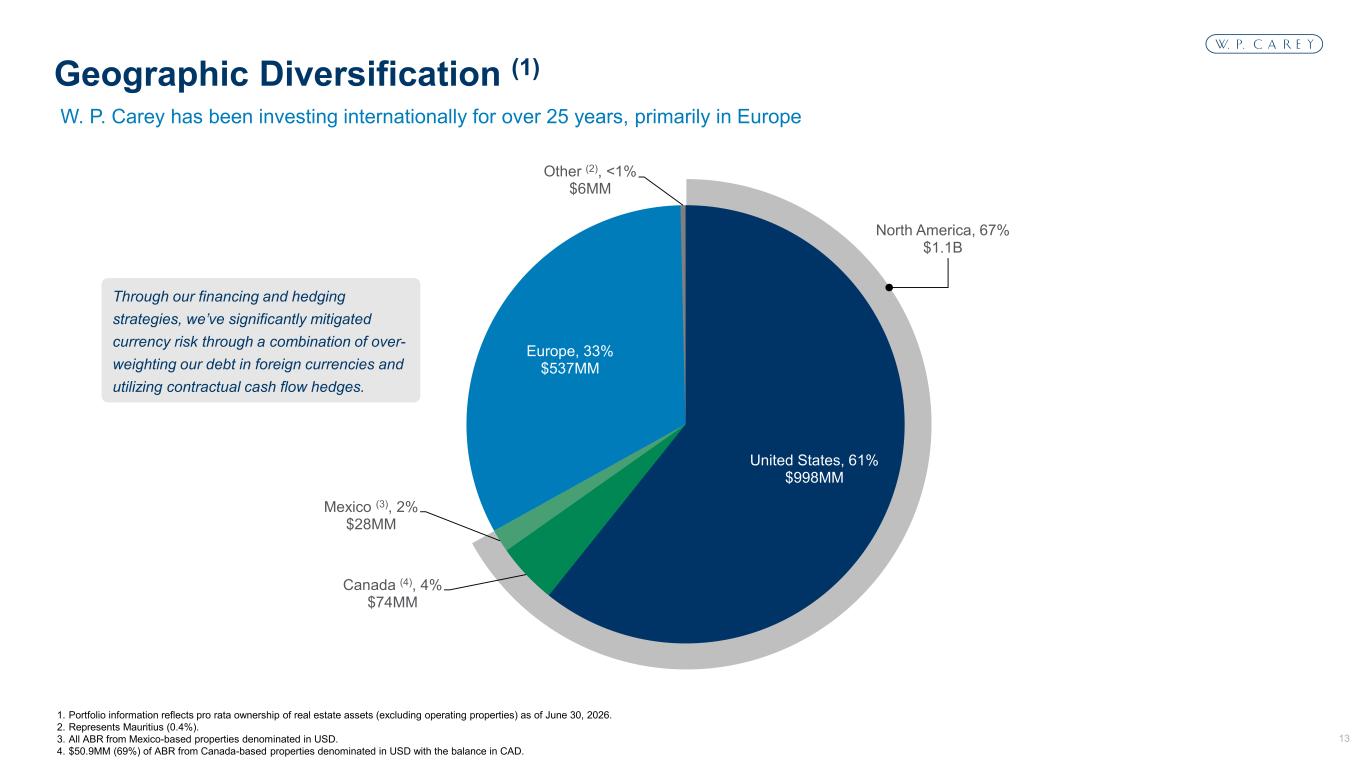
And on the existing portfolio, I would just add that, again, about half of them being CPI-based, I think we're weighted more towards about 70% of international leases are CPI-based, where it's about 30% of those bumps are from the U.S. And so we're seeing the trends go up in both areas, both domestically and internationally. I'd say since the start of the year, we've seen the international CPI increase about 100 basis points from our initial projections. U.S. CPI is maybe just shy of that, around 90 basis points. But again, that'll all start to flow through in the back half of this year and more meaningfully as we get into the start of 2027, just given the lag in our leases and the timing in which the escalations are computed.
Got it. And then just on dispositions guidance, are you still planning on selling any non-core assets this year, or is that just more of a long-term kind of option for you?
Brooks you want to cover that yeah so you know the dispositions guidance we refined this quarter but still has a fair degree of flexibility for the back half of the year the breakdown is roughly a third non-core maybe two-thirds is more risk mitigation and vacancy cleanup you know on the non-core side as you recall we sold the final chunk of operating storage earlier this year And we also sold our only Asian asset in Japan in Q2 for a great price. So those are both what we would consider non-core. So yes to that question.
Your next question comes from Smeeds Rose with Citibank.
Operator
Please state your question.
Hi, thanks. We were just wondering about the implied investment volume, your range through the second half. just the low end seems particularly conservative. And I'm just wondering, is there anything in particular that you are thinking sort of could happen that would drive that sort of market slowdown in investment activity? Or are you just trying to be somewhat conservative at the low end?
Yeah, there's no read through in kind of the low end of the guidance to what we're seeing in terms of activity. I mean, we continue to take a measured approach to how we view guidance. If you recall back in February, we talked about our initial guidance as a starting point and then increased it by 250 at the midpoint in April and by another 150 million today. And so as we get more visibility in the back half of the year and specifically the fourth quarter, we will review and potentially refine it at that point in time. But activity levels are still robust for us. Again, we don't have a lot of visibility in that fourth quarter and we can't quite predict exactly what will happen. But if the environment continues as we see it today, yeah, I wouldn't expect that low end to come into play. And it's probably more, you know, the top half of the guidance range, if I had to guess right now.
Okay. And then we just, we're looking, the real estate impairment charges looks like they've kind of gone up sequentially for several quarters now and a pretty big kind of step up for this quarter. Is that just related to assets potentially for sale, or is there anything going on there that you can speak to?
Yeah, I'd say the marks this quarter are really more disposition-related. There are a couple of larger ones this quarter. The first one relates to our one remaining student housing operating property in the UK. We are evaluating that for a potential sale later this year, maybe early next year, and current pricing indications are lower than our current carrying value, which triggers the impairment. I will say that although it is a mark on the carrying value, we do still expect at that sale price that the asset sale would be marginally accretive from a cap rate perspective relative to where we could reinvest the proceeds, so generally net neutral to positive from an AFO perspective. The balance is really, I think, related more to Helwig. We have some impairments on a few of the properties in the portfolio that, again, reducing them to their expected selling prices, we expect to sell those assets. So those are really the material drivers this quarter. And importantly, no AFFO impact and no concerns within the broader portfolio.
Great. Thank you. Appreciate that.
Operator
Your next question comes from John Kim with BMO Capital Markets. Please state your question.
Thank you. On your updated rent life, rent loss guidance for the year, $3 million of which is attributed to Helwig, net of the bank guarantees. Given they unexpectedly paid rent in June, what is the likelihood, in your view, that they will make further rent payments this year? And also, in your guidance, is Cornerstone part of that rent loss? They were called out as being on your watch list last quarter.
Yeah, I can cover that, and then Brooks can add any color. You know, I think in terms of the overall rent loss for Helvig, you're right, $3 million assumes they don't pay rent from August on. They did pay July. They didn't pay June. They have indicated that they're likely to continue paying rent. It's hard for us to say with liquidity and where they are in the insolvency process, whether and how long that continues. So this could be a conservative position based on where we sit now. You know, their rent's a little over $1.2 million a month. And as I mentioned, we do have the benefit of the bank guarantees assumed in the back half of the year, covering about three months of lost rent there. So there could be some upside if they continue to pay rent and, you know, there's less of a loss on Helvig. In terms of Cornerstone, again, we have a generally more broad view in terms of the remaining rent loss reserve. Cornerstone specifically, while we expect that they could go through some kind of a restructuring on the balance sheet, we do expect that they would continue paying rent. So we don't have a specific component there, but generally if there were any rent disruption, we should be covered.
Okay, and then I wanted to ask about your stake and lineage and your latest views on using that as a funding source when your lockup period ends next year. I realize it's a non-core holding, but when you look at consensus estimates, the DPS growth is expected to grow or exceed 3% annually, which is pretty attractive, and it is a taxable event for you when you sell. So where does selling linear shares, where does that fall in terms of priority as a source of capital?
So, yeah, I mean, we expect that, you know, in the second half of the year and maybe it's, you know, more towards the late part of the second half of the year that we'll have the ability to, you know, consider selling lineage at that point in time. I don't think we're going to take a view on the direction of the stock price and, you know, where it could go. I mean, tax is certainly something we think about. We do have a gain because we've invested very early when we helped seed the company with some sale leasebacks over 10 years ago at this point in time. So there will be some gains, but we'll be able to manage those. This is not a huge investment. It's a couple hundred million at this point in time, and the gains will be manageable. So I don't think that's really a big consideration that will affect timing. So I think overall, over a several-quarter period, my guess is that we'll use it as a liquidity source for us. And it will be accretive. I mean, they pay a dividend yield that's inside of by a couple hundred basis points where we would reinvest it into corn at least for us. So that'll be a positive source of capital.
Operator
And your next question comes from Anthony Paolone with JP Morgan. Please state your question.
Thanks. Can you talk about just your your deal pipeline and activity levels and some of your newer areas or focal points like retail healthcare and some of the build the suit work that you you'll pursue?
Yeah, sure. I mean, maybe I'll start with, with retail. I think we're making progress there. We had, I think it was about 20, a little over 20%, maybe 22% of deal volume last year came from retail this year, year-to-date deal volume is about 24%. And we do have some smaller retail deals in our pipeline right now. It's a big market. The net lease retail is the biggest market within net lease. So we hope that over time we can increase that and that can be really additive to our deal volume. I think sometimes the challenge is the initial cap rates are generally in the right zip code for us, but bump structures tend to be a little lighter than what we would target. But I do think we can take some market share and we are finding good deals there. Yeah, health care is another area that, you know, if we think that we can do a couple hundred million dollars a deal in the health care industry, that that'll be additive as well. I mean, it's a big opportunity set, you know, while it's competitive, you know, we should be able to find some deals there. And we have. It's diverse. We do like the long term dynamics of a growing and aging population. I think mostly we've been focusing on IRFs or inpatient rehab facilities. We did call it a couple hundred million dollars of that last year, maybe a little under $200, and we've added to that some this year. It's going to be more opportunistic in that space, though. I'm trying to think what else in terms of the build-the-suits and expansions under carry tenant solutions. Historically, we've generally done about $200 million a year or that's been under construction. Right now, we're at about $300 million of construction projects in process. I mentioned earlier that about 133 of those are still expected to deliver this year with the bulk of the remainder in next year. So all these areas are contributing. If you think about it, if we can add a couple hundred million dollars in each of those categories, that'll help us move from maybe a deal volume target of $2 billion or something that can be above that, which will obviously all help in flowing through to our growth on an annual basis. okay thanks and then just my my second question um i i know you don't have any real debt maturities but you do have equity and so if you were going to pair equity with debt like where would you look in the debt market right now like where would where would cost be and what would be your your most favored sort of market duration etc yeah i mean right now the the euro denominated debt. That's around 100 basis points tighter than where we can issue debt in the U.S. So that's our most attractively priced debt capital. I think there's lots of factors for us to consider, including capital needs and pricing, as I just mentioned, but also market conditions, what our deal pipeline looks like. Those are all things that we consider in terms of which currency we would elect to issue in. I think generally speaking, we repay bonds in the same currencies as the expiring bond. But I think the bottom line is we have lots of flexibility there when we look to raise capital, whether it's on the equity side or the types of debt we want to issue.
Your next question comes from Greg McGinnis with Scotiabank.
Operator
Please state your question.
Hey, thanks. Given the $690 million in forward equity remaining, do you anticipate you need to use overnights going forward, or do you just support the acquisition pipeline funding utilizing a similar equity rate strategy as Q2?
I think over the past couple of quarters, as you just mentioned, you saw us raise equity both through the ATM as well as a larger marketed issuance. I think both are options. I think whenever we feel like it's a good time to be in the market, I think we are covered for this year and probably well into next year as well. But we still can be opportunistic with equity and flexible in how we think about the types of equity that we raise. So it's, you know, going forward in the future, I'm guessing it's going to be a combination of both of those and we'll kind of evaluate our needs as we go.
Okay, thanks. And then just looking at the remaining operating assets, you know, we appreciate the color on the student housing facility in the UK, which sounds like it might be sold this year. Is there any update on the potential hotel redevelopments and sales?
Brooks, you want to cover that?
Yeah, as a reminder, we own four operating hotels. One is a Hilton in Minneapolis. We'll sell that when the time is right, potentially into next year. On the Marriotts, which you're referring to, we have three operating Marriotts. Two of those likely pivot to sale, potentially later in this year, but maybe into next year. The one which we are targeting for redevelopment is adjacent to the Newark Airport. Targeting Q1 of 27, likely for a project start there. But we remain to retain a lot of flexibility there. You know, the hotel will keep operating as we assess kind of market dynamics there. So all those in one shape or fashion will come out of the system, you know, likely over the next 12 to 18 months.
Thank you. And then can you give any details in terms of, like, the size of that potential redevelopment? Best of dollars, expected yield.
I think it's premature to provide specific details on that development. But it certainly will hit our disclosure when we kick that off.
Operator
Your next question comes from Jim Kammer with Evercore ISI. Please do your question.
Thank you very much. Fully appreciate that Carrie spent years sort of exiting, let's call it, the fund management business with the CPA funds. But I'm curious, what's your strategic appetite today to sort of reengage in the fund management or, you know, third-party assets given your scale, your global reach, your differentiated asset access. You know, there's a lot of money looking to get into the net lease. And just curious what your thoughts are about becoming more of a fund manager.
Yeah, I mean, we did exit that years ago. Our view is that for public net lease reach simplicity, there's certainly benefits to that. I think those who we've seen get into that business typically have much larger scale, which means that their growth needs may be higher and the public equity markets may not be able to support as much funding that's required to hit deal volume targets. I mean, we're a large top 20 REIT, but we're not at that scale yet. We feel very comfortable that we can continue to funding, you know, our investments with the mix of equity and debt. And, you know, I don't think that that's something that we would consider, you know, in the near term, long term. You know, I wouldn't say that it would be off the table, but it's not on our radar right now at all.
Fair enough. Thank you. You're welcome.
Operator
Your next question comes from Brad Heffern with RBC Capital Markets. Please go ahead.
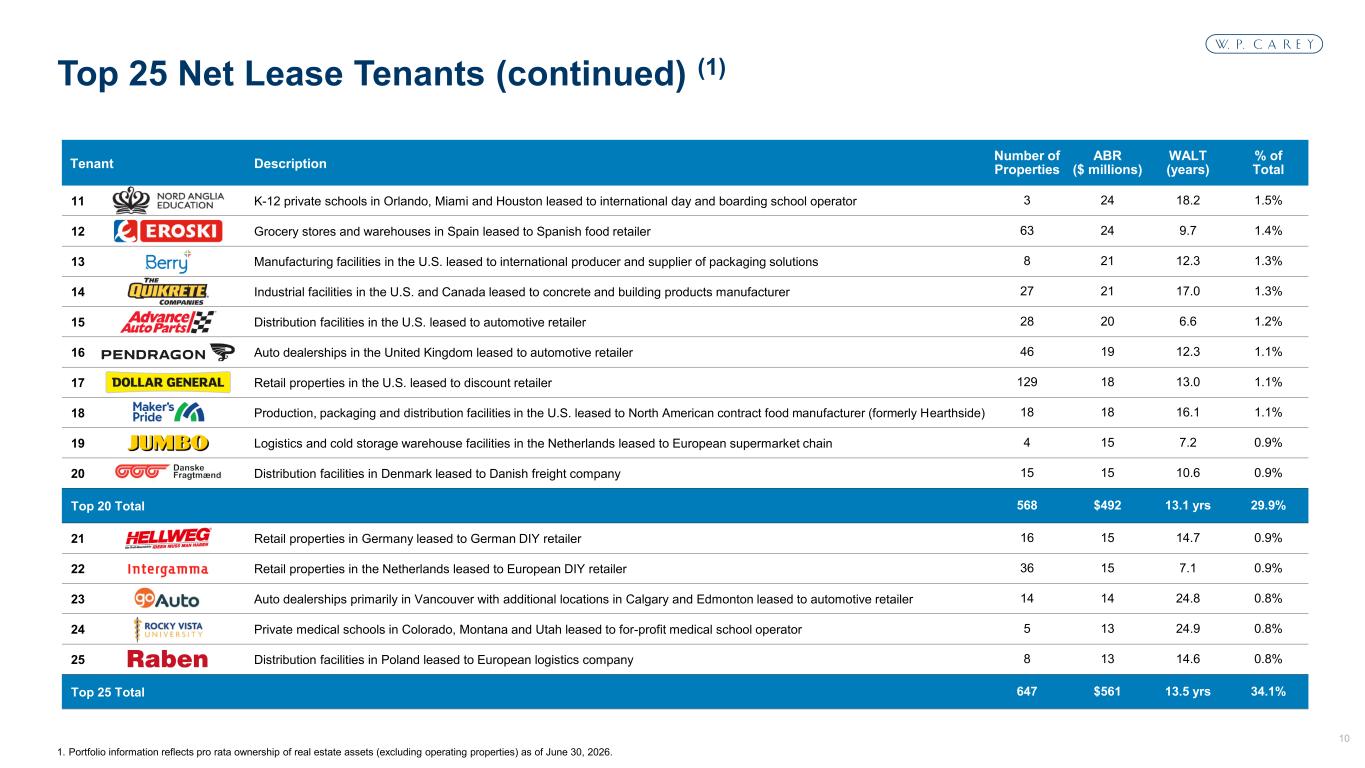
Yeah. Hey, everybody. Thanks. You have three new tenants join the top 25 in the quarter. You talked about Garden Core and the prepared commons, but then you also have Rocky Vista and Kesco Senukai. I may have butchered that, but can you just go through those other two tenants?
Yeah, sure. Let me start with Senukai. Yeah, not a new investment per se. They're an existing tenant. That investment, the original investment was held in a JV. And the JV fund structure, owning those assets was maturing. So we took over 100% control of those assets by buying out our partners, which is not unusual for a majority owner to consolidate and buy out minority partners at the end there. So that was the reason for that increase. As for the tenant, they're a dominant DIY retailer in the Baltics. They're backed by a company called Kesco, which is a Finland-based company and one of the largest retailers in Northern Europe. They're publicly traded, I think, have a market cap of around $10 billion sizable. They're not explicit guarantor for the tenant, KESCO, but it's always good to have a deep-pocketed backstop there. The other one that you mentioned, Rocky Vista, that is a for-profit medical school, and we did an expansion for them. Very good tenant. They're filling a much needed demand for for more pathways for higher supply of doctors in certain regions. So a very good company that that we back now for a number of years.
OK, got it. And then looking at Apotex, obviously, your second largest tenant. There was this announcement about potential generic drug tariffs. I know 2028 is a long time from now and these tariff threats kind of come and go. Sorry, there's construction in the building. Not sure if you can hear that. How do you think your assets would be positioned if that were to actually happen, the potential tariffs on generic drugs?
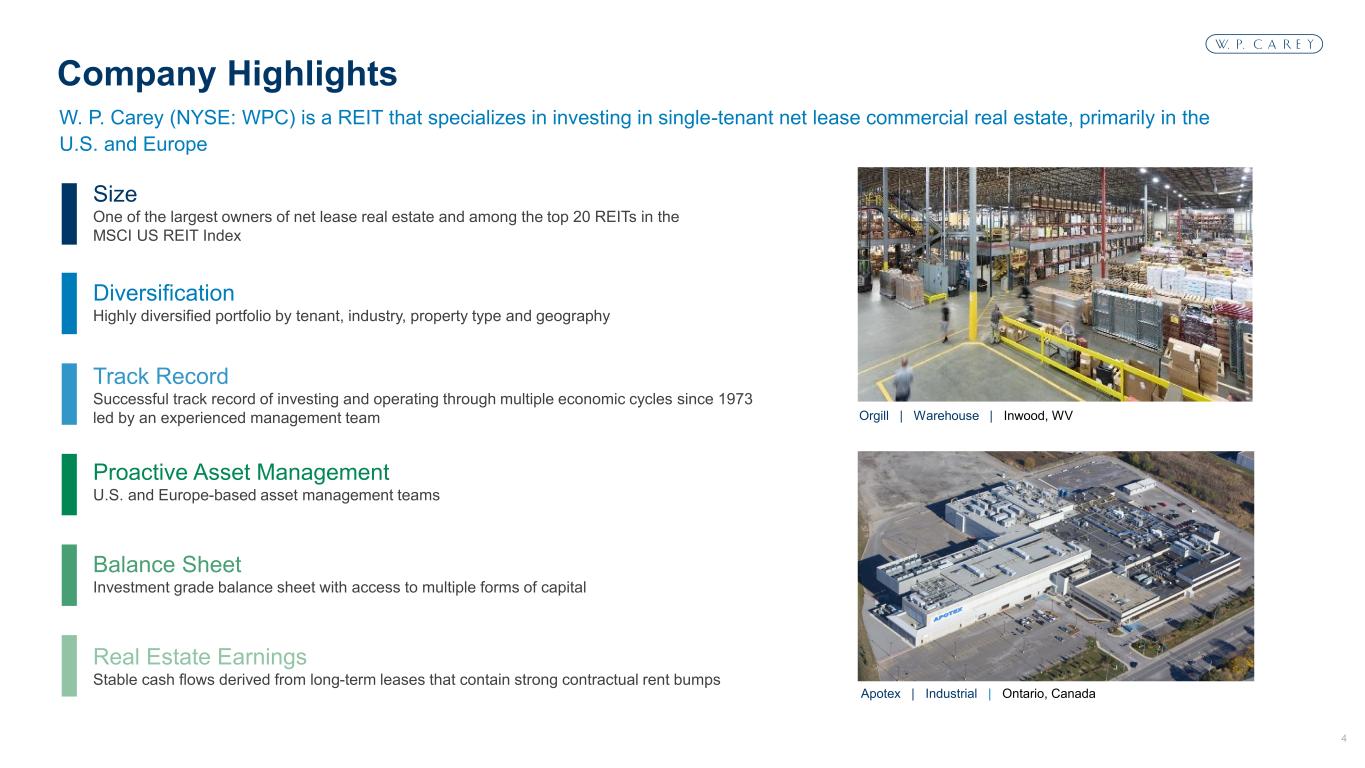
Yeah, and maybe that's part of your question is like most announcements on tariffs, it's very uncertain of how this will play out and whether there'll be any for that matter or what happens with some of the uncertainty now around the USMCA trade agreement. But I think even in a scenario where Apotex stops serving the U.S. market or moves in some of their production into the U.S., we're confident in the mission-critical nature of our assets. They're also in Phil Toronto, which is one of the better industrial markets in North America. And the company itself, Apotex, they're very important to the Canadian healthcare system. They provide a very large percentage of the generic drugs that are used across Canada. So I think we feel pretty good about that investment, regardless of any impacts that tariffs may have on their ability to sell into the U.S. It's probably also worth noting, we did that deal about three years ago. And since that time, the company has gone public, now has an equity market cap of around $6 billion, total enterprise value of around $8 billion. And, you know, it was a strong credit when we did the deal originally, but it's now gotten bigger. It's gotten more profitable, has access to the public market capital. There's more disclosure now that it's a public company and leverage is down. So, you know, all positives for the credit. And, you know, again, I think, you know, we feel quite good in their ability to continue to pay our rent. And that's going to be a good investment for us.
Operator
Thank you. and a reminder to the audience to ask a question, simply press the star key, then the number one on your telephone keypad. To withdraw your question, press the star key, then the number two. Your next question comes from Michael Goldsmith with UBS. Please state your question.
Good morning. Thanks a lot for taking my questions. You noted that CPI tailwinds should flow through the second half of 2026 and into 2027, just based on today's inflation expectations. Where do you think contractual same-store rent growth can ultimately stabilize?
Yeah, stabilize is probably a longer-term question. I would say if we're looking into 2027, we're seeing same-store on a contractual basis probably trend upwards towards the mid to high 2% range, even approaching 3%. And we'd probably start to see that in the first quarter, where we have about 40% of our leases escalating at that time. So, you know, longer term, I think we're seeing stabilization is even landing at a higher rate than it was previously, both internationally and domestically. So, you know, again, that'll help support longer term growth, but it's hard to say exactly where that lands. It certainly moves from period to period.
Thanks for that. And as a follow-up, we've touched on a lot today, but just given the commentary around higher CPI rent growth, a favorable transaction market, steady cap rates, and substantial pre-funded capital, is it fair to think that 2027 AFFO growth could compare favorably with 2026, or are there any offsets investors should be considering? right?
I think too early to get into 2027. Michael, good try. But, you know, we'll, you know, I think as we get towards the end of the year, we'll probably, you know, have some trends that could carry over to next year. And obviously we'll issue guidance in all likelihood on our Q4 call in February. So nothing specific about 2027. I will say that we are having a strong year from a deal volume perspective. And, you know, that certainly will help, you know, drive growth going into next year. Tony mentioned same-store growth is trending higher, so that's a positive as well. You know, like everyone in the REIT industry, there are always, you know, there's refinancing headwinds given where rates have gone over the last number of years. That's something to consider. But I think overall, we feel good about the story.
Jason may be asking a different way if, What would be the one or two factors that we should be watching that could interrupt the momentum that you're seeing?
I mean, I don't think there's anything specific right now. I mean, I think the interest rate headwinds on refinancing, again, that's going to be a question for all REITs. That's in front of us. You can look at our maturities, which I think, Tony, do we just have one next year?
We do. We have one euro bond in April of 27.
Yeah, so it won't be overly substantial, but there's probably some leakage there. Then I think you just got to keep an eye on the big drivers of our growth, which tends to be deal volume, same store, and credit watch or credit loss, I should say. Those are three inputs that we provide guidance around and likely have the biggest impact on growth.
And I would say those are trending well for us. thank you very much good luck in the back half yeah thank you at this time i am not showing any further questions i'll hand the call back to mr sands thanks diego and thanks everyone for your interest in wp carry if anyone has additional questions please call investor relations directly on 212-492-1110 and that concludes today's call so may now disconnect