Operator
Hello, and welcome to WP Carey's second quarter 2025 earnings conference call. My name is Diego, and I will be your operator today. All lines have been placed on mute to prevent any background noise. Please note that today's event is being recorded. After today's prepared remarks, we will be taking questions via the phone line. Instructions on how to do so will be given at the appropriate time. I will now turn today's program over to Peter Sands, Head of Investor Relations. Mr. Sands, please go ahead.
Good morning, everyone, and thank you for joining us for our 2025 Second Quarter Earnings Call. Before we begin, I'd like to remind everyone that some of the statements made on this call are not historic facts and may be deemed forward-looking statements. Factors that could cause actual results to differ materially from WP Carey's expectations are provided in our SEC filing. An online replay of this conference call will be made available in the Investor Relations section of our website at wpcarey.com, where it'll be archived for approximately one year and where you can also find copies of our investor presentation and other related materials. And with that, I'll pass the call over to Jason Fox, Chief Executive Officer.
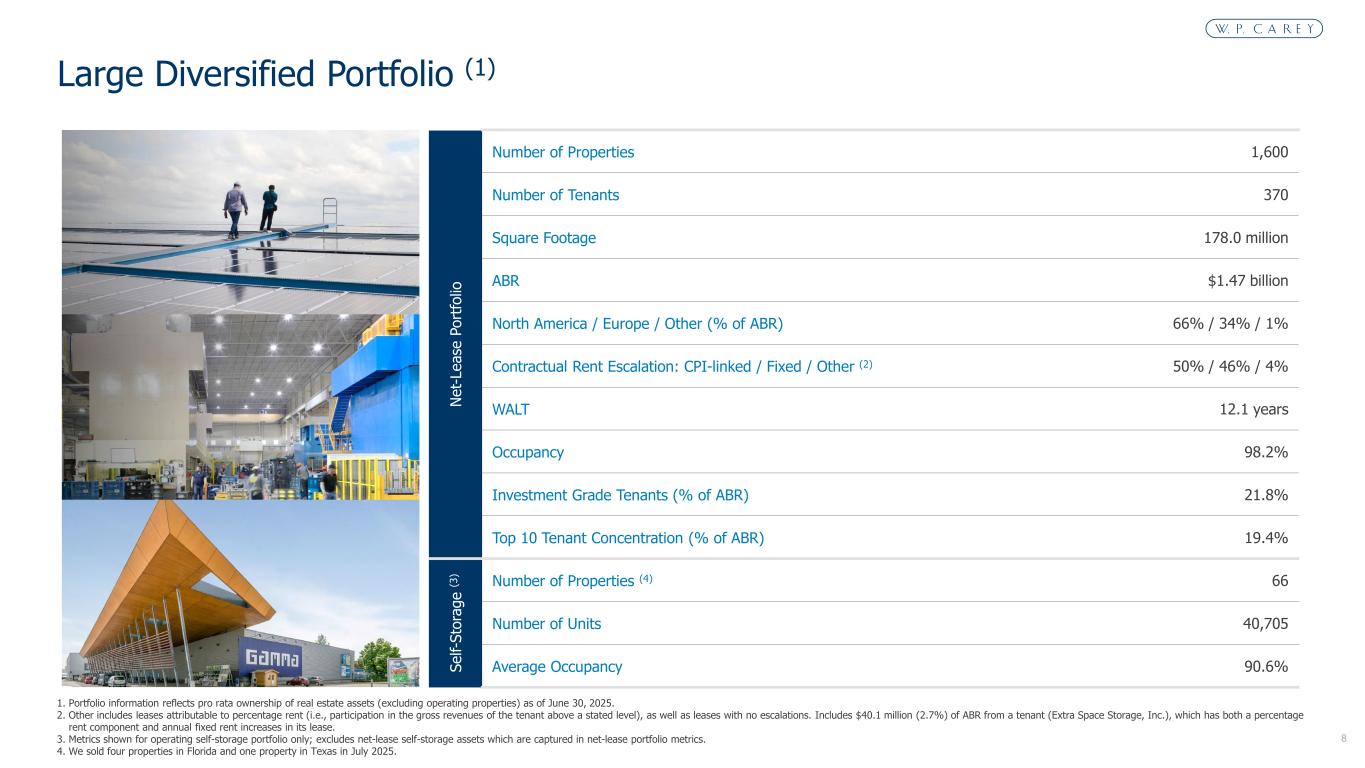
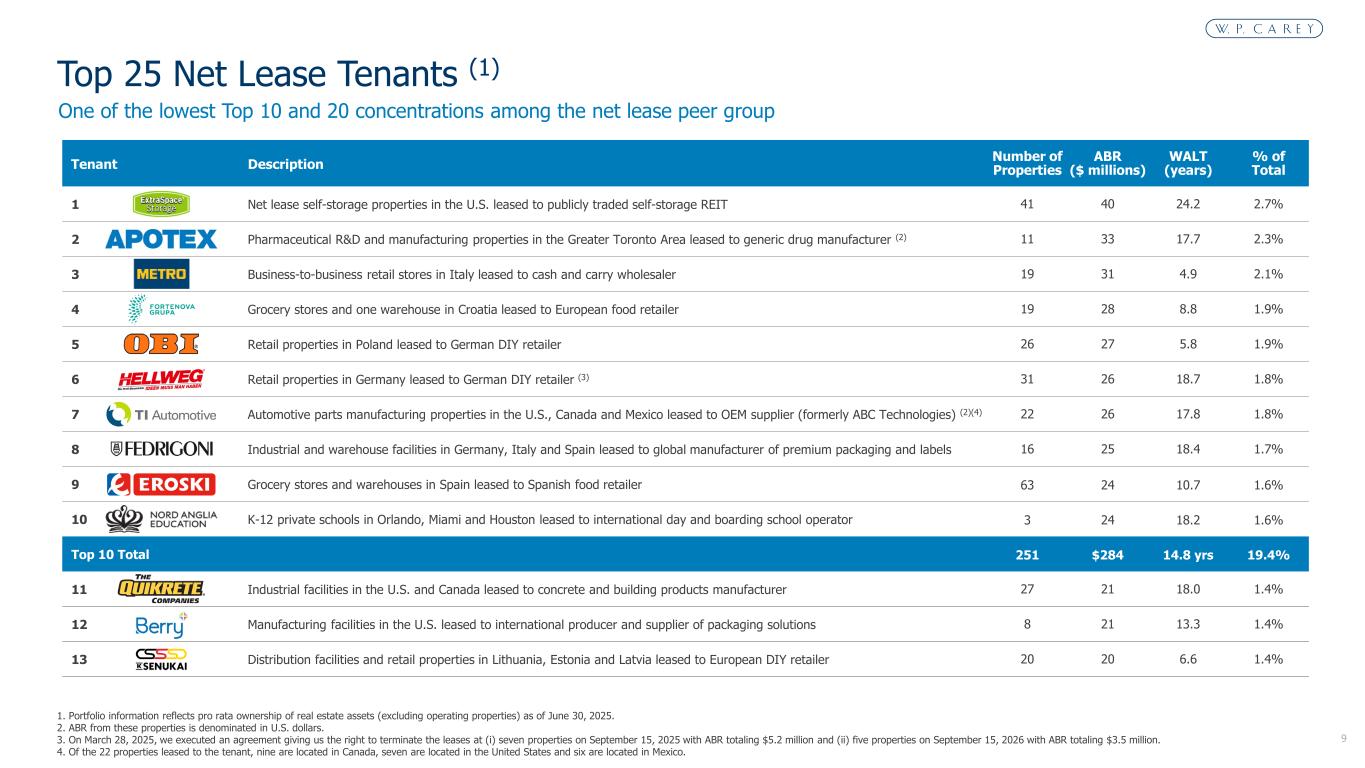
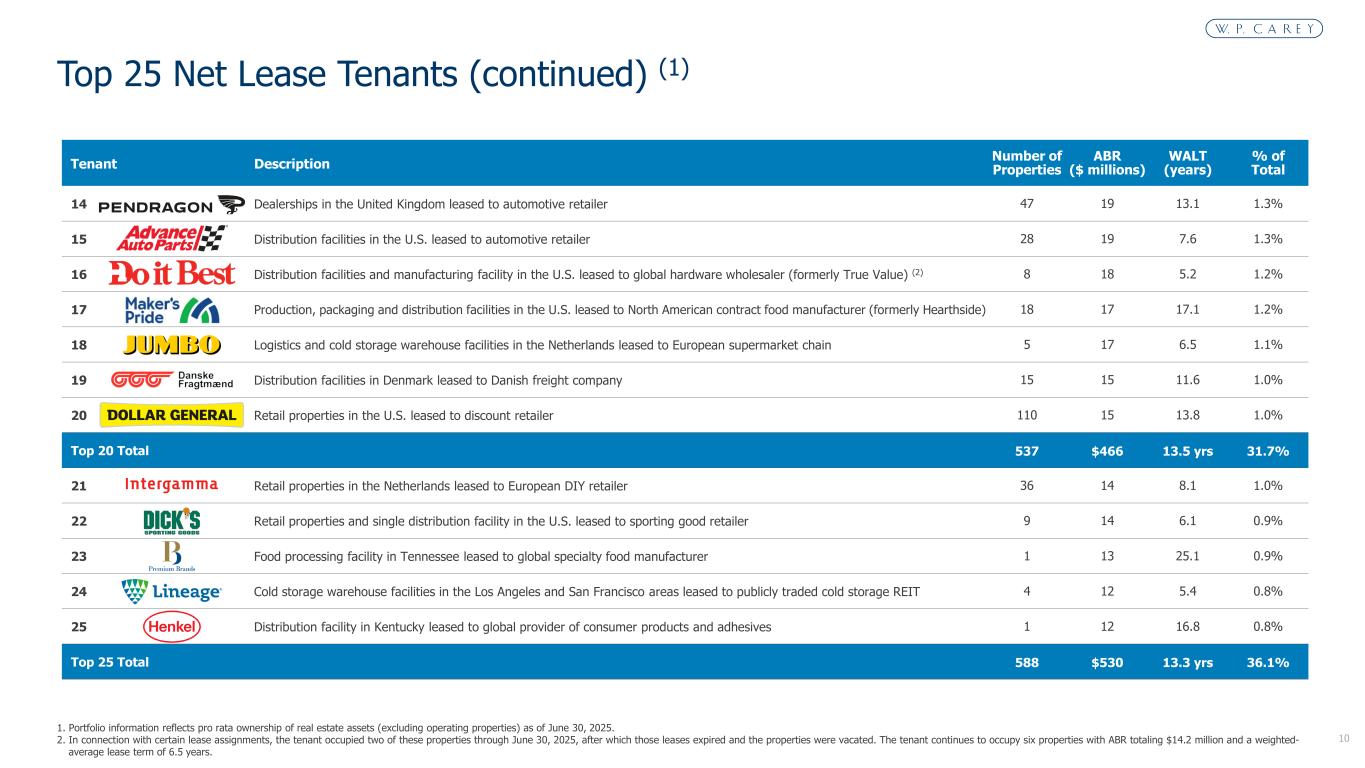
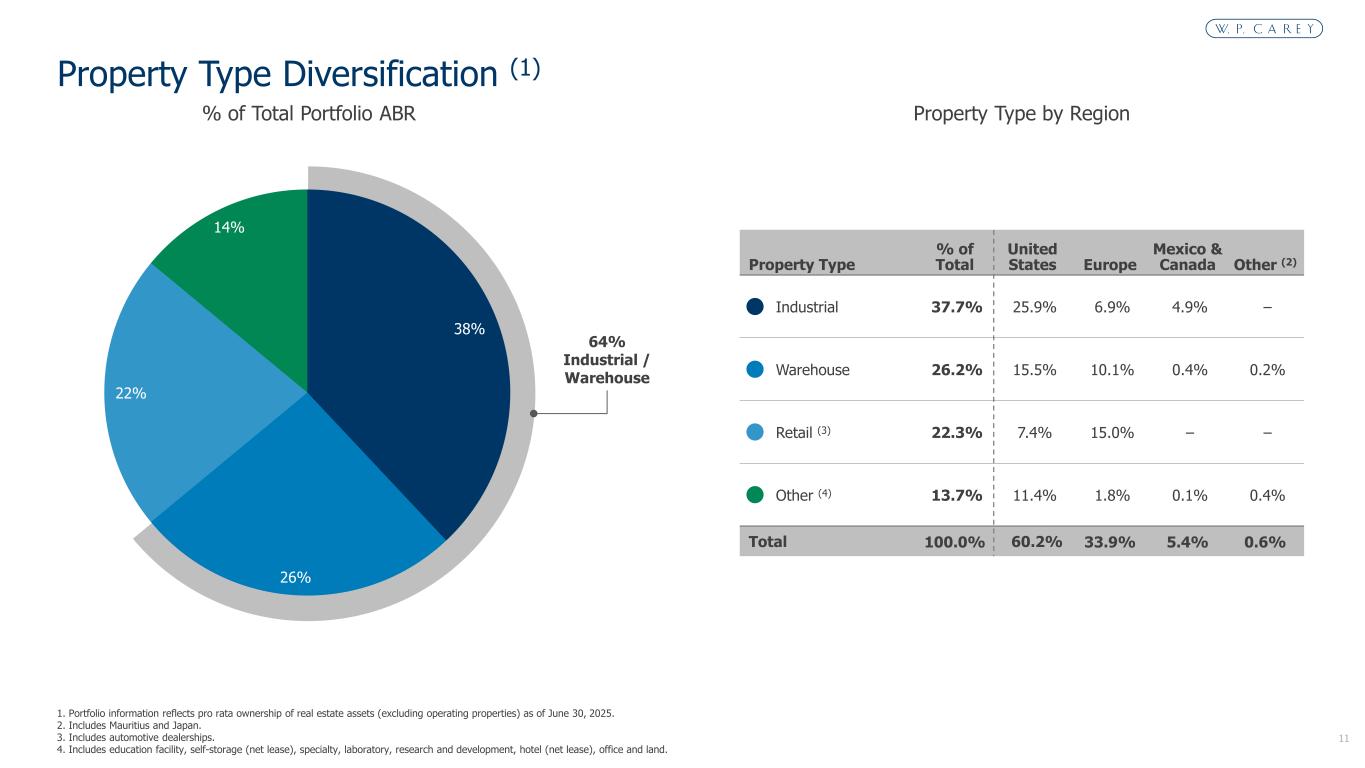
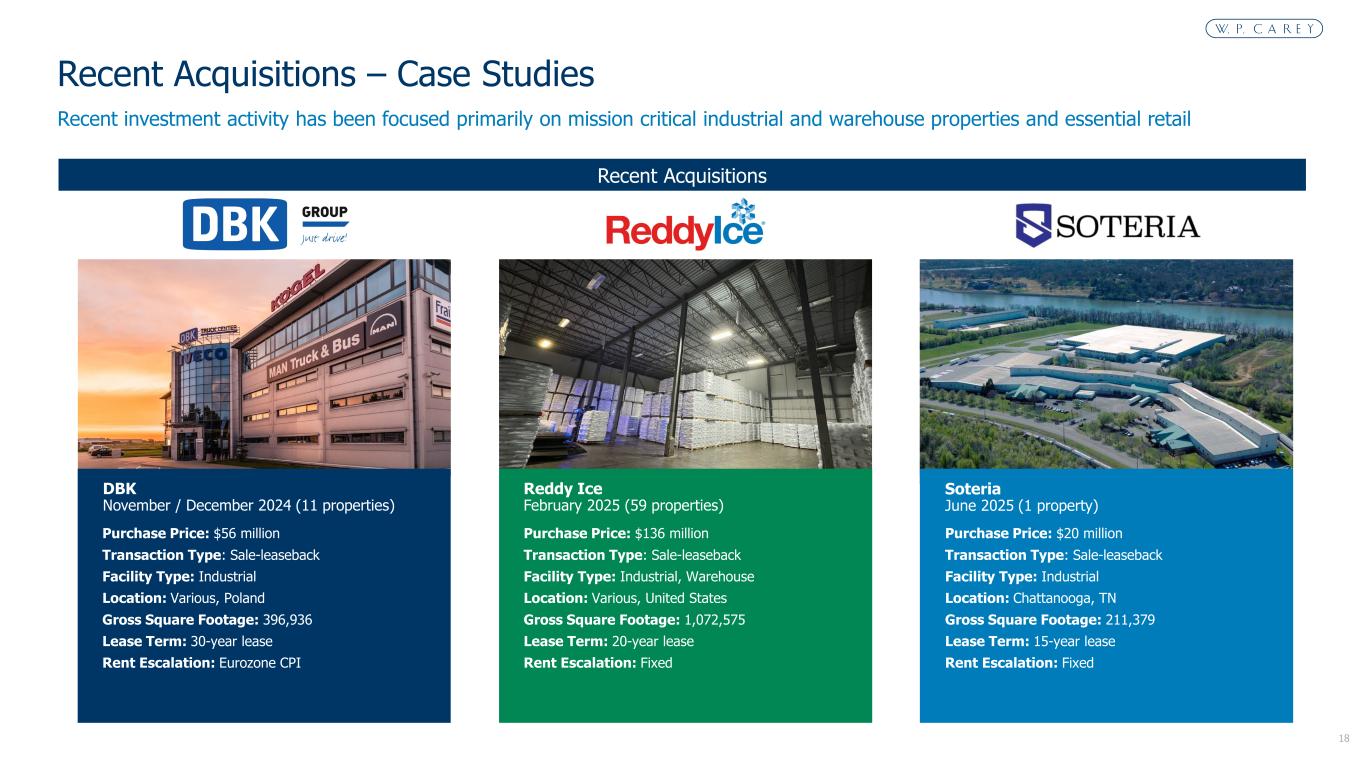
Thank you, Peter, and good morning, everyone. Our second quarter results highlight a very strong first half of the year, tracking ahead of our initial expectations on a variety of fronts. As a result, we're raising our outlook for full-year AFFO growth to 4.5% at the midpoint of our revised guidance range. To date, we've closed over $1 billion of new investments at initial cap rates averaging in the mid-7s, primarily with fixed rent escalations approaching 3%. We've made excellent progress with asset sales, including the first batch of self-storage operating properties, executed at attractive pricing, and a significant spread to where we're reinvesting the proceeds. While we haven't needed to access the capital markets this year to achieve our investment goals, earlier in July, we opportunistically issued bonds that enhanced our liquidity and further strengthened our balance sheet. While there's lingering uncertainty over the broader economy, to date, we've not experienced any unforeseen disruptions in our business, neither tenant credit events or tariffs. Accordingly, we're reducing our reserve for estimated potential rent loss. This morning, I'll review our progress over the first half of the year and our confidence in sustaining that momentum. Tony Sanzone, our CFO, will focus on our results and guidance raise, as well as touch upon aspects of our portfolio and balance sheet. Tony and I are joined by Brooks Gordon, our Head of Asset Management, to take questions. Starting with investments. Supported by favorable market conditions, we maintain strong investment volume throughout the first half of the year, building on the increased level of activity we achieved in the fourth quarter of 2024. Year-to-date, we've completed over $1 billion of investments, including the approximately $550 million of deals we closed during the second quarter. at an initial weighted average cap rate of 7.5 percent and a weighted average lease term of 19 years. Factoring in rent escalations over those long lease terms, that translates to an average yield in the mid-9 percent range, which we believe is one of the highest average yields in the net lease sector and one that provides a very attractive spread to our cost of capital. We've already closed about $230 million of investments in the third quarter, and our pipeline remains strong, several hundred million dollars of deals at advanced stages, some of which we expect to close in the next few weeks. So at just over the halfway point in the year, we've surpassed our initial expectations and are therefore raising our investment guidance, which Tony will review in detail. Looking ahead, we believe there's still potential to be towards the top end of the new range if the transaction environment remains favorable in the second half of the year, and we have a strong fourth quarter for deal closings, as is often the case we've also continued to build out our pipeline of capital projects which includes build-a-suits expansions and redevelopments areas of investment where we have always been relatively active currently we have nearly 300 million dollars of projects underway and scheduled for completion over the next 18 months or so which add to our pipeline and help support future growth in terms of property type virtually all of our second quarter investments were warehouse and industrial, which also represent the vast majority of our investments year-to-date, as well as the bulk of our pipeline. The strength of our internal growth continues to be supported not only by inflation-linked rent escalations, but also by our ability to structure leases with attractive fixed rent bumps, which have averaged 2.8% on our investments year-to-date. Geographically, our second quarter investments were concentrated in the U.S., where we continue to identify and evaluate many compelling opportunities, especially in industrial. Investment spreads have generally remained wider in Europe, which represents the bulk of the deal volume we've completed so far in the third quarter, as well as a significant portion of our near-term pipeline. But our expectation is to continue to see and close attractively priced and structured deals in both regions over the remainder of the year. Turning to our sources of capital. In parallel with our first half investments, we've also made good progress with our funding strategy, which we outlined at the start of the year and is centered on accretive sales of non-core assets. We recently sold an initial tranche of 15 self-storage operating properties for $175 million, executed at a sub-6% cap rate. 10 properties closed during the second quarter for $112 million, with the remaining sales completed in July. Currently, we have two additional storage portfolios totaling 17 properties under contract, with closings expected in August, keeping us on track with our initial projections for storage sales this year and ahead of our original expectations on disposition cap rates. We remain confident that this year we'll achieve well over 100 basis points of spread between our overall asset sales and our new investments, with the potential to be closer to 150 basis points by the end of the year. In line with higher anticipated investment volume, we're also raising our expectations for full-year dispositions, which could include additional tranches of storage assets. Even if investment volume exceeds the upper end of our guidance range, we're confident we can fund it with dispositions that generate strong accretion and AFFO growth. While we believe we're generating attractive spreads to our spot cost of capital, which we're keeping in mind when we evaluate new deals. The spreads we're generating are particularly attractive when we factor in the average yields over the life of the leases, and when considering our actual source of funding, which is non-core dispositions at tight cap rates. Turning now to our portfolio. Amid in an environment of broader economic uncertainty, we started the year with an appropriately conservative view on the potential for credit events within our portfolio. Seven months into the year, we're lowering our estimate of potential rent loss by $5 million. Part of what's left in our rent reserve reflects ongoing caution towards Helvig, which remains current on rent but is still navigating its turnaround plan. We've made good progress with our strategy of retenanting and selling Helvig stores, further reducing our exposure, and keeping us on track to move it out of our top 10 tenants this year and out of our top 25 next year. While there has been some recent progress on U.S. trade policy, especially with Europe, many issues remain unresolved. We continue to see no direct impacts in our portfolio, however, and we're confident that our rent reserve can cover any potential impacts over the second half of the year. That said, we'll continue to monitor for further developments. With that, I'll pause and hand the call over to Tony to discuss our results and guidance.
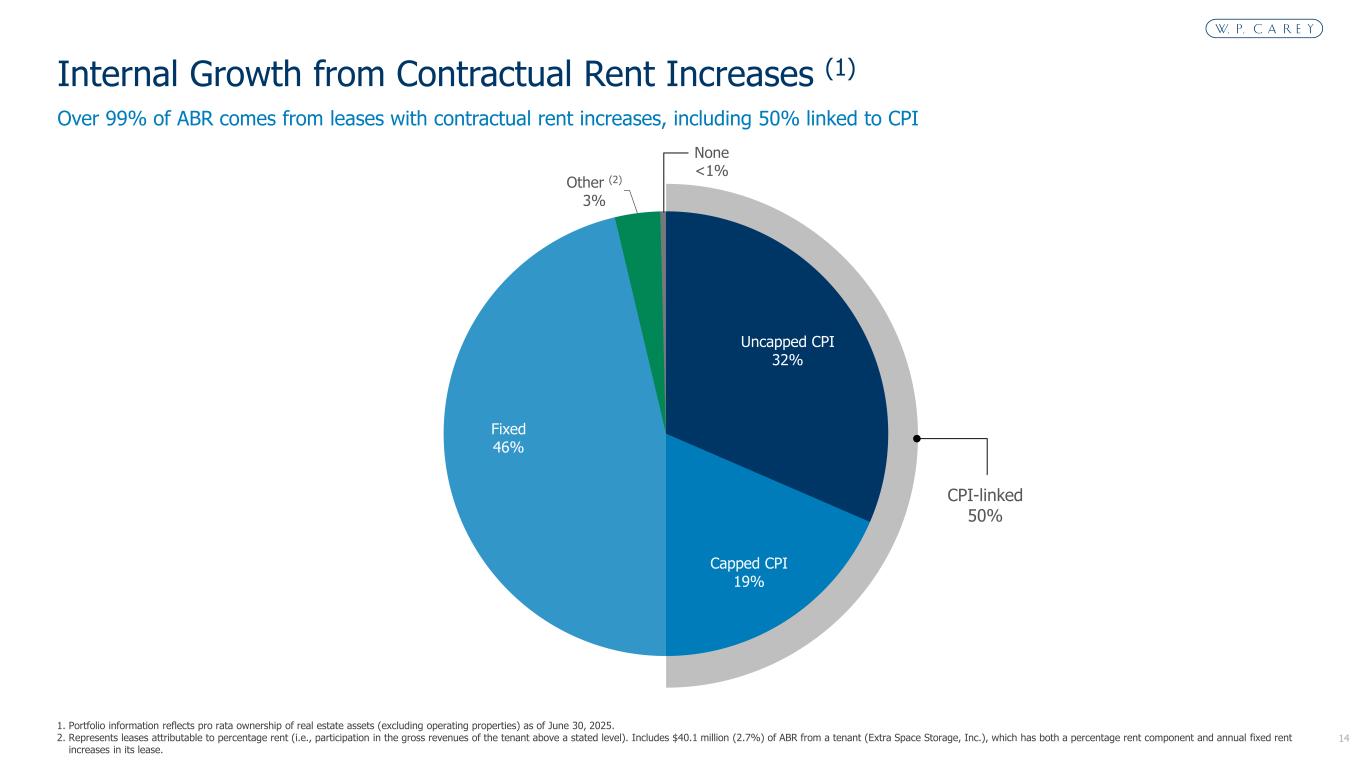
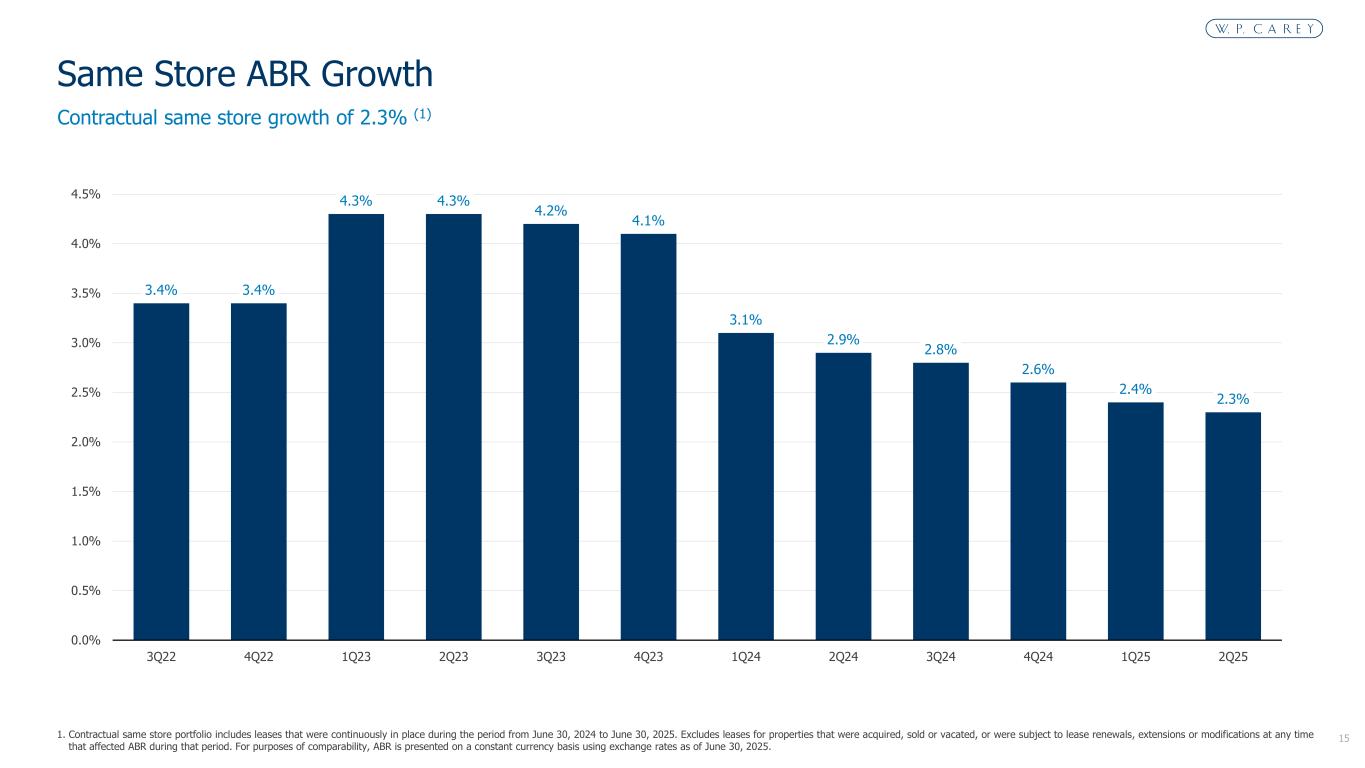
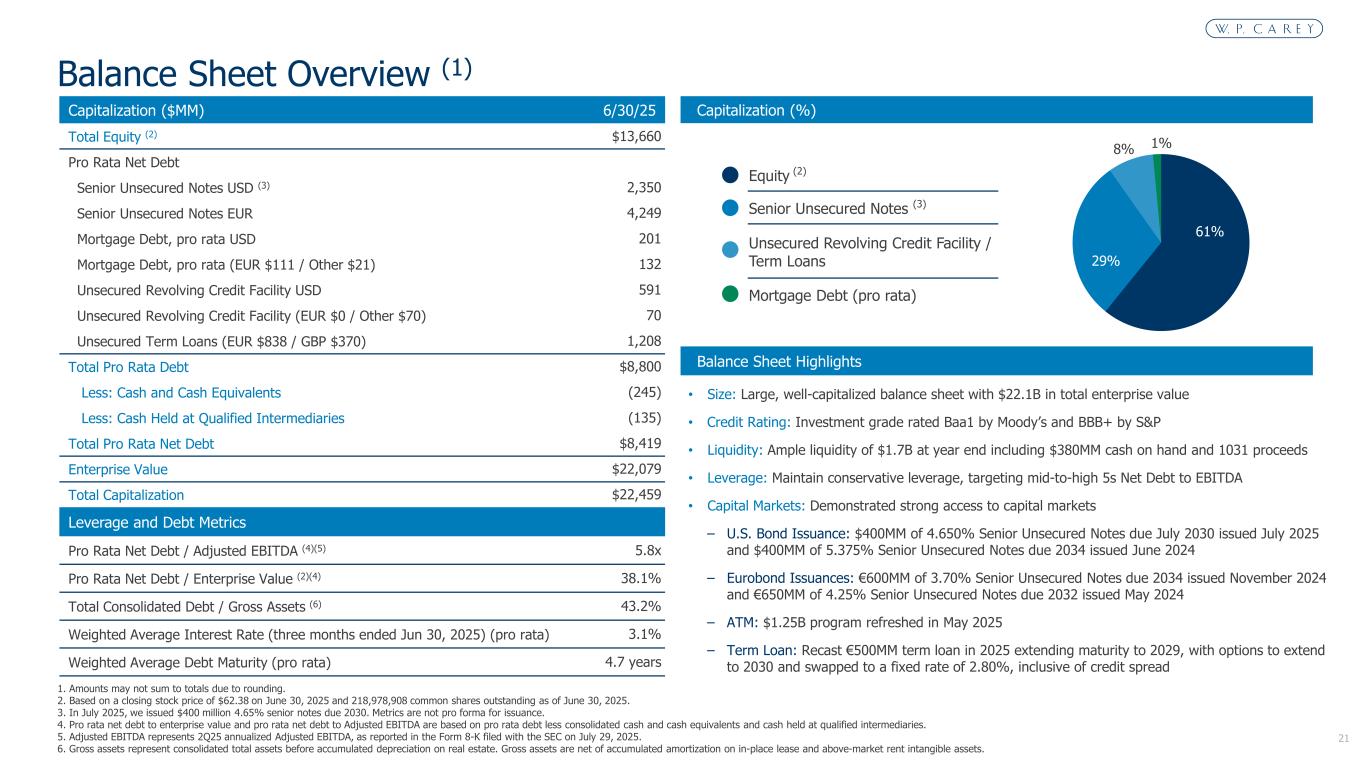
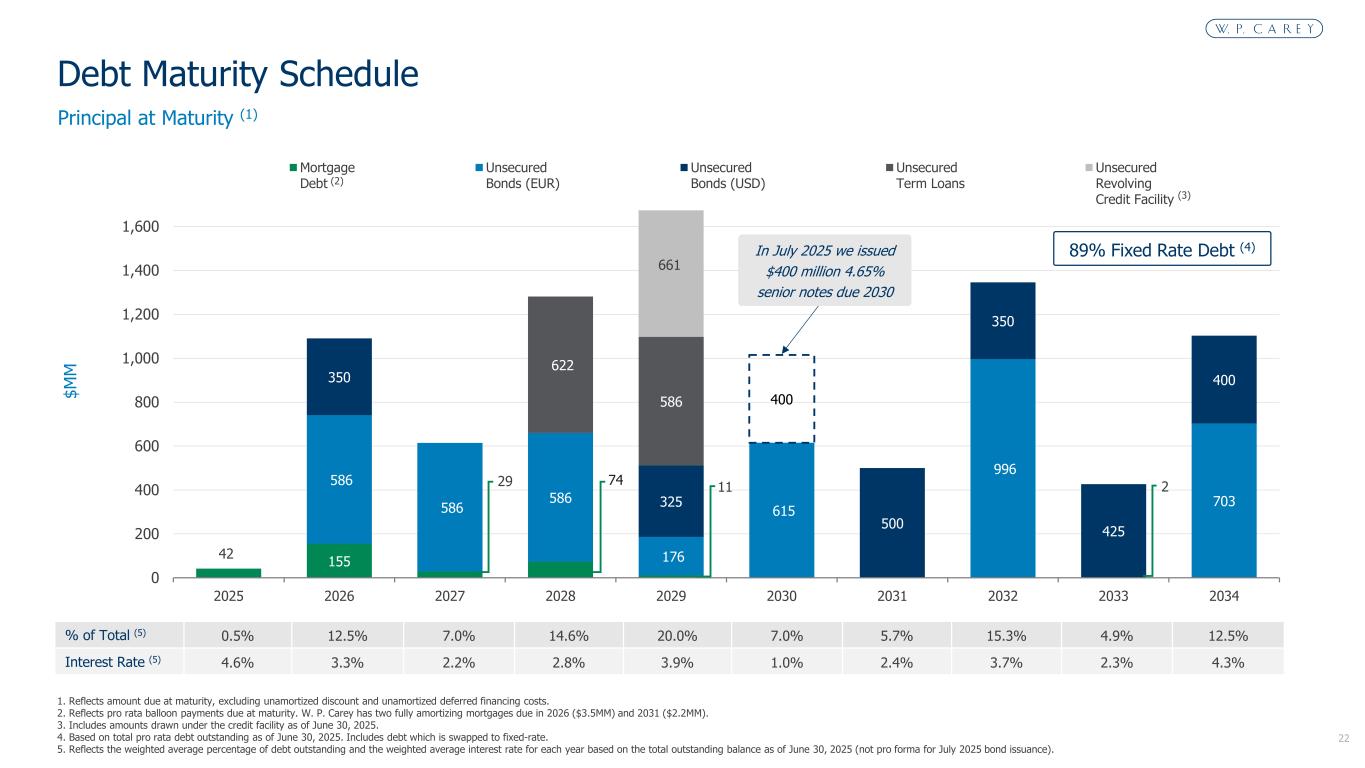
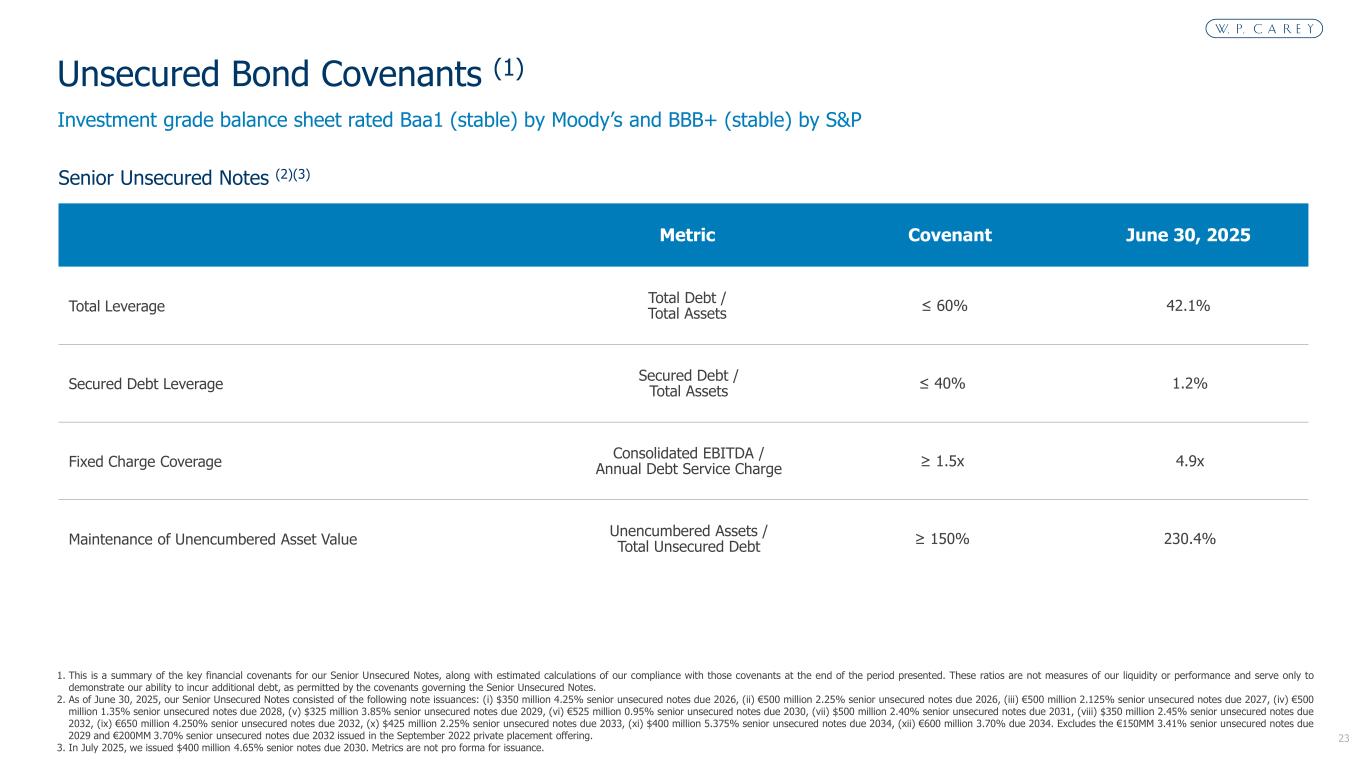
Thanks, Jason. Starting with earnings, AFFO per share was $1.28 for the second quarter, which represents an 11-cent or 9.4% increase compared to the second quarter of last year, driven by accretive investment activity along with our sector-leading rent growth. As compared to the first quarter, the increase in AFFO per share was also primarily the result of net investment activity and rent escalations, as well as certain timing impacts, such as higher expenses in the first quarter, and higher other lease-related income in the second quarter. Given our strong first-half results and visibility into the second half of the year, we have raised our full-year AFFO guidance range to between $4.87 and $4.95 per share, which implies 4.5% year-over-year growth at the midpoint. As outlined in our earnings release, our revised outlook is based on higher expected investment volume of $1.4 to $1.8 billion, mostly funded by higher expected dispositions of $900 million to $1.3 billion. As Jason discussed, we continue to expect to fund our investments accretively with proceeds from dispositions of operating and non-core assets, generating spreads averaging well over 100 basis points. Contractual same-store rent growth for the second quarter was 2.3% year-over-year, comprised of CPI-linked rent escalations averaging 2.6% for the quarter, while fixed rent increases average 2.1%. For the full year, we expect contractual same-store rent growth to average in the mid-2% range, which is also in line with our longer-term expectations, assuming inflation remains around current levels. Comprehensive same-store rent growth for the quarter was 4% year-over-year, reflecting the impact of rent collections, including the recovery of some past due rent this quarter, as well as leasing activity and vacancies. Historically, our comprehensive same-store growth has typically tracked around 100 basis points below contractual. However, based on our current estimates, we expect it to track in line to slightly higher than contractual for the full year. Our portfolio continues to perform well with no significant new tenant credit events during the quarter. Therefore, we've lowered the potential rent loss assumption embedded in our AFFO guidance to between $10 and $15 million, down from our previous estimate of $15 to $20 million. Within that range, we currently have visibility into identified rent loss of about $4 to $5 million, or one-third at the current midpoint, which includes downtime on the Helvig stores we're taking back. We continue to believe the balance of our rent loss assumption should conservatively cover any incremental tenant issues over the back half of the year. Other lease-related income totaled $9.6 million for the second quarter, bringing the total for the first half to $12.8 million. While the timing of these payments can vary from quarter to quarter, we continue to expect other lease-related income to total between $20 and $25 million for the full year, which is unchanged from our prior estimate. Turning briefly to our operating properties. Taking into account the self-storage properties we sold during the second quarter, plus those already sold or expected to be sold in the third quarter, we estimate that our operating property NOI for 2025 will fall between $55 and $60 million, including the four hotel and two student housing properties in our portfolio. Given the possibility of additional operating asset sales this year, we'll continue to update that estimate as needed. Moving to expenses and non-operating income. At the halfway point of the year, we've refined our guidance assumptions for expenses slightly lowering our expectations for G&A expense, which we anticipate will fall between $99 and $102 million for the full year. As mentioned on our last call, G&A tends to run higher in the first quarter due to timing, with the second quarter reflecting more of a run rate for the remainder of the year. Non-reimbursed property expenses are expected to total between $50 and $54 million for the full year, with the remaining quarters anticipated to be in line with the second quarter. Tax expense on an AFFO basis, which primarily reflects foreign taxes on our European assets, is now expected to fall between $42 million and $46 million for the full year. Our expectations for both non-reimbursed property expenses and income tax expense have marginally increased due in part to the stronger euro. Non-operating income is expected to total around $20 million for the full year, primarily comprised of the quarterly dividend we receive on our equity stake and lineage, which total $2.8 million for the quarter, and is assumed to remain at that level for the remainder of the year. Foreign currency hedging gains are expected to be negligible for the remainder of the year, given the strengthening of the euro relative to the U.S. dollar. As a reminder, despite lower realized FX hedging gains and marginally higher expenses, a stronger euro positively impacts our European cash flows, and therefore AFFO, with the benefit primarily flowing through as higher lease revenue. Moving now to our balance sheet. We continue to proactively manage our balance sheet, leaving us well-positioned with ample liquidity and very manageable near-term debt maturities. Earlier in July, we opportunistically issued $400 million of five-year U.S. bonds, achieving excellent execution, pricing at a coupon rate of 4.65%. Our overall weighted average cost of debt remains low at 3.1% and is expected to stay around that level for the remainder of the year. We ended the second quarter with liquidity totaling about $1.7 billion, comprised primarily of the availability on our credit facility. At quarter end, we were about $660 million drawn on our revolver, and early in July, we used the proceeds from our bond offering to partially pay that down, giving us additional flexibility as we execute on new investments over the remainder of the year. We have less than $50 million of mortgage debt maturing over the remainder of 2025, and our next bond maturity is not until April 2026, leaving us a substantial amount of flexibility in how and when we access the capital markets. We ended the quarter with our key leverage metrics within our target ranges, with debt-to-growth assets at 43.2% and net debt-to-adjusted EBITDA at 5.8 times. We continue to expect both of these leverage metrics to remain within our target ranges. Lastly, we continue to grow our dividend. During the second quarter, we declared a dividend of $0.90 per share, or $3.60 annualized, representing a 3.4% increase over the prior year. Our dividend is well supported by our earnings growth, with our year-to-date payout ratio at approximately 73% of AFFO per share. And with that, I'll hand the call back to Jason.
Thanks, Tony. As we pass the midpoint of the year, we're pleased with the momentum we've built across our business. Our investment activity and pipeline remain strong, and we're on track with our funding strategy, achieving very good results and dispositions and reinvesting the proceeds at compelling spreads. Disciplined execution combined with stable tenant credit and no discernible tariff-related impacts positions us very well for the second half of the year, and we continue to see a path to the high end of our revised guidance ranges for both investments and earnings. Our updated AFFO guidance reflects growth that's a meaningful step up from recent years. Combined with a well-covered dividend yield that's remained in the mid to high 5% range, we believe we're well on our way to delivering a double-digit total shareholder return for 2025. Furthermore, we're confident that the foundation we've built this year positions us well to maintain that level of growth in the coming years and deliver long-term value creation for our shareholders. As that concludes our prepared remarks, I'll hand the call back to the operator for questions.
Operator
Thank you. At this time, we will take questions. If you would like to ask a question, simply press star, then the number one on your telephone keypad. If you would like to withdraw your question, press the star, then the number two. Our first question comes from John Kim with BMO Capital Markets. Please state your question.
For the second straight quarter, your comprehensive income was pretty meaningfully above contractual. And Tony, you reminded us that typically it's 100 basis points below. So for the second half of the year, do you expect it to be back to that historical level, 100 basis points below, or will it be lower, just given the outperformance this year?
Thanks, John. Anya, I would say if you look at it on a full year basis, we are expecting that to normalize a bit in the back half of the year. And there's a couple of things behind that. First, if you think about how we've described our rent loss reserve, we've got about $12.5 million at the midpoint in the revised range. And that assumption, right now we haven't had any real disruption in the first half of the year. So our guidance assumption on comprehensive same store, I'll assume that the $12.5 million is taken in the third and fourth quarters. that could prove conservative and we could outperform that. So that's something that we're monitoring as well. And then I would just note that maybe the first half of the year was also impacted by some of the tailwinds associated with some of the headwinds we had in the portfolio last year. So, you know, it's a little uneven in the first half to the second half, but there could be some upside relative to the full year estimate that I described, which would track probably just
north of the contractual in the mid-2% range. Okay, and my second question is on your self-storage operating portfolio. You provided a bit of an update on the income, but I was wondering, you've sold the first tranche, you transitioned some assets, do you expect to transition more to the triple net lease structure? And then as far as the buyer of the first tranche, I mean, reportedly it's not an operator of those assets, and I'm wondering if a buyer can come in and cancel a third-party management contract?
Yeah, sure. So in terms of the first question, we have kind of lots of flexibility on what we do with the remaining portion of our operating self-storage portfolio. You noted last year we did take a sub-portfolio and put it under a net lease with extra space, and that's always been the goal for some portion of the portfolio. We thought the timing was right. And then this year, obviously, we're clearly selling a substantial portion of it, And we think that's the best way to fund new investments. So kind of looking forward, you know, what we do with, you know, the rest of the portfolio will, you know, that'll depend on deal volume for the second half of the year and the next year, what our capital needs are, what our other funding options are. But, you know, I would expect that we could lean into some more sales in the second half of the year since execution has been strong. But I also think that we could, you know, convert some portion of it to net lease as well. And, you know, it's likely going to be a combination of the two. So either way, you know, I think that probably by this time next year, we're out of the operating storage business. But we have some options between what we do between now and then. And in terms of the portfolio that we did sell, yeah, I think the way those contracts work, the management agreements, they're typically cancelable upon 30 days notice. So there's not a lot of, you know, hurdles you have to overcome when you're selling assets to a different operator.
Operator
That's great. Thank you. Yep. Welcome.
Operator
Your next question comes from Greg McGinnis with Scotiabank. Please state your question.
Hey, good morning. Tony, I'm just trying to better understand on the AFFO guidance. It seems to imply back half-quarter results falling from where we were in Q2. Now, aside from the lower lease termination income and, I guess, a potential highway credit event, are there any other headwinds that have been anticipated?
I'm not sure what the issue is, but on the back of the laptop, you can take a paper clip and reset the power.
There's like a little pin on the left side I can show you. Are you able to mute that person? I'm not sure if that's – yep, sorry. See you soon.
Yeah, so, Greg, I'll just maybe highlight. you reiterated really the two points that I think are worth thinking about as we get into the second half. So when you look at the second quarter relative to the outlook for the remainder of the year, the other lease-related income is probably the biggest driver in terms of second quarter being elevated. You know, maybe worth noting, we didn't update our full year guidance on that. This is really just more of a timing, and it is, you know, these types of payments don't lend themselves really to a run rate from one quarter to the next. But if you really take the balance of our full year guidance over the back half of the year, that would normalize out about three cents in each of the third and fourth quarters. And then on the rent reserve side, as I mentioned on the comprehensive income question, you know, the 12 and a half million reserve is assumed to all be taken in the third and fourth quarter. So you got another roughly three cents in each of those quarters as well. So, you know, I think those are really the anomalies from there. We do expect to grow our AFFO. There's certainly a path where we could see outperformance relative to the not needing the full rent contingency that we've discussed. And, you know, again, as we continue to see the pipeline investments grow, that growth is going to continue to play through the third and fourth quarters as well.
Okay. Thank you. That's really helpful. Jason, I was hoping you'd touch on, you know, some of the acquisitions that you guys do are not necessarily brand names that we're all familiar with. In terms of the credit of the tenants that you're doing sale leasebacks with or financing expansions for, whatever it happens to be. How are you getting comfortable with those transactions and the credit quality considering some of the troubles that have happened over the last year with certain tenants?
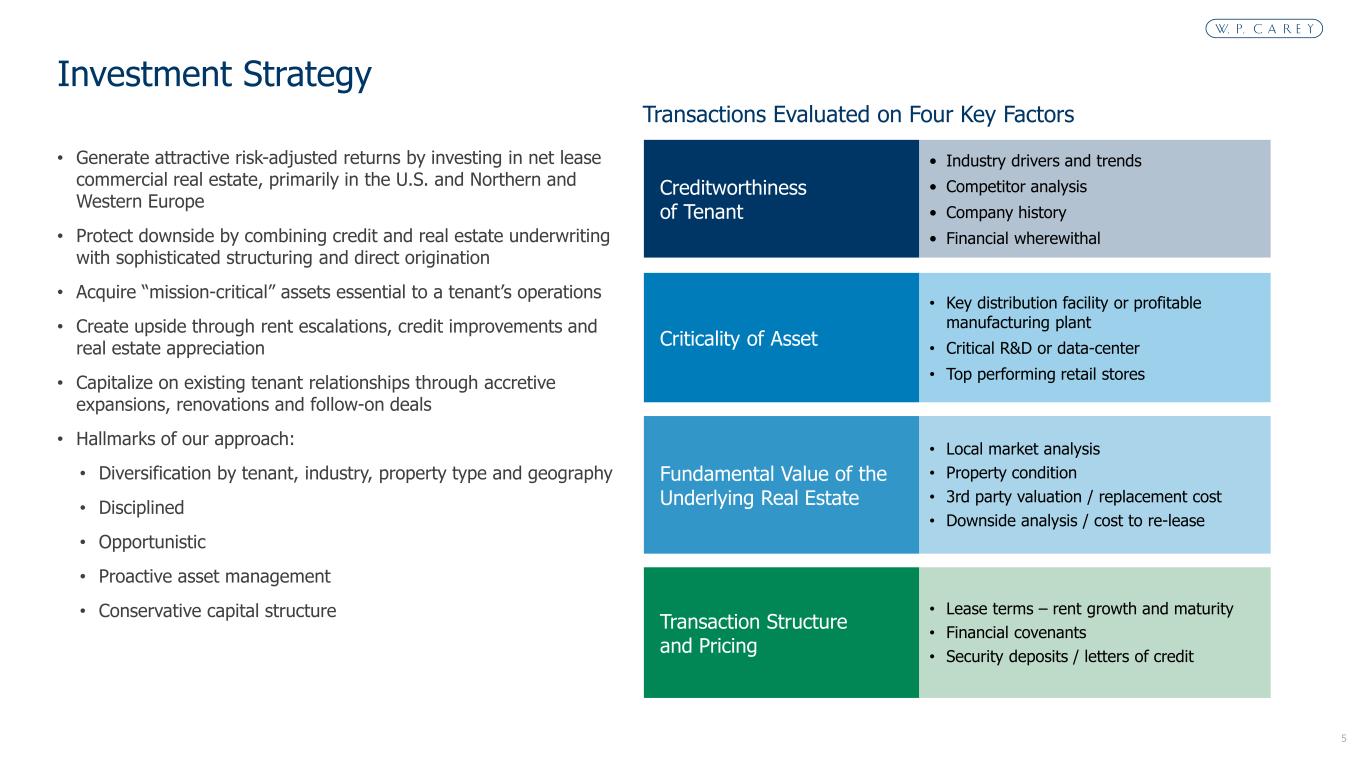
Yeah, sure. I mean, we've always targeted sub-investment grade tenants. We think that's the sweet spot in net lease investing, and we typically focus on large companies with operationally critical real estate. So, you know, nothing new there. You know, really our approach hasn't changed a lot. We focus on value, the criticality, tenant credit underwriting. It's something that we're good at. We've done that for a long time. We think we can underwrite and structure around risk really well, and that's part of the model. So it's really a range of credits. But I think one of the themes that we've talked about before, while it's just below investment grade, I think the large companies do make a big difference.
And is there something happening now that's bringing more of these companies to market, or are you just doing more deals now that you have the capacity to do so?
Yeah, I mean, look, the market, you know, feels quite strong and constructive right now. There are lots of opportunities. I think some of this is driven by what feels like a relatively stable interest rate environment. It's probably been the case now for several quarters, which is always a key ingredient in, you know, kind of the increase in transaction activity. So that's despite changing expectations throughout the year around tariffs. If you look at Treasury yields, they've been mostly range-bound in the low to mid-fours for most of this year, even dating back to the fourth quarter of last year. So that creates stability. I think you see transaction activity increase. Bit-ask spreads have come in, and we're taking advantage of that. I think we've had a really strong first half of the year. We're tracking ahead of our initial expectations and a good, healthy pipeline. So I think some of it's market-driven, but a lot of it is who we are as a company. We've been doing this for a long time. We have a lot of relationships in an environment where maybe there's stability, but there's still this overlaying uncertainty. I think execution really comes into play, and we're going to fare quite well if we're competing on deals. Execution is a strength of ours. So I think it's really a combination of all of those things, but generally it's a good environment right now for us. Great. Thank you.
Operator
And your next question comes from John Kilachowski with Wells Fargo. Please state your question.
Good morning. In your initial remarks, you touched on it, but, you know, we've had a lot in the news flow recently around our conversations between the U.S. and the EU on trade discussions and I know in our last quarter's earnings, you know, you mentioned that there really hasn't been an impact to your numbers. It sounded like more of the same here. I'm curious if you've spoken to your operators and if they've started to give any sort of opinion on what they're hearing out of the government and if they think it'll affect their business at all, or if maybe there's some tailwinds that we're not considering.
Yeah, I mean, look, I think uncertainty is still an underlying theme. But to date, yeah, we don't think there's been much of an impact that it flowed through to the economy, I think, generally. I mean, tariffs have been a big part of the news, but, you know, they really haven't been implemented. And certainly with, you know, the way companies have been trying to get ahead on inventories, it hasn't really flowed through the economy at this point in time. And that's similar with our portfolio. We haven't seen impacts. We haven't seen a lot of, you know, commentary from our tenants. And it really hasn't impacted investment activity as well. And I think there's probably reasons to think that, you know, given the more moderate nature kind of the tariffs that are being discussed right now, why, you know, there wouldn't be, you know, big impacts, at least on us and our tenants' abilities to pay rent going forward. But, you know, certainly it's something that we keep, you know, monitoring and, you know, we'll see where everything lands.
Got it. And then maybe on the opportunity set, it sounded like you highlighted in the opening remarks that Europe was providing better spreads. I'm curious just what's the primary drivers of that.
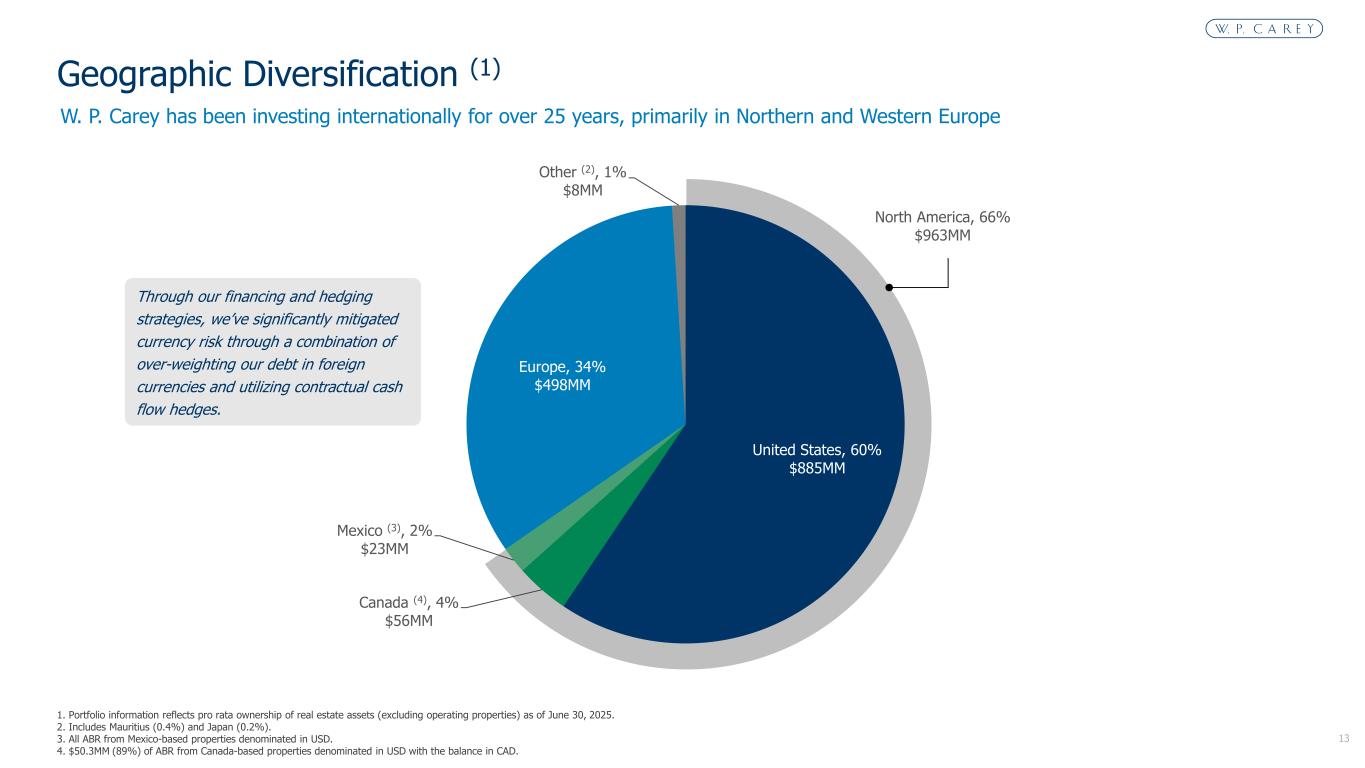
In terms of better spreads, well, I mean, the biggest driver is, you know, the cost to borrow in Europe. You know, we can borrow probably 125 to 150 basis points inside of where we could issue U.S. bonds. Yet cap rates are in the similar zip code, maybe a little bit tighter depending on the country. And in Europe, the cap rates kind of range fairly widely given the different markets. But that's the biggest driver is our ability to, you know, to borrow cheaper in euros than we can in U.S. dollars. And, you know, we've talked about this before, but we think that is something that is sometimes overlooked or at least underappreciated in our model, that we do have a access to, you know, very cheap capital in Europe.
Operator
Got it. Thank you.
Operator
Your next question comes from Michael Goldsmith with UBS. Please state your question.
Good morning. Thanks a lot for taking my question. First question is just about the opportunities. Sticking with the topic of Europe, what's the opportunity set you're seeing in Europe and the U.S.? You talked a little bit on spreads and cap rates, but just during the quarter, there was predominantly acquisitions in the U.S. relative to Europe. And so just trying to get a sense of how the opportunity set looks maybe going forward And was that kind of timing related where you were a little bit more U.S. than Europe?
Yeah, I mean, look, we've been seeing really good opportunities in Europe, especially in the industrial sector and especially through sale leasebacks. As you noted, or as I talked about earlier, you know, called three quarters of our deals year to date have been in North America. The pipeline is shaping up a little differently. I would say right now, looking forward, it's probably 50-50 split between North America and Europe. So we're starting to see more activity. You know, our pipeline is, you know, within Europe. You know, the deals tend to take a little longer to close there. So maybe we have, you know, a little less visibility into the timing there. But it's picking up there, and I would expect the second half of the year to be more active over there. You know, maybe we end up, you know, something that's closer to two-thirds, one-third, split between the two. But it'll vary quarter to quarter for sure.
Thanks for that, Jason. And as a follow-up, maybe similar question, but on the retail versus industrial split, clearly a lot of industrial being done in the pipeline, but also, right, like at the beginning of the year, you talked a little bit more about – you talked about how you wanted to do more in the retail space. So is that timing related? Is that, you know, the opportunities or is there, you know, any sort of change of strategy? Just trying to get a sense of preference between industrial and retail because it did seem pretty industrial heavy in the quarter.
Yeah, no change in strategy. We want to continue to build and ramp up our retail vertical and, you know, we'll continue to be opportunistic there. But, yeah, but year to date, we're finding better risk adjusted returns in the industrial sector. You know, look, the U.S. retail, this is something we've always characterized it as being more competitive and, you know, pricing is a little bit tighter there. Maybe less so the going in cap rates, but more when you factor in the bumps and kind of the total return on U.S. retail. You know, it's a little bit tighter than maybe we think it should be. So, yeah, so it's been more industrial, less retail. I think the second half of the year we'll see, you know, us get some retail done. But, look, I think it's okay if we're lighter on retail for points in time. It highlights the value of our platform and the benefits of a diversified model where we can allocate capital to the best opportunities across, you know, a wide range of property types, you know, and geography. So, more to come there, but I think we'll see more as the second half, you know, goes along.
Operator
Thank you very much. Good luck in the back half. Thank you.
Operator
Our next question comes from Smedis Rose with Citi. Please hit your question.
Hi, thank you. I just wanted to ask you a little bit more about the increased outlook for acquisition volume in the back half of the year, and it sounds like you're seeing a lot more attractive opportunities. And so could you just maybe talk about what you're seeing on the competitive side or kind of maybe what's just sort of being, what's driving the incremental opportunities for
Yeah, it's really market conditions that are driving the opportunities. If you think about over the past couple of years, there's been less activity and maybe characterized it as pent-up sellers looking for kind of a stable transaction market to get better execution. And I think that's what we've been seeing. I mentioned earlier a lot of that's driven by, you know, the kind of being range-bound with treasuries, at least in the U.S. You know, competition, I think, in the U.S., you know, that's always been a competitive market, less so in our, you know, where we've historically targeted, which is industrial sale leasebacks, a little more so, as I just mentioned, in retail. But it's all manageable. It's been, it's always been competitive. And, you know, we continue to find ways to compete there. So I would say it's more, you know, driven by kind of overall market conditions.
Okay. And then I just wanted to ask you, so it sounds like the HALWIG, which is kind of in line with your revised expectations, and then you took down the rent loss expectations for the year for a little bit. I mean, any other sort of changes on your watch list of tenants that are maybe coming in better relative to your expectations or things that you could highlight?
Brooks, you want to take that?
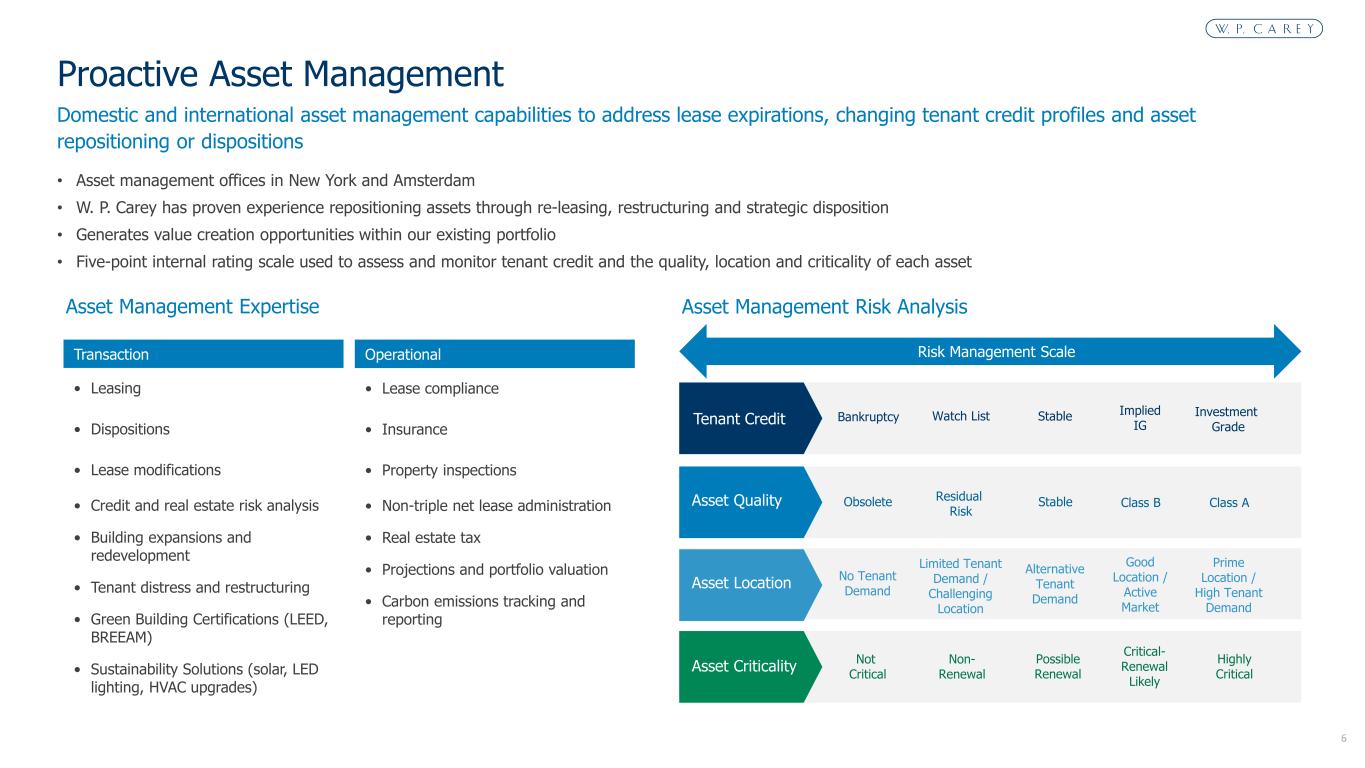
Sure. Yeah, I mean, credit quality has improved substantially. I mean, True Value and Hearthside were the only other two tenants of any large size on the watch list in addition to Hellwigs. So those have been resolved with very little impact. We've had a handful of other smaller tenants, you know, complete refinancing, and we've moved them off the watch list. So, you know, credit quality is in a solid place right now. You know, that said, you know, we have a degree of caution around an uncertain world right now, especially around tariffs and trade. Also, Hellwigs' turnaround, like we discussed. You know, so we have that 10 to 15 million reserve that we've described, you know, that may prove conservative, but that's kind of the perspective we're taking right now.
Operator
Thank you. I appreciate it.
Operator
Your next question comes from Spencer Glimcher with Green Street Advisors. Please state your question.
Thank you. Maybe just a higher level question here to start. We've recently seen some large real estate players like BlackRock and Starwood acquire some net lease portfolios slash platforms. Is there any concern on your end that over time these firms are going to start impacting the bidding tents or pricing or just become a larger competitive force in the net lease market?
Yeah, I mean, look, less competition is always better, which is kind of what we've liked about Europe for some time now. But as I said before, the net lease market has always been competitive in the U.S., and we have seen some new private equity entrants, including some non-traded platforms that you mentioned, and they're finding net lease attractive, and I think that's maybe a positive signal takeaway there. They typically are focused on using higher leverage, which is generally more expensive and maybe less reliable in the current market. But like I said, we've been able to compete in the U.S. market for quite some time, and I don't think that's going to change.
That's all for me. Thanks, guys.
Operator
Your next question comes from Brad Heffern with RBC Capital Markets. Please state your question.
Yeah. Equity cost of capital has improved quite a bit this year. I know the plan for 2025 at least is to fund with dispositions, but I'm curious if you're close to seeing equity as an attractive option, or do you think the primary funding source will remain dispositions, you know, for the foreseeable future?
Yeah, we've had some nice momentum in the stock price year to date, but, you know, I think we continue to believe that, you know, we don't need to be in the equity markets this year. And, you know, we're continuing to be comfortable with kind of the approach that we've talked about, about selling non-core assets to fill our deal funding needs this year. I wouldn't rule out and maybe couldn't rule out any opportunistic issuance. The right situation, you know, comes up and that could help us get ahead of future capital needs. But, again, I think the reality is, you know, we don't need to do that this year, given our funding plan. But, you know, and that's even if we push through the top end of our investment volume guidance. So something to monitor, but it's not a need.
Okay. And Tony, you mentioned in the prepared remarks about the trail win from a stronger euro. Can you give a figure for how much of the guidance raised was due to that and then just remind us what the APO sensitivity is to changes in the euro?
Sure. Yeah, I think, you know, as you're highlighting, there's certainly some impacts on the euro, but maybe it's worth kind of just stepping back and thinking about how that's playing through for us. I think overall on a net basis, just given how we hedge both with the natural interest expense and property expenses nominated in euro and then the cash flow program, the cash flow hedging program on top of that, we really do mitigate out any significant impact. So, you know, over the first half of the year with call it a 10 percent change in the euro from the start of the year is probably only having between a one and two cent net impact. And, you know, that flows through various line items. But, you know, something pretty manageable. And, you know, that goes in both directions. I think to the extent the euro declines relative to the dollar, we wouldn't expect a material impact in the back half of the year either.
Operator
Okay. Thank you.
Operator
Your next question comes from Anthony Paolone with JP Morgan. Please see your question.
uh thanks i think the only thing i'd left was um i may have missed this but what were your acquisition and disposition cap rates for the quarter and just the the pipeline what what
those look like for the pipeline as well yeah acquisitions for year to date um mid sevens call it seven and a half percent and that's where we've been for a while now it's where we kind of ended last year. It's where we've been in the first half of the year. And I would say it's roughly where kind of the average is across our pipeline as well. And again, that's reflective of maybe a little bit more stability in the interest rate environment. In terms of dispositions, we noted we closed about a little under $600 million of dispositions year to date. The biggest piece of that was one of the self-storage portfolios has about $175 million in total. That was a sub-6% cap rate. We're not getting the specifics because we have other portfolios in the market. In fact, we have two others that we think probably close this quarter. That's all part of the initial plan for the first half of our storage that we've been talking about. But maybe the way to describe kind of DISPO cap rates is we do expect to achieve 100 basis points at least and probably closer to 150 basis points of spread between where we're investing and what we'll sell this year. So I think you can think about DISPO cap rates, you know, approaching 6%, you know, for the full year, but that's probably a decent assumption to use. Okay, great. That's all I got.
Operator
Okay. Thanks, Tony. Thank you. And before we take the next question, Just a reminder to the audience, to ask a question, press star 1 on your telephone keypad. To withdraw your question, press star, then the number 2. Once again, to ask a question, press star 1 on your telephone keypad. And your next question comes from Jana Gallen with Bank of America. Please state your question.
Thank you. Good morning and congrats on a great quarter. Just a question on the fixed in-place rent bumps. I think you mentioned that the portfolio is at 2.1%. And then on the leasing to date, you mentioned the fixed escalators are 2.8. I was just curious if this is due to more industrial being in that mix or are tenants now conversations you're having accepting these kind of higher escalators?
Yeah, it's probably a combination of the two, Yana. You know, we've talked before that we've gotten a little bit less inflation-based increases in the new deals that we're doing. But what that means is we've been able to push the fixed increases a little bit higher. So, yeah, so year to date on new deals with fixed increases, I think the average fixed increase was 2.8% on new deals. And, again, I think that's reflective of, you know, where alternative, you know, lease bump structures could be with inflation. But I think it's also a reflection of the industrial deals we're doing. you know retail tends to be meaningfully lower you know probably you know one and a half to two percent per year and depending on the credit especially if you go investment grade those tend to be you know flat to maybe one percent or ten percent every ten years so i think it's a combination of two things but but we do you know maybe want to continue emphasizing that we have substantial bumps in our portfolio and you know we look at spreads both between going in cap rates with provide year one accretion but also importantly what's the average yield over the life of the lease. And we think the mid-nines that we've been achieving as of late, that's probably one of the highest, if not the highest in the net lease sector. So quite attractive still.
Thank you. And then maybe just following up on that, can you talk a little bit about how you
think about the developments? Developments as in build-a-suits?
Yes. What kind of yields you're targeting there and how that complement, you know, the trade-off between sale-leasebacks on income-producing and doing these built-to-suits.
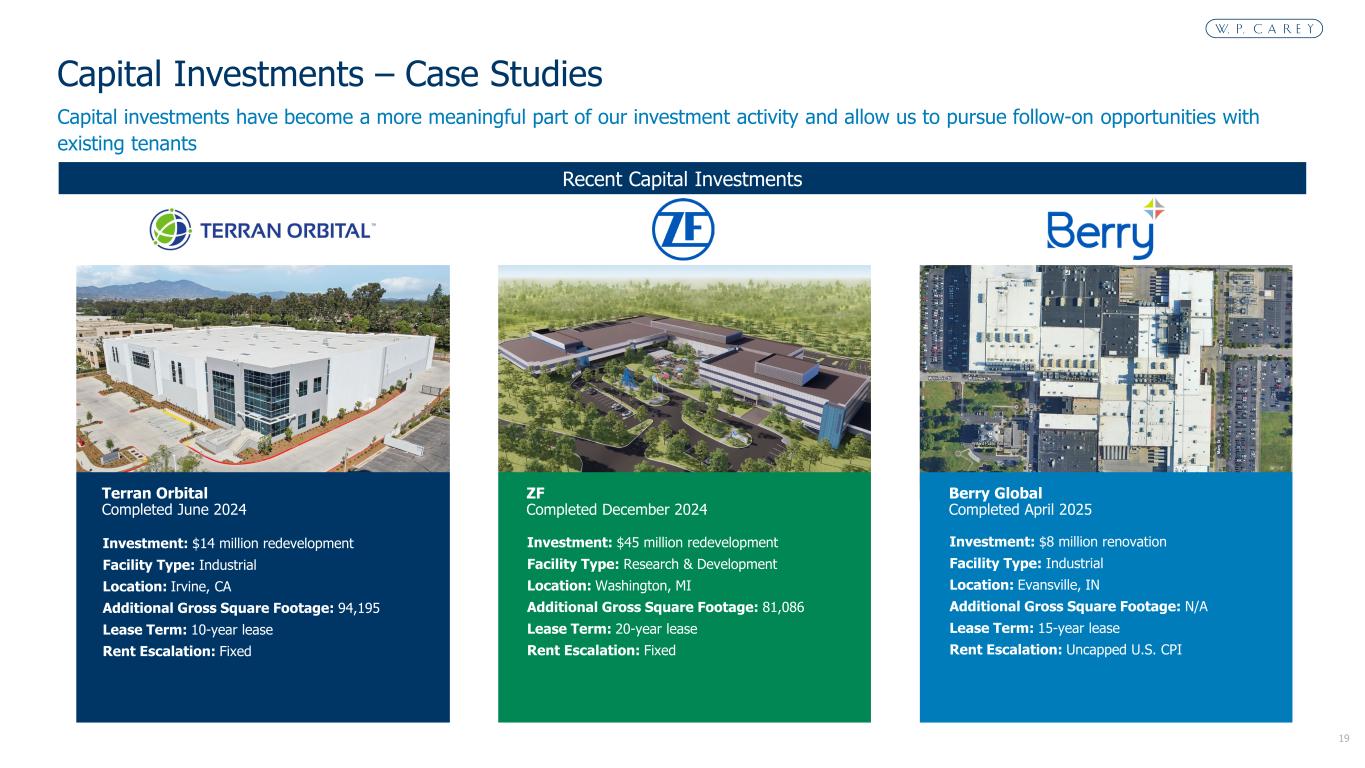
Yeah, and we do provide some pretty good disclosure in our sub-capital investment projects is what we, you know, categorize it as. And that includes built-to-suits, expansions, and redevelopments. And it's something that we've been doing for a long time. I think historically they probably made up maybe 10% to 15% of annual deal volume. And I think that we can ramp that up. You may have noted this quarter we committed to funding several new projects totaling about $100 million. That brings our total projects currently under construction to about $300 million. Those will deliver over the next, you know, call it 18 months or so. And with cap rates, you know, it does depend on the deal, obviously. I would say on average, you probably see, you know, 15 or 25 to 50 basis points of premium or long-term build-a-suits. When you think about the expansions or redevelopments that we can do within our portfolio, it's probably meaningfully higher than that in terms of the spreads that we can generate. And that's something we want to ramp up. And we've built up a dedicated project management team in-house. They have deep operational real estate expertise, and, you know, that gives us a real competitive advantage and, you know, something that we can offer, you know, development services and solutions to our existing tenants and hopefully, you know, ramp up deal volume there.
Great. Thank you so much for the time.
Operator
And your next question comes from Jim Kammer with Evercore ISI. Please state your question.
Good morning. Thank you. really just building on that last theme, Jason and team, the current administration certainly seems to want to bring manufacturing to the U.S., whether it's pharmaceuticals, autos, et cetera. And is that really to translate to any opportunity, particularly among your very manufacturing-specific tenant base? Are they having more conviction in their conversations with you about expanding or putting capital to work and therefore needing
more space? Just curious at a high level. Yeah, I mean, it's anecdotal, but I think There is some truth behind that, that we've heard more inbound conversations on build-a-suits, but also expansions and adding capacity to our existing management or existing asset base. So that's certainly some tailwinds that we can foresee how widespread or impactful it'll be. It's kind of hard to tell. These are long-term decisions that companies need to make. Obviously, there's been a lot of fits and starts and stops in terms of where tariffs are going to land. But I think long term, I think that we would benefit within our industrial portfolio and especially the manufacturing side.
Operator
That's great. Thank you for your time. At this time, I'm not showing any further questions. I'll now hand the call back to Mr. Sands.
Thank you for your interest in WP Carey. If anyone has additional questions, please call Investor Relations directly on 212-492-1110. That concludes today's call and you may now disconnect.