Operator
Please stand by, your meeting is about to begin. Good morning, ladies and gentlemen, and welcome to Essential Properties Realty Trust's fourth quarter 2025 earnings conference call. This conference call is being recorded, and a replay of the call will be available three hours after the completion of the call for the next two weeks. The dial-in details for the replay can be found in yesterday's press release. Additionally, there will be an audio webcast available on Essential Properties' website at www.essentialproperties.com, an archive of which will be available for 90 days. On the call with us this morning are Mr. Pete Mavoides, President and Chief Executive Officer, Rob Salisbury, Chief Financial Officer, Max Jenkins, Chief Operating Officer, A.J. Peel, Chief Investment Officer, and Cheryl Call, Director of Financial Planning and Data analytics. It is now my pleasure to turn the conference over to Cheryl Call. Please go ahead, ma'am.
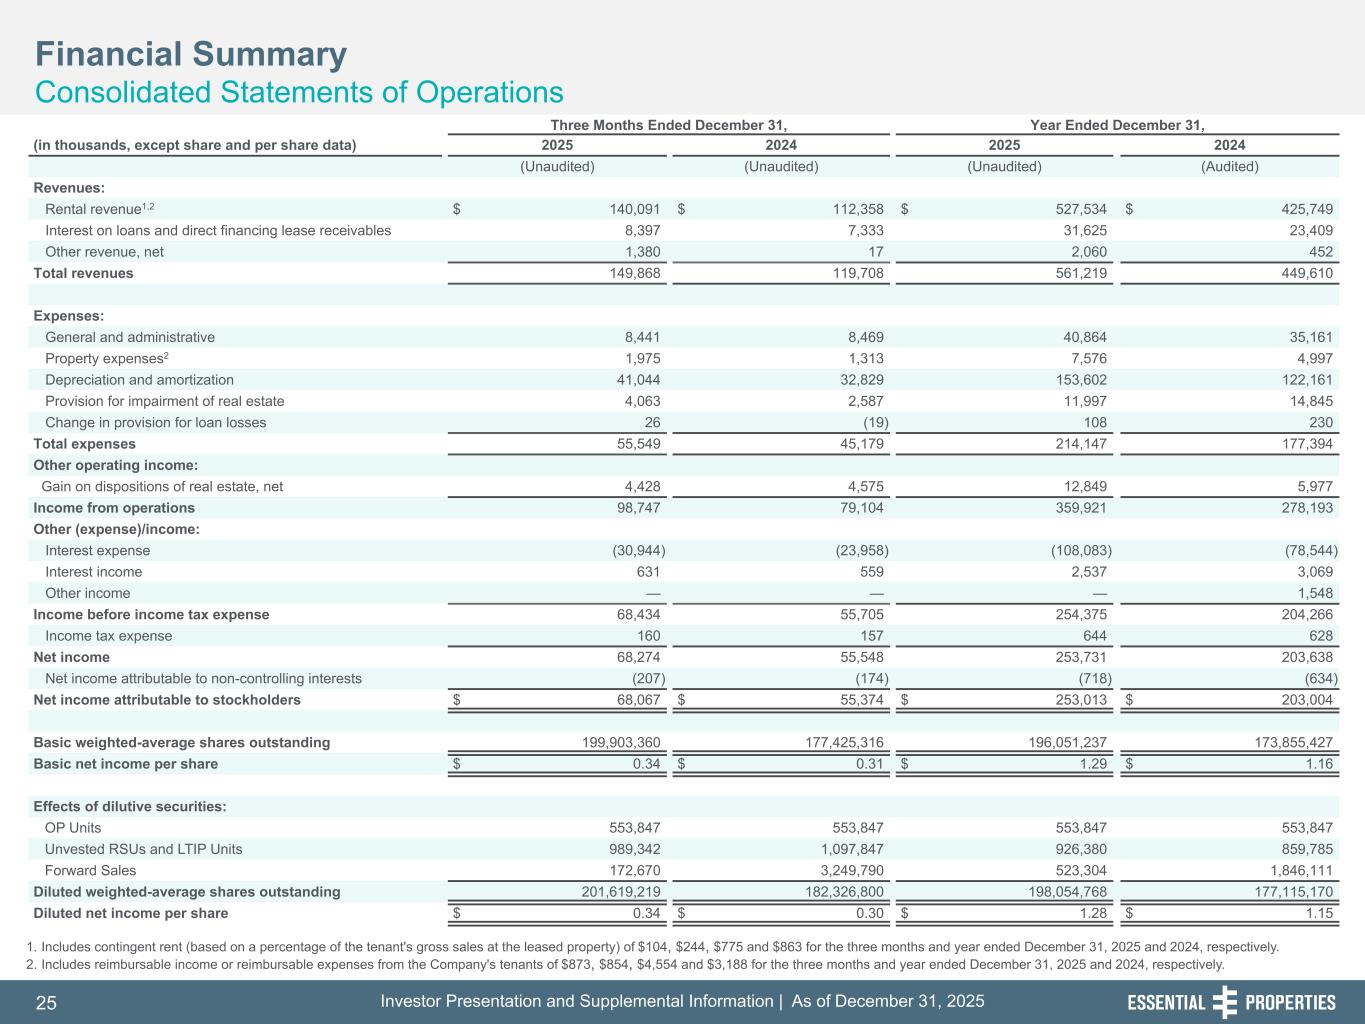
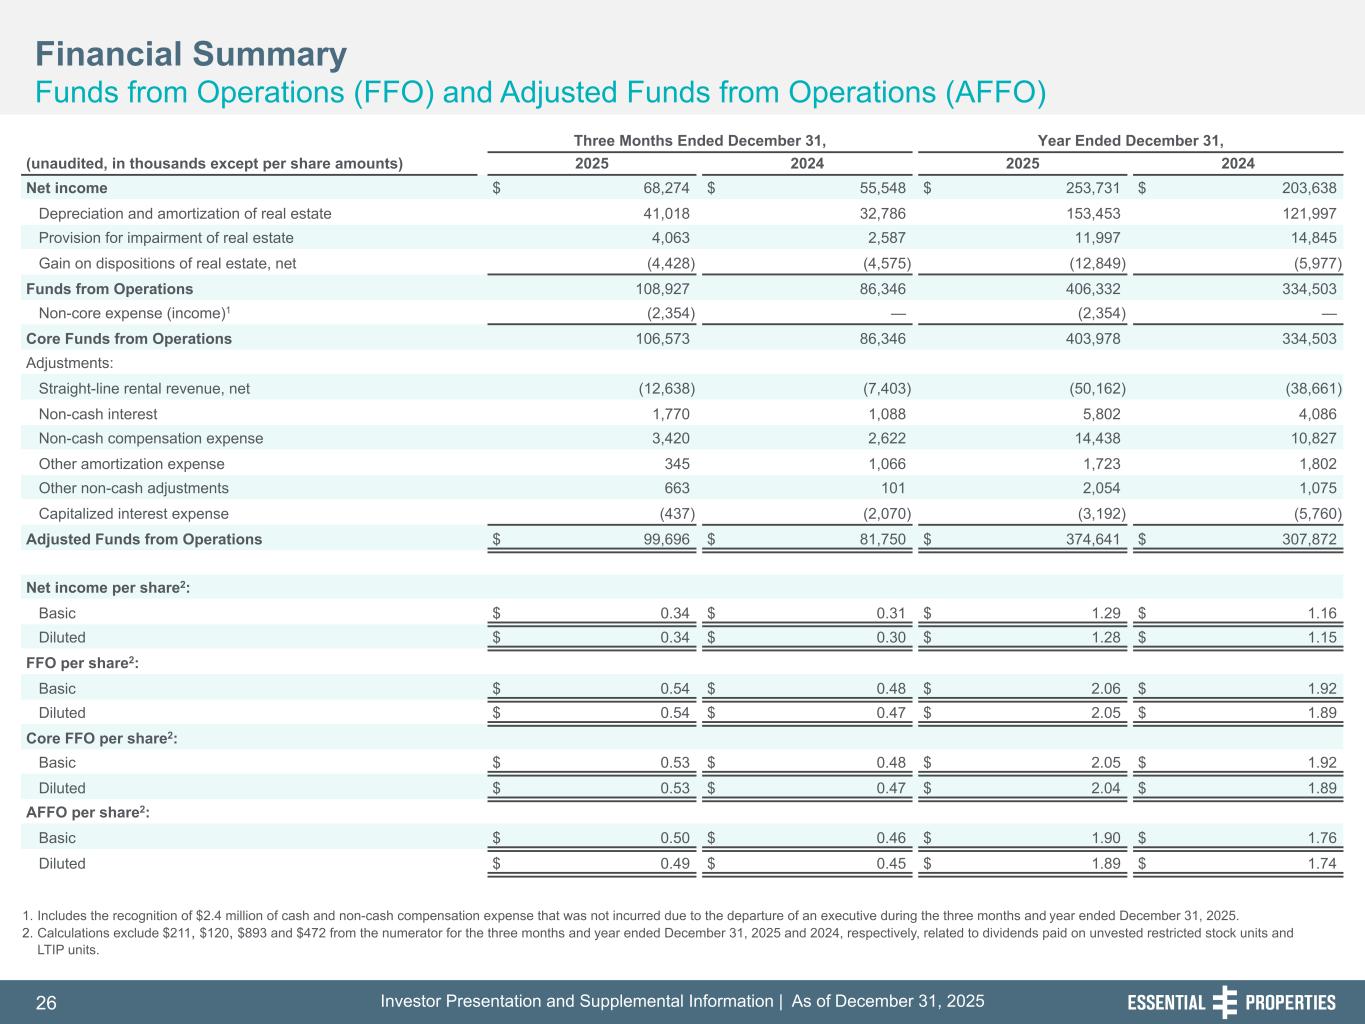
Thank you, operator. Good morning, everyone, and thank you for joining us today for Essential Properties 4th Quarter 2025 Earnings Conference Call. During this conference call, we will make certain statements that may be considered forward-looking statements under federal securities law. The company's actual future results may differ significantly from the matters discussed in these forward-looking statements, and we may not release revisions to those forward-looking statements to reflect changes after the statements were made. Factors and risks that could cause actual results to differ materially from expectations are disclosed from time to time in greater detail in the company's filings with the SEC and in yesterday's earnings press release. In our earnings release last night, for the quarter, we reported GAAP net income of $68.3 million and ASFO of $99.7 million. With that, I'll turn the call over to Pete.
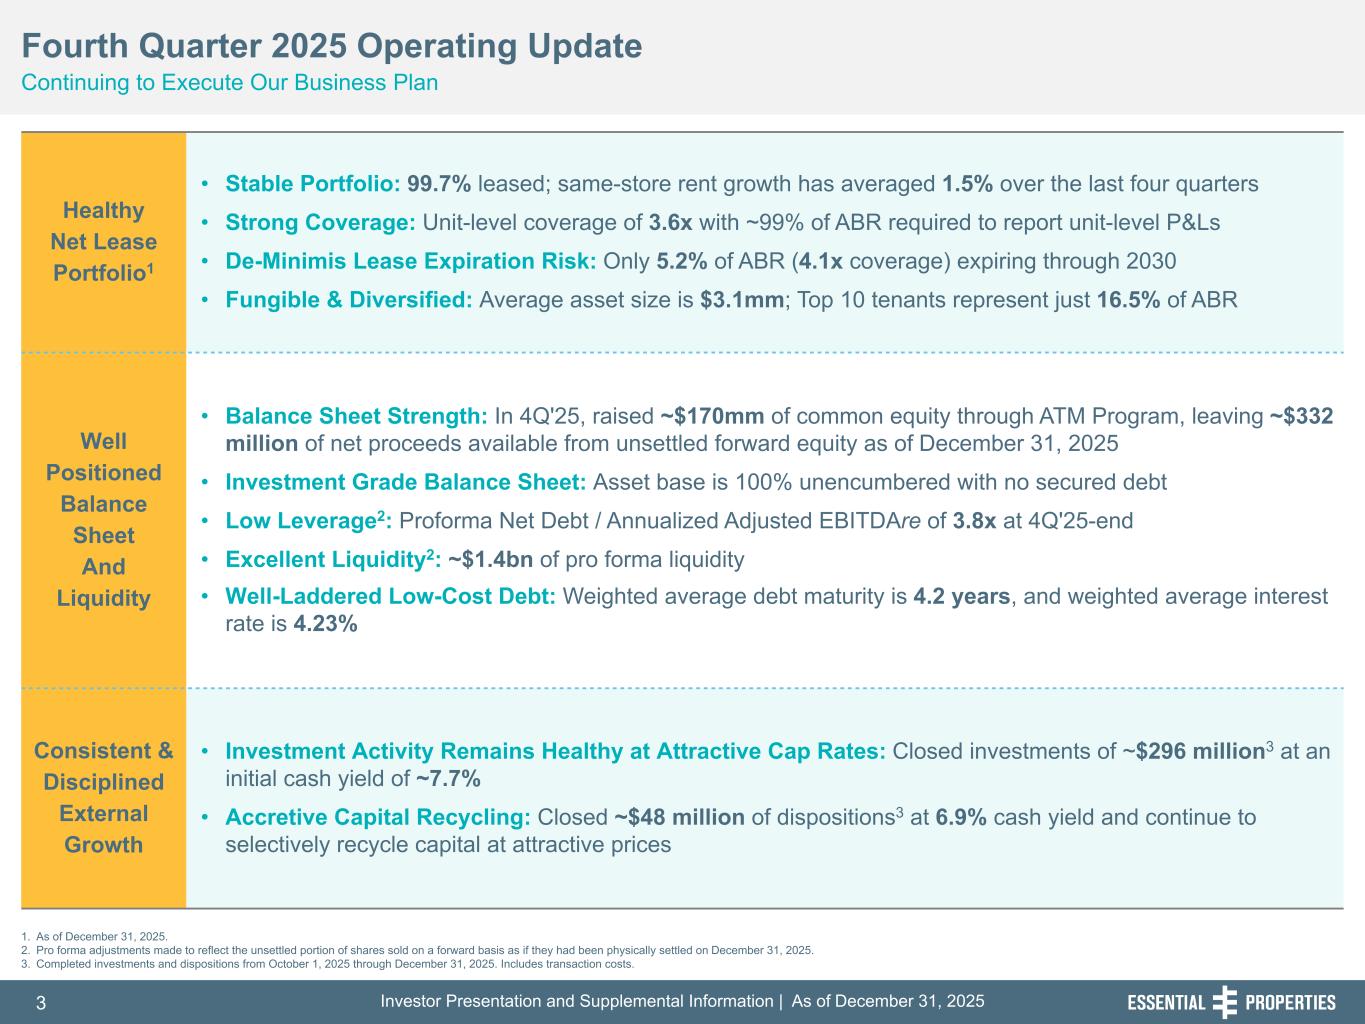
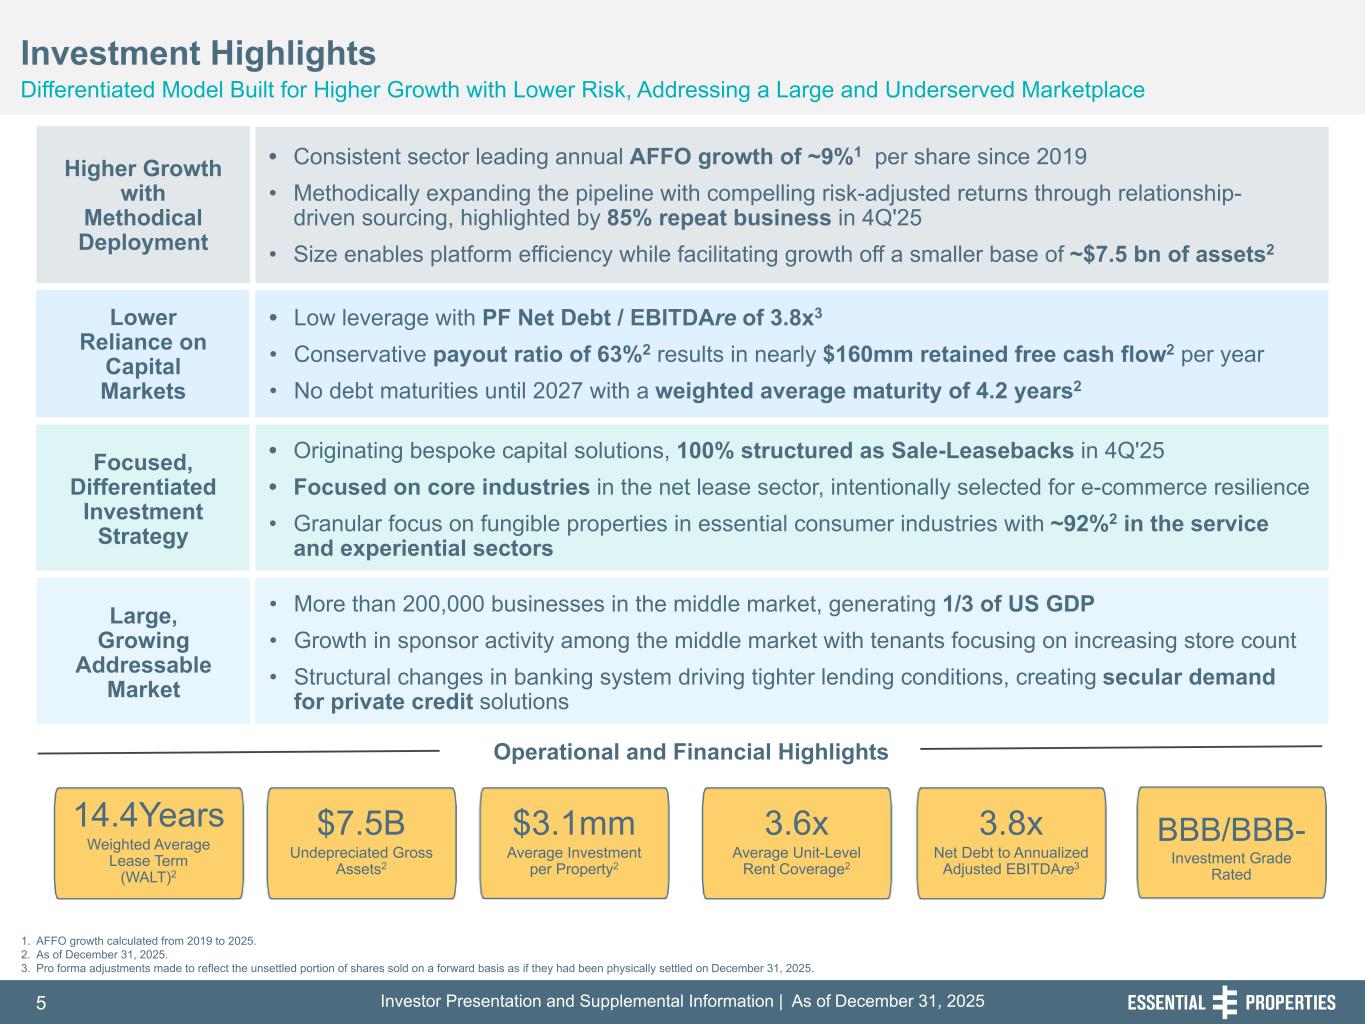
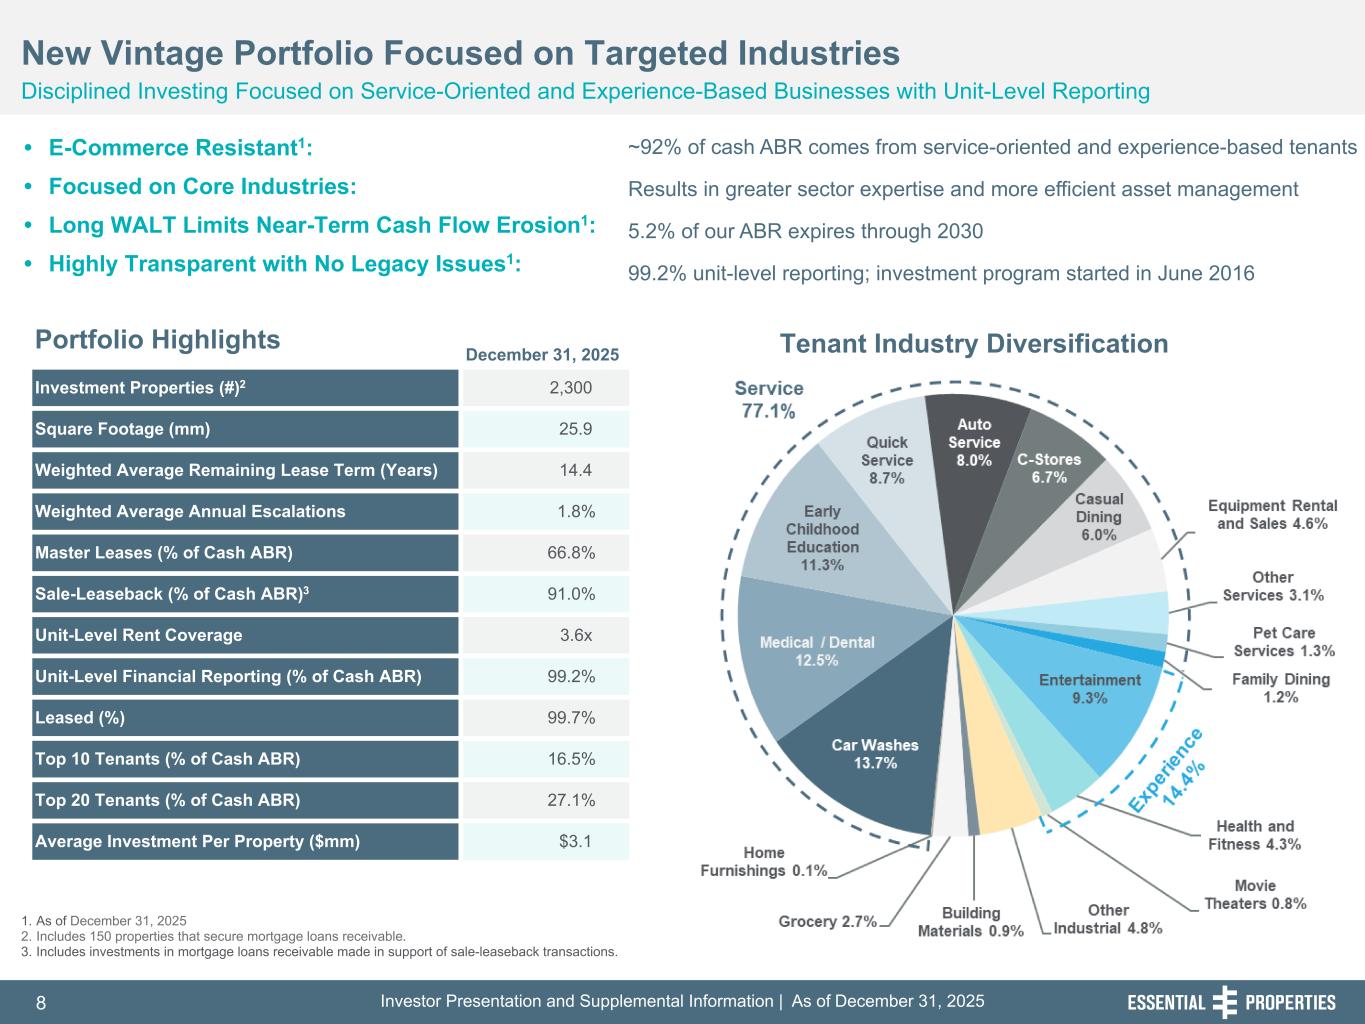
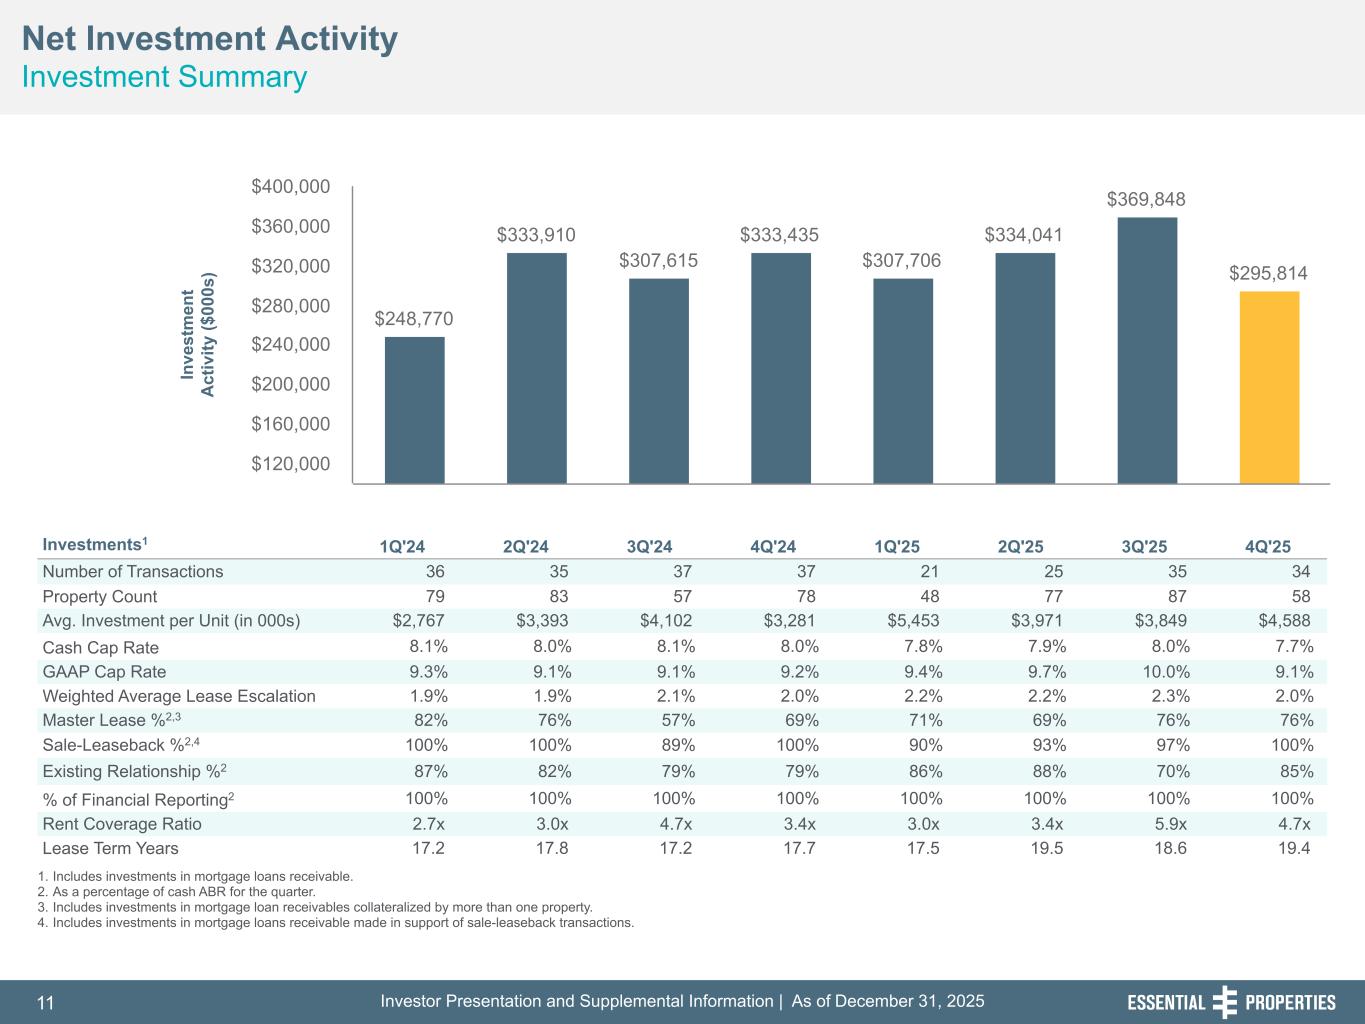
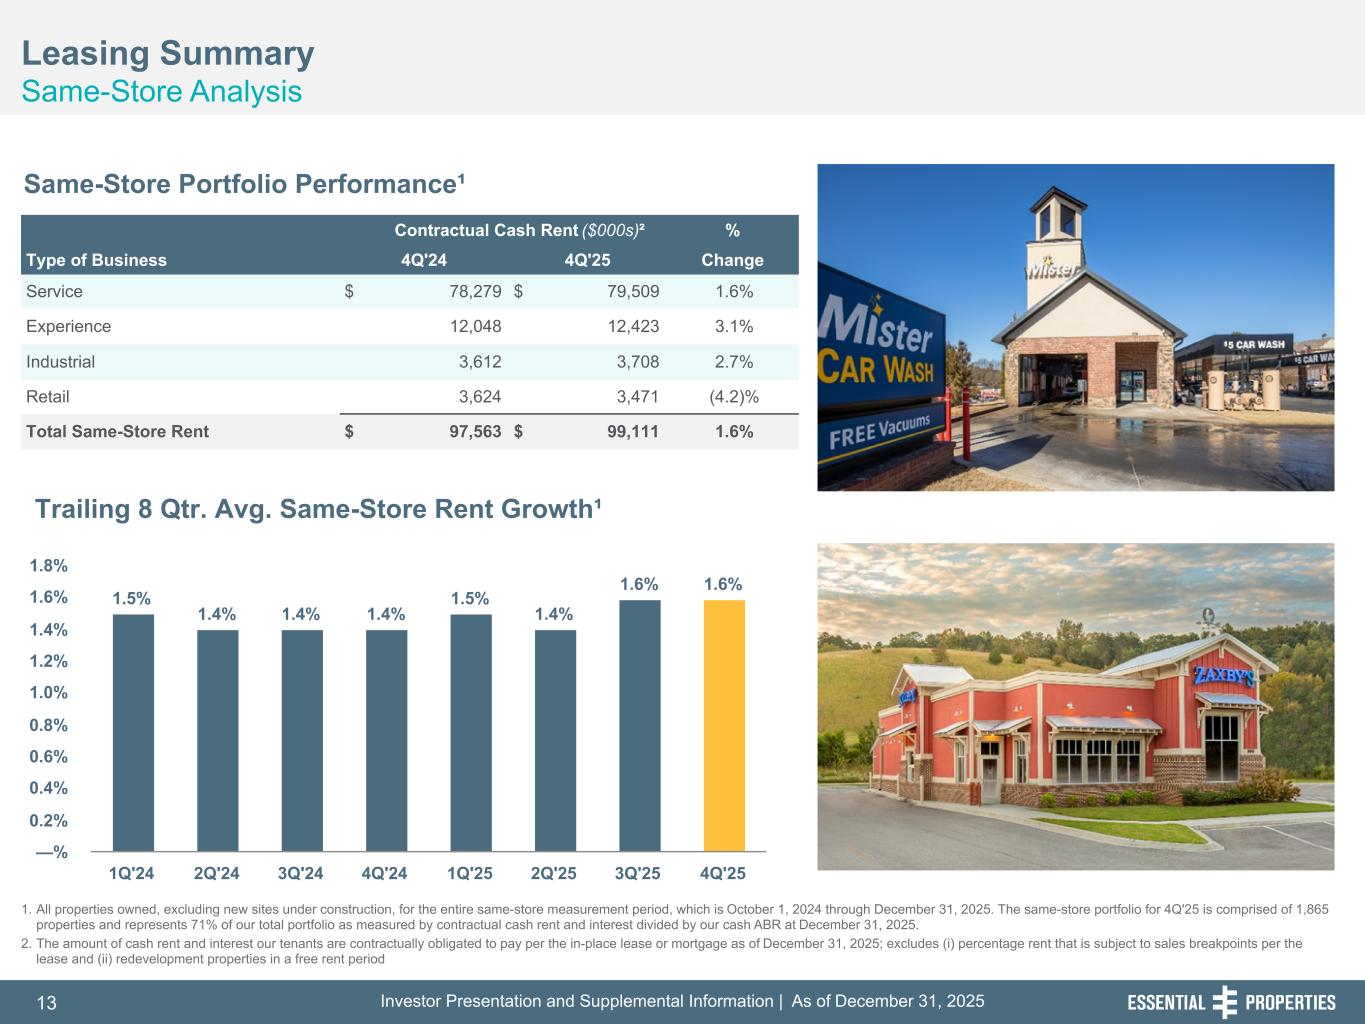
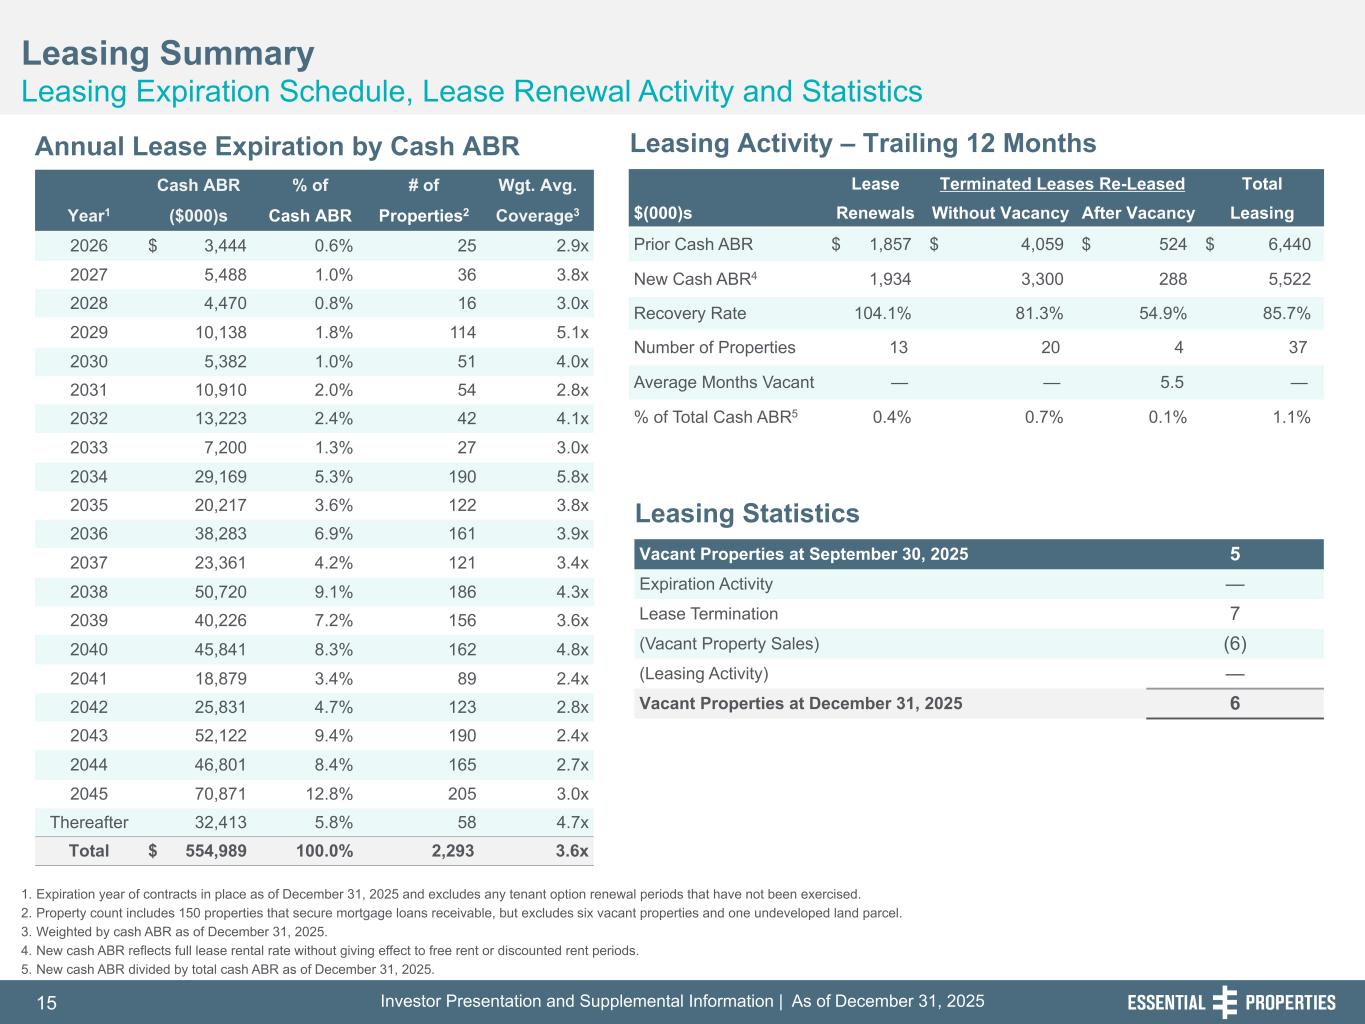
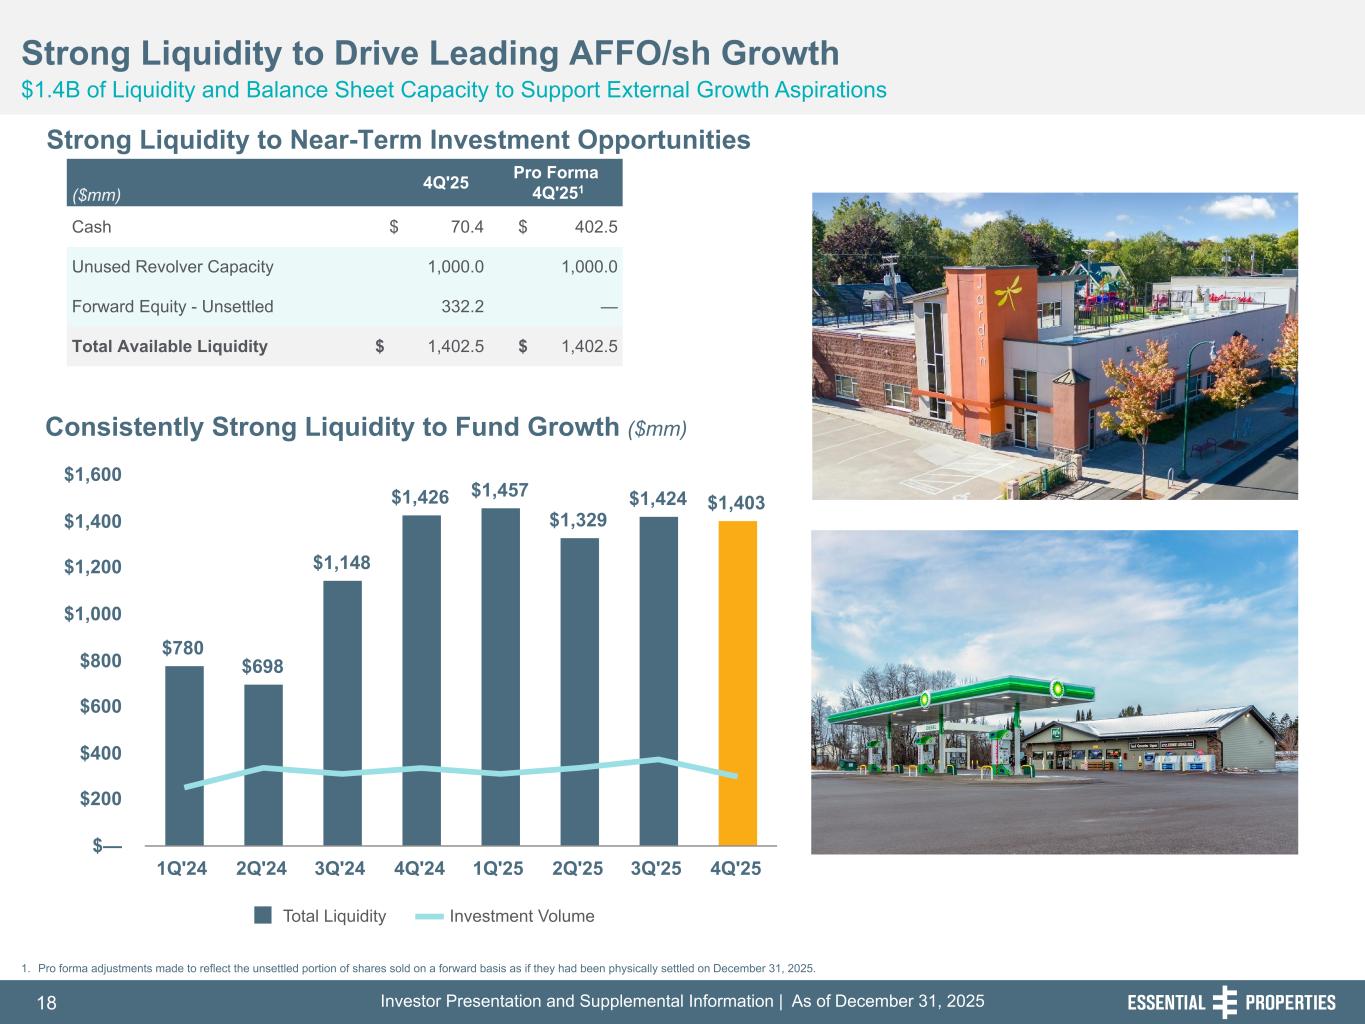
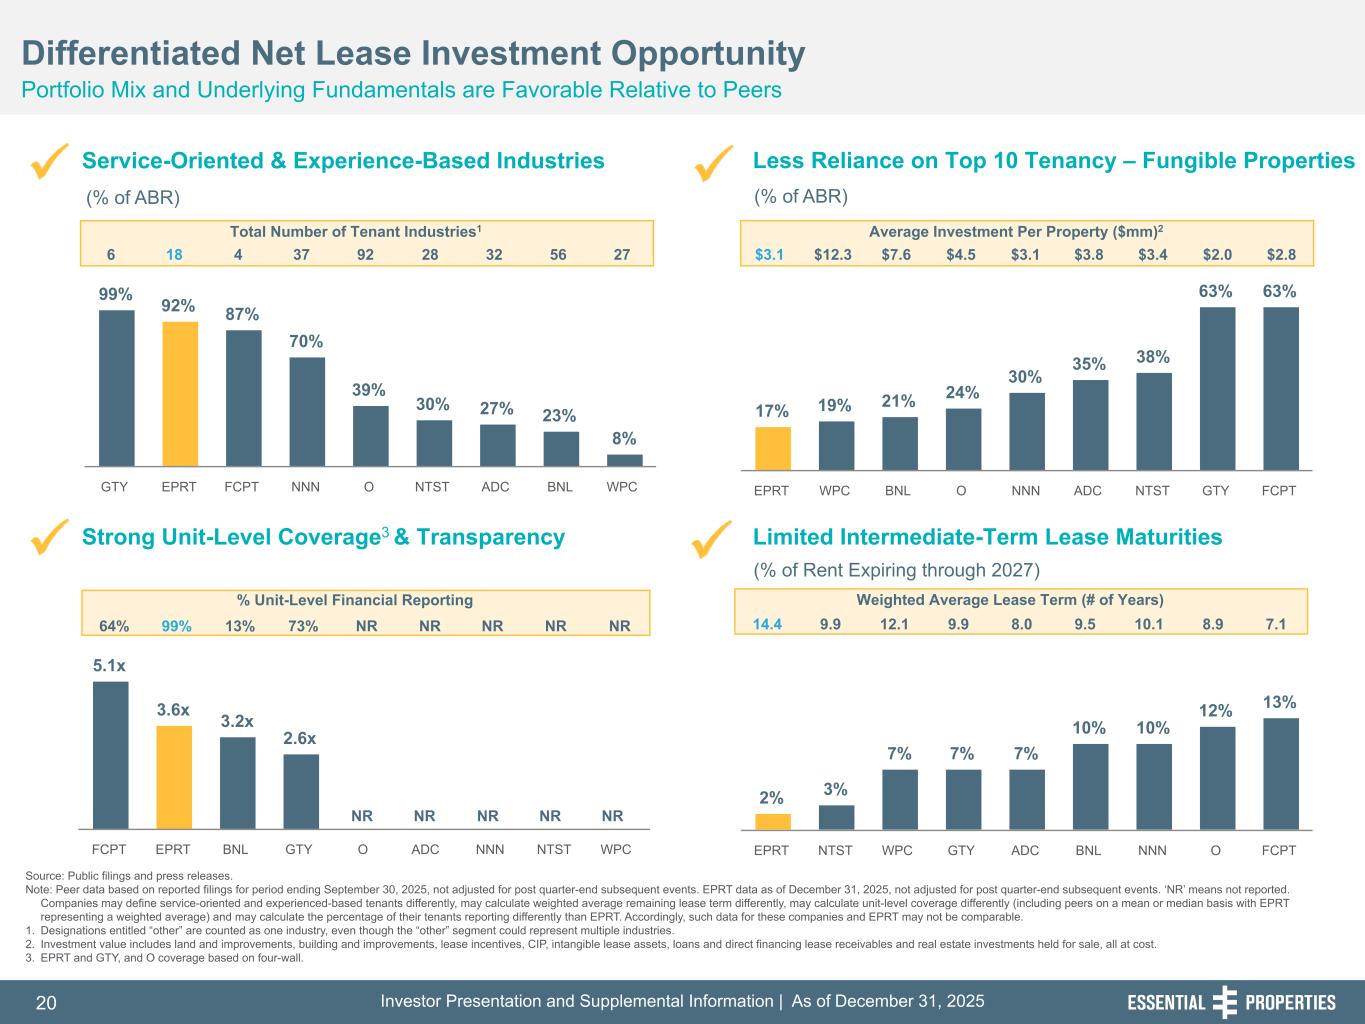
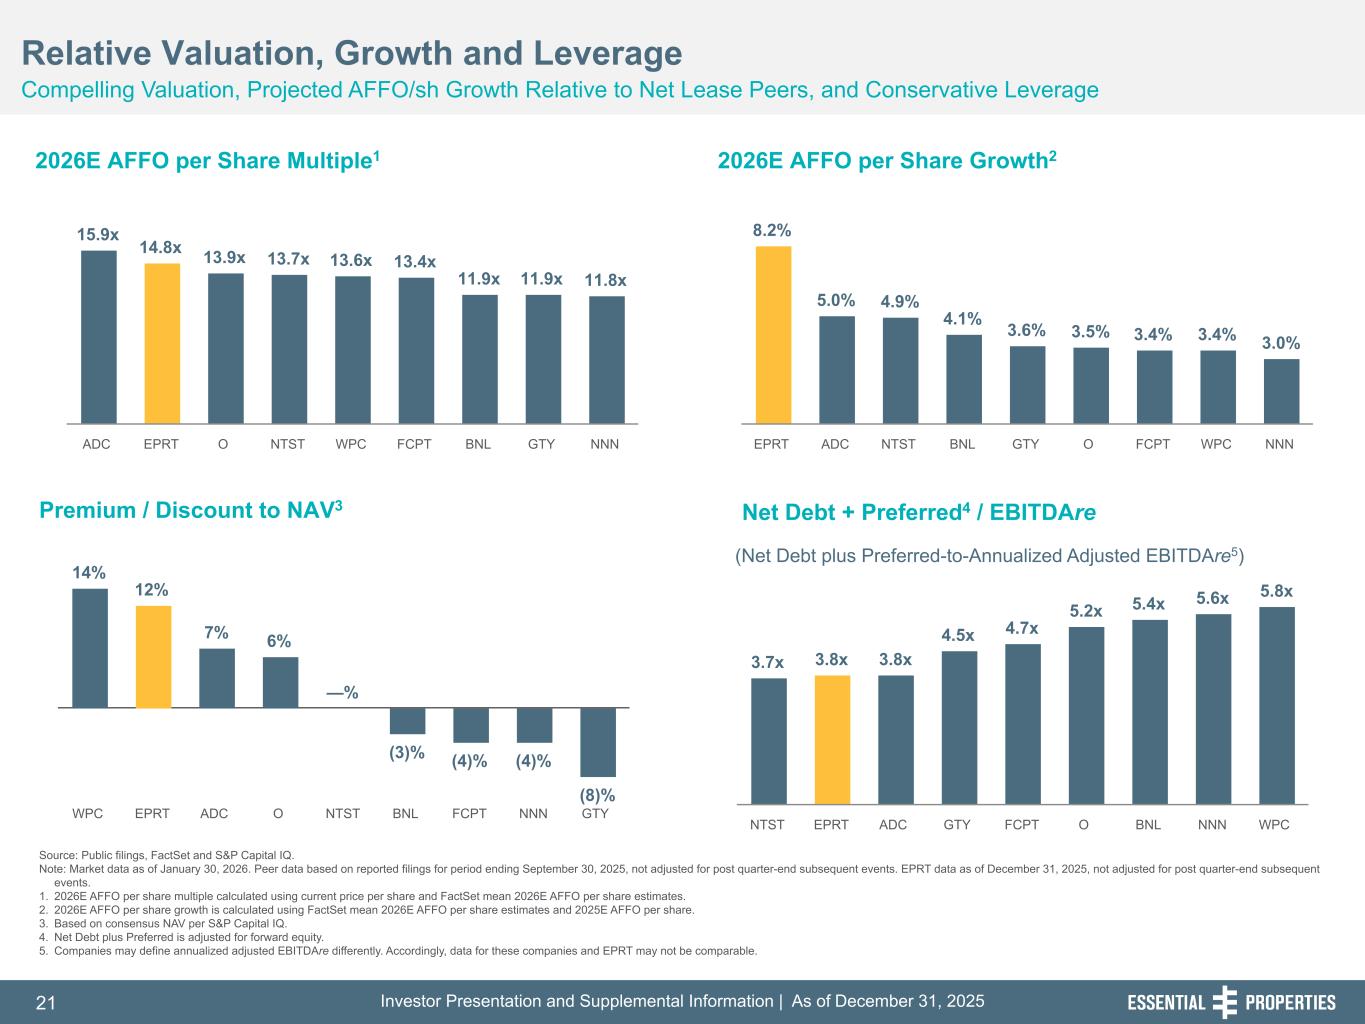
Thanks, Cheryl, and thank you to everyone joining us today for your interest in essential properties. The fourth quarter capped off another year of solid performance by the team that delivered compelling earnings growth and solid returns for shareholders it has been 10 years since we started this company and i'm extremely proud of the team that we have developed the dominant position that we have established as a real estate capital provider to middle market operators that are growing in our targeted industries and most importantly the returns that we have delivered for shareholders, and over 200% total shareholder return since our IPO in 2018. In the fourth quarter, we continued to execute our differentiated investment strategy, sourcing 85% of our 296 million of investments through existing relationships, while continuing to add new operator relationships to our platform. This robust investment volume was generated with a disciplined pricing, including an average initial cash yield of 7.7 percent and a compelling gap yield of 9.1 percent. This large spread to our cost of capital is a key driver of our earnings growth. Our portfolio once again demonstrated resilient tenant credit trends with same-store rent growth of 1.6%, strong rent coverage of 3.6 times, and an improvement in our watch list. With better-than-budgeted credit trends and a large investment pipeline with cap rates consistent with past quarters, we have increased our 2026 AFFO per share guidance range to $1.99 to $2.04, which implies a growth rate of about 7% at the midpoint and 80% of the 8% at the high end. Our year-to-date closed investments and our current pipeline are supportive of our previously communicated investment guidance of $1 billion to $1.4 billion. While we continue to expect modest cap rate compression in the back half of 2026, competition appears to be stabilizing based upon our current visibility. Regarding our capital position, we started the year with pro forma leverage of 3.8 times and liquidity of $1.4 billion, providing ample runway to fund our investment pipeline. Turning to the portfolio, we ended the quarter with investments in 2,300 properties that were leased to over 400 tenants. Our weighted average lease term continued to be approximately 14 years for the 19th consecutive quarter, with just 5.2 percent of annual base rent expiring over the next five years. With that, I'll turn the call over to AJ Peel, our Chief Investment Officer, who will provide an update on our portfolio and asset management activities. AJ?
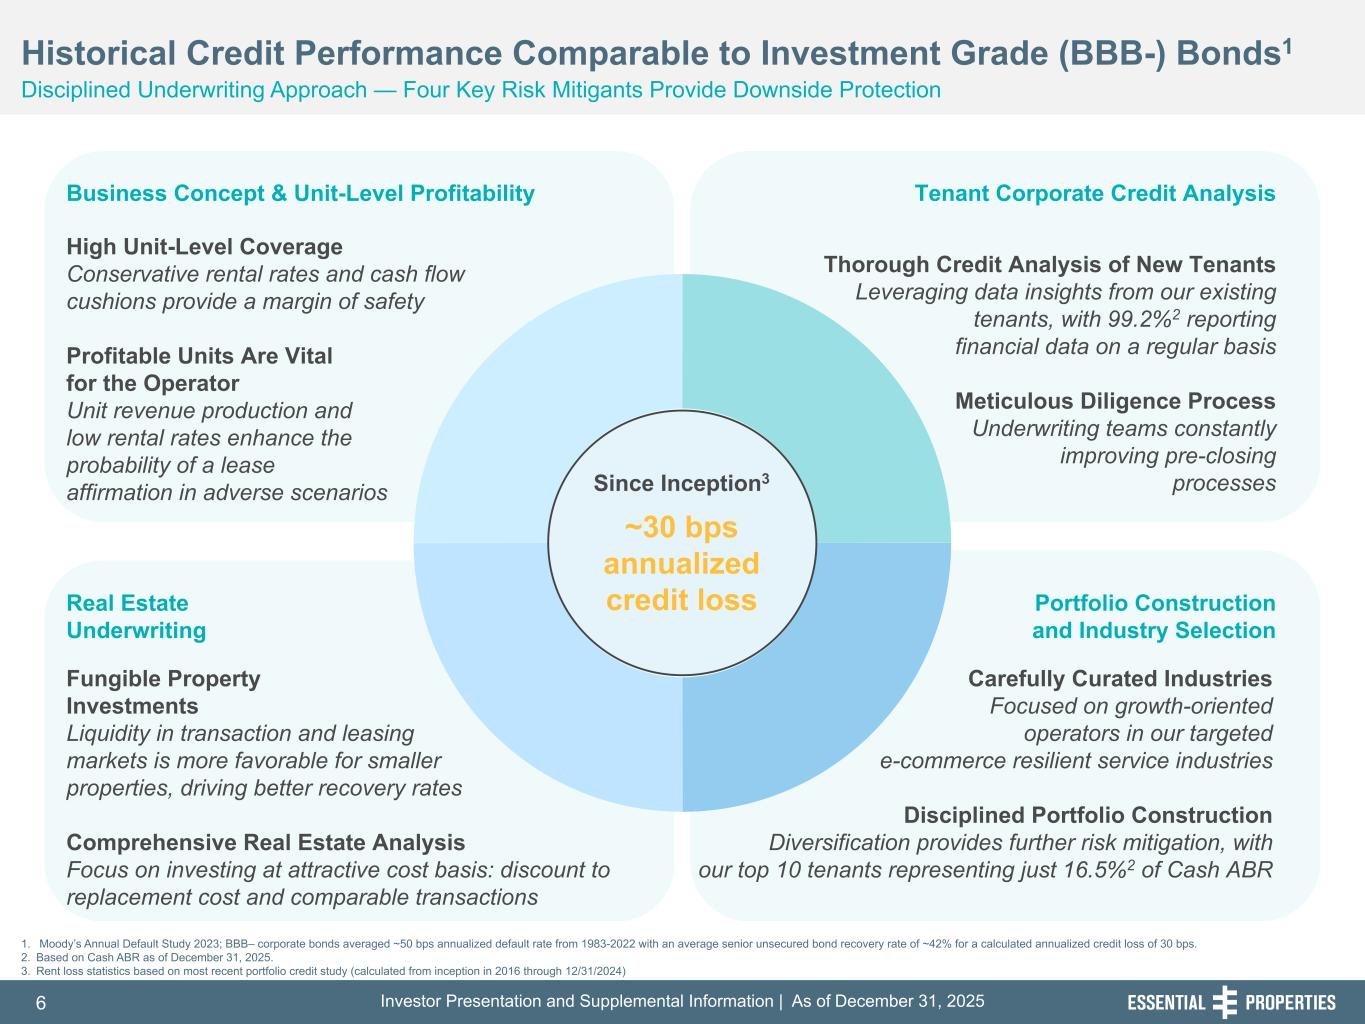
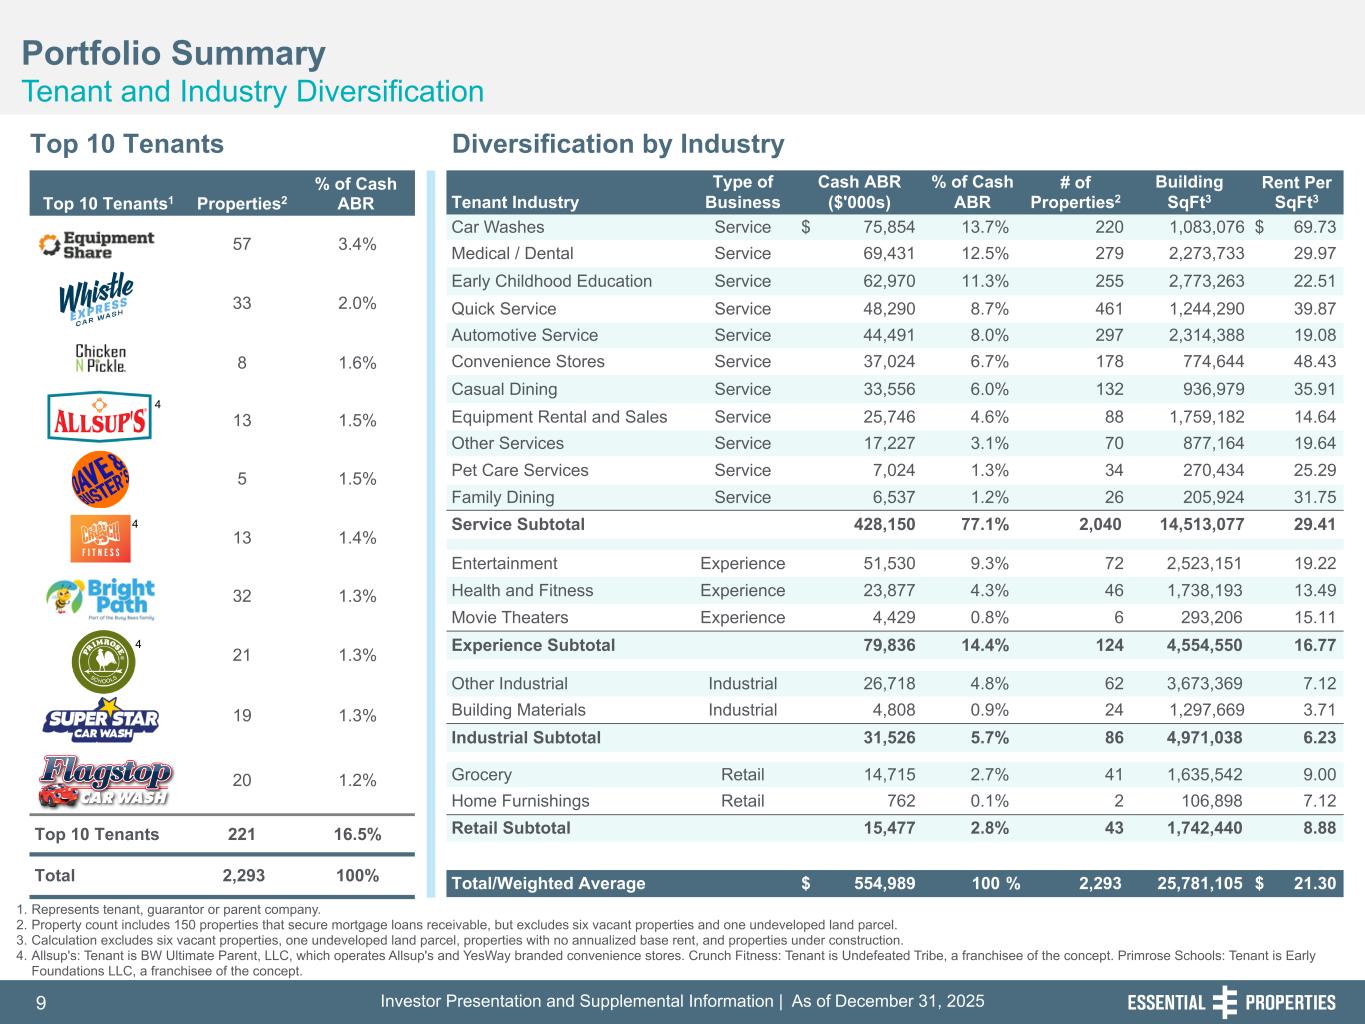
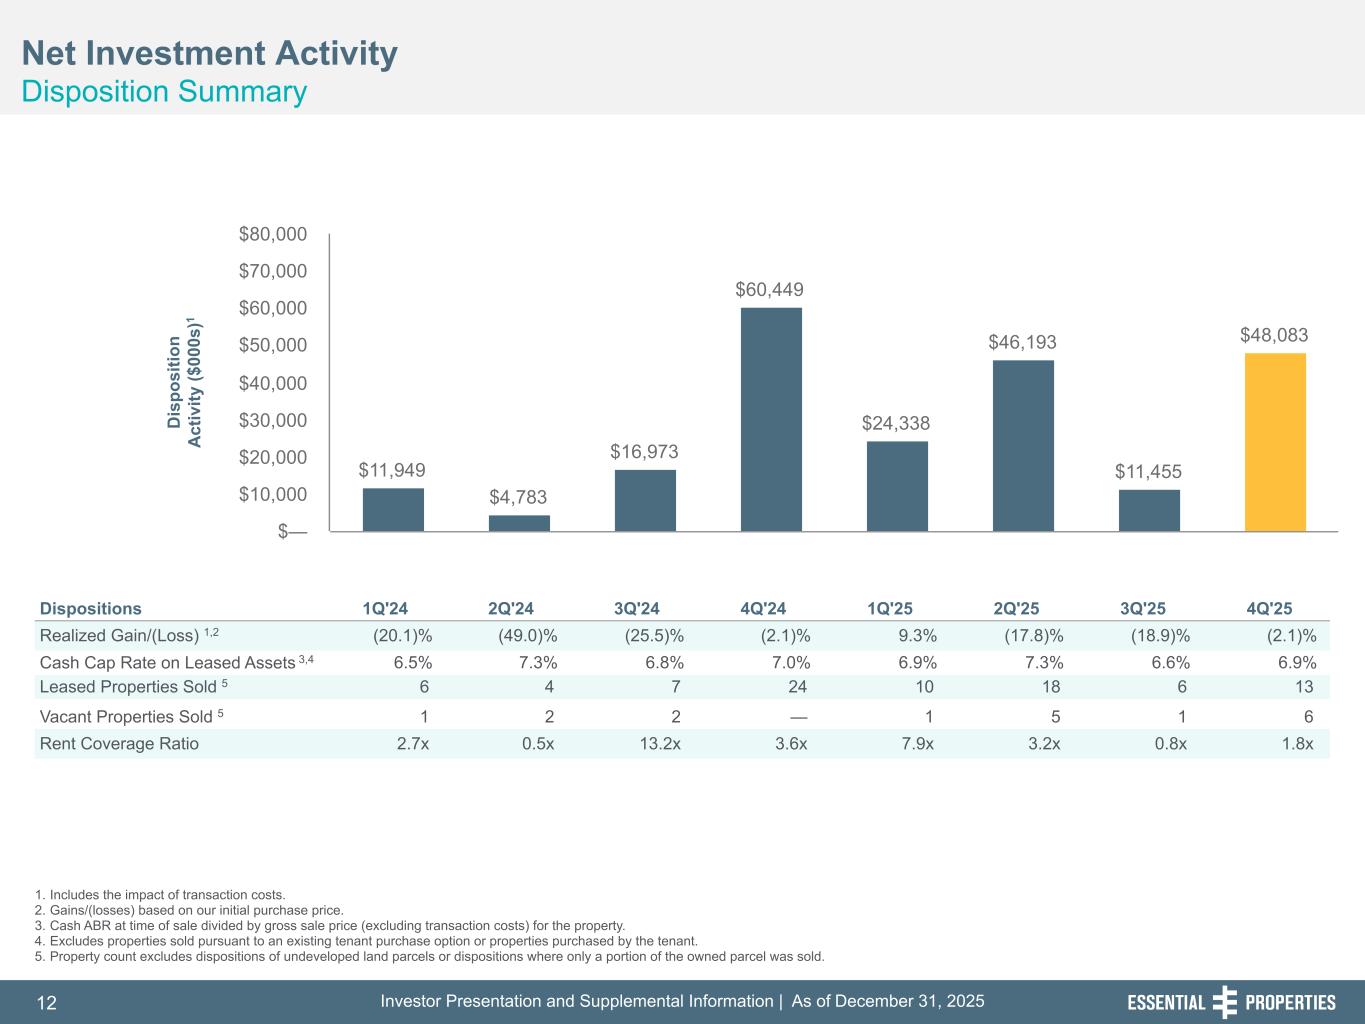
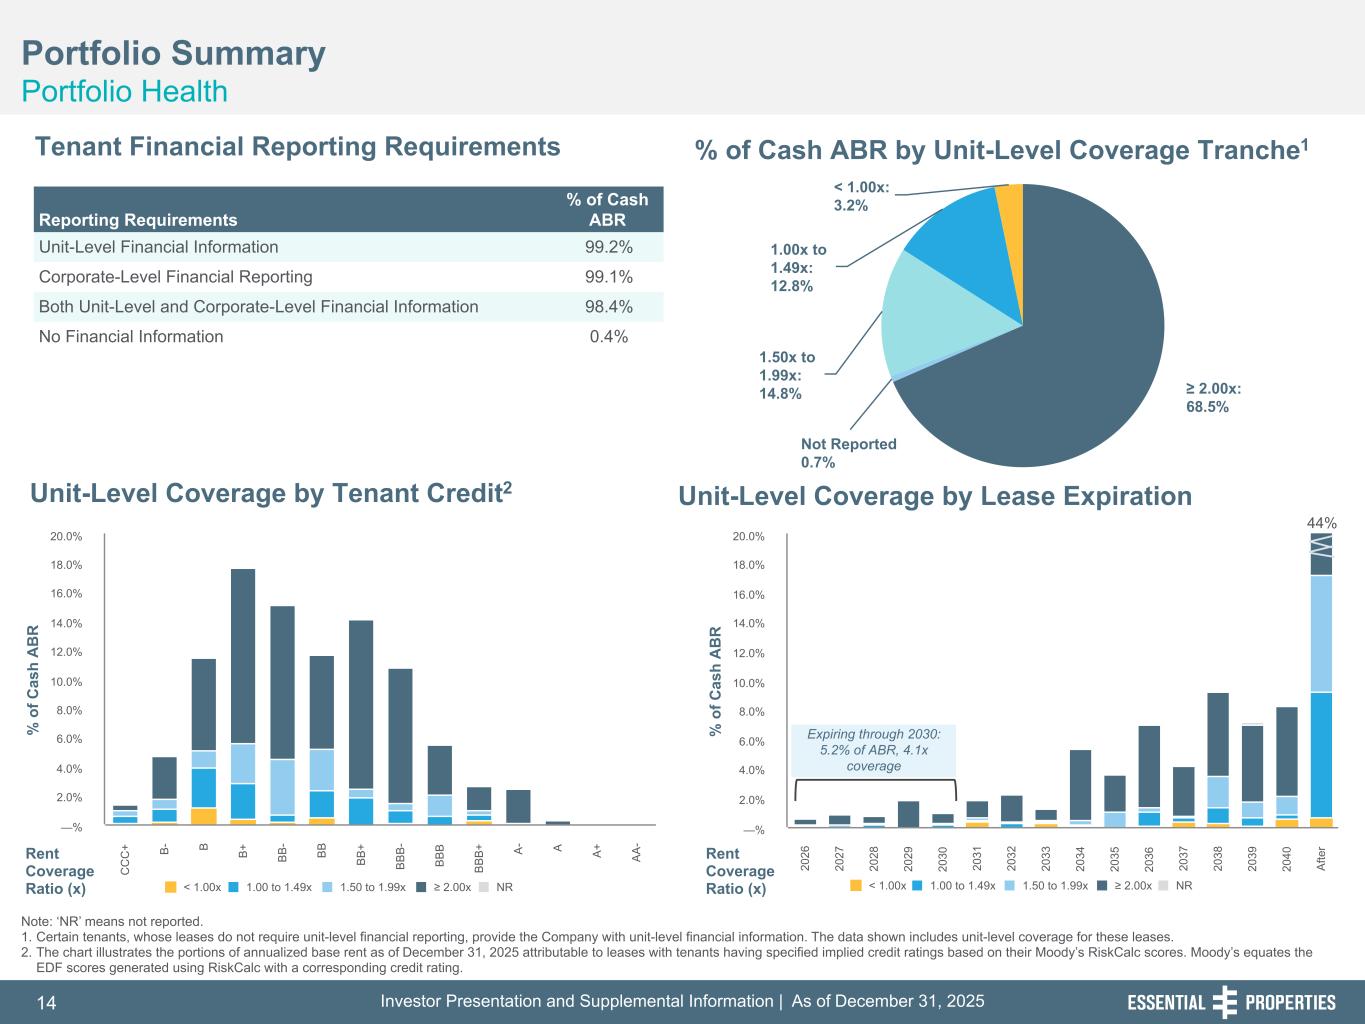
AJ Peel Thanks, Pete. Overall, our portfolio credit trends remain healthy, with same-store rent growth in the fourth quarter of 1.6%, consistent with last quarter, and occupancy of 99.7%, with only six vacant properties. Portfolio rent coverage remains robust at 3.6 times, reflecting durable cash flow generation across our asset base. Additionally, our credit watch list declined from last quarter to under 1%, and the tenants within our watch list remain current on all obligations. Last credit events in the quarter were limited, with just one notable tenant issue in the home furnishing industry, American Signature, which represented about 20 basis points of our ABR as of September 30th across two sites. We expect our recovery to be within the normal range of outcomes, having fully anticipated this situation and incorporated into our guidance range provided last quarter. On dispositions, during the fourth quarter we sold 19 properties for $48.1 million in net proceeds at a 6.9% weighted average cash yield. Disposition activity increased as we opportunistically capitalized on elevated buyer demand created by the reinstatement of bonus depreciation tax benefits for car wash properties, resulting in a continued reduction in our exposure to this industry to 13.7%. Over the near term, we expect our disposition activity to normalize and align with our trailing eight-quarter average, driven by opportunistic asset sales and ongoing portfolio management activity. Tenant concentration continues to decline with our top 10 tenants comprising only 16.5% of ABR and our top 20 representing only 27.1% of ABR quarter end, which is industry leading. Tenant diversity is an important risk mitigation tool and a direct benefit from our focus on middle market operators. With that, I'll turn the call over to Max Jenkins, our Chief Operating Officer, who will provide an update on our investment activities and the current market dynamics.
On the investment side, during the fourth quarter, we invested $296 million at a weighted average cash yield of 7.7%. Our capital deployment was broad-based across most of our top industries, with no notable departures from our investment strategy. During the fourth quarter, our investments had a weighted average initial lease term of 19.4 years and a weighted average annual rent escalation of 2%, generating a strong a strong average gap yield of 9.1%. Our investments this quarter had a weighted average unit level rent coverage of 4.7 times, reflecting a conservative rent level and healthy unit profitability for our operators. We closed 34 transactions comprising 58 properties, of which 100% were sale leasebacks. The average investment per property was $4.6 million this quarter, consistent with our historical range with our deal activity characterized by granular, freestanding properties, one of the core elements of our strategy. Looking ahead, our investment pipeline remains strong, supported by record subsequent quarter investment activity of over $200 million. The cap rate environment remains stable today with our pricing and our pipeline in the high 7% range, which represents a compelling spread to our cost of capital and is consistent with our updated guidance range. With that, I'd like to turn the call over to Rob Salisbury, our new Chief Financial Officer, who will take you through the financials for the fourth quarter. Thanks, Max.
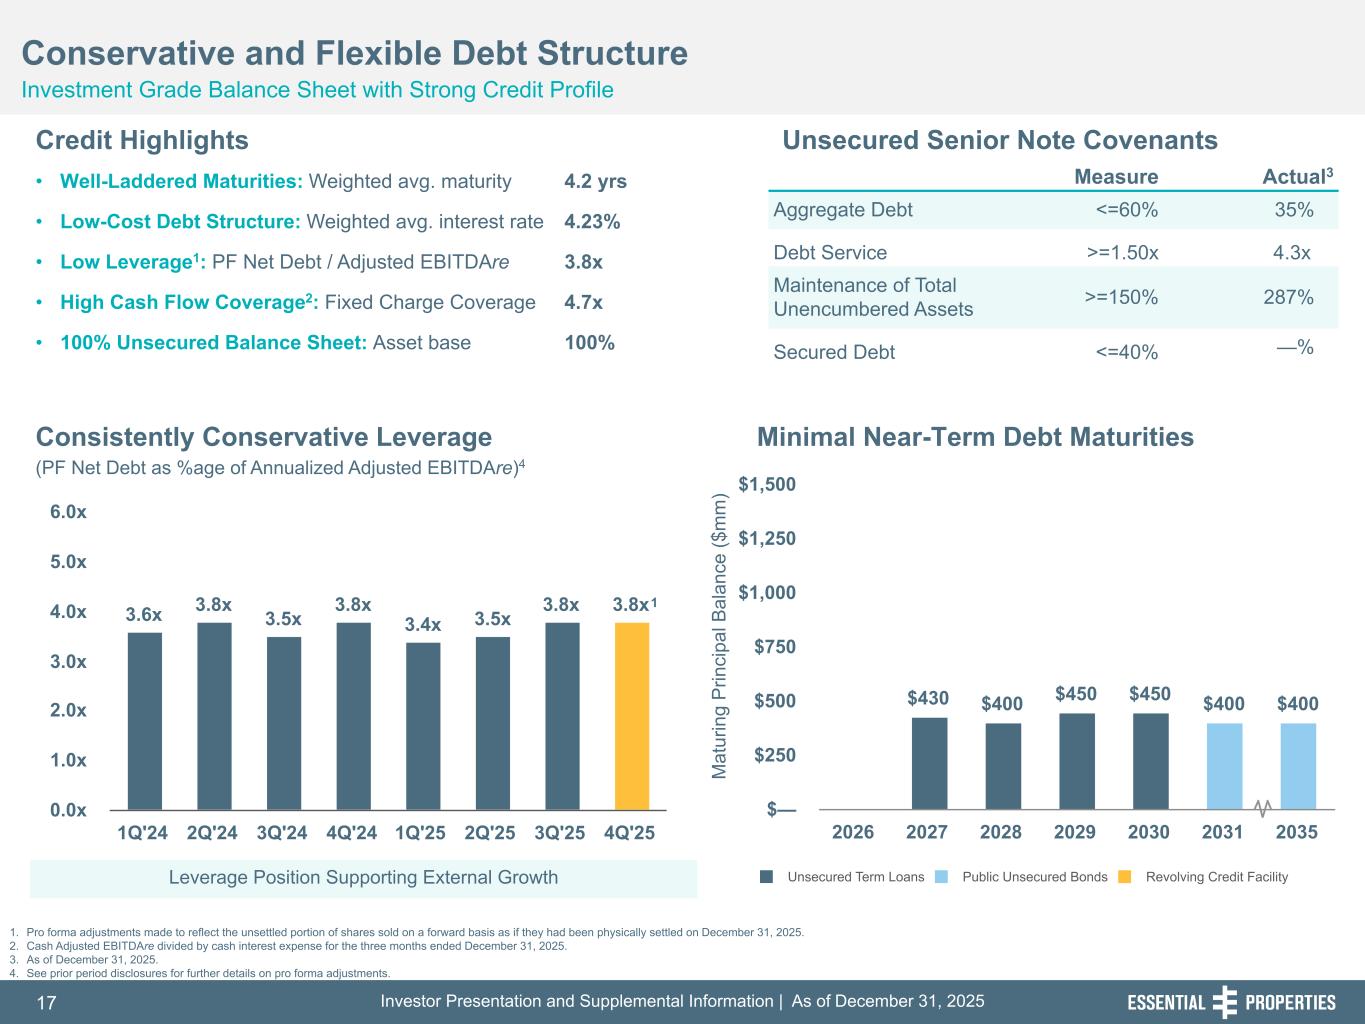
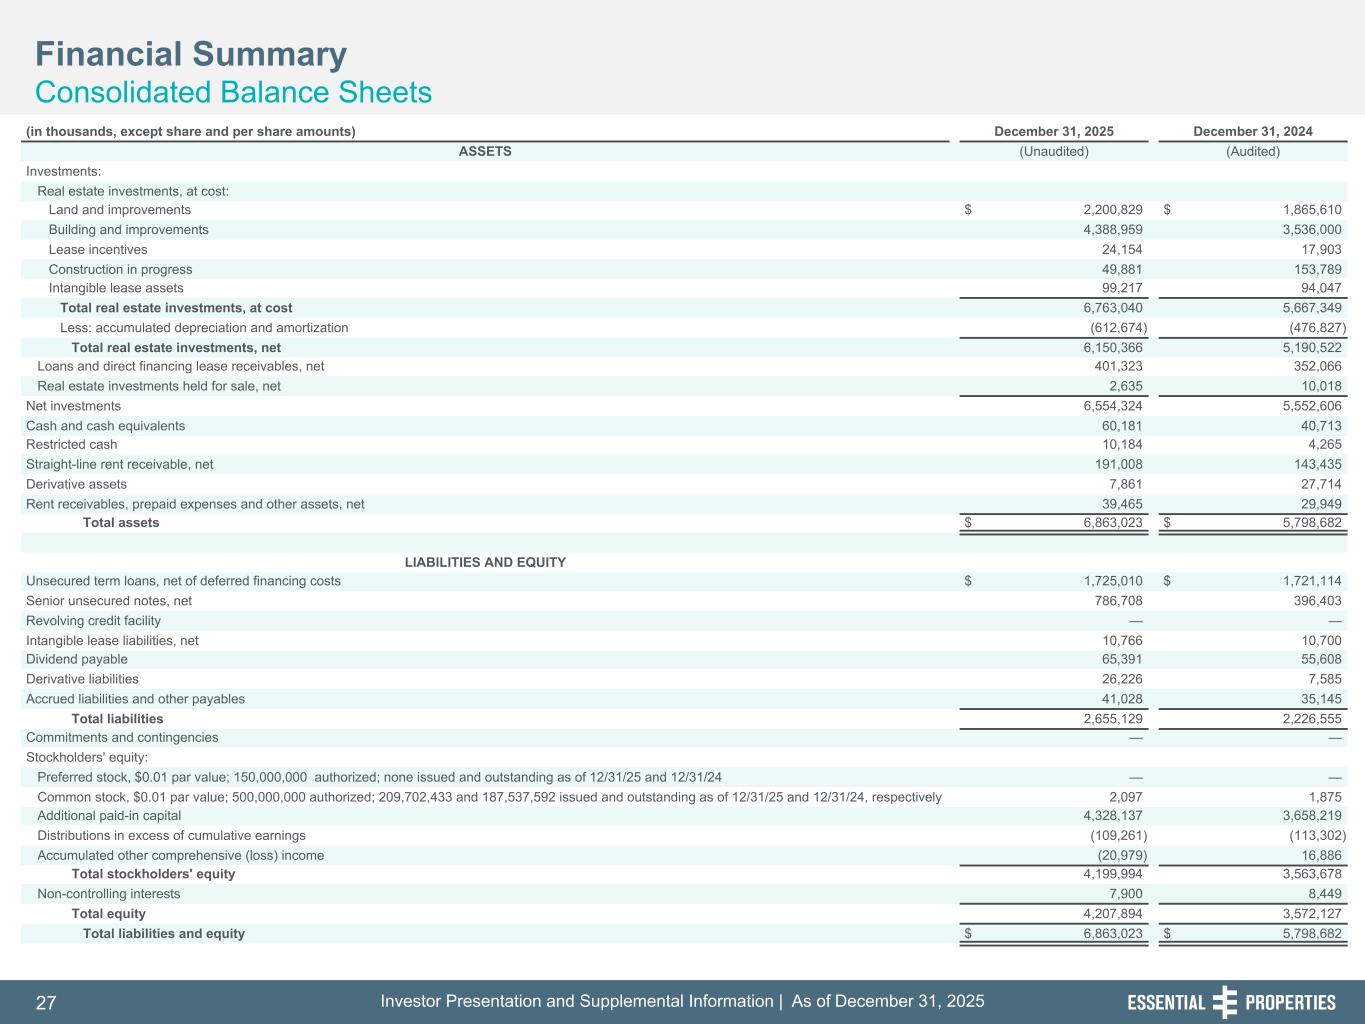
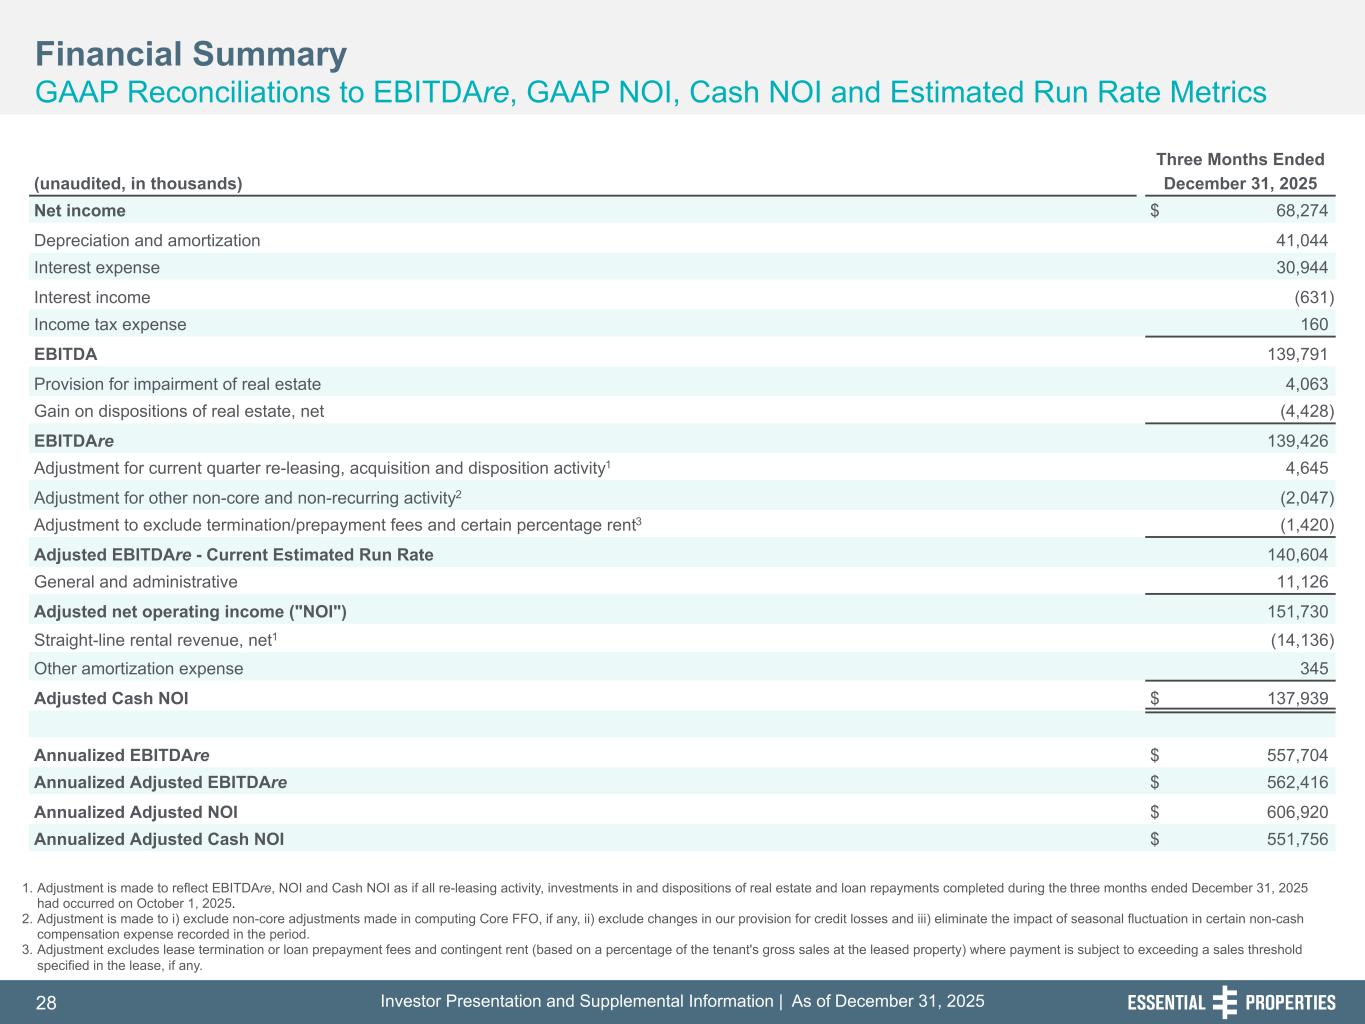
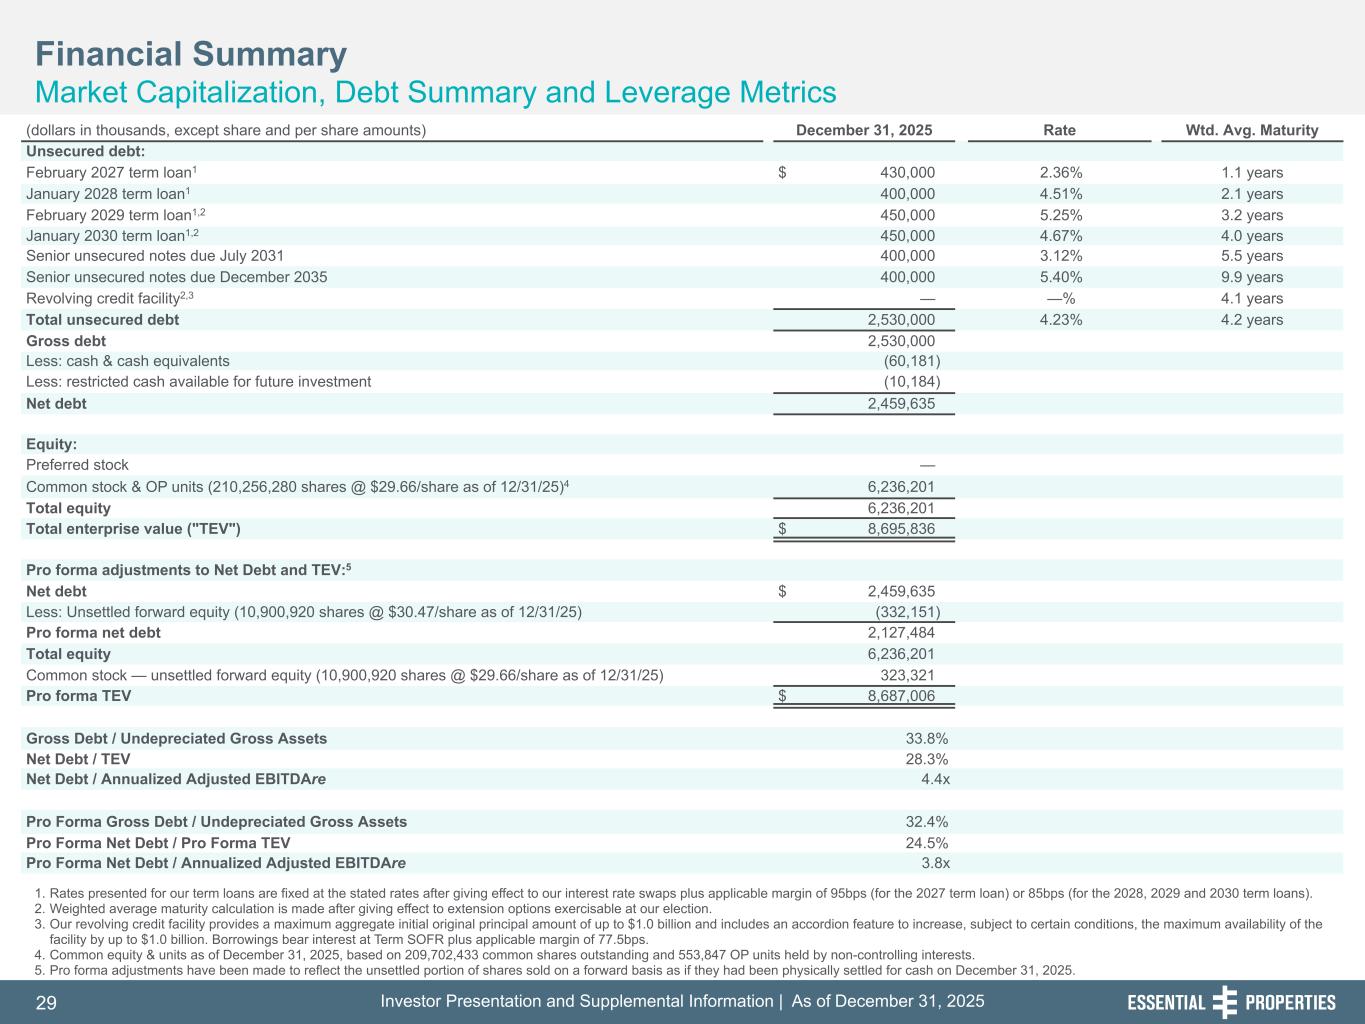
Before I begin my prepared remarks, I would like to thank the Board of Directors for the exciting opportunity to lead the company's finance group alongside my partner, the company's Chief Accounting Officer, Tim Earnshaw. As Pete mentioned earlier, our well-established platform is in a great position to deliver shareholder value, with the largest net investment spread in the industry today. And half of our value creation comes from optimizing our cost of capital, which is something my team has been and will continue to be laser-focused on over the coming years, in service to our focus on shareholder value creation over the long term. Turning to the fourth quarter results, our AFFO per share totaled $0.49, which represents an increase of 9% versus the fourth quarter of 2024. This performance was consistent with the high end of our expectations, as reflected in our previous guidance range. Total G&A in the quarter was $8.4 million, representing a sequential decline due to a one-time compensation reversal related to an executive departure. Notably, this one-time benefit to net income of $2.4 million is reversed out of our core FFO, AFFO, and cash G&A as a non-core item. For the year 2025, cash GNA was $28.8 million, which ended near the low end of our guidance range and represents just 5.1% of total revenue, down from 5.4% in 2024. We declared a cash dividend of $0.31 in the fourth quarter, which represents an AFO payout ratio of 63%. Our retained free cash flow after dividends continues to build, reaching nearly $40 million in the fourth quarter, representing a substantial source of internally generated capital to support our future growth. Turning to our balance sheet, our income-producing gross assets increased to over a seven billion dollars at quarter end. The increasing scale and diversity of our portfolio continues to build, enhancing our credit profile. On the capital markets front, we were made active on our ATM program in the quarter, completing the sale of approximately 170 million of equity, all on a forward basis. We settled $359 million of forward equity in the fourth quarter, with a portion of the proceeds utilized to repay our revolving credit facility balance. Our balance of unsettled forward equity totaled $332 million at quarter end. We expect to utilize these funds in the near term to support our investment program and retain balance sheet flexibility by keeping capacity available on our revolver. Our pro-forma net debt to annualized adjusted EBITDA RE remained low at 3.8 times a quarter We remain committed to maintaining a well-capitalized and conservative balance sheet with low leverage and significant liquidity to continue to fuel our external growth. Lastly, as we noted earlier, we have increased our 2026 AFO per share guidance to a new range of $1.99 to $2.04, reflecting a growth rate of approximately 7% at the midpoint and 8% at the high end. With that, I'll turn the call back over to Pete.
Thanks, Rob, and congratulations on your promotion to CFO. I've appreciated your partnership over the last two and a half years, and we're all grateful for your leadership in the finance group and across the broader organization. In summary, we're happy with the fourth quarter and full-year results. The portfolio is performing well. The investment market remains compelling, and the capital markets continue to be supportive. Operator, please open the call for questions.
Operator
Thank you, Mr. Mavoides. Ladies and gentlemen, at this time, if you do have any questions, please press star 1 at this time. If you find your question has been addressed, you may remove yourself from the queue by pressing star 2. Once again, that is star 1 for questions. We go first this morning to Michael Goldsmith of UBS. Michael, please go ahead.
Good morning, thanks a lot for taking my questions. Rob, you took the guidance range slightly higher at the bottom and so can you just walk through what has changed over the, you know, month or so since you or since the third quarter, I guess, since you put out your initial guidance and how that has impacted the outlook for this year?
Hey, good morning, Michael. Thanks for the question. So, you know, as we've talked about in prior years, it's still really early in the year to do a whole lot of changes with our guidance range, just given we've still got ten and a half months to go. That being said, as we updated all of our numbers and reviewed our portfolio credit trends, everything had been coming in a lot better on the portfolio credit side relative to our initial guidance back in October. We tend to be pretty conservative when we build that initial range. And so as a result, we're just feeling a lot better about the health of the portfolio. I think you saw some of the stats in the fourth quarter of the same-store rent growth of 1.6%. Credit watch list is down sequentially. So it was really in recognition of that. You saw the subsequent events that we have a lot of acquisitions that we closed in the early part of this year, but it's still early in the year. And so it felt appropriate to take the bottom end of the prior range off the table, just given where portfolio credit is. But we'll see how the rest of the year develops in terms of the pipeline and deployment.
Thanks for that. And just quickly, you know, the initial remarks mentioned that the expected competition or you're seeing competition stabilize. So does that, what is the impact of that? Do you see cap rates stabilizing from here? And then like, I guess, also, does that mean that you would be willing to, you know, I I guess with a stabilizing cap rates or less competition, you could also go with the safer tenant base. And so just trying to understand, like, what are the implications of that stabilizing competition comment made at the opening of the call?
Yeah, Michael, this is Pete. I would say I certainly reject your premise that we're going with a safer tenant base. We feel pretty good comfort in our tenant base and the guys we're investing with and the risk-adjusted returns we're getting. and we think the durability of the portfolio has certainly proven that out. But you're right. I think the stabilization in competition has really resulted in, you know, a slower decrease in cap rate than we have anticipated. You know, certainly we model some conservatism into our future cap rates, particularly as the 10-year comes in and capital markets stabilize. And, you know, as we indicated on the call, we're seeing cap rates kind of stable, which is great for us. And, you know, I think that's certainly going to help drive earnings, but it's not going to change the way we invest or how we think about risk.
Thank you very much. Good luck in 2020.
Operator
We go next now to Greg McGinnis at Deutsche Bank.
Hey, this is Greg McGinnis at Scotiabank, still. You've had a busy beginning to the year. Should we not be reading anything into that? is that you know holdovers from Q4 that fell into the early part of this year I mean you know at this trend you're well over one and a half billion for the year and above the guidance range I know you're telling us not to not to necessarily read too much into that but this is a pretty strong start so far so just kind of curious what what the driver was to date on some of those transactions yeah and again I think if we saw something different and in our investment expectations, we would have bumped the guidance range, and to where Rob's coming earlier, certainly early in the year, you know, the fourth quarter was kind of a little light relative to our trailing average, and so there's certainly some deal slippage that
you would see. And so, you know, we feel great. We feel good that have a good start to year, but, you know, a lot of year left to play. I think more encouraging driving, you know, earnings is just the stabilization and the cap rate.
And just to dig into that a little bit more, are you seeing a stabilization and cap rate across all the industries that you tend to invest in? Or are there certain industries that are deviating from that norm? And on top of that, is there anything that you're kind of particularly looking to increase acquisitions in from an industry perspective?
Yeah, you know, I think it's stabilization across the entire industry set that we invest in. Obviously, there's a range of cap rates across our industry from a low of 7 to a high of, you know, call it 8.5, depending on the specific industry. But there's good stabilization there, and I think that speaks to the broader capital markets. In terms of our targeted growth, you know, we're really following our relationships. which mirror our portfolio, you know, with 85%-plus relationship business, we're going to go where our relationship take us and where our reliability as a counterparty is rewarded. So I wouldn't expect a material shift in the portfolio composition as we think about, you know, 2026. Great, thank you.
Operator
Thank you. We go next now to Caitlin Burroughs at Goldman Sachs.
Hi. Good morning, everyone. I guess maybe just on portfolio credit, the prepared remarks mentioned that you guys are feeling good on that topic right now. You also mentioned that American Signature was the only credit event in 4Q. Could you give us any detail on how that played out versus your expectation and what that can kind of tell us about your process and your visibility?
Yeah. You know, I would start by that's still playing out. And, you know, I think it certainly will come in within our expectations as we tend to be conservative, but A.J., you want to tackle that?
Hey, Caitlin. As Pete had mentioned, that bankruptcy happened late in Q4, and so we're early in the process of marketing the asset. I do believe, based on what we're seeing in the marketplace, that it's going to be a normal outcome for us, and the recovery should be well within the range of which we historically have disclosed. I wouldn't expect that asset to be on our balance sheet, and it's vacant for too long.
Okay. Got it. And then, Rob, you mentioned how EPRT generates, I think it was $40 million of free cash flow now. So how do you think about or balance retaining more cash versus increasing the dividend? Would you expect dividend to grow in line with ASFO per share from here, more or less?
Yeah. Thanks, Caitlin. So as you point out, the retained free cash flow is certainly a great source of internally generated capital for our very accretive investment program. I think it's going to be a board decision as to where the dividend goes over time. But from a broad standpoint, you know, it's certainly a balance between delivering current return to shareholders and retaining that capital. I think a reasonable expectation would be that our dividend payout ratio probably doesn't go down from here at 63%. And, you know, we seek to have a good balance between those two things.
And as you know, having followed the REIT space for a long time, dividends are an important part of total shareholder return, and we certainly recognize that so I would expect the dividend to grow but don't have a lot of guidance for you at this point thanks thank you with the next now to Janet gallon at Bank of America thank you good morning um you know just good to hear about that you're seeing this cap rate stabilization and just wanted to ask about your comment where you're saying you may see modest cap rate compression in the back half of the year and then also curious on if there's anything else within the kind of sale-leasebacks you're discussing with your relationships in terms of term or escalators or other type of changes?
Yeah, I think, you know, we've been expecting a normalization in the capital markets, you know, a slight decline in the 10-year and an increase in competition to drive cap rates We've been expecting that for quite some time now. And, you know, as we said today, we just really haven't experienced it in a material way, which is great. But we continue to have some conservatism around those factors as we think about the business plan going forward. And as we said, that, you know, shades from a high sevens to a mid sevens sort of cap rate in our expectations. But, you know, obviously where the market goes and capital markets in the 10-year will ultimately drive that. But, you know, competition drives cap rate. It also drives the other terms that you refer to, Yana, like term and escalations. These are all sensitive terms to tenants, and they're also a key part of our economics, and you can see those kind of ebb and flow over time. I would expect, you know, some compression in our weighted average escalations. You know, certainly, you know, when we were seeing 2.2%, 2.3%, that's, you know, kind of pretty high relative to historical averages and, you know, with the historical average kind of being 1.6-ish. So we're seeing some, you know, talent with pressure there, but, again, nothing material.
Operator
We'll go next now to Eric Borden at BMO Capital Markets.
Pete, I just want to go back to your comments around the stabilization and competition. You know, in your view, what factors are driving the stabilization and what would need to change for the competitive intensity to increase from here?
You know, I think it's really driven by the access to debt capital, which is, you know, going to be driven by the cost of that capital and the availability of that capital. And ultimately, you know, that's pricing, you know, these elongated assets and that people tend to finance in the ABS market. And so I think a large driver, that's going to be the 10-year Treasury rate. So as we've said on prior calls, higher for longer on the 10-year is probably a better scenario for us. And certainly, you know, 4-2, 4-3, you know, 4-1 is helping. I think if you saw, you know, mid to high threes on the 10-year, you know, we would see material amount of increase in competition. All that said, you know, we very much, you know, go to market with an investment strategy to avoid – deliberately designed to avoid competition by doing granular deals, follow-on transactions with relationships, leaning into sale leasebacks to deliver capital to operators that have a capital need. And so I think, you know, hopefully we have built ourselves a moat around that competition by transacting in a differentiated, value-added way. And we'll continue to focus on that.
Thank you. And one for Rob. Congrats, by the way. How should we be thinking about the cadence of forward equity issuance this year, you know, as you manage that cushion between, you know, the unsettled shares and acquisitions? And then with the remaining $322 million of unsettled equity, is there any near-term expiration or settlement constraints that we should be aware of?
Thanks for the comments, Eric. Yeah, we don't have anything in the very near term from an expiration standpoint, so that's probably not going to be a consideration. From a funding standpoint, we tend to make an assumption that we fund equity first and then do debt later. However, as we sit here today with 3.8 times leverage at the end of the year and a ton of liquidity, I think as we've mentioned on prior calls, having just reentered the unsecured bond market over this past summer, we're very much focused on the unsecured bond market. But that pricing today is pretty attractive relative to the high seven cap rate that Max mentioned in his prepared remarks on the pipeline right now. So, you know, in the 5.3 to 5.5 territory for a cost of debt, really big spread. So you know, we'll certainly be spending some time focusing on the unsecured bonds over the course of this year. And then, you know, from an equity standpoint, you know, with the leverage capacity that we have right now, we really could go through the entire year without issuing any more equity and hit the midpoint of our acquisition targets. And that's a combination of just starting the year at such a low point, but then we also have, you know, as you mentioned, the preparator marks over $150 million have retained free cash flow after dividends. We tend to do about $100 million a year of dispositions. And, you know, we have lots of forward equity as well. So from a liquidity and a leverage standpoint, we're in a really good spot. And from a modeling standpoint, you know, we would assume that that gets settled in the near term just as a conservative point, but we'll see how everything plays out.
Operator
Thank you. We'll go next now to Smeets Rose at Citi.
Thanks. It's Nick Joseph here with Smeets. Maybe just following up on that, Rob, obviously balance sheet's in a really good position, robust acquisition pipeline and volume thus far in the first quarter. Have you issued any ATM equity or forward ATM equity year to date?
Yeah, we did a little bit earlier in the year. I don't think it's part of our disclosure package, But, you know, there are a few days before we go into the blackout period. So it tends to never really be a huge amount in a particular quarter. But it was about $10 million that we did at the beginning of the year. So extended the runway a little bit. But, again, as we sit here today with such a low leverage point, we just didn't feel like we needed a whole lot.
Got it. And then just on rent coverage, obviously it was flat, sequentially well covered at 3.6 times. But the sub-1 and sub-1.5 buckets moved up a bit. But what drove that, you know, what moved into those buckets?
AJ, what do you got on that? Yeah, so that's a good question. On the sub-1 bucket, it really is within the range of over the previous four quarters where we've been at low as 2.7 and as high as 3.9. So there's a few tenants that are always kind of migrating in and out of that category. More on the one-to-one-and-a-half bucket, over the last few years, you've noted that we've done a lot of development deals. and as those deals come online and are entered into – oftentimes added to a master release, it creates some noise around that coverage. So we had a couple of tenets where we had assets come online, hold the coverage out of the 1.5 to 2 bucket into the 1.1.5. But I think what you'll see over the coming quarters is they ramp, stabilize, and we revert back to our historical norm, where that cohort tends to kind of range between 7% to 11%. So it's more of a timing issue. What I would say to add to that is it's a data point, But what you would really see if the credit was starting to erode is our watch list would be increasing. And actually, quarter over quarter, it decreased by about 35 basis points. And to refresh you, the watch list is the intersection of shadow rate of B minus and less than 1.5 times unit level coverage. So that one to one and a half bucket certainly increased, but it tends to be more of a timing issue when assets are coming online out of development than anything else. Thanks, H. Thank you.
Operator
We'll go next now to Rich Hightower with Barclays.
Good morning, guys. So I want to go, I guess, back to the transaction environment. I'm just curious, you know, as we've kind of seen some hiccups in the broader private credit market, kind of, you know, in different pockets, you know, does that help or hurt your business? Does it create opportunities that didn't previously exist? Does it reduce sponsor-backed deal flow in any way? How do we figure that out for your business?
We really haven't seen an impact over the last couple of years with the advent and proliferation of private credit. I would say those borrowers tend to be of a size and a scale that's a little larger than we're focusing on and not generally in our industries. You know, certainly, you know, we're real estate investors and we're senior and, you know, our leases are in front of unsecured debt, but it really hasn't driven incremental investment opportunities. And, you know, to the extent that it dries up, I don't think it's going to change our investment market.
Okay, that's helpful. And then you made a point to point out that you did dispose of a little more of your car wash exposure last quarter, and I would probably expect that to continue again. you know, based on some of the tax law particulars that kicked in on Jan 1. So where do you see that exposure ticking down to over time? What's sort of a longer-term target there?
Yeah, I wouldn't create the expectation that's going down materially. You know, we've always operated with a soft ceiling of 15% for any one industry. Car wash has been a great industry from a risk-adjusted return for us perspective, you know, So I wouldn't expect it to, you know, we're not driving that down to 10%. And, you know, to the extent that we find compelling risk-adjusted opportunities in that sector, we can continue to grow it. So, you know, we'll just have to see what the market brings.
Operator
Got it. We'll go next now to Handel St. Juist with Mizuho.
Hi there. This is Ravi Vazia on the line for Handel. Hope you guys are doing well. Can you please describe the impact of the one big, beautiful bill on the single-tenant transaction market? How do you think that's going to impact broader industry pricing and volumes? And how are you guys seeing it within the sandbox that you're operating in going forward?
Did Handel write that question for you?
I sent it to him. Come on. He approved it. Listen, you know, the bonus depreciation that we mentioned earlier certainly had an impact. You know, I don't think that bill really is going to have a material impact on our business or the way we operate. And so I really don't see anything material coming out of that that will.
Is it creating maybe more liquidity in transaction markets? Are there buyers that are looking to take advantage of maybe bonus depreciation or anything like that? that is leading to moves in cap rates? Not materially.
I mean, as A.J. mentioned in his remarks, we were able to sell some car washes to tax-motivated buyers at the margin, but that's, you know, it's really at the margin and not a driver of our industry.
Operator
We'll go next now to John Kielachowski at Wells Fargo.
Thank you. Good morning. And I'd like to start by saying that Cheryl did a great job with opening remarks, and Rob, congrats on the new role. My first one is for you, Pete. You know, we've talked about the competitive landscape a lot on this call, but I guess I'm curious, who are the entrants that maybe you thought you'd be seeing that you aren't seeing right now?
You know, it's – I don't want to name specifics, you know, because we just don't know. You see platforms stand up. You see, you know, capital commitments to those platforms, whether it's, you know, Apollo, TPG, Angela Gordon, Blackstone. You go down the list of big asset managers, and you're just conservative about their ability around your assumptions of driving your business and their ability to, you know, take business away from you. And, you know, we fight hard to win deals. We fight hard to add value to our counterparties such that they choose to do business with us. And, you know, we protect our relationship. So, you know, there's a bunch of new platforms out there. You saw Starwood border platform. You know, it's just broad-based.
Got it. And then my second one is just given the current macro environment, how is that affecting the way you're underwriting or influencing sectors you might be pivoting more towards or away from?
Yeah, you know, as I mentioned earlier, with 85% repeat business, our relationships really drive our opportunity set, and, you know, starting this platform, you know, 10 years ago, we had a very focused service and experience base, at least back middle market model, and we're really sticking to that, and, you know, current trends in the market really hasn't shifted that materially one way or the other. Thank you. Thank you, John.
Operator
We'll go next now to Ryan Caviola with Green Street Advisors.
Good morning, everyone. It looks like the average investment per unit was record high for this quarter. I know you mentioned still close to historical norms, but could you share any details there? Was that simply a function of acquisition mix or is there a slight appetite to purchase larger asset classes going forward? What led to that?
Yeah, it's really going to be transaction mix and industry mix. You know, some of our sectors like early childhood education, our industrial outdoor storage sites and service sites tend to have a higher price point than, you know, our QSR sites or our casual dining sites. And so it's not a material move, and it really isn't indicative of our change in our underwriting or our risk appetite for larger assets. It's more just industry mix in that quarter.
Got it. Appreciate it. And then just a quick one. Could you remind us of the tenant credit assumptions included in the 2026 guide and just any, you know, color on if there's industries specific in there or if it's broad-based, anything you can share on tenant credit.
Yeah. So, we don't guide to tenant credit losses. You know, we guide to AFFO growth and investments. I would say we take a very sharp pencil to our credit assumptions, really looking at specific situations and properties where we may have a credit event that results in a loss in ABR, and that tends to be around our historical average and our norm. And then we make a generic assumption for unknown events that may come at us, and we We run a range of scenarios through the credit laws that support our guidance. So with a historical credit loss of 30 basis points, you can probably assume we're a little more conservative than that, but there's a wide range of scenarios underlying guidance.
Great. Appreciate the caller.
Operator
Thank you. We'll go next now to Jay Kornreich with Cantor Fitzgerald.
All right. Thanks so much. I guess just following up in your comments about sticking to your relationships, which make up 85% of business, how do you assess kind of that balance between growing with current partners and forming new ones? You know, really the point is, does the 85% provide enough runway for investment and earnings growth for multiple years into the future that you don't need to rely on new relationships?
Yeah, listen, as I said in the past, we like to kind of be a 75-25 ideally, and we spend a lot of effort and make a lot of investments to source and develop and build new relationships that we can grow with over time because we certainly see relationships grow out of us as they get bigger and establish, you know, access to more alternative forms of capital. So it's a balance, and, you know, I think we've done a good job of balancing that, and we have an ample pipeline of opportunities, and I think we've demonstrated, you know, great ability to continue to deploy capital.
And I guess just following up on that, you know, the strong sourcing and ample opportunities, You know, you also referenced, you know, some deal slippage in the fourth quarter. So I guess just wondering about the overall investment pipeline outlook. You know, if your cost of capital were to improve throughout the year, you know, do you feel like there's ample opportunity to expand the investment volume, or is it a little bit more constrained as the outlook may have it?
As we always say, you know, the opportunity set isn't what's driving our investment volume. our desire to create compelling growth for shareholders is what drives it. And what we believe to be compelling is, you know, our current guidance, both in terms of AFFO per share with growth of, you know, called 6% to 8%, supported by investments of, you know, conservative investments of, you know, a billion to a billion four, which is, you know, frankly, at the midpoint down from what we did last year. So the opportunity set is not a constraint of ours. You know, really our appetite and our desire to create stable growth over a prolonged period of time is what's driving that.
Understood. Thanks very much. Thank you.
Operator
And, ladies and gentlemen, just a quick reminder, star one, please, for questions today. We'll go next now to Dan Guglielmo with Capital One Securities.
Hi, everyone. Thank you for taking my questions. I know based on our conversation at REIT World that you all are focused on same-store metrics for your tenants. Have there been any diverging trends in kind of same-store between tenant types or any changes that you've noticed this year versus flat?
Yeah, well, same-store ABR and same-store rent is really driven by the contracts and the leases that we have, and, you know, that can vary from, you know, low of 1.5 to a high of 2.3. and that really more depends upon what we negotiate going into those deals and when we negotiated those deals than anything on an industry-specific basis. In terms of, you know, same-store improvement in sales and margin and EBITDA, you know, that's something we track across all our industries and all our tenants. And, you know, there's a lot of ebbs and flows in each sector and each specific operator. I would say most of those ebbs and flows are idiosyncratic around the operator and less around the industry. But then there's nothing really I would call really changing in that. Okay, great. Appreciate that color. And then I would make a point on that. And, you know, with public comps in most of our industries, whether it be Mr. Car Wash and Car Wash or some of the restaurant operators or kinder care and child care, you know, investors can look at those public comps and get a general read through about what's going on in the overall industries that we invest. And, you know, there tends to be a very strong correlation between those public comps and and their performance and what's going on in our portfolio.
Yeah, that's very helpful. And then as a follow-up from one earlier, thinking about the size of the company with the kind of mid to high single-digit growth each year, is there a certain size down the road where it gets harder to source the right deals at kind of the volumes needed? And when you think about that, how far out is that?
Yeah, I wouldn't put a number on that. I think we have, you know, five to ten years of solid performance and opportunity in front of us to continue to grow our relationships and our investable universe and our portfolio and generate that sort of growth. You know, as you get bigger, you've got to do more. And, you know, I think we continue to invest in the team and the infrastructure to do that. But I think this company has great runway without really too much concern around that, particularly because, as we've done, you know, not growing too fast, right, and then, you know, growing moderately at a very measured pace over a long period of time has been our ambition, and I think we've got great runway in front of us.
We'll go next now to John Masaka at B. Riley Securities. good morning um we talked about it a little bit last quarter but uh you added again to kind of the other industrial bucket but it seems like the assets had a bit of a different kind of rent and square footage profile per property just kind of curious maybe what those were in terms of acquisitions during the quarter and i guess you know with with a couple subsequent quarters of of you know strong investment in that particular industry sector kind of what do you think is driving that as a growth vehicle in the current market?
Yeah, you know, we just see good opportunities in the industrial outdoor storage space. Those assets tend to be granular, tend to have a large land component. And, you know, the rent per square foot in that space varies wildly depending upon the amount of building prorated over the size of the land. And so, you know, a 10-acre lot with a 20,000-square-foot building is a whole lot different than a 5-acre lot with a 20,000-square-foot building. And so we see good opportunities there with middle market operators, and, you know, it's not growing at an outsized pace. And we'll continue to invest there, and we certainly like that space.
But the assets that were kind of acquired in the quarter were those kind of industrial outdoor storage type properties?
And then, you know, you may have mentioned before, so apologies, but given the size of the subsequent to kind of quarter investment volume and maybe kind of characterization of that being a little bit of a, you know, transactions that maybe slipped from a 4Q closing, What was kind of the rough timing on that as we're thinking about modeling? Was it a little bit front and loaded in the year, or was it kind of spread out over the quarter to date? January 21st, John. I need an hour, Pete.
I'm just kidding, Rob. You got a response to that?
I, you know, we're a month and a half, almost a month and a half into the year. I would just assume the middle of January is probably a reasonable ballpark estimate.
Okay. I appreciate that. That's it for me.
Operator
Thank you. We are Mr. Mavoides. I'll turn it back to you, sir, for any closing comments.
Well, thank you all. We look forward to seeing you all. I know Citi's conference is right around the corner, and we'll have a very active calendar down there. And stay warm.
Operator
We'll talk to you soon. thank you ladies and gentlemen again that will conclude the essential properties really trust fourth quarter earnings conference call again thanks so much for joining us everyone we wish you all a great day goodbye